Cities with the Highest Percentage of Population Employed in Food Preparation & Serving in Florida
RELATED REPORTS & OPTIONS
Food Preparation & Serving
Florida
Compare Cities
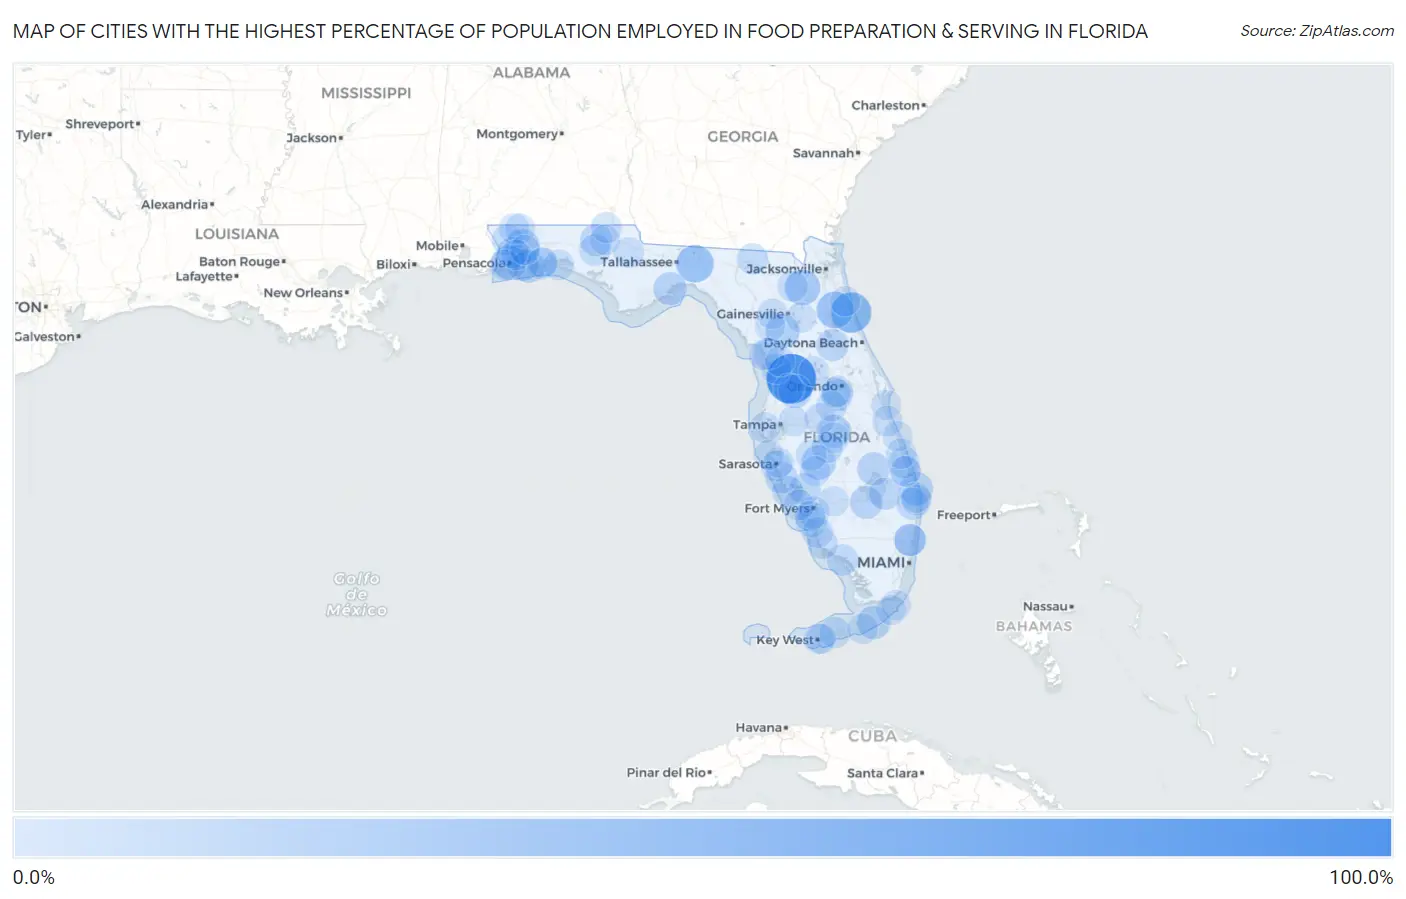
Map of Cities with the Highest Percentage of Population Employed in Food Preparation & Serving in Florida
0.0%
100.0%
Cities with the Highest Percentage of Population Employed in Food Preparation & Serving in Florida
| City | % Employed | vs State | vs National | |
| 1. | Nobleton | 100.0% | 6.1%(+93.9)#1 | 5.3%(+94.7)#1 |
| 2. | Marineland | 57.1% | 6.1%(+51.1)#2 | 5.3%(+51.9)#82 |
| 3. | Waukeenah | 43.4% | 6.1%(+37.3)#3 | 5.3%(+38.1)#156 |
| 4. | Hastings | 41.1% | 6.1%(+35.0)#4 | 5.3%(+35.9)#179 |
| 5. | Heritage Bay | 36.7% | 6.1%(+30.6)#5 | 5.3%(+31.4)#227 |
| 6. | Lawtey | 34.6% | 6.1%(+28.5)#6 | 5.3%(+29.3)#260 |
| 7. | Roeville | 30.0% | 6.1%(+23.9)#7 | 5.3%(+24.8)#342 |
| 8. | Whitfield Cdp Santa Rosa County | 29.9% | 6.1%(+23.8)#8 | 5.3%(+24.6)#350 |
| 9. | Gardner | 29.7% | 6.1%(+23.6)#9 | 5.3%(+24.4)#355 |
| 10. | Goulding | 29.1% | 6.1%(+23.0)#10 | 5.3%(+23.8)#371 |
| 11. | East Williston | 28.3% | 6.1%(+22.2)#11 | 5.3%(+23.0)#392 |
| 12. | Jupiter Inlet Colony | 26.1% | 6.1%(+20.0)#12 | 5.3%(+20.8)#464 |
| 13. | Layton | 26.0% | 6.1%(+19.9)#13 | 5.3%(+20.7)#470 |
| 14. | Trilby | 25.4% | 6.1%(+19.3)#14 | 5.3%(+20.2)#488 |
| 15. | Panacea | 24.5% | 6.1%(+18.5)#15 | 5.3%(+19.3)#524 |
| 16. | Babson Park | 24.4% | 6.1%(+18.3)#16 | 5.3%(+19.1)#528 |
| 17. | Navarre Beach | 24.2% | 6.1%(+18.1)#17 | 5.3%(+18.9)#543 |
| 18. | Cypress Quarters | 23.9% | 6.1%(+17.8)#18 | 5.3%(+18.6)#557 |
| 19. | Harlem | 23.1% | 6.1%(+17.0)#19 | 5.3%(+17.8)#607 |
| 20. | Astor | 20.9% | 6.1%(+14.8)#20 | 5.3%(+15.6)#742 |
| 21. | Woodlawn Beach | 20.6% | 6.1%(+14.5)#21 | 5.3%(+15.3)#773 |
| 22. | Bonifay | 20.5% | 6.1%(+14.4)#22 | 5.3%(+15.2)#785 |
| 23. | Canal Point | 20.3% | 6.1%(+14.2)#23 | 5.3%(+15.1)#800 |
| 24. | Nokomis | 20.1% | 6.1%(+14.0)#24 | 5.3%(+14.8)#826 |
| 25. | Franklin Park | 19.7% | 6.1%(+13.6)#25 | 5.3%(+14.5)#869 |
| 26. | Stacey Street | 19.5% | 6.1%(+13.4)#26 | 5.3%(+14.2)#890 |
| 27. | Pine Manor | 19.4% | 6.1%(+13.3)#27 | 5.3%(+14.1)#905 |
| 28. | Washington Park | 18.8% | 6.1%(+12.7)#28 | 5.3%(+13.5)#965 |
| 29. | Solana | 18.7% | 6.1%(+12.6)#29 | 5.3%(+13.4)#979 |
| 30. | Inglis | 18.3% | 6.1%(+12.3)#30 | 5.3%(+13.1)#1,023 |
| 31. | Vernon | 18.1% | 6.1%(+12.1)#31 | 5.3%(+12.9)#1,050 |
| 32. | Fort Myers Beach | 18.0% | 6.1%(+12.0)#32 | 5.3%(+12.8)#1,059 |
| 33. | Pensacola Station | 17.6% | 6.1%(+11.5)#33 | 5.3%(+12.3)#1,114 |
| 34. | Chokoloskee | 17.4% | 6.1%(+11.3)#34 | 5.3%(+12.1)#1,144 |
| 35. | Mary Esther | 17.2% | 6.1%(+11.1)#35 | 5.3%(+11.9)#1,178 |
| 36. | Chumuckla | 16.6% | 6.1%(+10.5)#36 | 5.3%(+11.3)#1,283 |
| 37. | Florida Gulf Coast University | 16.4% | 6.1%(+10.3)#37 | 5.3%(+11.1)#1,317 |
| 38. | Grove City | 16.2% | 6.1%(+10.1)#38 | 5.3%(+11.0)#1,345 |
| 39. | Floridatown | 16.1% | 6.1%(+10.0)#39 | 5.3%(+10.8)#1,379 |
| 40. | Williamsburg | 15.9% | 6.1%(+9.84)#40 | 5.3%(+10.6)#1,416 |
| 41. | Frostproof | 15.9% | 6.1%(+9.81)#41 | 5.3%(+10.6)#1,428 |
| 42. | Indian River Estates | 15.9% | 6.1%(+9.76)#42 | 5.3%(+10.6)#1,436 |
| 43. | Tangelo Park | 15.6% | 6.1%(+9.54)#43 | 5.3%(+10.3)#1,484 |
| 44. | Jasper | 15.5% | 6.1%(+9.43)#44 | 5.3%(+10.2)#1,502 |
| 45. | Old Miakka | 15.3% | 6.1%(+9.21)#45 | 5.3%(+10.0)#1,555 |
| 46. | Cudjoe Key | 15.2% | 6.1%(+9.13)#46 | 5.3%(+9.94)#1,572 |
| 47. | Lemon Grove | 15.0% | 6.1%(+8.89)#47 | 5.3%(+9.70)#1,637 |
| 48. | Warrington | 15.0% | 6.1%(+8.89)#48 | 5.3%(+9.69)#1,640 |
| 49. | Graceville | 15.0% | 6.1%(+8.88)#49 | 5.3%(+9.69)#1,642 |
| 50. | Bokeelia | 15.0% | 6.1%(+8.86)#50 | 5.3%(+9.67)#1,651 |
| 51. | Ona | 14.8% | 6.1%(+8.74)#51 | 5.3%(+9.54)#1,679 |
| 52. | Inwood | 14.4% | 6.1%(+8.33)#52 | 5.3%(+9.14)#1,786 |
| 53. | Lely Resort | 14.4% | 6.1%(+8.31)#53 | 5.3%(+9.12)#1,791 |
| 54. | South Highpoint | 14.3% | 6.1%(+8.16)#54 | 5.3%(+8.97)#1,843 |
| 55. | Loughman | 14.2% | 6.1%(+8.13)#55 | 5.3%(+8.94)#1,853 |
| 56. | South Sarasota | 14.1% | 6.1%(+8.04)#56 | 5.3%(+8.84)#1,874 |
| 57. | Naples Park | 14.0% | 6.1%(+7.96)#57 | 5.3%(+8.76)#1,902 |
| 58. | Silver Springs | 14.0% | 6.1%(+7.92)#58 | 5.3%(+8.72)#1,915 |
| 59. | Rio | 13.9% | 6.1%(+7.79)#59 | 5.3%(+8.60)#1,948 |
| 60. | Harlem Heights | 13.8% | 6.1%(+7.71)#60 | 5.3%(+8.52)#1,967 |
| 61. | Raiford | 13.8% | 6.1%(+7.66)#61 | 5.3%(+8.46)#1,985 |
| 62. | Mangonia Park | 13.6% | 6.1%(+7.49)#62 | 5.3%(+8.30)#2,040 |
| 63. | Altha | 13.5% | 6.1%(+7.44)#63 | 5.3%(+8.24)#2,058 |
| 64. | Miramar Beach | 13.4% | 6.1%(+7.29)#64 | 5.3%(+8.09)#2,112 |
| 65. | Homosassa Springs | 13.4% | 6.1%(+7.27)#65 | 5.3%(+8.08)#2,117 |
| 66. | Key West | 13.4% | 6.1%(+7.27)#66 | 5.3%(+8.08)#2,118 |
| 67. | Malabar | 13.3% | 6.1%(+7.20)#67 | 5.3%(+8.01)#2,142 |
| 68. | Key Colony Beach | 13.2% | 6.1%(+7.07)#68 | 5.3%(+7.87)#2,199 |
| 69. | North River Shores | 13.1% | 6.1%(+7.04)#69 | 5.3%(+7.84)#2,209 |
| 70. | St Lucie Village | 13.1% | 6.1%(+6.98)#70 | 5.3%(+7.78)#2,227 |
| 71. | Yankeetown | 12.8% | 6.1%(+6.73)#71 | 5.3%(+7.53)#2,339 |
| 72. | Newberry | 12.8% | 6.1%(+6.69)#72 | 5.3%(+7.49)#2,355 |
| 73. | Jay | 12.8% | 6.1%(+6.68)#73 | 5.3%(+7.49)#2,359 |
| 74. | Pine Ridge Cdp Collier County | 12.7% | 6.1%(+6.64)#74 | 5.3%(+7.44)#2,387 |
| 75. | Chipley | 12.7% | 6.1%(+6.62)#75 | 5.3%(+7.42)#2,400 |
| 76. | Arcadia | 12.7% | 6.1%(+6.60)#76 | 5.3%(+7.41)#2,407 |
| 77. | Lake Kerr | 12.6% | 6.1%(+6.48)#77 | 5.3%(+7.29)#2,456 |
| 78. | Fidelis | 12.5% | 6.1%(+6.41)#78 | 5.3%(+7.21)#2,512 |
| 79. | Dover | 12.4% | 6.1%(+6.32)#79 | 5.3%(+7.12)#2,557 |
| 80. | Spring Lake | 12.4% | 6.1%(+6.31)#80 | 5.3%(+7.11)#2,563 |
| 81. | Avalon | 12.4% | 6.1%(+6.27)#81 | 5.3%(+7.08)#2,580 |
| 82. | Hawthorne | 12.1% | 6.1%(+6.05)#82 | 5.3%(+6.85)#2,679 |
| 83. | Fort Walton Beach | 12.1% | 6.1%(+6.03)#83 | 5.3%(+6.84)#2,686 |
| 84. | Bronson | 12.1% | 6.1%(+6.02)#84 | 5.3%(+6.83)#2,701 |
| 85. | Doctor Phillips | 12.1% | 6.1%(+6.01)#85 | 5.3%(+6.82)#2,704 |
| 86. | Lake Park | 12.1% | 6.1%(+6.00)#86 | 5.3%(+6.80)#2,707 |
| 87. | Wabasso Beach | 12.1% | 6.1%(+5.96)#87 | 5.3%(+6.77)#2,728 |
| 88. | Fort Denaud | 12.0% | 6.1%(+5.95)#88 | 5.3%(+6.75)#2,736 |
| 89. | Kensington Park | 12.0% | 6.1%(+5.94)#89 | 5.3%(+6.74)#2,738 |
| 90. | Berkshire Lakes | 11.9% | 6.1%(+5.86)#90 | 5.3%(+6.66)#2,794 |
| 91. | Patrick Afb | 11.9% | 6.1%(+5.80)#91 | 5.3%(+6.60)#2,830 |
| 92. | Key Largo | 11.9% | 6.1%(+5.79)#92 | 5.3%(+6.59)#2,837 |
| 93. | Beverly Hills | 11.7% | 6.1%(+5.61)#93 | 5.3%(+6.41)#2,944 |
| 94. | Leesburg | 11.7% | 6.1%(+5.61)#94 | 5.3%(+6.41)#2,946 |
| 95. | Tavernier | 11.7% | 6.1%(+5.60)#95 | 5.3%(+6.40)#2,951 |
| 96. | East Milton | 11.6% | 6.1%(+5.55)#96 | 5.3%(+6.35)#2,983 |
| 97. | University Cdp Orange County | 11.6% | 6.1%(+5.54)#97 | 5.3%(+6.35)#2,984 |
| 98. | St Augustine South | 11.6% | 6.1%(+5.52)#98 | 5.3%(+6.32)#3,000 |
| 99. | Stock Island | 11.6% | 6.1%(+5.52)#99 | 5.3%(+6.32)#3,001 |
| 100. | Cortez | 11.5% | 6.1%(+5.44)#100 | 5.3%(+6.24)#3,057 |
Common Questions
What are the Top 10 Cities with the Highest Percentage of Population Employed in Food Preparation & Serving in Florida?
Top 10 Cities with the Highest Percentage of Population Employed in Food Preparation & Serving in Florida are:
#1
100.0%
#2
57.1%
#3
43.4%
#4
41.1%
#5
34.6%
#6
30.0%
#7
29.7%
#8
29.1%
#9
28.3%
#10
26.1%
What city has the Highest Percentage of Population Employed in Food Preparation & Serving in Florida?
Nobleton has the Highest Percentage of Population Employed in Food Preparation & Serving in Florida with 100.0%.
What is the Percentage of Population Employed in Food Preparation & Serving in the State of Florida?
Percentage of Population Employed in Food Preparation & Serving in Florida is 6.1%.
What is the Percentage of Population Employed in Food Preparation & Serving in the United States?
Percentage of Population Employed in Food Preparation & Serving in the United States is 5.3%.