Zip Codes with the Highest Percentage of Population Employed in Food Preparation & Serving in Monterey Park, CA
RELATED REPORTS & OPTIONS
Food Preparation & Serving
Monterey Park
Compare Zip Codes
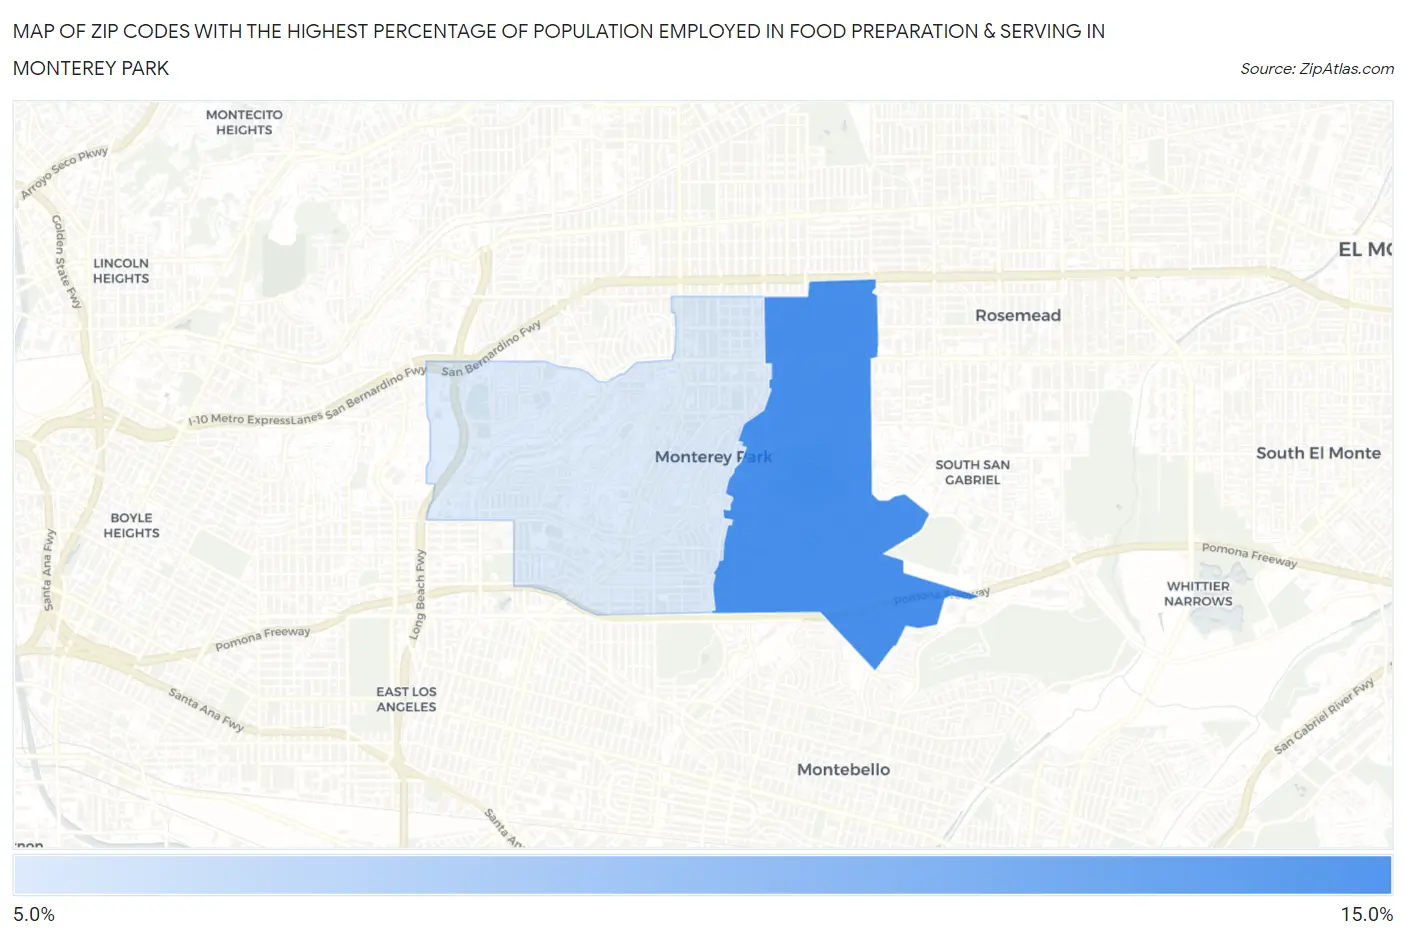
Map of Zip Codes with the Highest Percentage of Population Employed in Food Preparation & Serving in Monterey Park
6.9%
12.6%
Zip Codes with the Highest Percentage of Population Employed in Food Preparation & Serving in Monterey Park, CA
| Zip Code | % Employed | vs State | vs National | |
| 1. | 91755 | 12.6% | 5.4%(+7.22)#73 | 5.3%(+7.31)#1,493 |
| 2. | 91754 | 6.9% | 5.4%(+1.49)#366 | 5.3%(+1.59)#6,882 |
1
Common Questions
What are the Top Zip Codes with the Highest Percentage of Population Employed in Food Preparation & Serving in Monterey Park, CA?
Top Zip Codes with the Highest Percentage of Population Employed in Food Preparation & Serving in Monterey Park, CA are:
What zip code has the Highest Percentage of Population Employed in Food Preparation & Serving in Monterey Park, CA?
91755 has the Highest Percentage of Population Employed in Food Preparation & Serving in Monterey Park, CA with 12.6%.
What is the Percentage of Population Employed in Food Preparation & Serving in Monterey Park, CA?
Percentage of Population Employed in Food Preparation & Serving in Monterey Park is 9.4%.
What is the Percentage of Population Employed in Food Preparation & Serving in California?
Percentage of Population Employed in Food Preparation & Serving in California is 5.4%.
What is the Percentage of Population Employed in Food Preparation & Serving in the United States?
Percentage of Population Employed in Food Preparation & Serving in the United States is 5.3%.