Pescadero, CA Map & Demographics
Pescadero Map
Pescadero Overview
$50,067
PER CAPITA INCOME
0.28
INEQUALITY / GINI INDEX
349
TOTAL POPULATION
120
MALE POPULATION
229
FEMALE POPULATION
52.40
MALES / 100 FEMALES
190.83
FEMALES / 100 MALES
41.3
MEDIAN AGE
2.9
AVG FAMILY SIZE
2.9
AVG HOUSEHOLD SIZE
234
LABOR FORCE [ PEOPLE ]
75.0%
PERCENT IN LABOR FORCE
Pescadero Zip Codes
Pescadero Area Codes
Income in Pescadero
Income Overview in Pescadero
| Characteristic | Number | Measure |
| Per Capita Income | 349 | $50,067 |
| Median Family Income | 107 | $0 |
| Mean Family Income | 107 | $144,167 |
| Median Household Income | 107 | $0 |
| Mean Household Income | 107 | $144,167 |
| Income Deficit | 107 | $0 |
| Wage / Income Gap (%) | 349 | 0.00% |
| Wage / Income Gap ($) | 349 | 100.00¢ per $1 |
| Gini / Inequality Index | 349 | 0.28 |
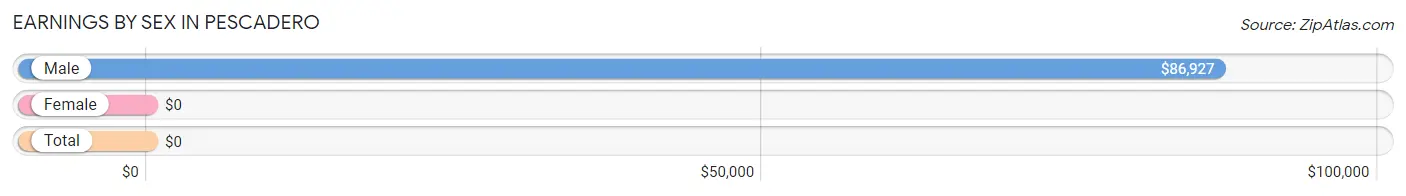
Earnings by Sex in Pescadero
| Sex | Number | Average Earnings |
| Male | 45 (19.2%) | $86,927 |
| Female | 189 (80.8%) | $0 |
| Total | 234 (100.0%) | $0 |
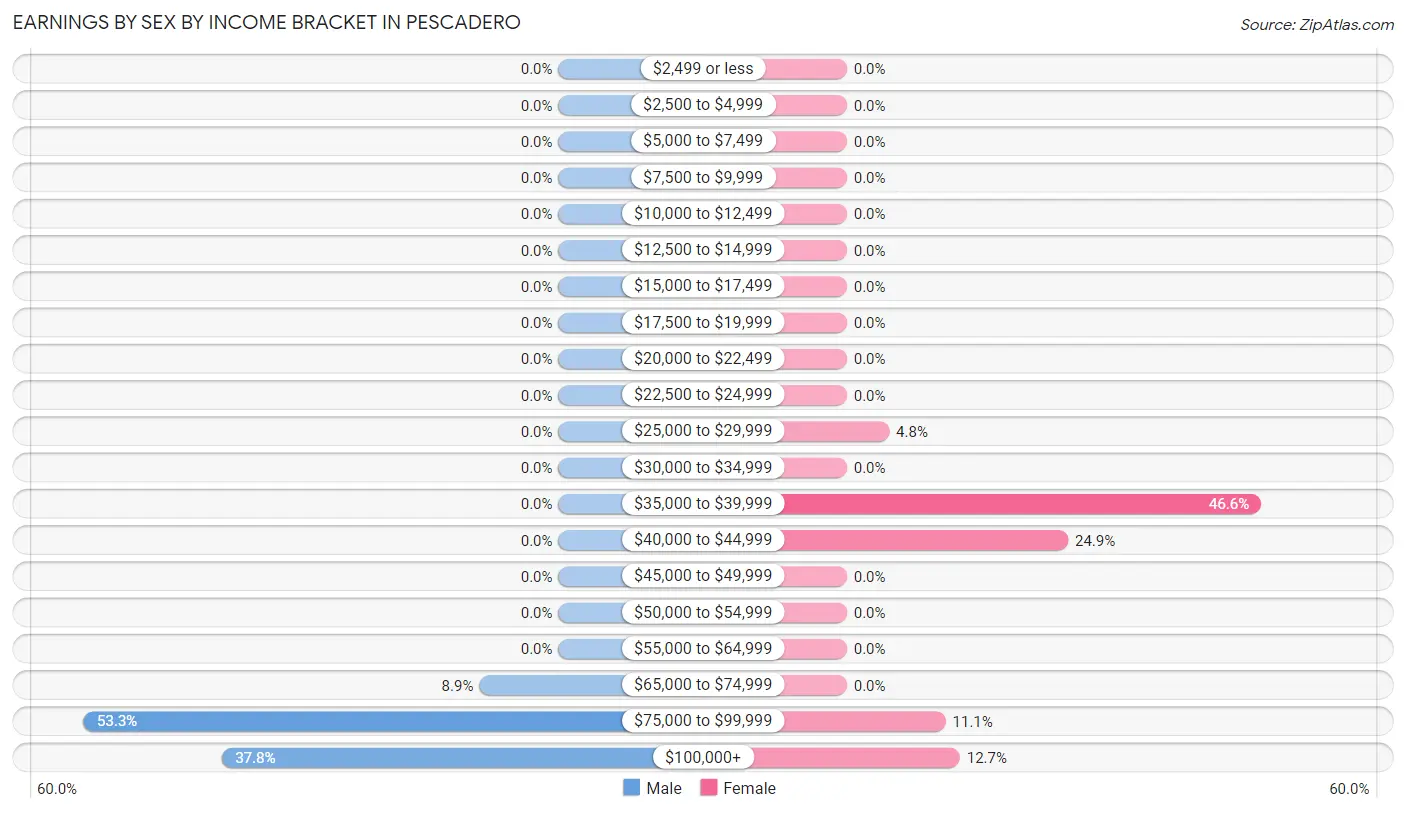
Earnings by Sex by Income Bracket in Pescadero
The most common earnings brackets in Pescadero are $75,000 to $99,999 for men (24 | 53.3%) and $35,000 to $39,999 for women (88 | 46.6%).
| Income | Male | Female |
| $2,499 or less | 0 (0.0%) | 0 (0.0%) |
| $2,500 to $4,999 | 0 (0.0%) | 0 (0.0%) |
| $5,000 to $7,499 | 0 (0.0%) | 0 (0.0%) |
| $7,500 to $9,999 | 0 (0.0%) | 0 (0.0%) |
| $10,000 to $12,499 | 0 (0.0%) | 0 (0.0%) |
| $12,500 to $14,999 | 0 (0.0%) | 0 (0.0%) |
| $15,000 to $17,499 | 0 (0.0%) | 0 (0.0%) |
| $17,500 to $19,999 | 0 (0.0%) | 0 (0.0%) |
| $20,000 to $22,499 | 0 (0.0%) | 0 (0.0%) |
| $22,500 to $24,999 | 0 (0.0%) | 0 (0.0%) |
| $25,000 to $29,999 | 0 (0.0%) | 9 (4.8%) |
| $30,000 to $34,999 | 0 (0.0%) | 0 (0.0%) |
| $35,000 to $39,999 | 0 (0.0%) | 88 (46.6%) |
| $40,000 to $44,999 | 0 (0.0%) | 47 (24.9%) |
| $45,000 to $49,999 | 0 (0.0%) | 0 (0.0%) |
| $50,000 to $54,999 | 0 (0.0%) | 0 (0.0%) |
| $55,000 to $64,999 | 0 (0.0%) | 0 (0.0%) |
| $65,000 to $74,999 | 4 (8.9%) | 0 (0.0%) |
| $75,000 to $99,999 | 24 (53.3%) | 21 (11.1%) |
| $100,000+ | 17 (37.8%) | 24 (12.7%) |
| Total | 45 (100.0%) | 189 (100.0%) |
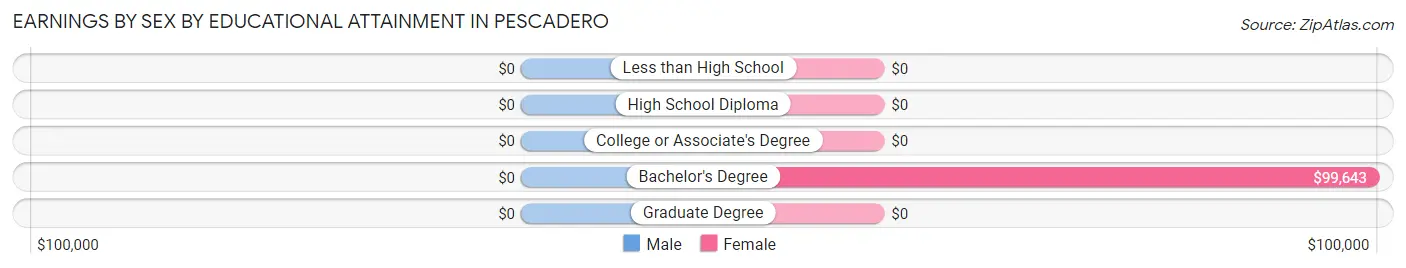
Earnings by Sex by Educational Attainment in Pescadero
| Educational Attainment | Male Income | Female Income |
| Less than High School | - | - |
| High School Diploma | - | - |
| College or Associate's Degree | - | - |
| Bachelor's Degree | - | - |
| Graduate Degree | - | - |
| Total | $86,927 | $0 |
Family Income in Pescadero
Family Income Brackets in Pescadero
According to the Pescadero family income data, there are 56 families falling into the $75,000 to $99,999 income range, which is the most common income bracket and makes up 52.3% of all families.
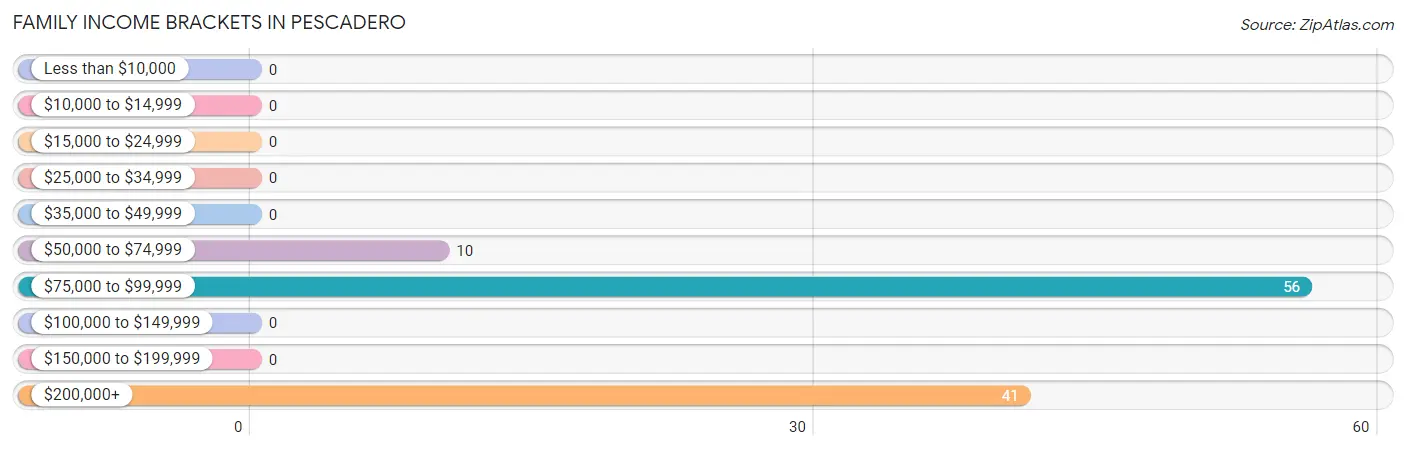
| Income Bracket | # Families | % Families |
| Less than $10,000 | 0 | 0.0% |
| $10,000 to $14,999 | 0 | 0.0% |
| $15,000 to $24,999 | 0 | 0.0% |
| $25,000 to $34,999 | 0 | 0.0% |
| $35,000 to $49,999 | 0 | 0.0% |
| $50,000 to $74,999 | 10 | 9.3% |
| $75,000 to $99,999 | 56 | 52.3% |
| $100,000 to $149,999 | 0 | 0.0% |
| $150,000 to $199,999 | 0 | 0.0% |
| $200,000+ | 41 | 38.3% |
Family Income by Famaliy Size in Pescadero
| Income Bracket | # Families | Median Income |
| 2-Person Families | 81 (75.7%) | $0 |
| 3-Person Families | 17 (15.9%) | $0 |
| 4-Person Families | 9 (8.4%) | $0 |
| 5-Person Families | 0 (0.0%) | $0 |
| 6-Person Families | 0 (0.0%) | $0 |
| 7+ Person Families | 0 (0.0%) | $0 |
| Total | 107 (100.0%) | $0 |
Family Income by Number of Earners in Pescadero
| Number of Earners | # Families | Median Income |
| No Earners | 10 (9.3%) | $0 |
| 1 Earner | 0 (0.0%) | $0 |
| 2 Earners | 97 (90.6%) | $0 |
| 3+ Earners | 0 (0.0%) | $0 |
| Total | 107 (100.0%) | $0 |
Household Income in Pescadero
Household Income Brackets in Pescadero
With 56 households falling in the category, the $75,000 to $99,999 income range is the most frequent in Pescadero, accounting for 52.3% of all households.
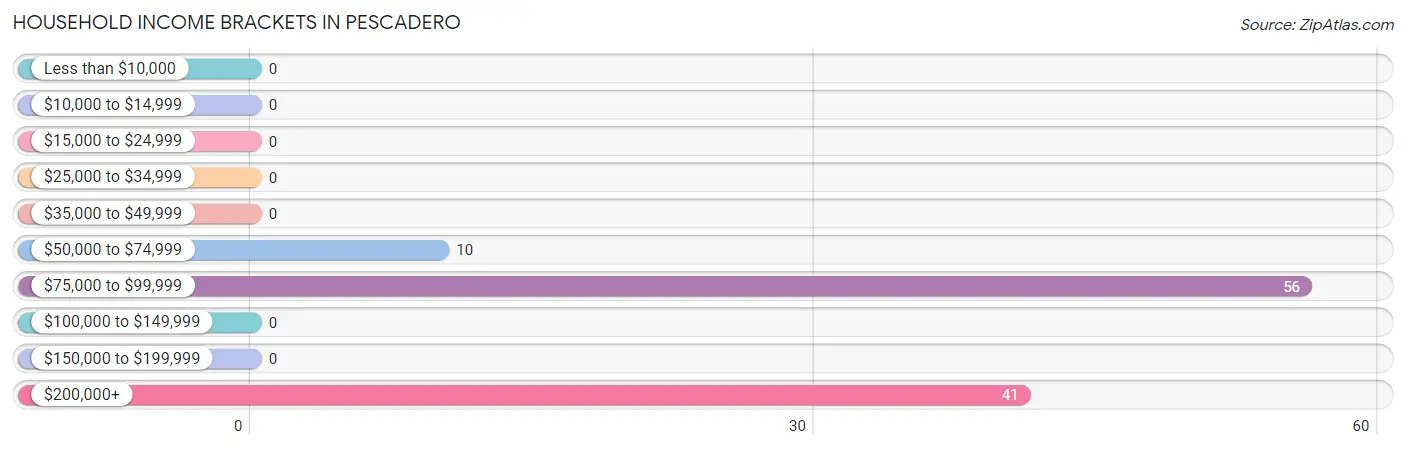
| Income Bracket | # Households | % Households |
| Less than $10,000 | 0 | 0.0% |
| $10,000 to $14,999 | 0 | 0.0% |
| $15,000 to $24,999 | 0 | 0.0% |
| $25,000 to $34,999 | 0 | 0.0% |
| $35,000 to $49,999 | 0 | 0.0% |
| $50,000 to $74,999 | 10 | 9.3% |
| $75,000 to $99,999 | 56 | 52.3% |
| $100,000 to $149,999 | 0 | 0.0% |
| $150,000 to $199,999 | 0 | 0.0% |
| $200,000+ | 41 | 38.3% |
Household Income by Householder Age in Pescadero
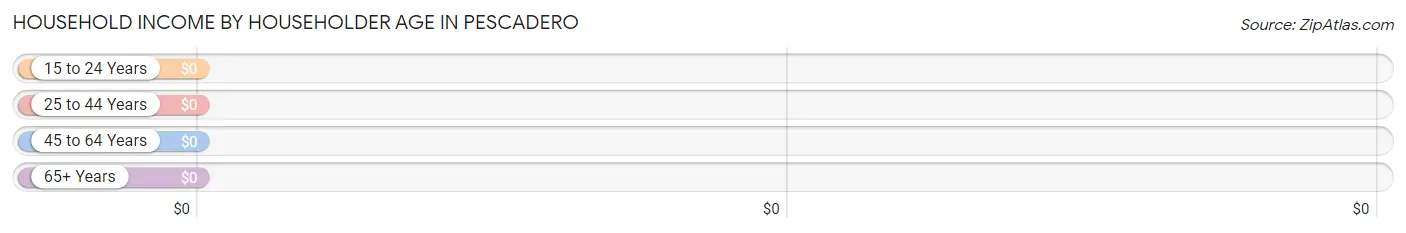
| Income Bracket | # Households | Median Income |
| 15 to 24 Years | 47 (43.9%) | $0 |
| 25 to 44 Years | 17 (15.9%) | $0 |
| 45 to 64 Years | 33 (30.8%) | $0 |
| 65+ Years | 10 (9.3%) | $0 |
| Total | 107 (100.0%) | $0 |
Poverty in Pescadero
Income Below Poverty by Sex and Age in Pescadero
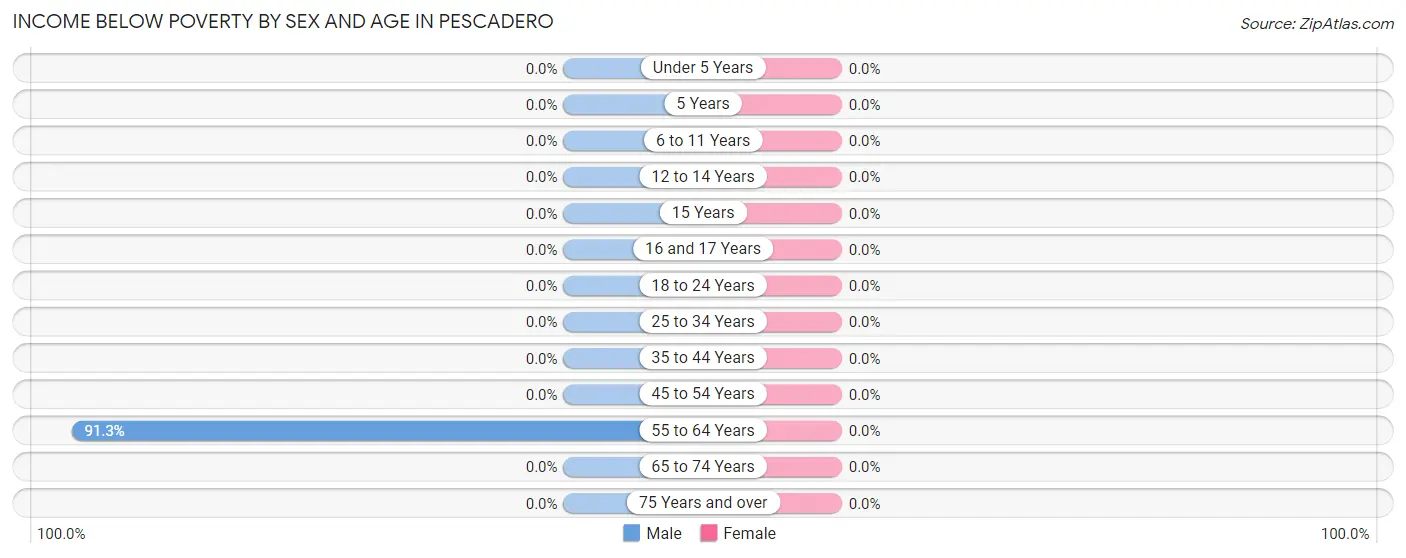
| Age Bracket | Male | Female |
| Under 5 Years | 0 (0.0%) | 0 (0.0%) |
| 5 Years | 0 (0.0%) | 0 (0.0%) |
| 6 to 11 Years | 0 (0.0%) | 0 (0.0%) |
| 12 to 14 Years | 0 (0.0%) | 0 (0.0%) |
| 15 Years | 0 (0.0%) | 0 (0.0%) |
| 16 and 17 Years | 0 (0.0%) | 0 (0.0%) |
| 18 to 24 Years | 0 (0.0%) | 0 (0.0%) |
| 25 to 34 Years | 0 (0.0%) | 0 (0.0%) |
| 35 to 44 Years | 0 (0.0%) | 0 (0.0%) |
| 45 to 54 Years | 0 (0.0%) | 0 (0.0%) |
| 55 to 64 Years | 42 (91.3%) | 0 (0.0%) |
| 65 to 74 Years | 0 (0.0%) | 0 (0.0%) |
| 75 Years and over | 0 (0.0%) | 0 (0.0%) |
| Total | 42 (35.0%) | 0 (0.0%) |
Income Above Poverty by Sex and Age in Pescadero
According to the poverty statistics in Pescadero, males aged under 5 years and females aged 15 years are the age groups that are most secure financially, with 100.0% of males and 100.0% of females in these age groups living above the poverty line.
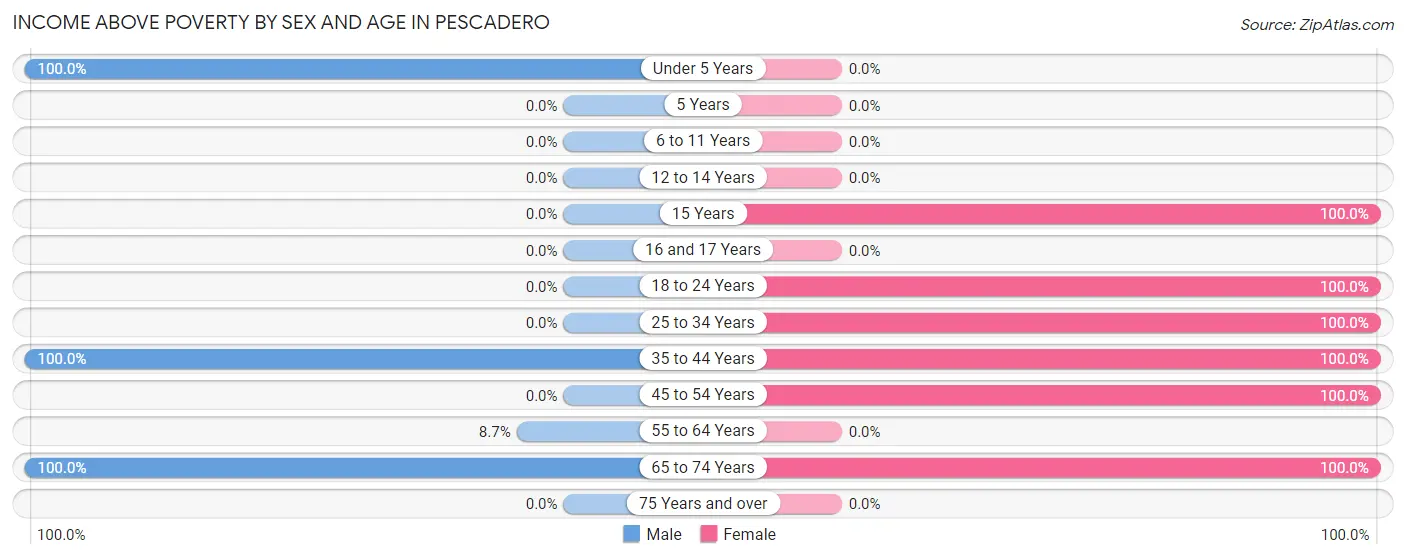
| Age Bracket | Male | Female |
| Under 5 Years | 23 (100.0%) | 0 (0.0%) |
| 5 Years | 0 (0.0%) | 0 (0.0%) |
| 6 to 11 Years | 0 (0.0%) | 0 (0.0%) |
| 12 to 14 Years | 0 (0.0%) | 0 (0.0%) |
| 15 Years | 0 (0.0%) | 14 (100.0%) |
| 16 and 17 Years | 0 (0.0%) | 0 (0.0%) |
| 18 to 24 Years | 0 (0.0%) | 63 (100.0%) |
| 25 to 34 Years | 0 (0.0%) | 21 (100.0%) |
| 35 to 44 Years | 41 (100.0%) | 88 (100.0%) |
| 45 to 54 Years | 0 (0.0%) | 33 (100.0%) |
| 55 to 64 Years | 4 (8.7%) | 0 (0.0%) |
| 65 to 74 Years | 10 (100.0%) | 10 (100.0%) |
| 75 Years and over | 0 (0.0%) | 0 (0.0%) |
| Total | 78 (65.0%) | 229 (100.0%) |
Income Below Poverty Among Married-Couple Families in Pescadero
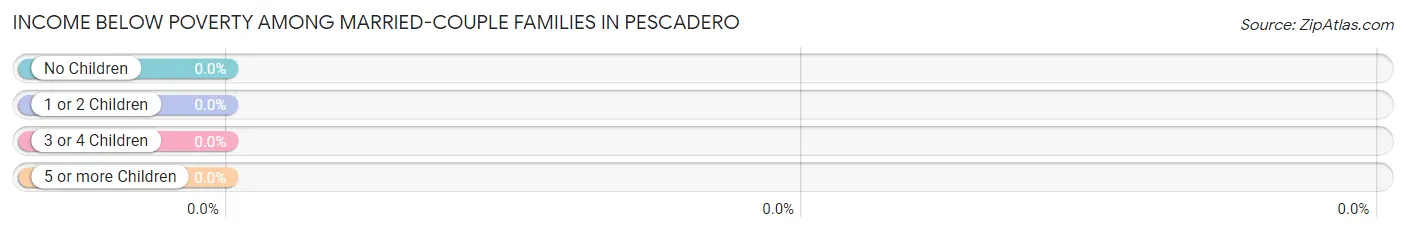
| Children | Above Poverty | Below Poverty |
| No Children | 34 (100.0%) | 0 (0.0%) |
| 1 or 2 Children | 26 (100.0%) | 0 (0.0%) |
| 3 or 4 Children | 0 (0.0%) | 0 (0.0%) |
| 5 or more Children | 0 (0.0%) | 0 (0.0%) |
| Total | 60 (100.0%) | 0 (0.0%) |
Income Below Poverty Among Single-Parent Households in Pescadero
| Children | Single Father | Single Mother |
| No Children | 0 (0.0%) | 0 (0.0%) |
| 1 or 2 Children | 0 (0.0%) | 0 (0.0%) |
| 3 or 4 Children | 0 (0.0%) | 0 (0.0%) |
| 5 or more Children | 0 (0.0%) | 0 (0.0%) |
| Total | 0 (0.0%) | 0 (0.0%) |
Income Below Poverty Among Married-Couple vs Single-Parent Households in Pescadero
| Children | Married-Couple Families | Single-Parent Households |
| No Children | 0 (0.0%) | 0 (0.0%) |
| 1 or 2 Children | 0 (0.0%) | 0 (0.0%) |
| 3 or 4 Children | 0 (0.0%) | 0 (0.0%) |
| 5 or more Children | 0 (0.0%) | 0 (0.0%) |
| Total | 0 (0.0%) | 0 (0.0%) |
Race in Pescadero
The most populous races in Pescadero are Two or more Races (199 | 57.0%), White / Caucasian (150 | 43.0%), and Hispanic or Latino (135 | 38.7%).
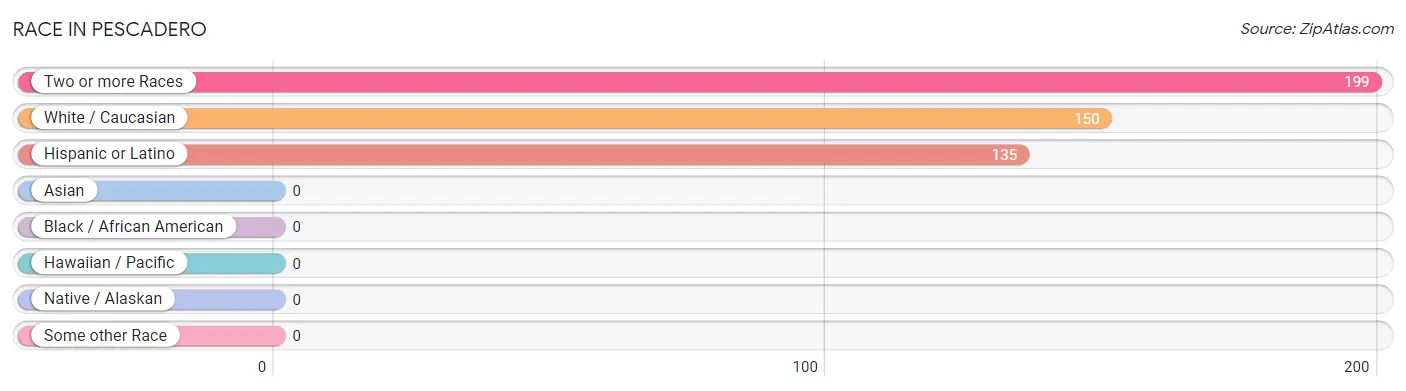
| Race | # Population | % Population |
| Asian | 0 | 0.0% |
| Black / African American | 0 | 0.0% |
| Hawaiian / Pacific | 0 | 0.0% |
| Hispanic or Latino | 135 | 38.7% |
| Native / Alaskan | 0 | 0.0% |
| White / Caucasian | 150 | 43.0% |
| Two or more Races | 199 | 57.0% |
| Some other Race | 0 | 0.0% |
| Total | 349 | 100.0% |
Ancestry in Pescadero
The most populous ancestries reported in Pescadero are Mexican (135 | 38.7%), American (91 | 26.1%), Israeli (42 | 12.0%), Bhutanese (21 | 6.0%), and European (21 | 6.0%), together accounting for 88.8% of all Pescadero residents.
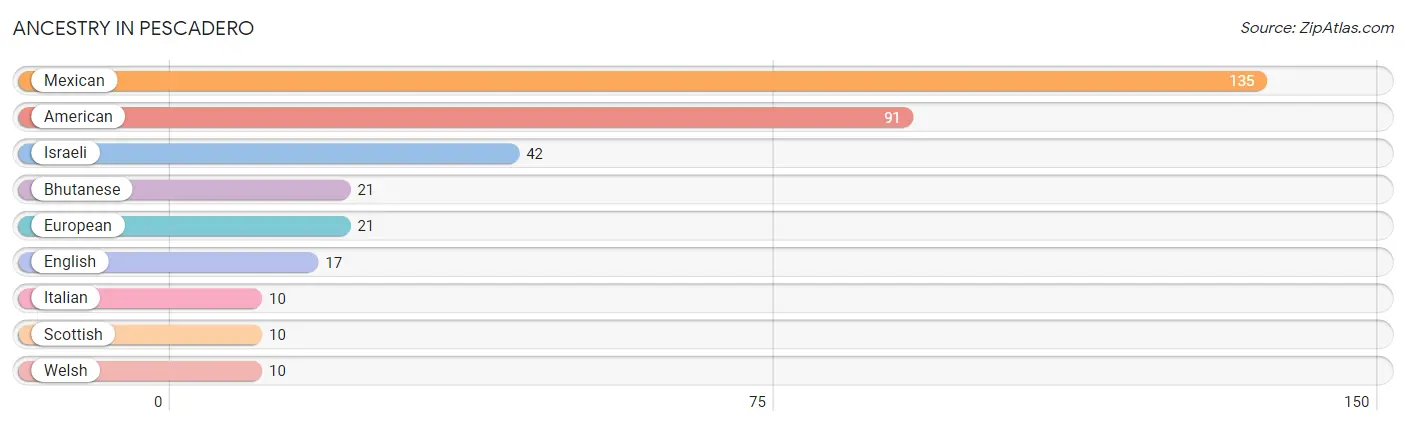
| Ancestry | # Population | % Population |
| American | 91 | 26.1% |
| Bhutanese | 21 | 6.0% |
| English | 17 | 4.9% |
| European | 21 | 6.0% |
| Israeli | 42 | 12.0% |
| Italian | 10 | 2.9% |
| Mexican | 135 | 38.7% |
| Scottish | 10 | 2.9% |
| Welsh | 10 | 2.9% | View All 9 Rows |
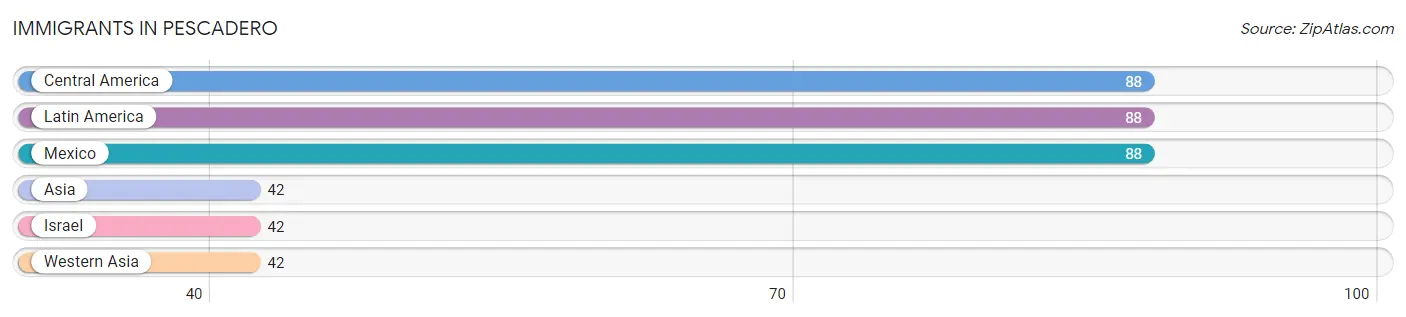
Immigrants in Pescadero
The most numerous immigrant groups reported in Pescadero came from Central America (88 | 25.2%), Latin America (88 | 25.2%), Mexico (88 | 25.2%), Asia (42 | 12.0%), and Israel (42 | 12.0%), together accounting for 99.7% of all Pescadero residents.
| Immigration Origin | # Population | % Population |
| Asia | 42 | 12.0% |
| Central America | 88 | 25.2% |
| Israel | 42 | 12.0% |
| Latin America | 88 | 25.2% |
| Mexico | 88 | 25.2% |
| Western Asia | 42 | 12.0% | View All 6 Rows |
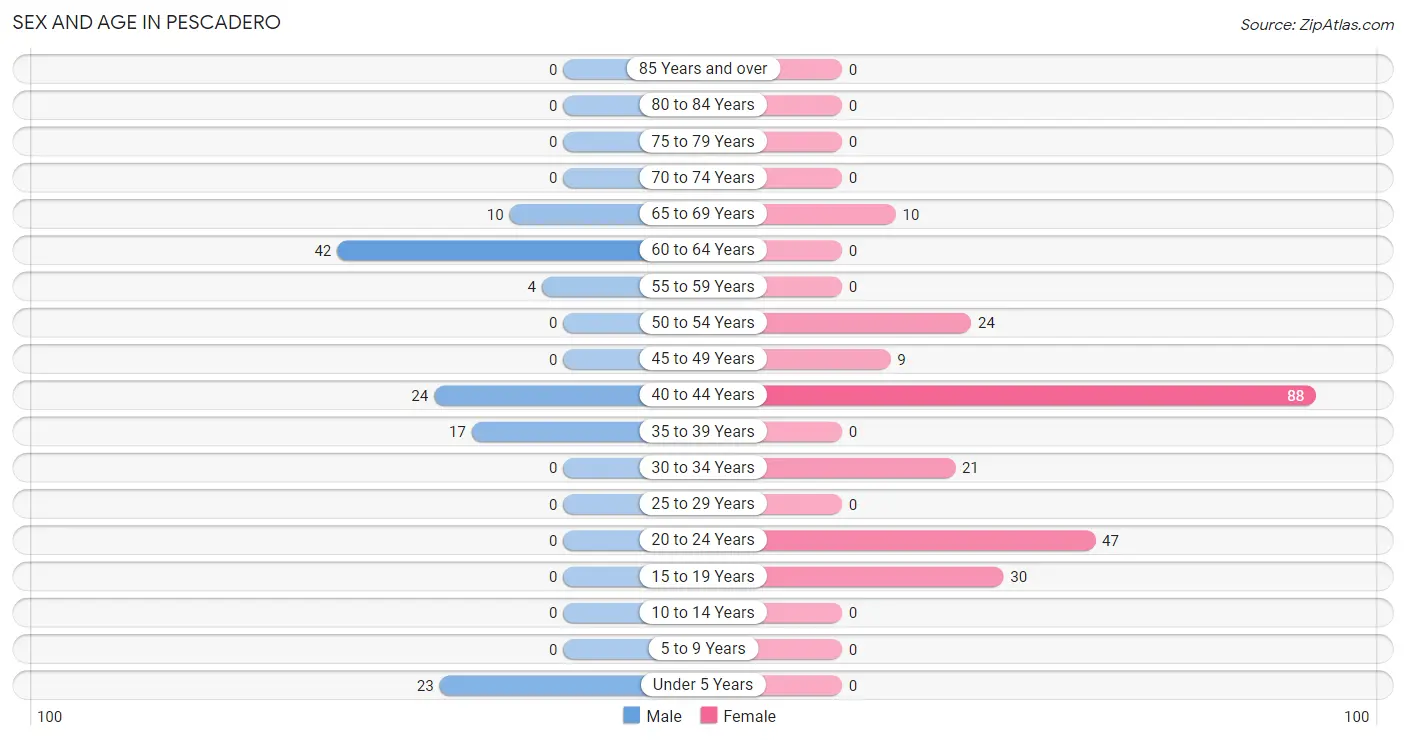
Sex and Age in Pescadero
Sex and Age in Pescadero
The most populous age groups in Pescadero are 60 to 64 Years (42 | 35.0%) for men and 40 to 44 Years (88 | 38.4%) for women.
| Age Bracket | Male | Female |
| Under 5 Years | 23 (19.2%) | 0 (0.0%) |
| 5 to 9 Years | 0 (0.0%) | 0 (0.0%) |
| 10 to 14 Years | 0 (0.0%) | 0 (0.0%) |
| 15 to 19 Years | 0 (0.0%) | 30 (13.1%) |
| 20 to 24 Years | 0 (0.0%) | 47 (20.5%) |
| 25 to 29 Years | 0 (0.0%) | 0 (0.0%) |
| 30 to 34 Years | 0 (0.0%) | 21 (9.2%) |
| 35 to 39 Years | 17 (14.2%) | 0 (0.0%) |
| 40 to 44 Years | 24 (20.0%) | 88 (38.4%) |
| 45 to 49 Years | 0 (0.0%) | 9 (3.9%) |
| 50 to 54 Years | 0 (0.0%) | 24 (10.5%) |
| 55 to 59 Years | 4 (3.3%) | 0 (0.0%) |
| 60 to 64 Years | 42 (35.0%) | 0 (0.0%) |
| 65 to 69 Years | 10 (8.3%) | 10 (4.4%) |
| 70 to 74 Years | 0 (0.0%) | 0 (0.0%) |
| 75 to 79 Years | 0 (0.0%) | 0 (0.0%) |
| 80 to 84 Years | 0 (0.0%) | 0 (0.0%) |
| 85 Years and over | 0 (0.0%) | 0 (0.0%) |
| Total | 120 (100.0%) | 229 (100.0%) |
Families and Households in Pescadero
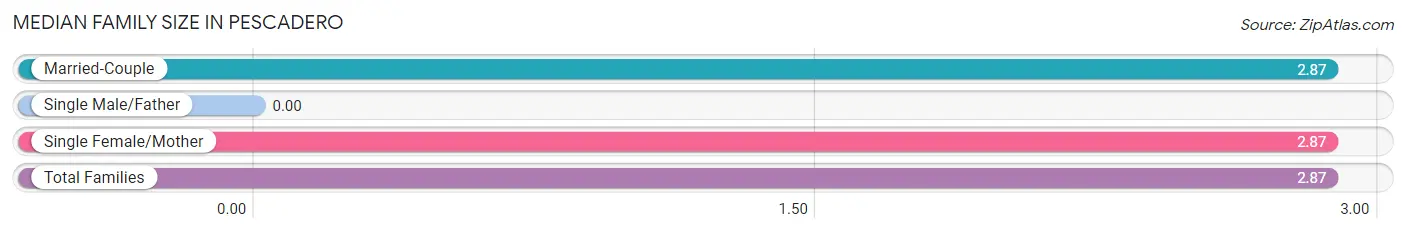
Median Family Size in Pescadero
| Family Type | # Families | Family Size |
| Married-Couple | 60 (56.1%) | 2.87 |
| Single Male/Father | 0 (0.0%) | - |
| Single Female/Mother | 47 (43.9%) | 2.87 |
| Total Families | 107 (100.0%) | 2.87 |
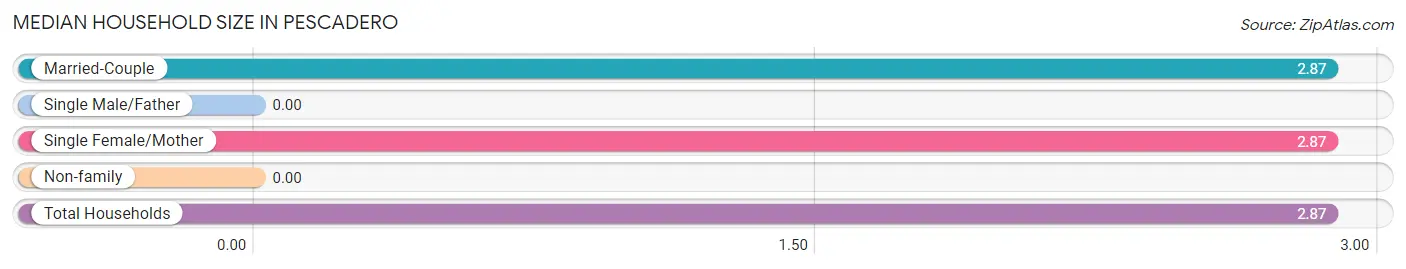
Median Household Size in Pescadero
| Household Type | # Households | Household Size |
| Married-Couple | 60 (56.1%) | 2.87 |
| Single Male/Father | 0 (0.0%) | - |
| Single Female/Mother | 47 (43.9%) | 2.87 |
| Non-family | 0 (0.0%) | - |
| Total Households | 107 (100.0%) | 2.87 |
Household Size by Marriage Status in Pescadero
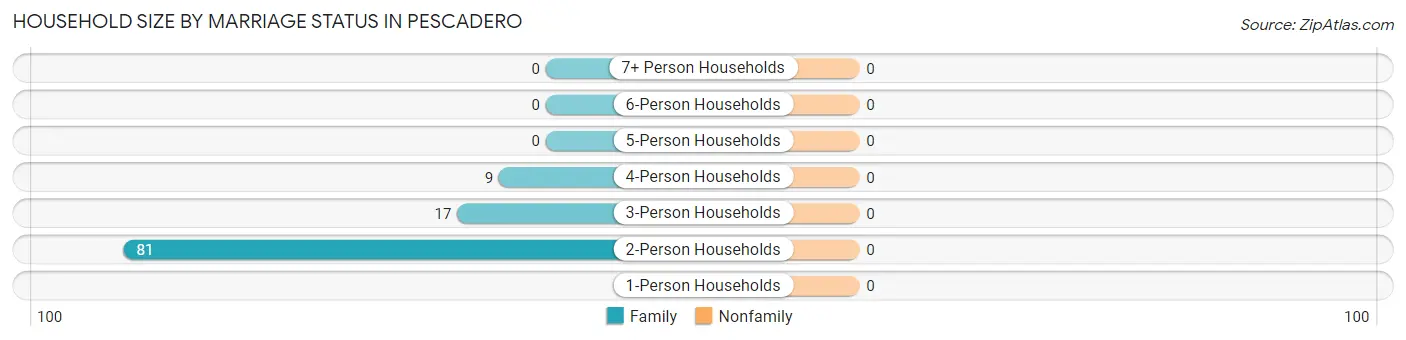
| Household Size | Family Households | Nonfamily Households |
| 1-Person Households | - | 0 (0.0%) |
| 2-Person Households | 81 (75.7%) | 0 (0.0%) |
| 3-Person Households | 17 (15.9%) | 0 (0.0%) |
| 4-Person Households | 9 (8.4%) | 0 (0.0%) |
| 5-Person Households | 0 (0.0%) | 0 (0.0%) |
| 6-Person Households | 0 (0.0%) | 0 (0.0%) |
| 7+ Person Households | 0 (0.0%) | 0 (0.0%) |
| Total | 107 (100.0%) | 0 (0.0%) |
Female Fertility in Pescadero
Fertility by Age in Pescadero
Average fertility rate in Pescadero is 108.0 births per 1,000 women. Women in the age bracket of 20 to 34 years have the highest fertility rate with 309.0 births per 1,000 women. Women in the age bracket of 20 to 34 years acount for 100.0% of all women with births.
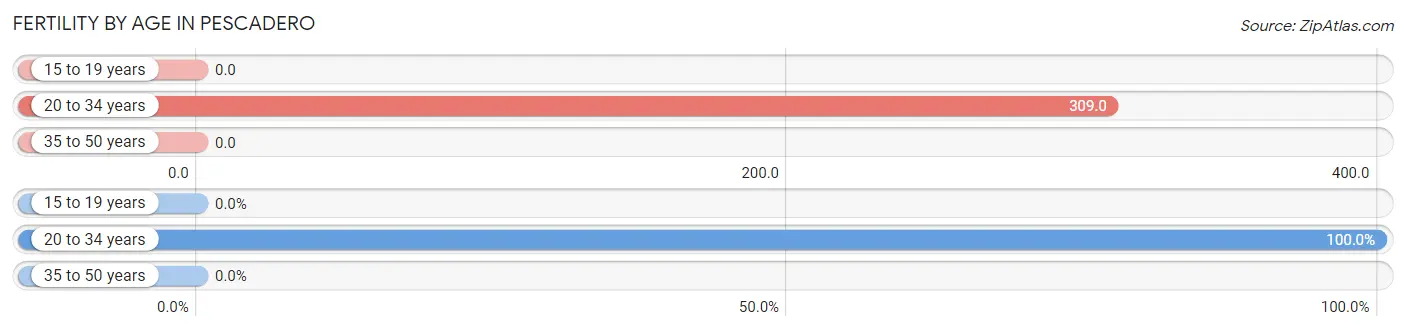
| Age Bracket | Women with Births | Births / 1,000 Women |
| 15 to 19 years | 0 (0.0%) | 0.0 |
| 20 to 34 years | 21 (100.0%) | 309.0 |
| 35 to 50 years | 0 (0.0%) | 0.0 |
| Total | 21 (100.0%) | 108.0 |
Fertility by Age by Marriage Status in Pescadero
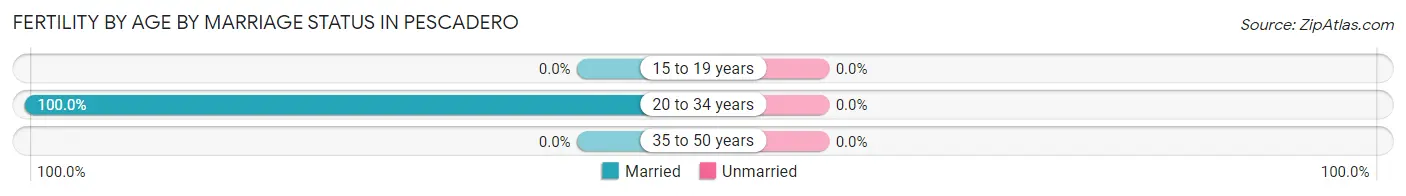
| Age Bracket | Married | Unmarried |
| 15 to 19 years | 0 (0.0%) | 0 (0.0%) |
| 20 to 34 years | 21 (100.0%) | 0 (0.0%) |
| 35 to 50 years | 0 (0.0%) | 0 (0.0%) |
| Total | 21 (100.0%) | 0 (0.0%) |
Fertility by Education in Pescadero
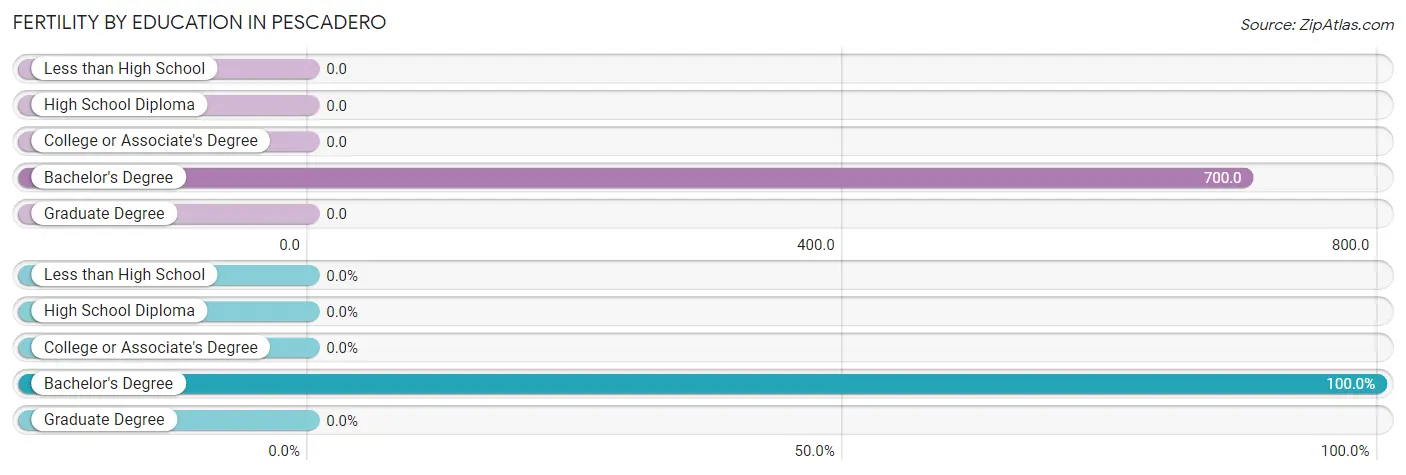
| Educational Attainment | Women with Births | Births / 1,000 Women |
| Less than High School | 0 (0.0%) | 0.0 |
| High School Diploma | 0 (0.0%) | 0.0 |
| College or Associate's Degree | 0 (0.0%) | 0.0 |
| Bachelor's Degree | 21 (100.0%) | 700.0 |
| Graduate Degree | 0 (0.0%) | 0.0 |
| Total | 21 (100.0%) | 108.0 |
Fertility by Education by Marriage Status in Pescadero
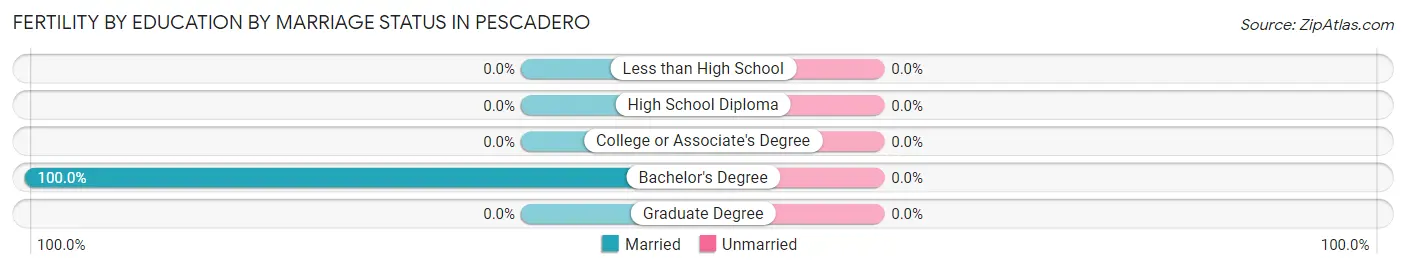
| Educational Attainment | Married | Unmarried |
| Less than High School | 0 (0.0%) | 0 (0.0%) |
| High School Diploma | 0 (0.0%) | 0 (0.0%) |
| College or Associate's Degree | 0 (0.0%) | 0 (0.0%) |
| Bachelor's Degree | 21 (100.0%) | 0 (0.0%) |
| Graduate Degree | 0 (0.0%) | 0 (0.0%) |
| Total | 21 (100.0%) | 0 (0.0%) |
Employment Characteristics in Pescadero
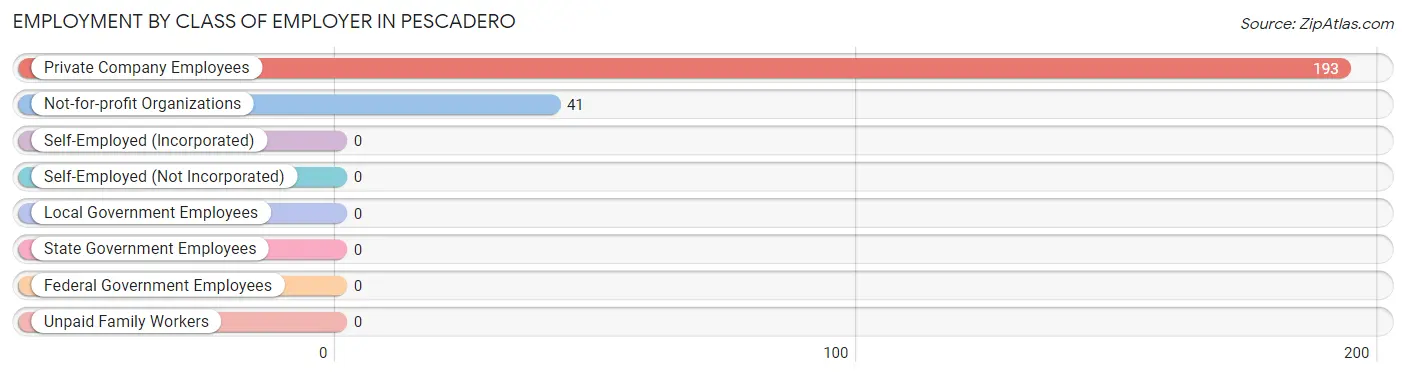
Employment by Class of Employer in Pescadero
Among the 234 employed individuals in Pescadero, private company employees (193 | 82.5%), and not-for-profit organizations (41 | 17.5%) make up the most common classes of employment.
| Employer Class | # Employees | % Employees |
| Private Company Employees | 193 | 82.5% |
| Self-Employed (Incorporated) | 0 | 0.0% |
| Self-Employed (Not Incorporated) | 0 | 0.0% |
| Not-for-profit Organizations | 41 | 17.5% |
| Local Government Employees | 0 | 0.0% |
| State Government Employees | 0 | 0.0% |
| Federal Government Employees | 0 | 0.0% |
| Unpaid Family Workers | 0 | 0.0% |
| Total | 234 | 100.0% |
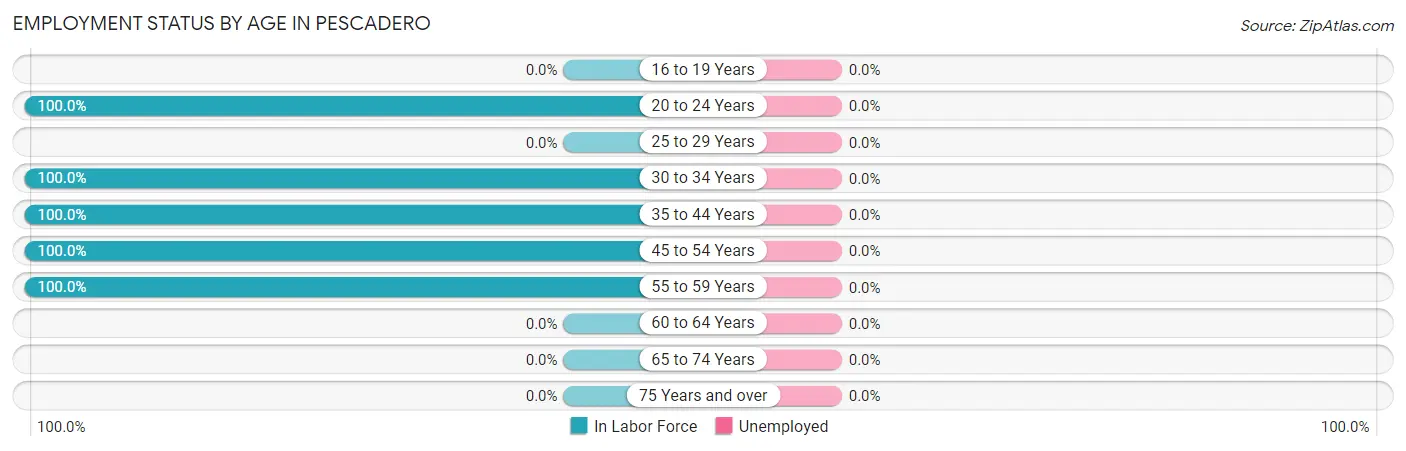
Employment Status by Age in Pescadero
| Age Bracket | In Labor Force | Unemployed |
| 16 to 19 Years | 0 (0.0%) | 0 (0.0%) |
| 20 to 24 Years | 47 (100.0%) | 0 (0.0%) |
| 25 to 29 Years | 0 (0.0%) | 0 (0.0%) |
| 30 to 34 Years | 21 (100.0%) | 0 (0.0%) |
| 35 to 44 Years | 129 (100.0%) | 0 (0.0%) |
| 45 to 54 Years | 33 (100.0%) | 0 (0.0%) |
| 55 to 59 Years | 4 (100.0%) | 0 (0.0%) |
| 60 to 64 Years | 0 (0.0%) | 0 (0.0%) |
| 65 to 74 Years | 0 (0.0%) | 0 (0.0%) |
| 75 Years and over | 0 (0.0%) | 0 (0.0%) |
| Total | 234 (75.0%) | 0 (0.0%) |
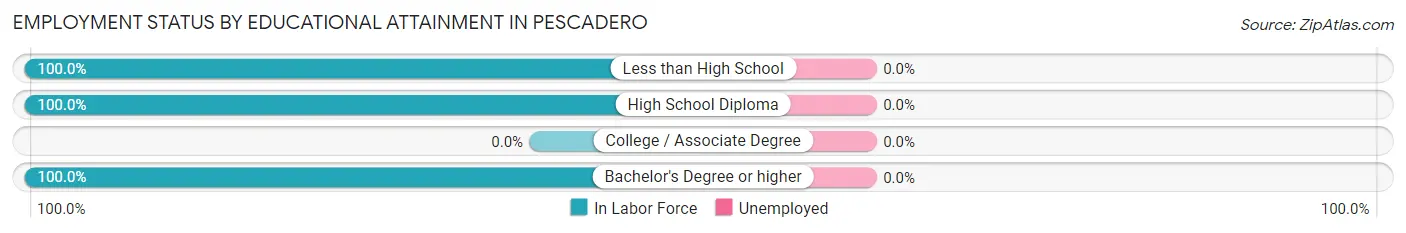
Employment Status by Educational Attainment in Pescadero
| Educational Attainment | In Labor Force | Unemployed |
| Less than High School | 88 (100.0%) | 0 (0.0%) |
| High School Diploma | 28 (100.0%) | 0 (0.0%) |
| College / Associate Degree | 0 (0.0%) | 0 (0.0%) |
| Bachelor's Degree or higher | 71 (100.0%) | 0 (0.0%) |
| Total | 187 (81.7%) | 0 (0.0%) |
Employment Occupations by Sex in Pescadero
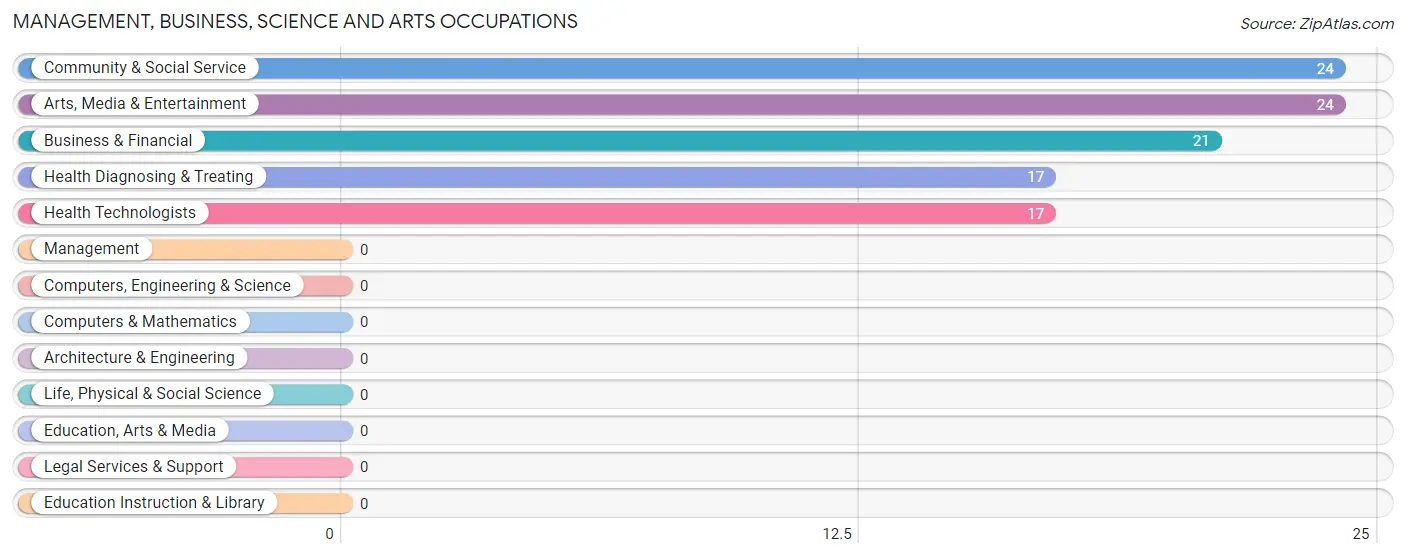
Management, Business, Science and Arts Occupations
The most common Management, Business, Science and Arts occupations in Pescadero are Community & Social Service (24 | 10.3%), Arts, Media & Entertainment (24 | 10.3%), Business & Financial (21 | 9.0%), Health Diagnosing & Treating (17 | 7.3%), and Health Technologists (17 | 7.3%).
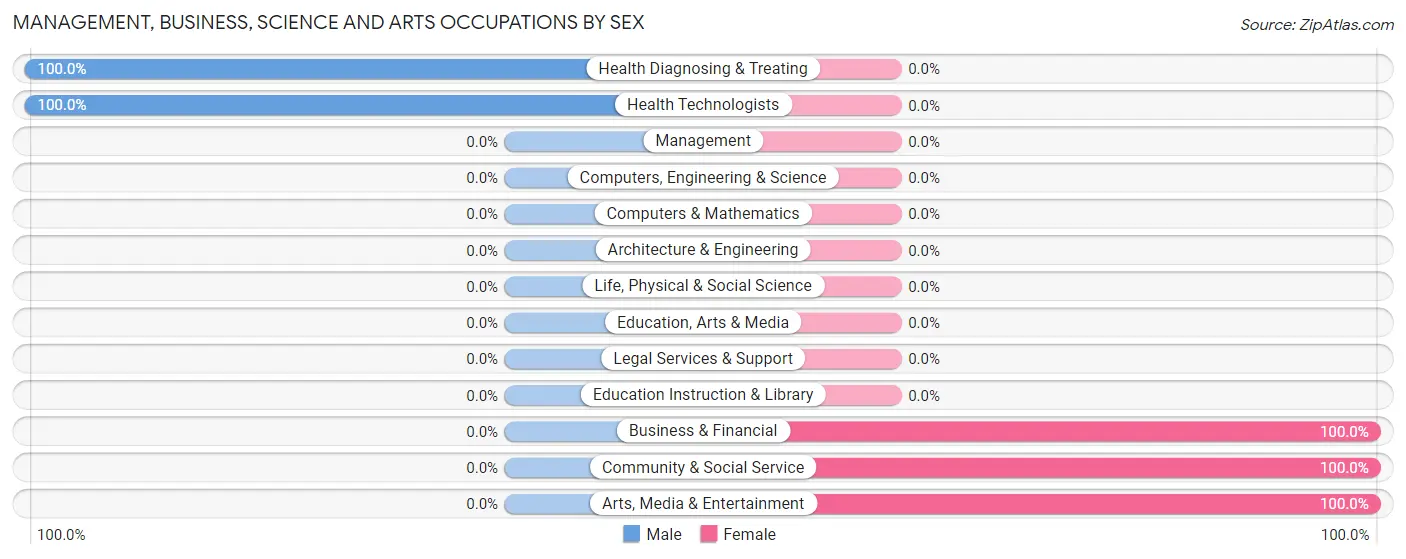
Management, Business, Science and Arts Occupations by Sex
Within the Management, Business, Science and Arts occupations in Pescadero, the most male-oriented occupations are Health Diagnosing & Treating (100.0%), and Health Technologists (100.0%), while the most female-oriented occupations are Business & Financial (100.0%), Community & Social Service (100.0%), and Arts, Media & Entertainment (100.0%).
| Occupation | Male | Female |
| Management | 0 (0.0%) | 0 (0.0%) |
| Business & Financial | 0 (0.0%) | 21 (100.0%) |
| Computers, Engineering & Science | 0 (0.0%) | 0 (0.0%) |
| Computers & Mathematics | 0 (0.0%) | 0 (0.0%) |
| Architecture & Engineering | 0 (0.0%) | 0 (0.0%) |
| Life, Physical & Social Science | 0 (0.0%) | 0 (0.0%) |
| Community & Social Service | 0 (0.0%) | 24 (100.0%) |
| Education, Arts & Media | 0 (0.0%) | 0 (0.0%) |
| Legal Services & Support | 0 (0.0%) | 0 (0.0%) |
| Education Instruction & Library | 0 (0.0%) | 0 (0.0%) |
| Arts, Media & Entertainment | 0 (0.0%) | 24 (100.0%) |
| Health Diagnosing & Treating | 17 (100.0%) | 0 (0.0%) |
| Health Technologists | 17 (100.0%) | 0 (0.0%) |
| Total (Category) | 17 (27.4%) | 45 (72.6%) |
| Total (Overall) | 45 (19.2%) | 189 (80.8%) |
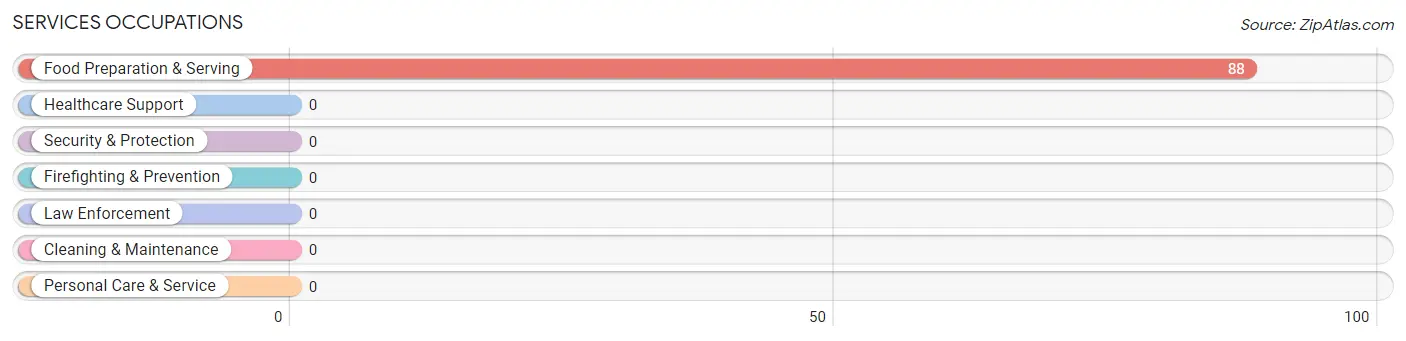
Services Occupations
The most common Services occupations in Pescadero are , and Food Preparation & Serving (88 | 37.6%).
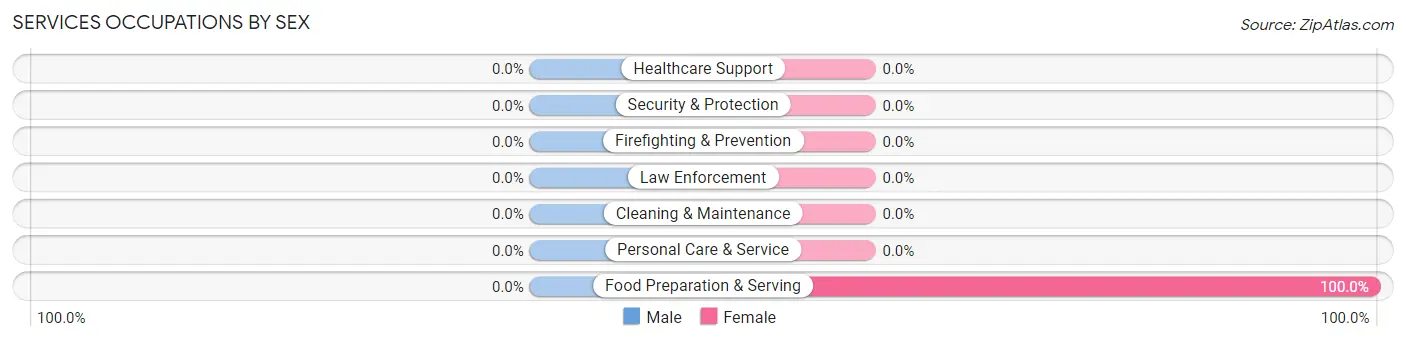
Services Occupations by Sex
| Occupation | Male | Female |
| Healthcare Support | 0 (0.0%) | 0 (0.0%) |
| Security & Protection | 0 (0.0%) | 0 (0.0%) |
| Firefighting & Prevention | 0 (0.0%) | 0 (0.0%) |
| Law Enforcement | 0 (0.0%) | 0 (0.0%) |
| Food Preparation & Serving | 0 (0.0%) | 88 (100.0%) |
| Cleaning & Maintenance | 0 (0.0%) | 0 (0.0%) |
| Personal Care & Service | 0 (0.0%) | 0 (0.0%) |
| Total (Category) | 0 (0.0%) | 88 (100.0%) |
| Total (Overall) | 45 (19.2%) | 189 (80.8%) |
Sales and Office Occupations
The most common Sales and Office occupations in Pescadero are , and Office & Administration (56 | 23.9%).
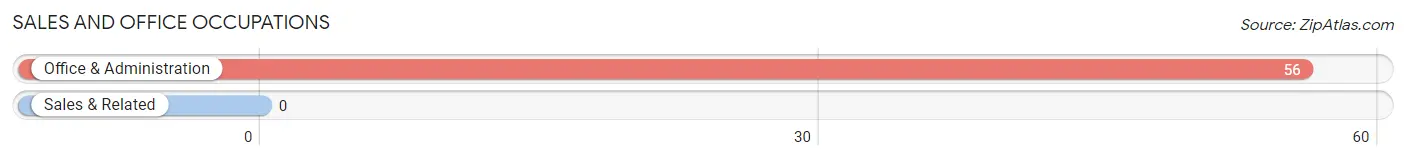
Sales and Office Occupations by Sex

| Occupation | Male | Female |
| Sales & Related | 0 (0.0%) | 0 (0.0%) |
| Office & Administration | 0 (0.0%) | 56 (100.0%) |
| Total (Category) | 0 (0.0%) | 56 (100.0%) |
| Total (Overall) | 45 (19.2%) | 189 (80.8%) |
Natural Resources, Construction and Maintenance Occupations
The most common Natural Resources, Construction and Maintenance occupations in Pescadero are , and Construction & Extraction (28 | 12.0%).
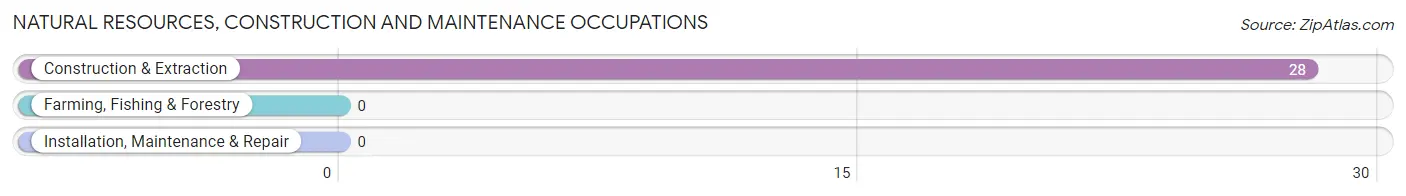
Natural Resources, Construction and Maintenance Occupations by Sex

| Occupation | Male | Female |
| Farming, Fishing & Forestry | 0 (0.0%) | 0 (0.0%) |
| Construction & Extraction | 28 (100.0%) | 0 (0.0%) |
| Installation, Maintenance & Repair | 0 (0.0%) | 0 (0.0%) |
| Total (Category) | 28 (100.0%) | 0 (0.0%) |
| Total (Overall) | 45 (19.2%) | 189 (80.8%) |
Production, Transportation and Moving Occupations
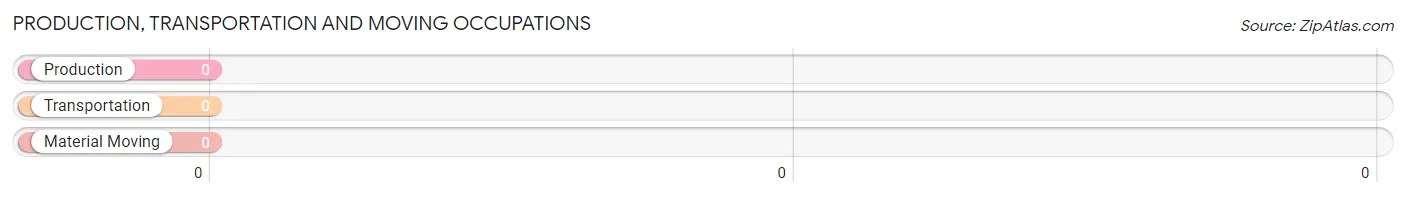
Production, Transportation and Moving Occupations by Sex
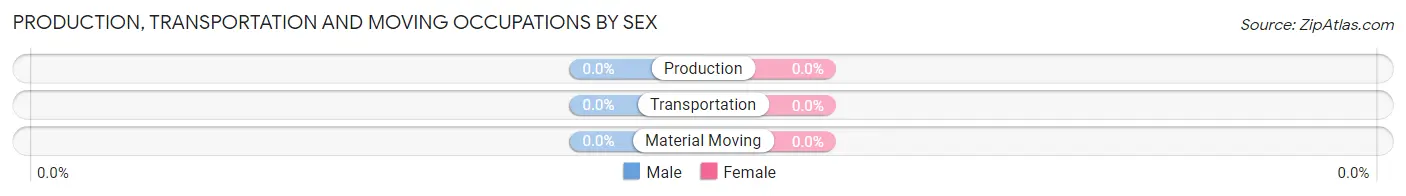
| Occupation | Male | Female |
| Production | 0 (0.0%) | 0 (0.0%) |
| Transportation | 0 (0.0%) | 0 (0.0%) |
| Material Moving | 0 (0.0%) | 0 (0.0%) |
| Total (Category) | 0 (0.0%) | 0 (0.0%) |
| Total (Overall) | 45 (19.2%) | 189 (80.8%) |
Employment Industries by Sex in Pescadero
Employment Industries in Pescadero
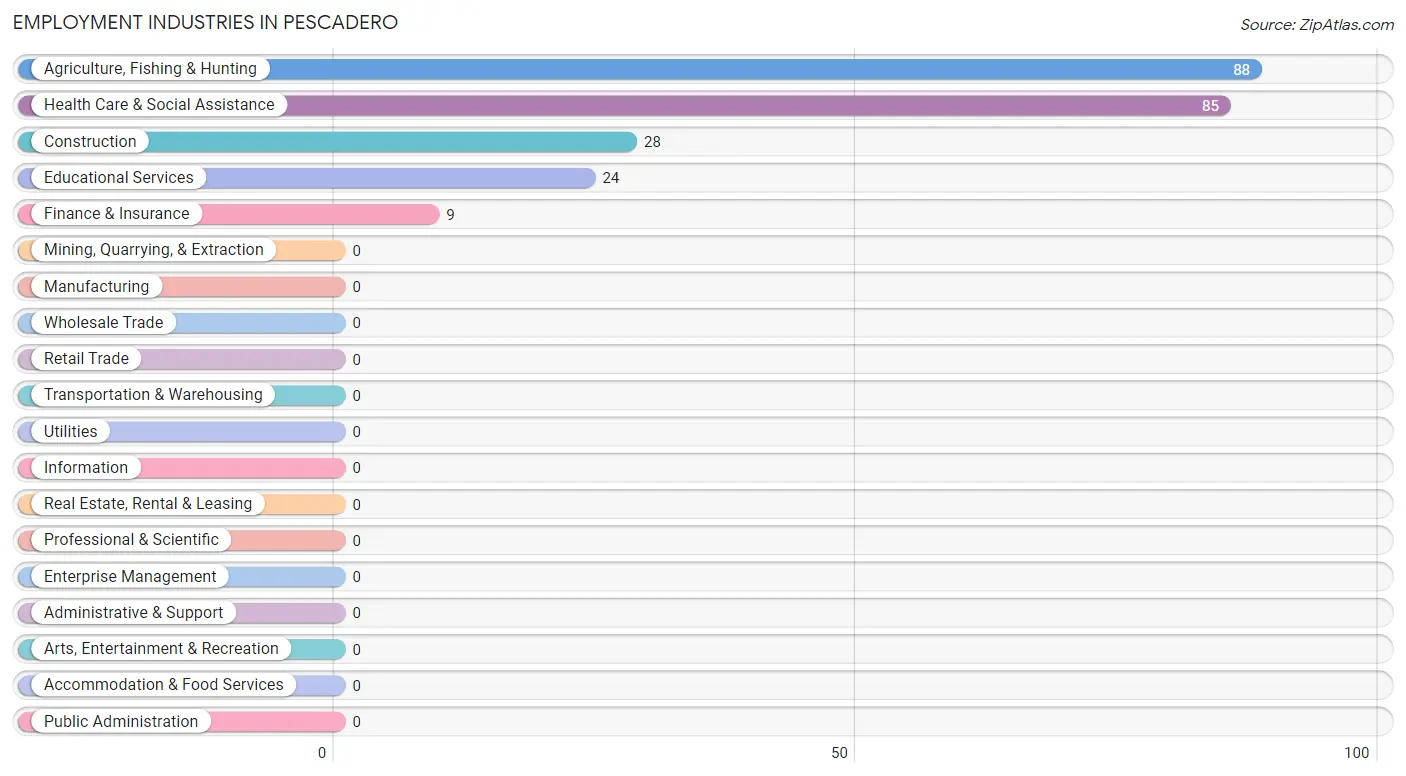
The major employment industries in Pescadero include Agriculture, Fishing & Hunting (88 | 37.6%), Health Care & Social Assistance (85 | 36.3%), Construction (28 | 12.0%), Educational Services (24 | 10.3%), and Finance & Insurance (9 | 3.8%).
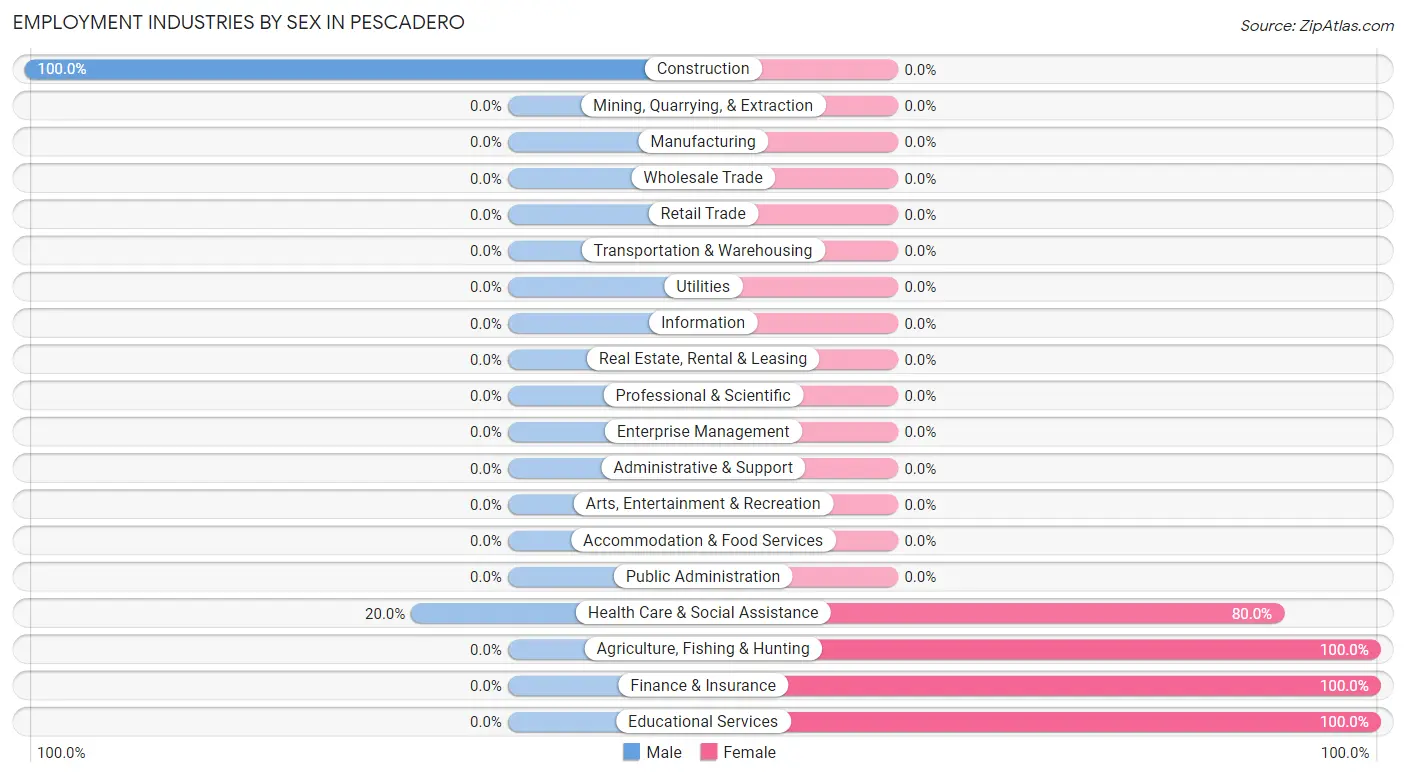
Employment Industries by Sex in Pescadero
The Pescadero industries that see more men than women are Construction (100.0%), and Health Care & Social Assistance (20.0%), whereas the industries that tend to have a higher number of women are Agriculture, Fishing & Hunting (100.0%), Finance & Insurance (100.0%), and Educational Services (100.0%).
| Industry | Male | Female |
| Agriculture, Fishing & Hunting | 0 (0.0%) | 88 (100.0%) |
| Mining, Quarrying, & Extraction | 0 (0.0%) | 0 (0.0%) |
| Construction | 28 (100.0%) | 0 (0.0%) |
| Manufacturing | 0 (0.0%) | 0 (0.0%) |
| Wholesale Trade | 0 (0.0%) | 0 (0.0%) |
| Retail Trade | 0 (0.0%) | 0 (0.0%) |
| Transportation & Warehousing | 0 (0.0%) | 0 (0.0%) |
| Utilities | 0 (0.0%) | 0 (0.0%) |
| Information | 0 (0.0%) | 0 (0.0%) |
| Finance & Insurance | 0 (0.0%) | 9 (100.0%) |
| Real Estate, Rental & Leasing | 0 (0.0%) | 0 (0.0%) |
| Professional & Scientific | 0 (0.0%) | 0 (0.0%) |
| Enterprise Management | 0 (0.0%) | 0 (0.0%) |
| Administrative & Support | 0 (0.0%) | 0 (0.0%) |
| Educational Services | 0 (0.0%) | 24 (100.0%) |
| Health Care & Social Assistance | 17 (20.0%) | 68 (80.0%) |
| Arts, Entertainment & Recreation | 0 (0.0%) | 0 (0.0%) |
| Accommodation & Food Services | 0 (0.0%) | 0 (0.0%) |
| Public Administration | 0 (0.0%) | 0 (0.0%) |
| Total | 45 (19.2%) | 189 (80.8%) |
Education in Pescadero
School Enrollment in Pescadero
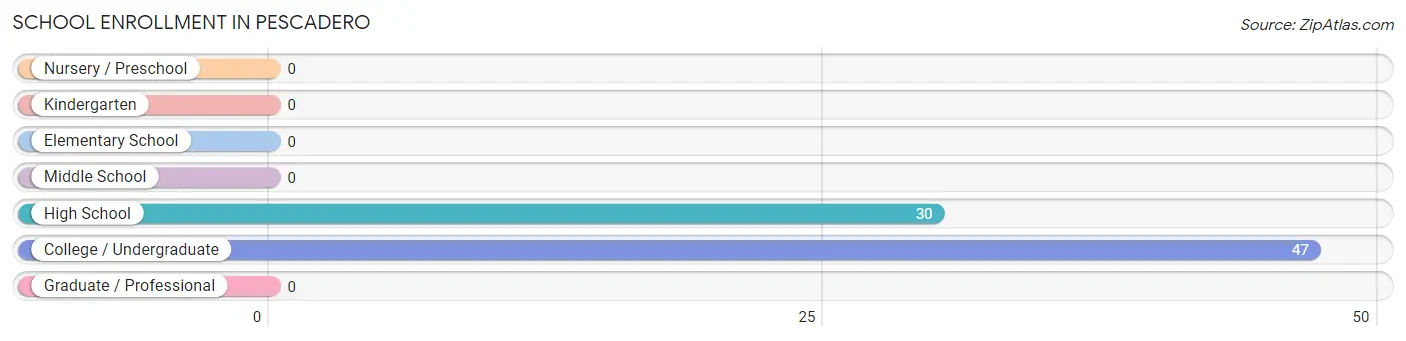
The most common levels of schooling among the 77 students in Pescadero are college / undergraduate (47 | 61.0%), and high school (30 | 39.0%).
| School Level | # Students | % Students |
| Nursery / Preschool | 0 | 0.0% |
| Kindergarten | 0 | 0.0% |
| Elementary School | 0 | 0.0% |
| Middle School | 0 | 0.0% |
| High School | 30 | 39.0% |
| College / Undergraduate | 47 | 61.0% |
| Graduate / Professional | 0 | 0.0% |
| Total | 77 | 100.0% |
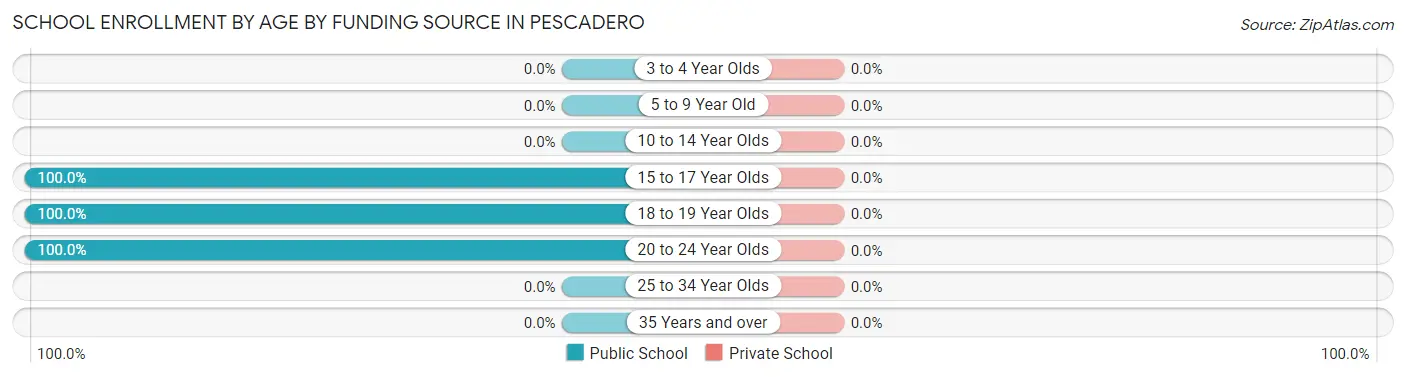
School Enrollment by Age by Funding Source in Pescadero
| Age Bracket | Public School | Private School |
| 3 to 4 Year Olds | 0 (0.0%) | 0 (0.0%) |
| 5 to 9 Year Old | 0 (0.0%) | 0 (0.0%) |
| 10 to 14 Year Olds | 0 (0.0%) | 0 (0.0%) |
| 15 to 17 Year Olds | 14 (100.0%) | 0 (0.0%) |
| 18 to 19 Year Olds | 16 (100.0%) | 0 (0.0%) |
| 20 to 24 Year Olds | 47 (100.0%) | 0 (0.0%) |
| 25 to 34 Year Olds | 0 (0.0%) | 0 (0.0%) |
| 35 Years and over | 0 (0.0%) | 0 (0.0%) |
| Total | 77 (100.0%) | 0 (0.0%) |
Educational Attainment by Field of Study in Pescadero
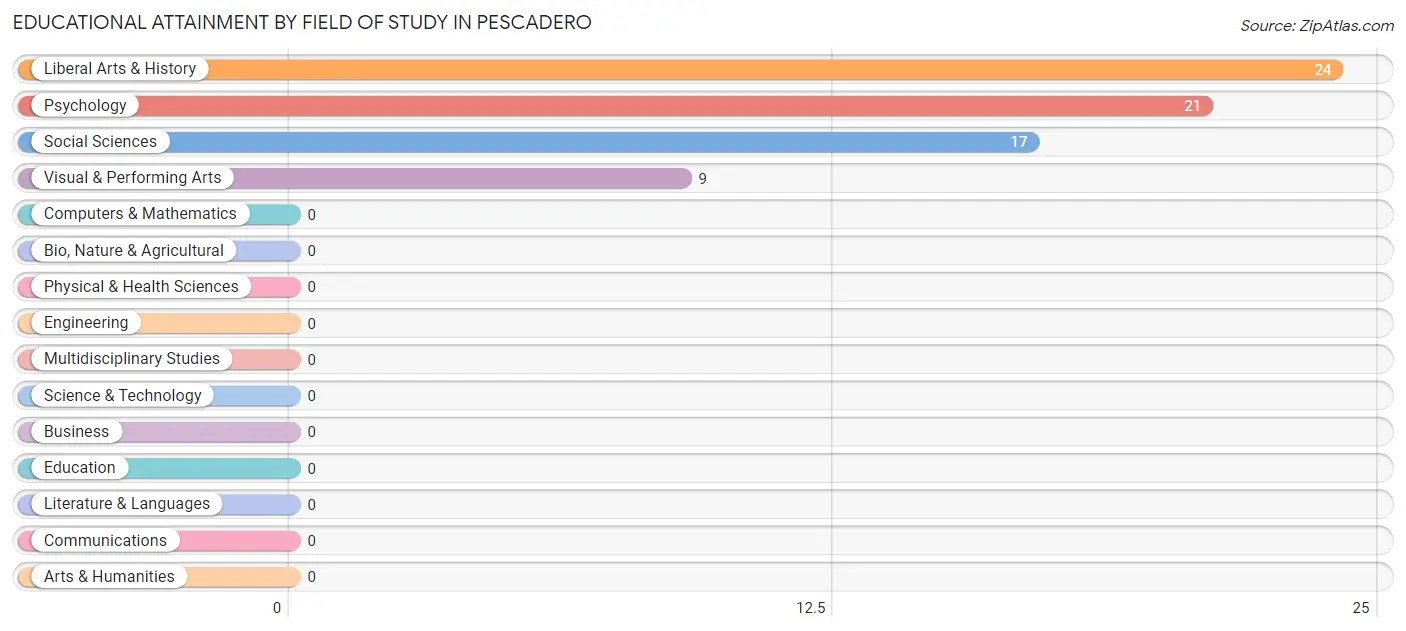
Liberal arts & history (24 | 33.8%), psychology (21 | 29.6%), social sciences (17 | 23.9%), and visual & performing arts (9 | 12.7%) are the most common fields of study among 71 individuals in Pescadero who have obtained a bachelor's degree or higher.
| Field of Study | # Graduates | % Graduates |
| Computers & Mathematics | 0 | 0.0% |
| Bio, Nature & Agricultural | 0 | 0.0% |
| Physical & Health Sciences | 0 | 0.0% |
| Psychology | 21 | 29.6% |
| Social Sciences | 17 | 23.9% |
| Engineering | 0 | 0.0% |
| Multidisciplinary Studies | 0 | 0.0% |
| Science & Technology | 0 | 0.0% |
| Business | 0 | 0.0% |
| Education | 0 | 0.0% |
| Literature & Languages | 0 | 0.0% |
| Liberal Arts & History | 24 | 33.8% |
| Visual & Performing Arts | 9 | 12.7% |
| Communications | 0 | 0.0% |
| Arts & Humanities | 0 | 0.0% |
| Total | 71 | 100.0% |
Transportation & Commute in Pescadero
Vehicle Availability by Sex in Pescadero
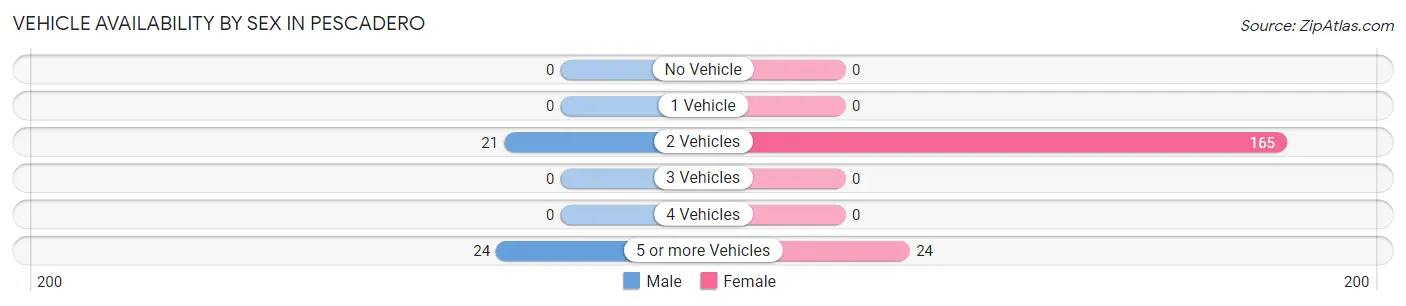
The most prevalent vehicle ownership categories in Pescadero are males with 5 or more vehicles (24, accounting for 53.3%) and females with 5 or more vehicles (24, making up 12.7%).
| Vehicles Available | Male | Female |
| No Vehicle | 0 (0.0%) | 0 (0.0%) |
| 1 Vehicle | 0 (0.0%) | 0 (0.0%) |
| 2 Vehicles | 21 (46.7%) | 165 (87.3%) |
| 3 Vehicles | 0 (0.0%) | 0 (0.0%) |
| 4 Vehicles | 0 (0.0%) | 0 (0.0%) |
| 5 or more Vehicles | 24 (53.3%) | 24 (12.7%) |
| Total | 45 (100.0%) | 189 (100.0%) |
Commute Time in Pescadero
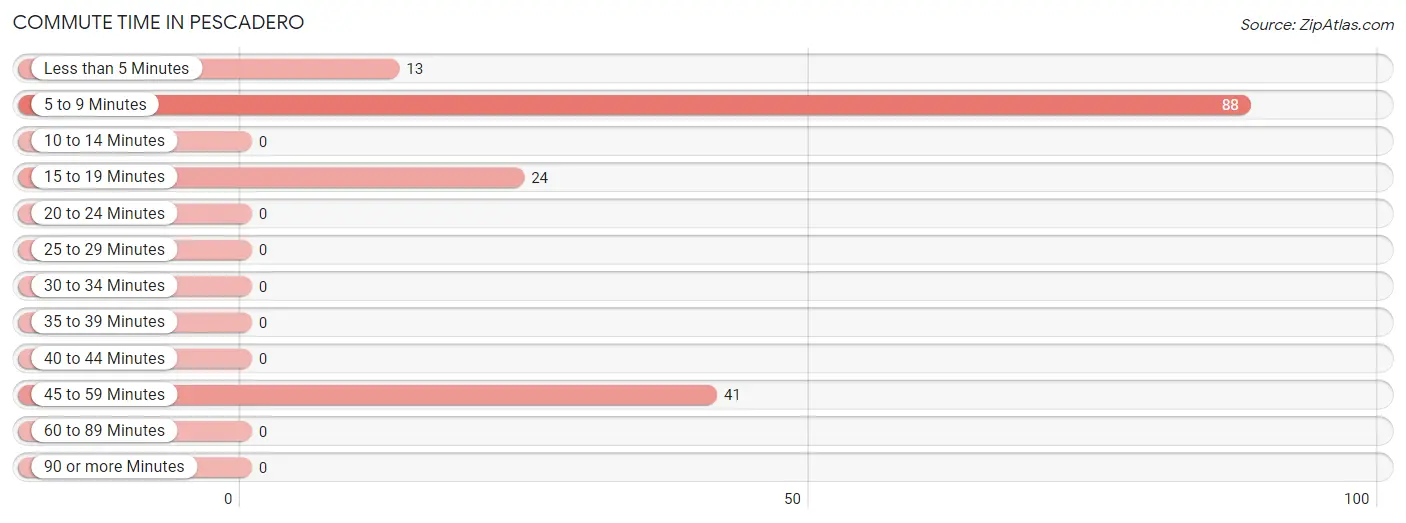
The most frequently occuring commute durations in Pescadero are 5 to 9 minutes (88 commuters, 53.0%), 45 to 59 minutes (41 commuters, 24.7%), and 15 to 19 minutes (24 commuters, 14.5%).
| Commute Time | # Commuters | % Commuters |
| Less than 5 Minutes | 13 | 7.8% |
| 5 to 9 Minutes | 88 | 53.0% |
| 10 to 14 Minutes | 0 | 0.0% |
| 15 to 19 Minutes | 24 | 14.5% |
| 20 to 24 Minutes | 0 | 0.0% |
| 25 to 29 Minutes | 0 | 0.0% |
| 30 to 34 Minutes | 0 | 0.0% |
| 35 to 39 Minutes | 0 | 0.0% |
| 40 to 44 Minutes | 0 | 0.0% |
| 45 to 59 Minutes | 41 | 24.7% |
| 60 to 89 Minutes | 0 | 0.0% |
| 90 or more Minutes | 0 | 0.0% |
Commute Time by Sex in Pescadero
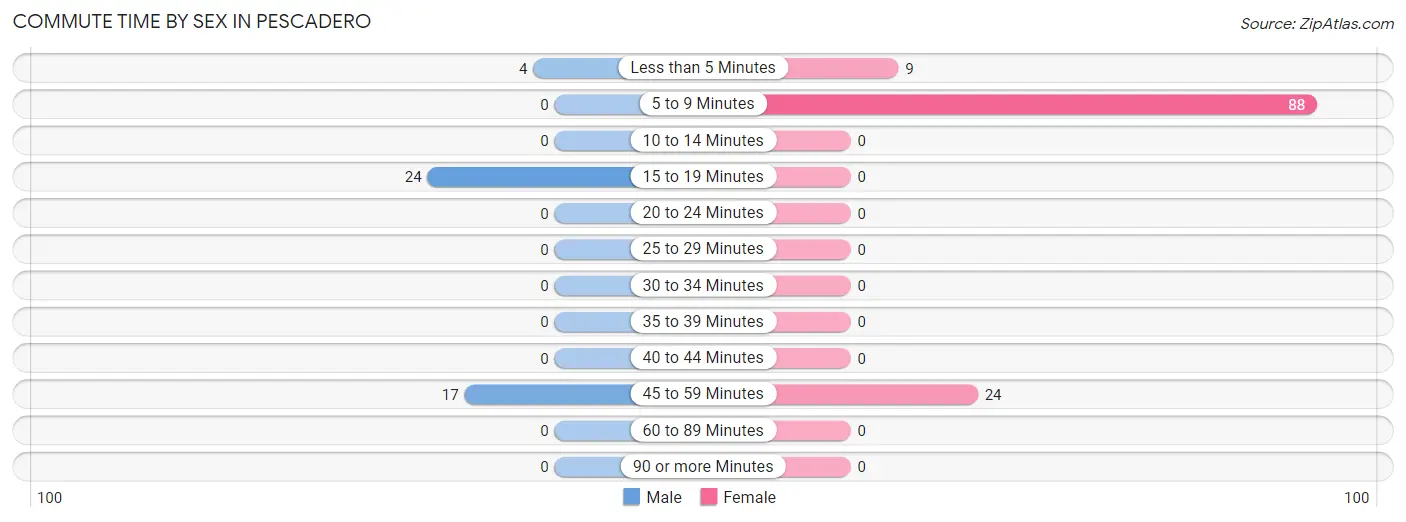
The most common commute times in Pescadero are 15 to 19 minutes (24 commuters, 53.3%) for males and 5 to 9 minutes (88 commuters, 72.7%) for females.
| Commute Time | Male | Female |
| Less than 5 Minutes | 4 (8.9%) | 9 (7.4%) |
| 5 to 9 Minutes | 0 (0.0%) | 88 (72.7%) |
| 10 to 14 Minutes | 0 (0.0%) | 0 (0.0%) |
| 15 to 19 Minutes | 24 (53.3%) | 0 (0.0%) |
| 20 to 24 Minutes | 0 (0.0%) | 0 (0.0%) |
| 25 to 29 Minutes | 0 (0.0%) | 0 (0.0%) |
| 30 to 34 Minutes | 0 (0.0%) | 0 (0.0%) |
| 35 to 39 Minutes | 0 (0.0%) | 0 (0.0%) |
| 40 to 44 Minutes | 0 (0.0%) | 0 (0.0%) |
| 45 to 59 Minutes | 17 (37.8%) | 24 (19.8%) |
| 60 to 89 Minutes | 0 (0.0%) | 0 (0.0%) |
| 90 or more Minutes | 0 (0.0%) | 0 (0.0%) |
Time of Departure to Work by Sex in Pescadero
The most frequent times of departure to work in Pescadero are 7:00 AM to 7:29 AM (24, 53.3%) for males and 9:00 AM to 9:59 AM (88, 72.7%) for females.
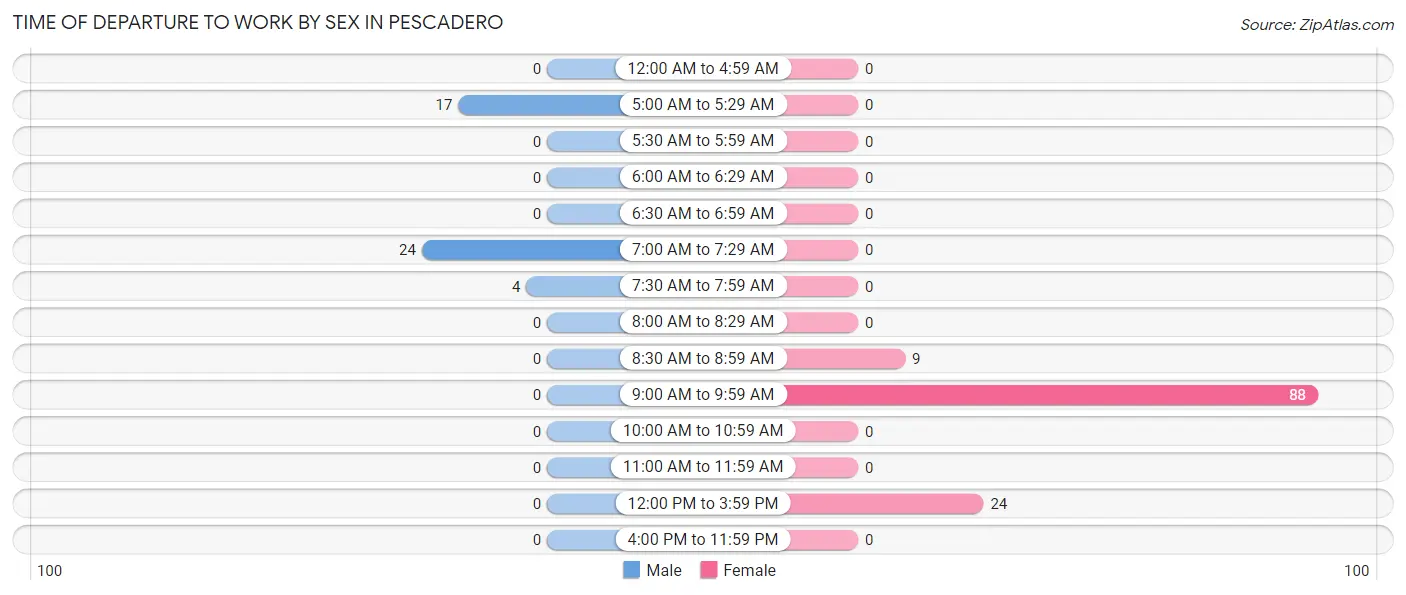
| Time of Departure | Male | Female |
| 12:00 AM to 4:59 AM | 0 (0.0%) | 0 (0.0%) |
| 5:00 AM to 5:29 AM | 17 (37.8%) | 0 (0.0%) |
| 5:30 AM to 5:59 AM | 0 (0.0%) | 0 (0.0%) |
| 6:00 AM to 6:29 AM | 0 (0.0%) | 0 (0.0%) |
| 6:30 AM to 6:59 AM | 0 (0.0%) | 0 (0.0%) |
| 7:00 AM to 7:29 AM | 24 (53.3%) | 0 (0.0%) |
| 7:30 AM to 7:59 AM | 4 (8.9%) | 0 (0.0%) |
| 8:00 AM to 8:29 AM | 0 (0.0%) | 0 (0.0%) |
| 8:30 AM to 8:59 AM | 0 (0.0%) | 9 (7.4%) |
| 9:00 AM to 9:59 AM | 0 (0.0%) | 88 (72.7%) |
| 10:00 AM to 10:59 AM | 0 (0.0%) | 0 (0.0%) |
| 11:00 AM to 11:59 AM | 0 (0.0%) | 0 (0.0%) |
| 12:00 PM to 3:59 PM | 0 (0.0%) | 24 (19.8%) |
| 4:00 PM to 11:59 PM | 0 (0.0%) | 0 (0.0%) |
| Total | 45 (100.0%) | 121 (100.0%) |
Housing Occupancy in Pescadero
Occupancy by Ownership in Pescadero
Of the total 107 dwellings in Pescadero, owner-occupied units account for 51 (47.7%), while renter-occupied units make up 56 (52.3%).
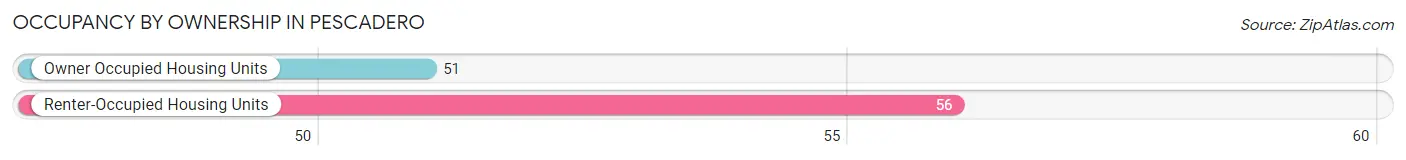
| Occupancy | # Housing Units | % Housing Units |
| Owner Occupied Housing Units | 51 | 47.7% |
| Renter-Occupied Housing Units | 56 | 52.3% |
| Total Occupied Housing Units | 107 | 100.0% |
Occupancy by Household Size in Pescadero
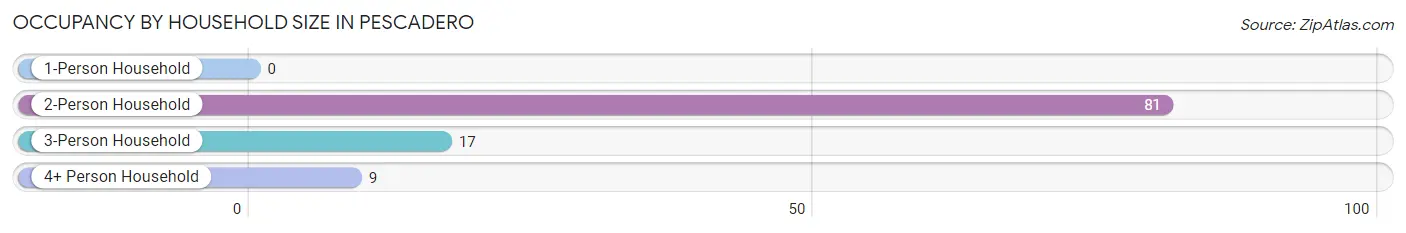
| Household Size | # Housing Units | % Housing Units |
| 1-Person Household | 0 | 0.0% |
| 2-Person Household | 81 | 75.7% |
| 3-Person Household | 17 | 15.9% |
| 4+ Person Household | 9 | 8.4% |
| Total Housing Units | 107 | 100.0% |
Occupancy by Ownership by Household Size in Pescadero
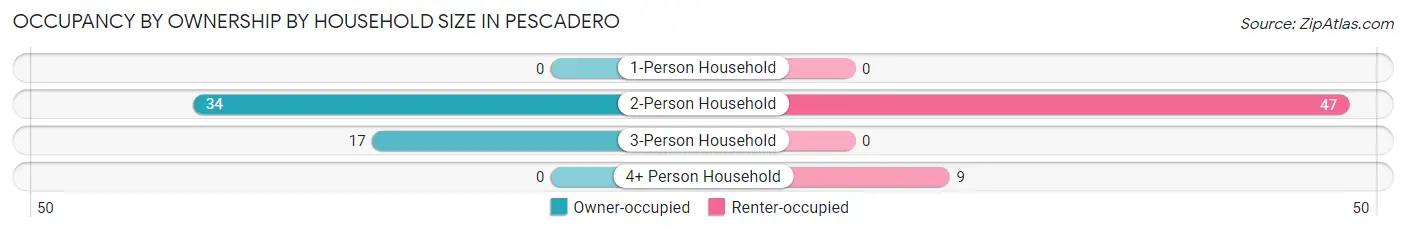
| Household Size | Owner-occupied | Renter-occupied |
| 1-Person Household | 0 (0.0%) | 0 (0.0%) |
| 2-Person Household | 34 (42.0%) | 47 (58.0%) |
| 3-Person Household | 17 (100.0%) | 0 (0.0%) |
| 4+ Person Household | 0 (0.0%) | 9 (100.0%) |
| Total Housing Units | 51 (47.7%) | 56 (52.3%) |
Occupancy by Educational Attainment in Pescadero
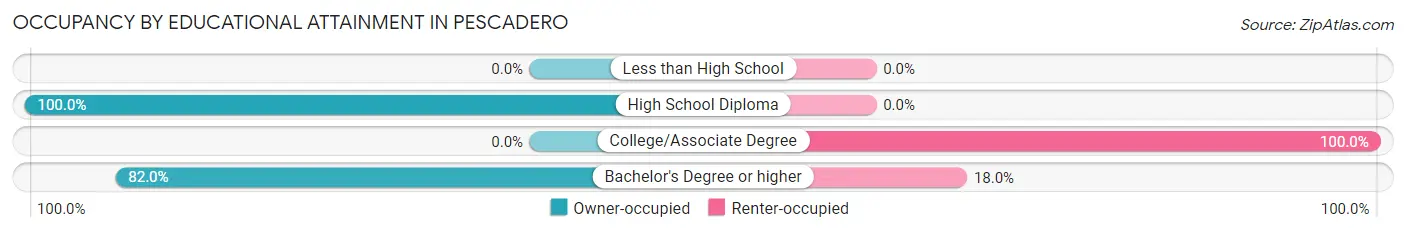
| Household Size | Owner-occupied | Renter-occupied |
| Less than High School | 0 (0.0%) | 0 (0.0%) |
| High School Diploma | 10 (100.0%) | 0 (0.0%) |
| College/Associate Degree | 0 (0.0%) | 47 (100.0%) |
| Bachelor's Degree or higher | 41 (82.0%) | 9 (18.0%) |
Occupancy by Age of Householder in Pescadero
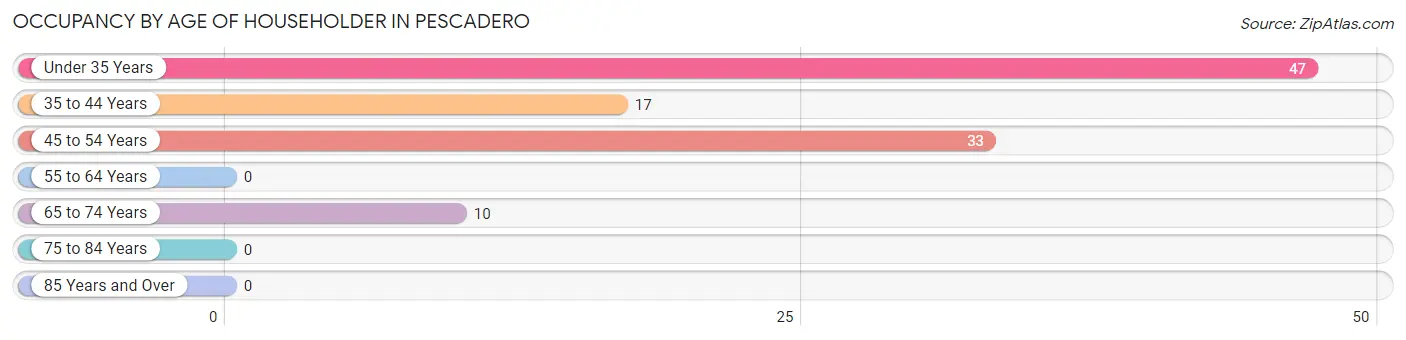
| Age Bracket | # Households | % Households |
| Under 35 Years | 47 | 43.9% |
| 35 to 44 Years | 17 | 15.9% |
| 45 to 54 Years | 33 | 30.8% |
| 55 to 64 Years | 0 | 0.0% |
| 65 to 74 Years | 10 | 9.3% |
| 75 to 84 Years | 0 | 0.0% |
| 85 Years and Over | 0 | 0.0% |
| Total | 107 | 100.0% |
Housing Finances in Pescadero
Median Income by Occupancy in Pescadero
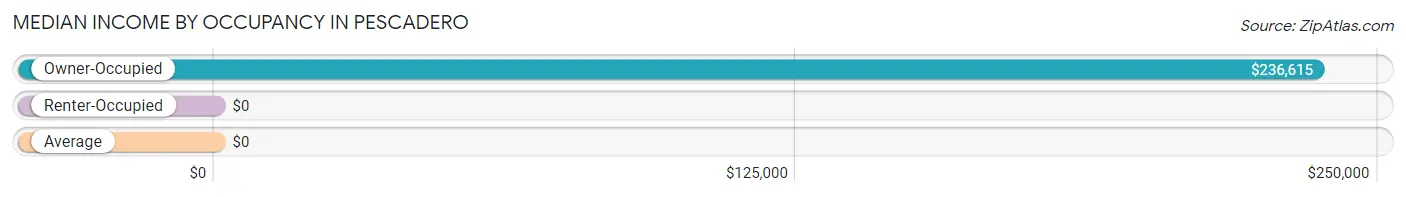
| Occupancy Type | # Households | Median Income |
| Owner-Occupied | 51 (47.7%) | $236,615 |
| Renter-Occupied | 56 (52.3%) | $0 |
| Average | 107 (100.0%) | $0 |
Occupancy by Householder Income Bracket in Pescadero
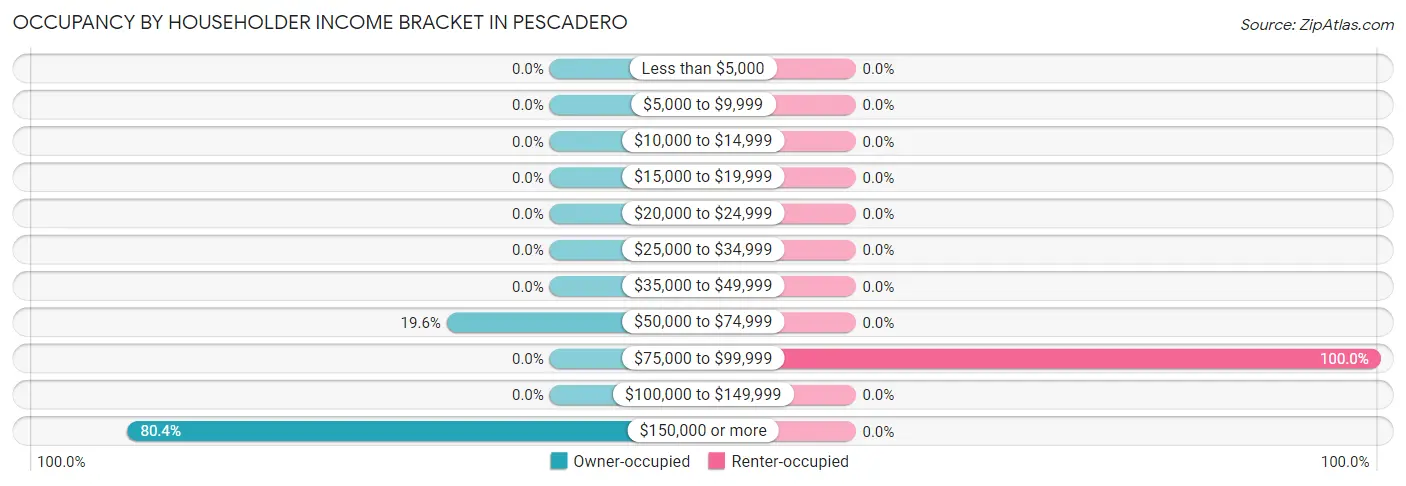
| Income Bracket | Owner-occupied | Renter-occupied |
| Less than $5,000 | 0 (0.0%) | 0 (0.0%) |
| $5,000 to $9,999 | 0 (0.0%) | 0 (0.0%) |
| $10,000 to $14,999 | 0 (0.0%) | 0 (0.0%) |
| $15,000 to $19,999 | 0 (0.0%) | 0 (0.0%) |
| $20,000 to $24,999 | 0 (0.0%) | 0 (0.0%) |
| $25,000 to $34,999 | 0 (0.0%) | 0 (0.0%) |
| $35,000 to $49,999 | 0 (0.0%) | 0 (0.0%) |
| $50,000 to $74,999 | 10 (19.6%) | 0 (0.0%) |
| $75,000 to $99,999 | 0 (0.0%) | 56 (100.0%) |
| $100,000 to $149,999 | 0 (0.0%) | 0 (0.0%) |
| $150,000 or more | 41 (80.4%) | 0 (0.0%) |
| Total | 51 (100.0%) | 56 (100.0%) |
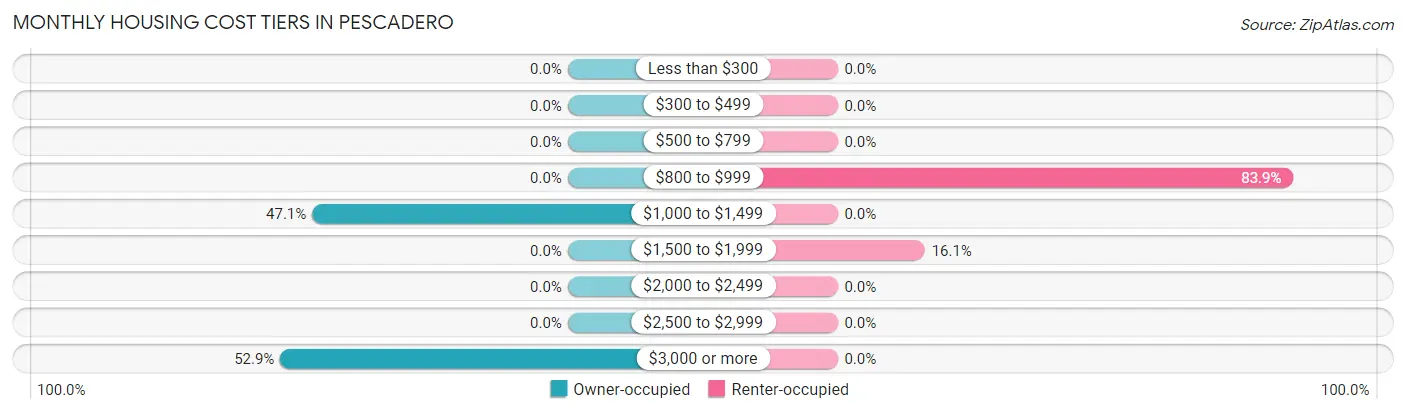
Monthly Housing Cost Tiers in Pescadero
| Monthly Cost | Owner-occupied | Renter-occupied |
| Less than $300 | 0 (0.0%) | 0 (0.0%) |
| $300 to $499 | 0 (0.0%) | 0 (0.0%) |
| $500 to $799 | 0 (0.0%) | 0 (0.0%) |
| $800 to $999 | 0 (0.0%) | 47 (83.9%) |
| $1,000 to $1,499 | 24 (47.1%) | 0 (0.0%) |
| $1,500 to $1,999 | 0 (0.0%) | 9 (16.1%) |
| $2,000 to $2,499 | 0 (0.0%) | 0 (0.0%) |
| $2,500 to $2,999 | 0 (0.0%) | 0 (0.0%) |
| $3,000 or more | 27 (52.9%) | 0 (0.0%) |
| Total | 51 (100.0%) | 56 (100.0%) |
Physical Housing Characteristics in Pescadero
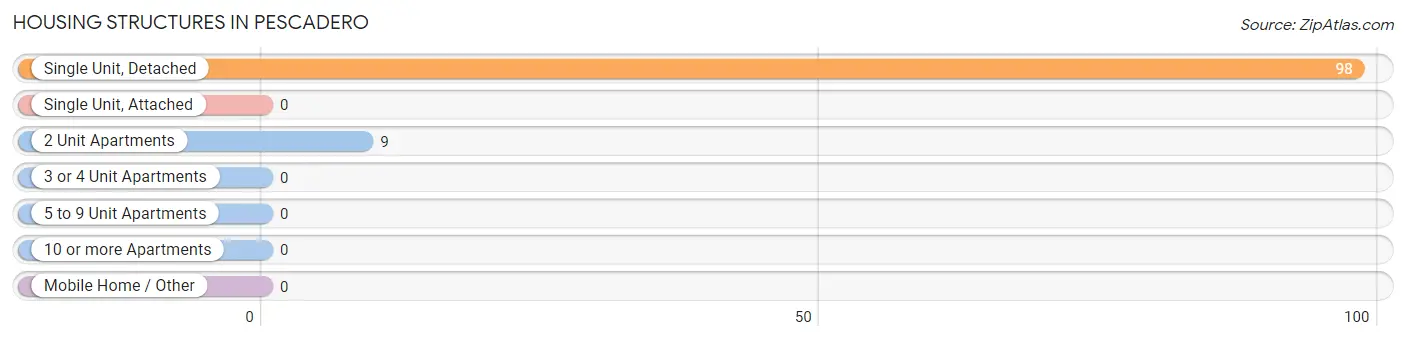
Housing Structures in Pescadero
| Structure Type | # Housing Units | % Housing Units |
| Single Unit, Detached | 98 | 91.6% |
| Single Unit, Attached | 0 | 0.0% |
| 2 Unit Apartments | 9 | 8.4% |
| 3 or 4 Unit Apartments | 0 | 0.0% |
| 5 to 9 Unit Apartments | 0 | 0.0% |
| 10 or more Apartments | 0 | 0.0% |
| Mobile Home / Other | 0 | 0.0% |
| Total | 107 | 100.0% |
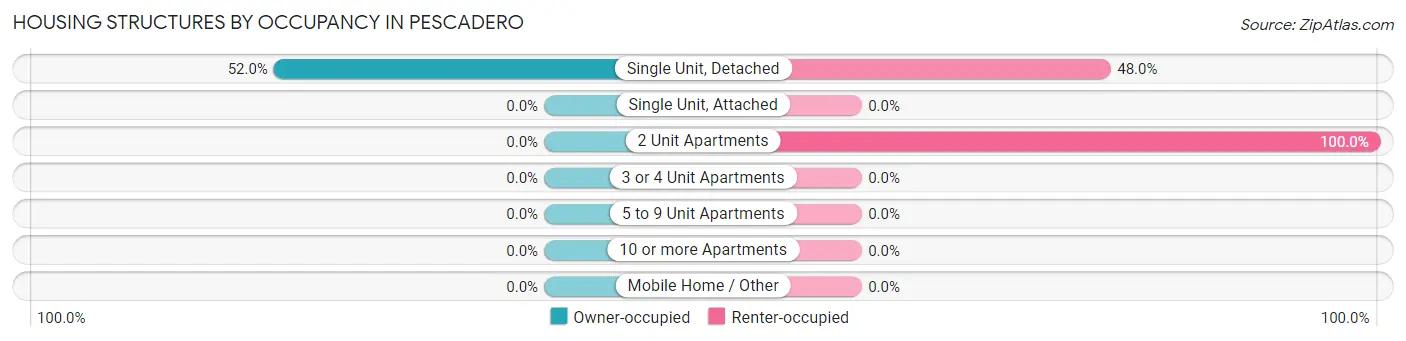
Housing Structures by Occupancy in Pescadero
| Structure Type | Owner-occupied | Renter-occupied |
| Single Unit, Detached | 51 (52.0%) | 47 (48.0%) |
| Single Unit, Attached | 0 (0.0%) | 0 (0.0%) |
| 2 Unit Apartments | 0 (0.0%) | 9 (100.0%) |
| 3 or 4 Unit Apartments | 0 (0.0%) | 0 (0.0%) |
| 5 to 9 Unit Apartments | 0 (0.0%) | 0 (0.0%) |
| 10 or more Apartments | 0 (0.0%) | 0 (0.0%) |
| Mobile Home / Other | 0 (0.0%) | 0 (0.0%) |
| Total | 51 (47.7%) | 56 (52.3%) |
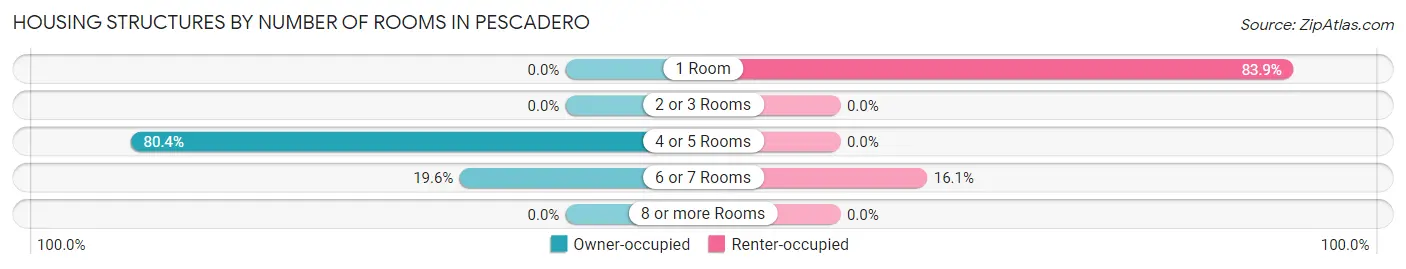
Housing Structures by Number of Rooms in Pescadero
| Number of Rooms | Owner-occupied | Renter-occupied |
| 1 Room | 0 (0.0%) | 47 (83.9%) |
| 2 or 3 Rooms | 0 (0.0%) | 0 (0.0%) |
| 4 or 5 Rooms | 41 (80.4%) | 0 (0.0%) |
| 6 or 7 Rooms | 10 (19.6%) | 9 (16.1%) |
| 8 or more Rooms | 0 (0.0%) | 0 (0.0%) |
| Total | 51 (100.0%) | 56 (100.0%) |
Housing Structure by Heating Type in Pescadero
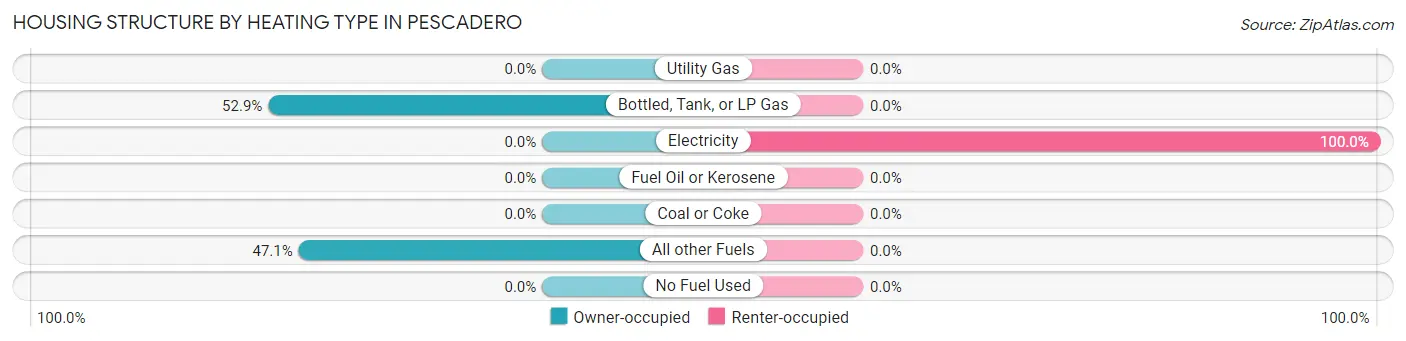
| Heating Type | Owner-occupied | Renter-occupied |
| Utility Gas | 0 (0.0%) | 0 (0.0%) |
| Bottled, Tank, or LP Gas | 27 (52.9%) | 0 (0.0%) |
| Electricity | 0 (0.0%) | 56 (100.0%) |
| Fuel Oil or Kerosene | 0 (0.0%) | 0 (0.0%) |
| Coal or Coke | 0 (0.0%) | 0 (0.0%) |
| All other Fuels | 24 (47.1%) | 0 (0.0%) |
| No Fuel Used | 0 (0.0%) | 0 (0.0%) |
| Total | 51 (100.0%) | 56 (100.0%) |
Household Vehicle Usage in Pescadero
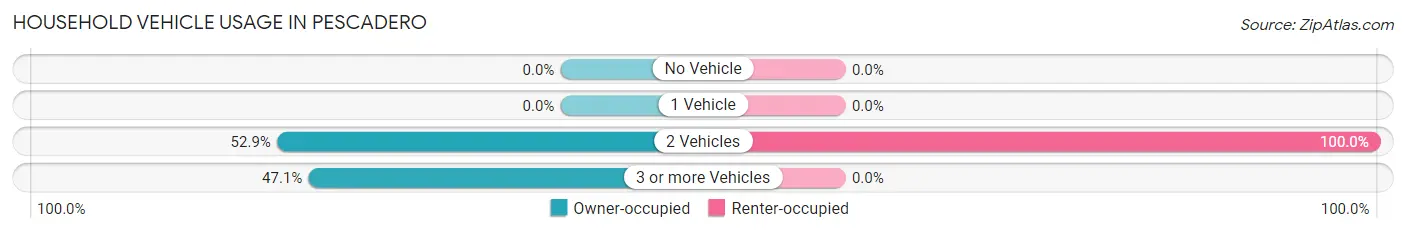
| Vehicles per Household | Owner-occupied | Renter-occupied |
| No Vehicle | 0 (0.0%) | 0 (0.0%) |
| 1 Vehicle | 0 (0.0%) | 0 (0.0%) |
| 2 Vehicles | 27 (52.9%) | 56 (100.0%) |
| 3 or more Vehicles | 24 (47.1%) | 0 (0.0%) |
| Total | 51 (100.0%) | 56 (100.0%) |
Real Estate & Mortgages in Pescadero
Real Estate and Mortgage Overview in Pescadero
| Characteristic | Without Mortgage | With Mortgage |
| Housing Units | 34 | 17 |
| Median Property Value | - | - |
| Median Household Income | - | - |
| Monthly Housing Costs | - | - |
| Real Estate Taxes | - | - |
Property Value by Mortgage Status in Pescadero
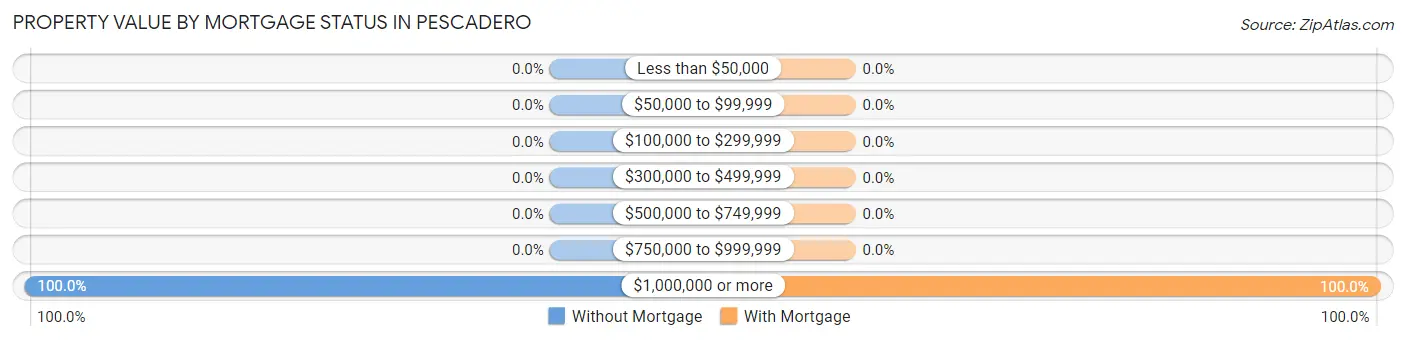
| Property Value | Without Mortgage | With Mortgage |
| Less than $50,000 | 0 (0.0%) | 0 (0.0%) |
| $50,000 to $99,999 | 0 (0.0%) | 0 (0.0%) |
| $100,000 to $299,999 | 0 (0.0%) | 0 (0.0%) |
| $300,000 to $499,999 | 0 (0.0%) | 0 (0.0%) |
| $500,000 to $749,999 | 0 (0.0%) | 0 (0.0%) |
| $750,000 to $999,999 | 0 (0.0%) | 0 (0.0%) |
| $1,000,000 or more | 34 (100.0%) | 17 (100.0%) |
| Total | 34 (100.0%) | 17 (100.0%) |
Household Income by Mortgage Status in Pescadero
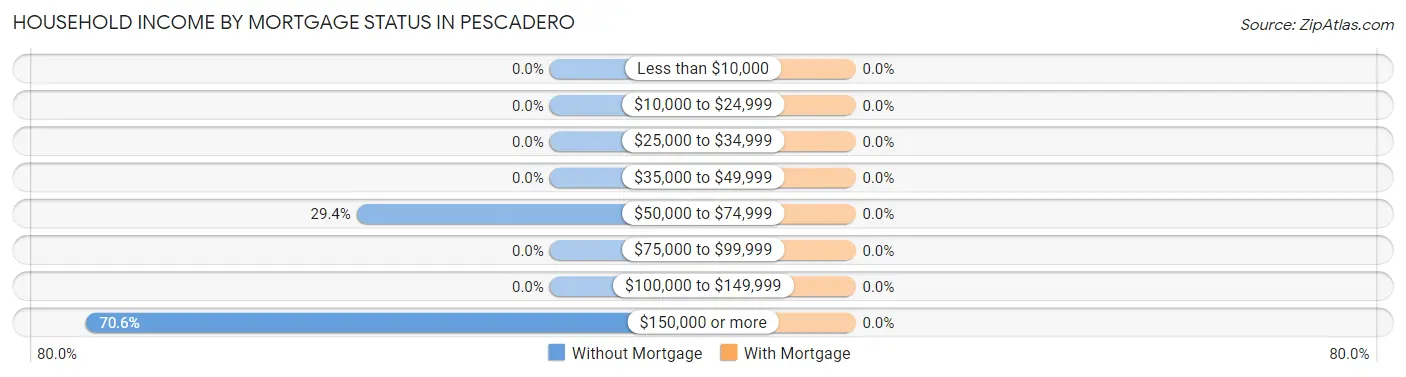
| Household Income | Without Mortgage | With Mortgage |
| Less than $10,000 | 0 (0.0%) | 0 (0.0%) |
| $10,000 to $24,999 | 0 (0.0%) | 0 (0.0%) |
| $25,000 to $34,999 | 0 (0.0%) | 0 (0.0%) |
| $35,000 to $49,999 | 0 (0.0%) | 0 (0.0%) |
| $50,000 to $74,999 | 10 (29.4%) | 0 (0.0%) |
| $75,000 to $99,999 | 0 (0.0%) | 0 (0.0%) |
| $100,000 to $149,999 | 0 (0.0%) | 0 (0.0%) |
| $150,000 or more | 24 (70.6%) | 0 (0.0%) |
| Total | 34 (100.0%) | 17 (100.0%) |
Property Value to Household Income Ratio in Pescadero
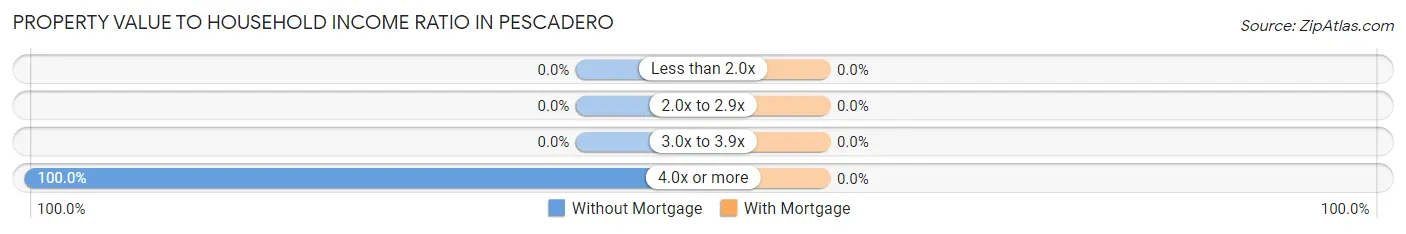
| Value-to-Income Ratio | Without Mortgage | With Mortgage |
| Less than 2.0x | 0 (0.0%) | 0 (0.0%) |
| 2.0x to 2.9x | 0 (0.0%) | 0 (0.0%) |
| 3.0x to 3.9x | 0 (0.0%) | 0 (0.0%) |
| 4.0x or more | 34 (100.0%) | 0 (0.0%) |
| Total | 34 (100.0%) | 17 (100.0%) |
Real Estate Taxes by Mortgage Status in Pescadero
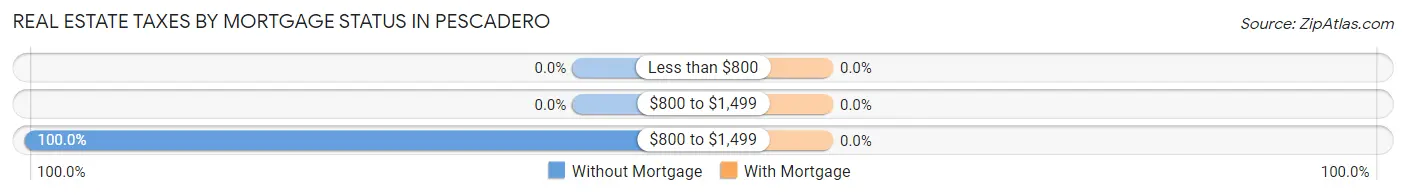
| Property Taxes | Without Mortgage | With Mortgage |
| Less than $800 | 0 (0.0%) | 0 (0.0%) |
| $800 to $1,499 | 0 (0.0%) | 0 (0.0%) |
| $800 to $1,499 | 34 (100.0%) | 0 (0.0%) |
| Total | 34 (100.0%) | 17 (100.0%) |
Health & Disability in Pescadero
Health Insurance Coverage by Age in Pescadero
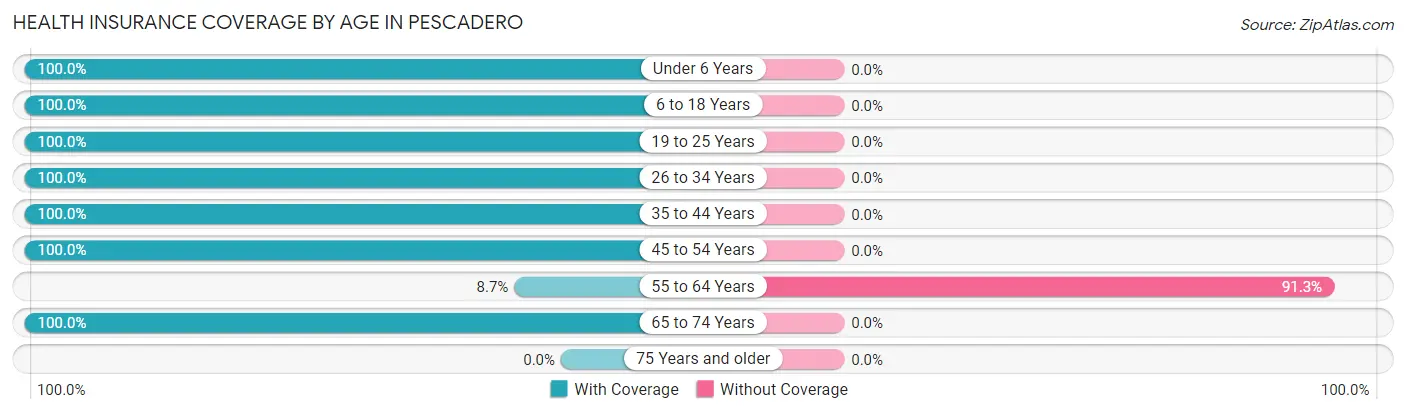
| Age Bracket | With Coverage | Without Coverage |
| Under 6 Years | 23 (100.0%) | 0 (0.0%) |
| 6 to 18 Years | 30 (100.0%) | 0 (0.0%) |
| 19 to 25 Years | 47 (100.0%) | 0 (0.0%) |
| 26 to 34 Years | 21 (100.0%) | 0 (0.0%) |
| 35 to 44 Years | 129 (100.0%) | 0 (0.0%) |
| 45 to 54 Years | 33 (100.0%) | 0 (0.0%) |
| 55 to 64 Years | 4 (8.7%) | 42 (91.3%) |
| 65 to 74 Years | 20 (100.0%) | 0 (0.0%) |
| 75 Years and older | 0 (0.0%) | 0 (0.0%) |
| Total | 307 (88.0%) | 42 (12.0%) |
Health Insurance Coverage by Citizenship Status in Pescadero

| Citizenship Status | With Coverage | Without Coverage |
| Native Born | 23 (100.0%) | 0 (0.0%) |
| Foreign Born, Citizen | 30 (100.0%) | 0 (0.0%) |
| Foreign Born, not a Citizen | 47 (100.0%) | 0 (0.0%) |
Health Insurance Coverage by Household Income in Pescadero
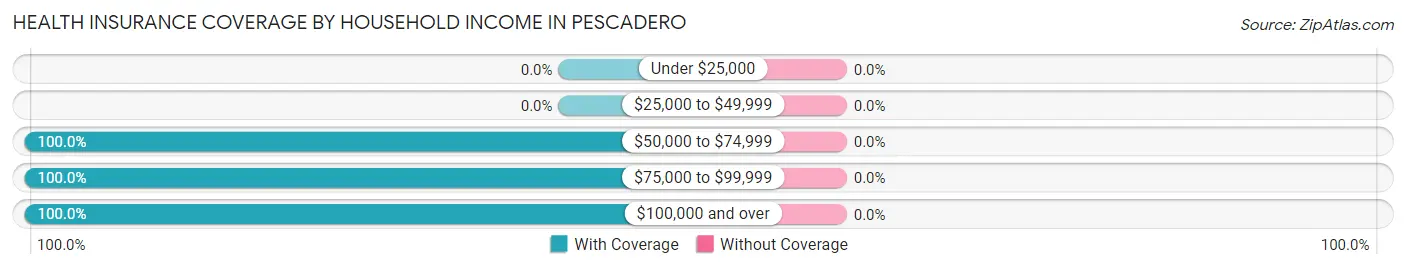
| Household Income | With Coverage | Without Coverage |
| Under $25,000 | 0 (0.0%) | 0 (0.0%) |
| $25,000 to $49,999 | 0 (0.0%) | 0 (0.0%) |
| $50,000 to $74,999 | 20 (100.0%) | 0 (0.0%) |
| $75,000 to $99,999 | 178 (100.0%) | 0 (0.0%) |
| $100,000 and over | 109 (100.0%) | 0 (0.0%) |
Public vs Private Health Insurance Coverage by Age in Pescadero
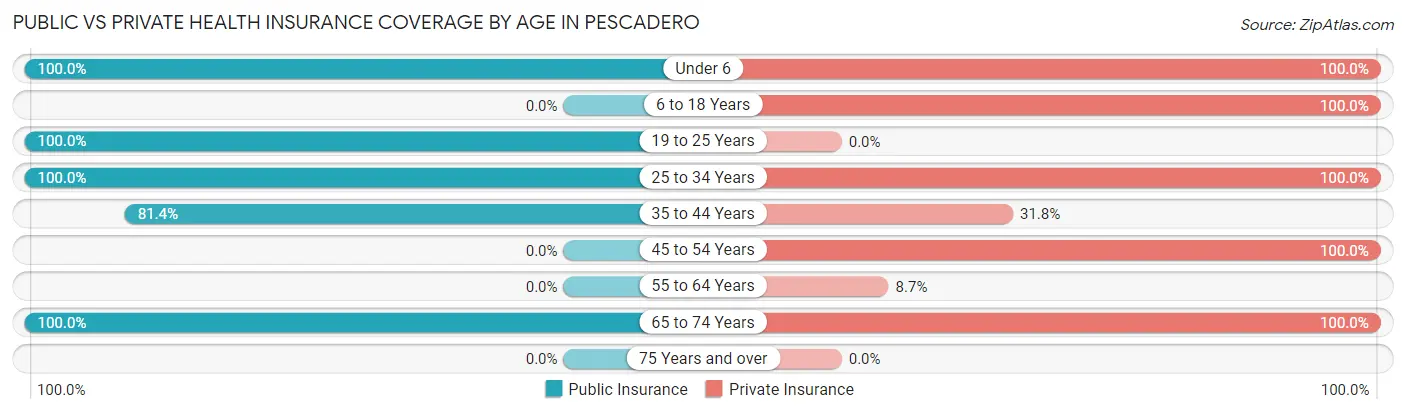
| Age Bracket | Public Insurance | Private Insurance |
| Under 6 | 23 (100.0%) | 23 (100.0%) |
| 6 to 18 Years | 0 (0.0%) | 30 (100.0%) |
| 19 to 25 Years | 47 (100.0%) | 0 (0.0%) |
| 25 to 34 Years | 21 (100.0%) | 21 (100.0%) |
| 35 to 44 Years | 105 (81.4%) | 41 (31.8%) |
| 45 to 54 Years | 0 (0.0%) | 33 (100.0%) |
| 55 to 64 Years | 0 (0.0%) | 4 (8.7%) |
| 65 to 74 Years | 20 (100.0%) | 20 (100.0%) |
| 75 Years and over | 0 (0.0%) | 0 (0.0%) |
| Total | 216 (61.9%) | 172 (49.3%) |
Disability Status by Sex by Age in Pescadero
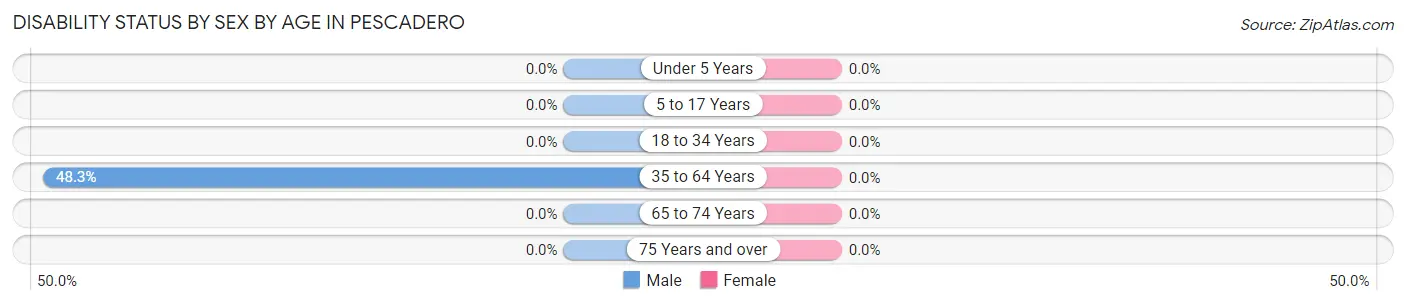
| Age Bracket | Male | Female |
| Under 5 Years | 0 (0.0%) | 0 (0.0%) |
| 5 to 17 Years | 0 (0.0%) | 0 (0.0%) |
| 18 to 34 Years | 0 (0.0%) | 0 (0.0%) |
| 35 to 64 Years | 42 (48.3%) | 0 (0.0%) |
| 65 to 74 Years | 0 (0.0%) | 0 (0.0%) |
| 75 Years and over | 0 (0.0%) | 0 (0.0%) |
Disability Class by Sex by Age in Pescadero
Disability Class: Hearing Difficulty
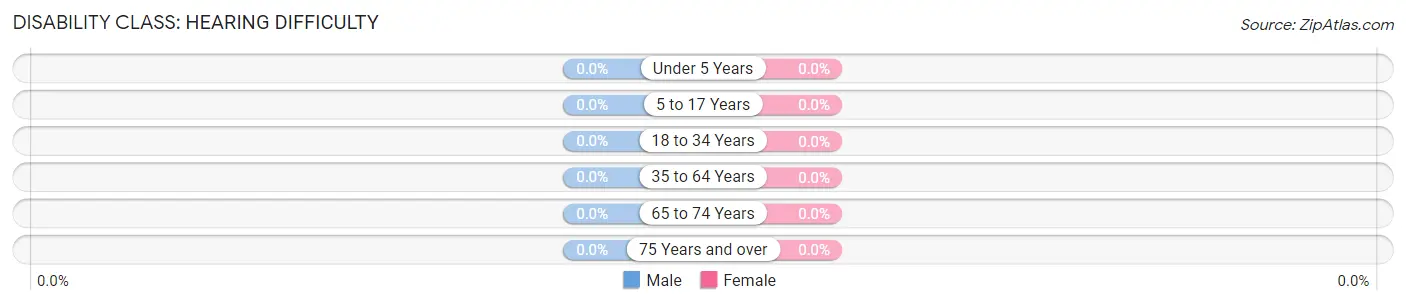
| Age Bracket | Male | Female |
| Under 5 Years | 0 (0.0%) | 0 (0.0%) |
| 5 to 17 Years | 0 (0.0%) | 0 (0.0%) |
| 18 to 34 Years | 0 (0.0%) | 0 (0.0%) |
| 35 to 64 Years | 0 (0.0%) | 0 (0.0%) |
| 65 to 74 Years | 0 (0.0%) | 0 (0.0%) |
| 75 Years and over | 0 (0.0%) | 0 (0.0%) |
Disability Class: Vision Difficulty
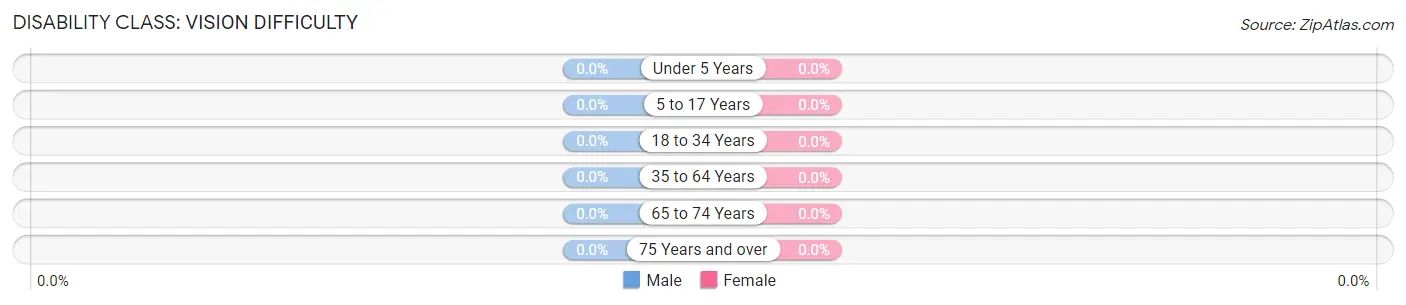
| Age Bracket | Male | Female |
| Under 5 Years | 0 (0.0%) | 0 (0.0%) |
| 5 to 17 Years | 0 (0.0%) | 0 (0.0%) |
| 18 to 34 Years | 0 (0.0%) | 0 (0.0%) |
| 35 to 64 Years | 0 (0.0%) | 0 (0.0%) |
| 65 to 74 Years | 0 (0.0%) | 0 (0.0%) |
| 75 Years and over | 0 (0.0%) | 0 (0.0%) |
Disability Class: Cognitive Difficulty

| Age Bracket | Male | Female |
| 5 to 17 Years | 0 (0.0%) | 0 (0.0%) |
| 18 to 34 Years | 0 (0.0%) | 0 (0.0%) |
| 35 to 64 Years | 42 (48.3%) | 0 (0.0%) |
| 65 to 74 Years | 0 (0.0%) | 0 (0.0%) |
| 75 Years and over | 0 (0.0%) | 0 (0.0%) |
Disability Class: Ambulatory Difficulty
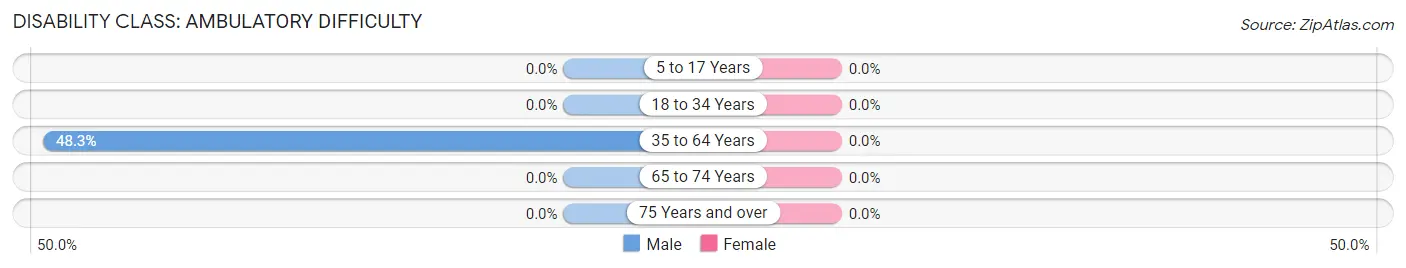
| Age Bracket | Male | Female |
| 5 to 17 Years | 0 (0.0%) | 0 (0.0%) |
| 18 to 34 Years | 0 (0.0%) | 0 (0.0%) |
| 35 to 64 Years | 42 (48.3%) | 0 (0.0%) |
| 65 to 74 Years | 0 (0.0%) | 0 (0.0%) |
| 75 Years and over | 0 (0.0%) | 0 (0.0%) |
Disability Class: Self-Care Difficulty
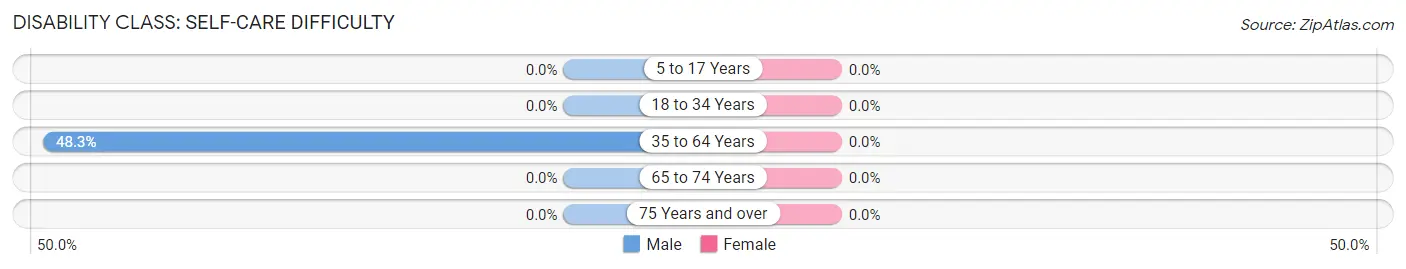
| Age Bracket | Male | Female |
| 5 to 17 Years | 0 (0.0%) | 0 (0.0%) |
| 18 to 34 Years | 0 (0.0%) | 0 (0.0%) |
| 35 to 64 Years | 42 (48.3%) | 0 (0.0%) |
| 65 to 74 Years | 0 (0.0%) | 0 (0.0%) |
| 75 Years and over | 0 (0.0%) | 0 (0.0%) |
Technology Access in Pescadero
Computing Device Access in Pescadero
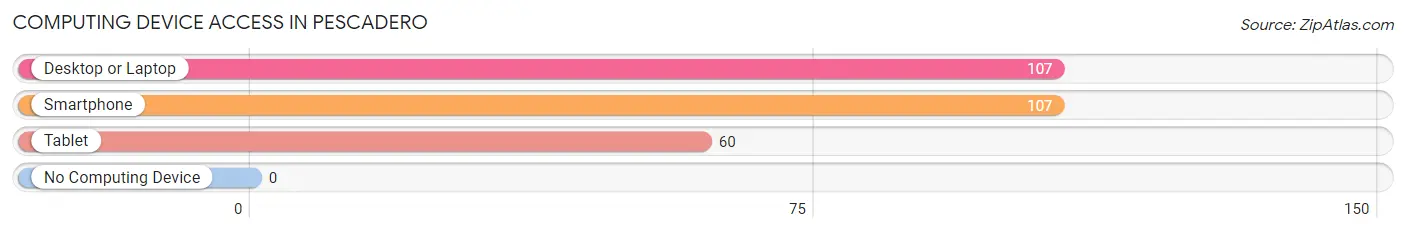
| Device Type | # Households | % Households |
| Desktop or Laptop | 107 | 100.0% |
| Smartphone | 107 | 100.0% |
| Tablet | 60 | 56.1% |
| No Computing Device | 0 | 0.0% |
| Total | 107 | 100.0% |
Internet Access in Pescadero
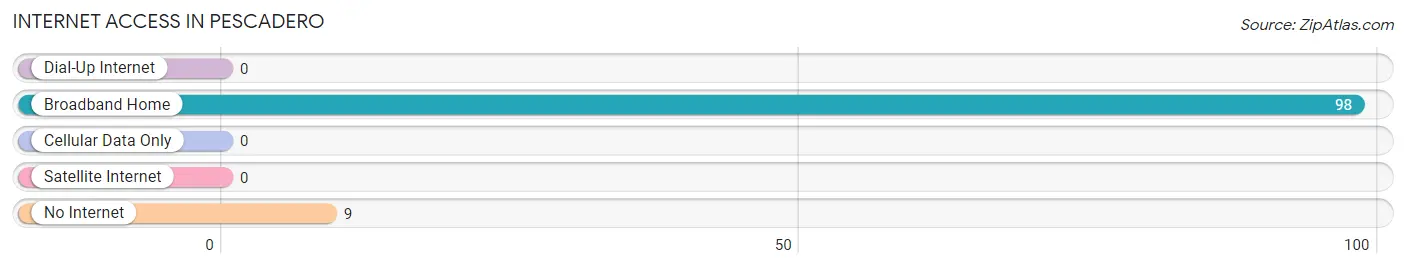
| Internet Type | # Households | % Households |
| Dial-Up Internet | 0 | 0.0% |
| Broadband Home | 98 | 91.6% |
| Cellular Data Only | 0 | 0.0% |
| Satellite Internet | 0 | 0.0% |
| No Internet | 9 | 8.4% |
| Total | 107 | 100.0% |
Pescadero Summary
Pescadero is a small coastal town located in San Mateo County, California, United States. It is situated on the Pacific Coast, about 30 miles south of San Francisco. The town has a population of approximately 2,500 people and is known for its rural atmosphere and its proximity to the ocean.
Geography
Pescadero is located on the Pacific Coast, about 30 miles south of San Francisco. The town is situated on the San Mateo County coast, between the Santa Cruz Mountains and the Pacific Ocean. The town is surrounded by rolling hills and is bordered by the Pescadero Creek to the north and the Butano Creek to the south. The town is located in a temperate climate zone, with mild temperatures year-round.
History
Pescadero was originally inhabited by the Ohlone people, who lived in the area for thousands of years before the arrival of Europeans. The first Europeans to settle in the area were Spanish missionaries, who established a mission in the area in 1791. The town was officially founded in 1856, when a group of settlers from New England arrived in the area. The town was named after the Spanish word for “fisherman”, as the settlers were primarily fishermen.
In the late 19th century, the town became a popular destination for tourists, who came to enjoy the area’s natural beauty and mild climate. The town was also known for its artichoke production, which was a major industry in the area. In the early 20th century, the town’s economy shifted to dairy farming, and the town became known for its cheese production.
Economy
Today, Pescadero’s economy is largely based on tourism and agriculture. The town is a popular destination for tourists, who come to enjoy the area’s natural beauty and mild climate. The town is also known for its artichoke production, which is still a major industry in the area. In addition, the town is home to several small businesses, including restaurants, shops, and galleries.
Demographics
As of the 2010 census, the population of Pescadero was 2,500. The town is predominantly white, with approximately 75% of the population identifying as white. The town also has a significant Hispanic population, with approximately 20% of the population identifying as Hispanic or Latino. The median household income in the town is $63,000, and the median home value is $735,000.
Conclusion
Pescadero is a small coastal town located in San Mateo County, California. The town has a population of approximately 2,500 people and is known for its rural atmosphere and its proximity to the ocean. The town’s economy is largely based on tourism and agriculture, and the town is a popular destination for tourists. The town is predominantly white, with a significant Hispanic population. The median household income in the town is $63,000, and the median home value is $735,000.
Common Questions
What is Per Capita Income in Pescadero?
Per Capita income in Pescadero is $50,067.
What is Inequality or Gini Index in Pescadero?
Inequality or Gini Index in Pescadero is 0.28.
What is the Total Population of Pescadero?
Total Population of Pescadero is 349.
What is the Total Male Population of Pescadero?
Total Male Population of Pescadero is 120.
What is the Total Female Population of Pescadero?
Total Female Population of Pescadero is 229.
What is the Ratio of Males per 100 Females in Pescadero?
There are 52.40 Males per 100 Females in Pescadero.
What is the Ratio of Females per 100 Males in Pescadero?
There are 190.83 Females per 100 Males in Pescadero.
What is the Median Population Age in Pescadero?
Median Population Age in Pescadero is 41.3 Years.
What is the Average Family Size in Pescadero
Average Family Size in Pescadero is 2.9 People.
What is the Average Household Size in Pescadero
Average Household Size in Pescadero is 2.9 People.
How Large is the Labor Force in Pescadero?
There are 234 People in the Labor Forcein in Pescadero.
What is the Percentage of People in the Labor Force in Pescadero?
75.0% of People are in the Labor Force in Pescadero.