Garnet, CA Map & Demographics
Garnet Map
Garnet Overview
$22,604
PER CAPITA INCOME
$68,839
AVG FAMILY INCOME
$61,021
AVG HOUSEHOLD INCOME
36.7%
WAGE / INCOME GAP [ % ]
63.3¢/ $1
WAGE / INCOME GAP [ $ ]
0.41
INEQUALITY / GINI INDEX
7,328
TOTAL POPULATION
3,760
MALE POPULATION
3,568
FEMALE POPULATION
105.38
MALES / 100 FEMALES
94.89
FEMALES / 100 MALES
36.5
MEDIAN AGE
3.9
AVG FAMILY SIZE
3.4
AVG HOUSEHOLD SIZE
3,250
LABOR FORCE [ PEOPLE ]
59.8%
PERCENT IN LABOR FORCE
3.4%
UNEMPLOYMENT RATE
Income in Garnet
Income Overview in Garnet
Per Capita Income in Garnet is $22,604, while median incomes of families and households are $68,839 and $61,021 respectively.
| Characteristic | Number | Measure |
| Per Capita Income | 7,328 | $22,604 |
| Median Family Income | 1,697 | $68,839 |
| Mean Family Income | 1,697 | $82,159 |
| Median Household Income | 2,179 | $61,021 |
| Mean Household Income | 2,179 | $72,636 |
| Income Deficit | 1,697 | $0 |
| Wage / Income Gap (%) | 7,328 | 36.69% |
| Wage / Income Gap ($) | 7,328 | 63.31¢ per $1 |
| Gini / Inequality Index | 7,328 | 0.41 |
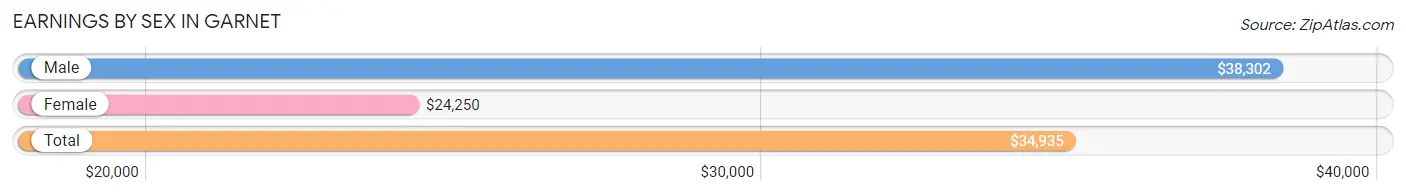
Earnings by Sex in Garnet
Average Earnings in Garnet are $34,935, $38,302 for men and $24,250 for women, a difference of 36.7%.
| Sex | Number | Average Earnings |
| Male | 1,972 (58.4%) | $38,302 |
| Female | 1,406 (41.6%) | $24,250 |
| Total | 3,378 (100.0%) | $34,935 |
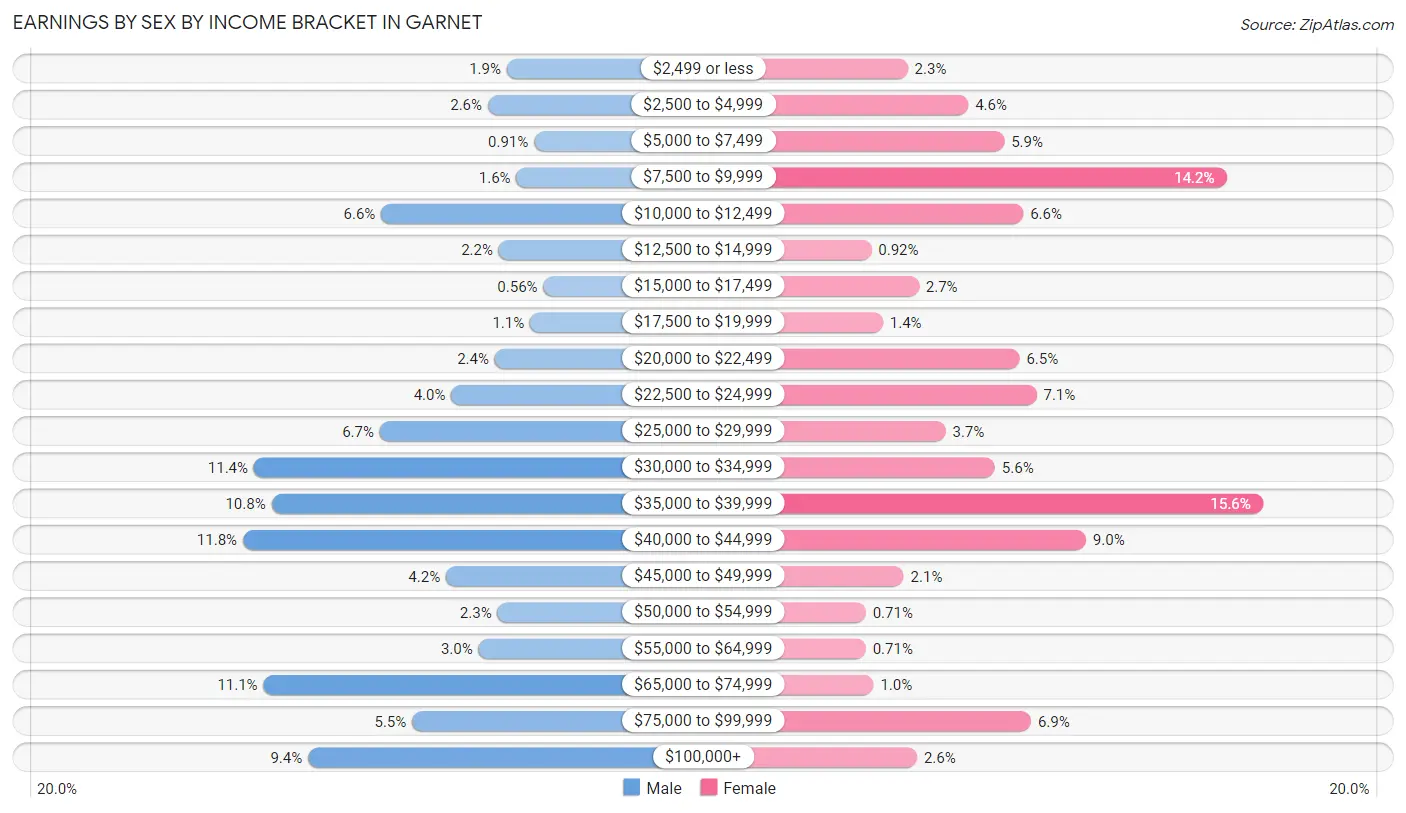
Earnings by Sex by Income Bracket in Garnet
The most common earnings brackets in Garnet are $40,000 to $44,999 for men (233 | 11.8%) and $35,000 to $39,999 for women (219 | 15.6%).
| Income | Male | Female |
| $2,499 or less | 38 (1.9%) | 32 (2.3%) |
| $2,500 to $4,999 | 52 (2.6%) | 64 (4.5%) |
| $5,000 to $7,499 | 18 (0.9%) | 83 (5.9%) |
| $7,500 to $9,999 | 31 (1.6%) | 200 (14.2%) |
| $10,000 to $12,499 | 131 (6.6%) | 93 (6.6%) |
| $12,500 to $14,999 | 44 (2.2%) | 13 (0.9%) |
| $15,000 to $17,499 | 11 (0.6%) | 38 (2.7%) |
| $17,500 to $19,999 | 21 (1.1%) | 19 (1.3%) |
| $20,000 to $22,499 | 47 (2.4%) | 91 (6.5%) |
| $22,500 to $24,999 | 79 (4.0%) | 100 (7.1%) |
| $25,000 to $29,999 | 132 (6.7%) | 52 (3.7%) |
| $30,000 to $34,999 | 225 (11.4%) | 78 (5.6%) |
| $35,000 to $39,999 | 212 (10.7%) | 219 (15.6%) |
| $40,000 to $44,999 | 233 (11.8%) | 126 (9.0%) |
| $45,000 to $49,999 | 83 (4.2%) | 30 (2.1%) |
| $50,000 to $54,999 | 45 (2.3%) | 10 (0.7%) |
| $55,000 to $64,999 | 59 (3.0%) | 10 (0.7%) |
| $65,000 to $74,999 | 218 (11.1%) | 14 (1.0%) |
| $75,000 to $99,999 | 108 (5.5%) | 97 (6.9%) |
| $100,000+ | 185 (9.4%) | 37 (2.6%) |
| Total | 1,972 (100.0%) | 1,406 (100.0%) |
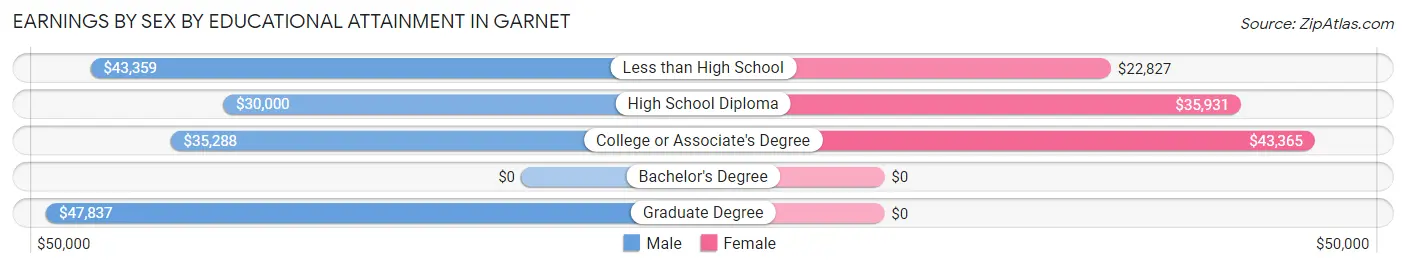
Earnings by Sex by Educational Attainment in Garnet
Average earnings in Garnet are $41,353 for men and $35,088 for women, a difference of 15.1%. Men with an educational attainment of graduate degree enjoy the highest average annual earnings of $47,837, while those with high school diploma education earn the least with $30,000. Women with an educational attainment of college or associate's degree earn the most with the average annual earnings of $43,365, while those with less than high school education have the smallest earnings of $22,827.
| Educational Attainment | Male Income | Female Income |
| Less than High School | $43,359 | $22,827 |
| High School Diploma | $30,000 | $35,931 |
| College or Associate's Degree | $35,288 | $43,365 |
| Bachelor's Degree | - | - |
| Graduate Degree | $47,837 | $0 |
| Total | $41,353 | $35,088 |
Family Income in Garnet
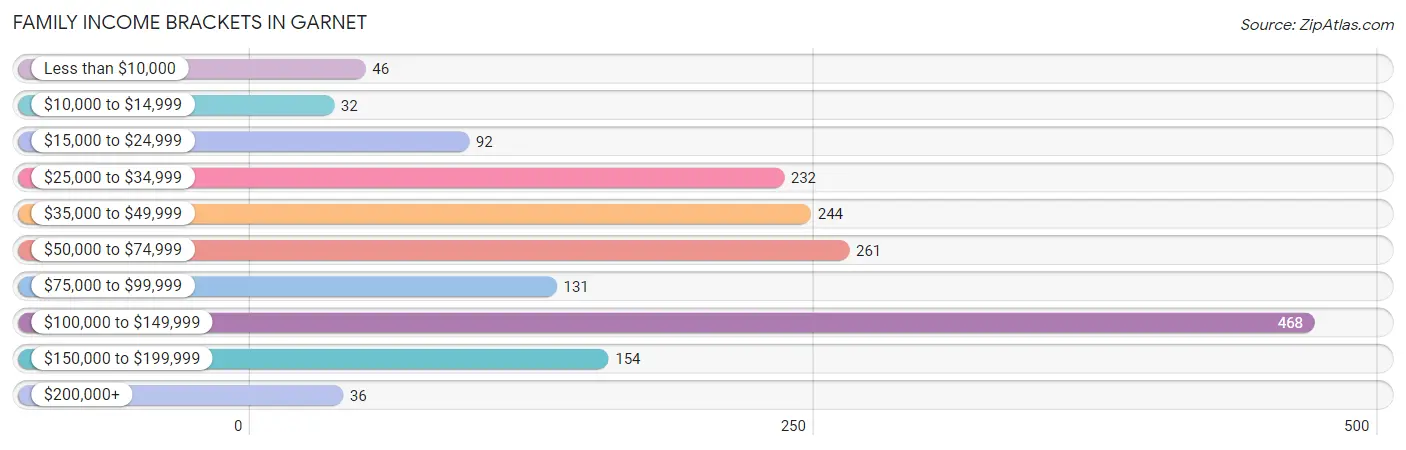
Family Income Brackets in Garnet
According to the Garnet family income data, there are 468 families falling into the $100,000 to $149,999 income range, which is the most common income bracket and makes up 27.6% of all families. Conversely, the $10,000 to $14,999 income bracket is the least frequent group with only 32 families (1.9%) belonging to this category.
| Income Bracket | # Families | % Families |
| Less than $10,000 | 46 | 2.7% |
| $10,000 to $14,999 | 32 | 1.9% |
| $15,000 to $24,999 | 92 | 5.4% |
| $25,000 to $34,999 | 232 | 13.7% |
| $35,000 to $49,999 | 244 | 14.4% |
| $50,000 to $74,999 | 261 | 15.4% |
| $75,000 to $99,999 | 131 | 7.7% |
| $100,000 to $149,999 | 468 | 27.6% |
| $150,000 to $199,999 | 154 | 9.1% |
| $200,000+ | 36 | 2.1% |
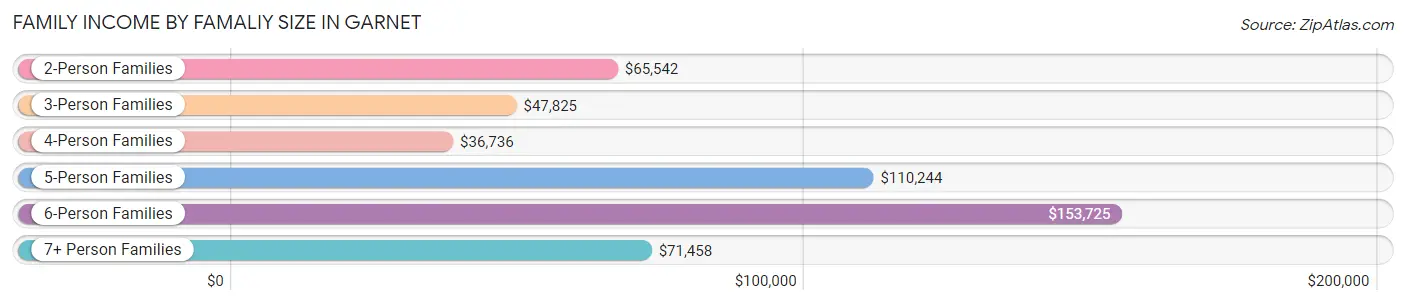
Family Income by Famaliy Size in Garnet
6-person families (159 | 9.4%) account for the highest median family income in Garnet with $153,725 per family, while 2-person families (525 | 30.9%) have the highest median income of $32,771 per family member.
| Income Bracket | # Families | Median Income |
| 2-Person Families | 525 (30.9%) | $65,542 |
| 3-Person Families | 285 (16.8%) | $47,825 |
| 4-Person Families | 329 (19.4%) | $36,736 |
| 5-Person Families | 348 (20.5%) | $110,244 |
| 6-Person Families | 159 (9.4%) | $153,725 |
| 7+ Person Families | 51 (3.0%) | $71,458 |
| Total | 1,697 (100.0%) | $68,839 |
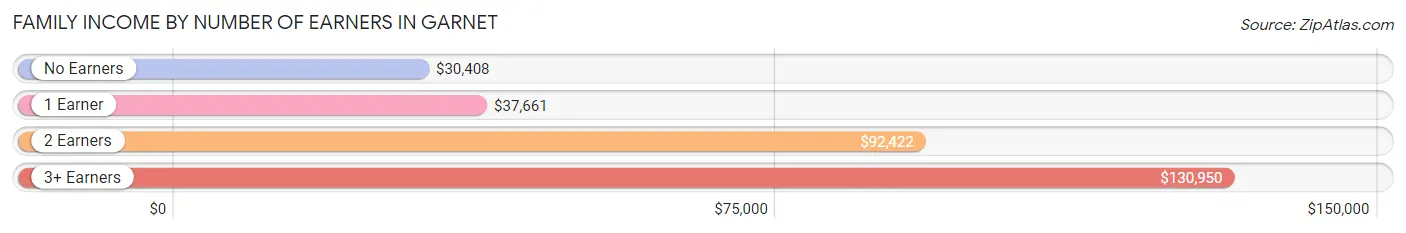
Family Income by Number of Earners in Garnet
The median family income in Garnet is $68,839, with families comprising 3+ earners (335) having the highest median family income of $130,950, while families with no earners (199) have the lowest median family income of $30,408, accounting for 19.7% and 11.7% of families, respectively.
| Number of Earners | # Families | Median Income |
| No Earners | 199 (11.7%) | $30,408 |
| 1 Earner | 458 (27.0%) | $37,661 |
| 2 Earners | 705 (41.5%) | $92,422 |
| 3+ Earners | 335 (19.7%) | $130,950 |
| Total | 1,697 (100.0%) | $68,839 |
Household Income in Garnet
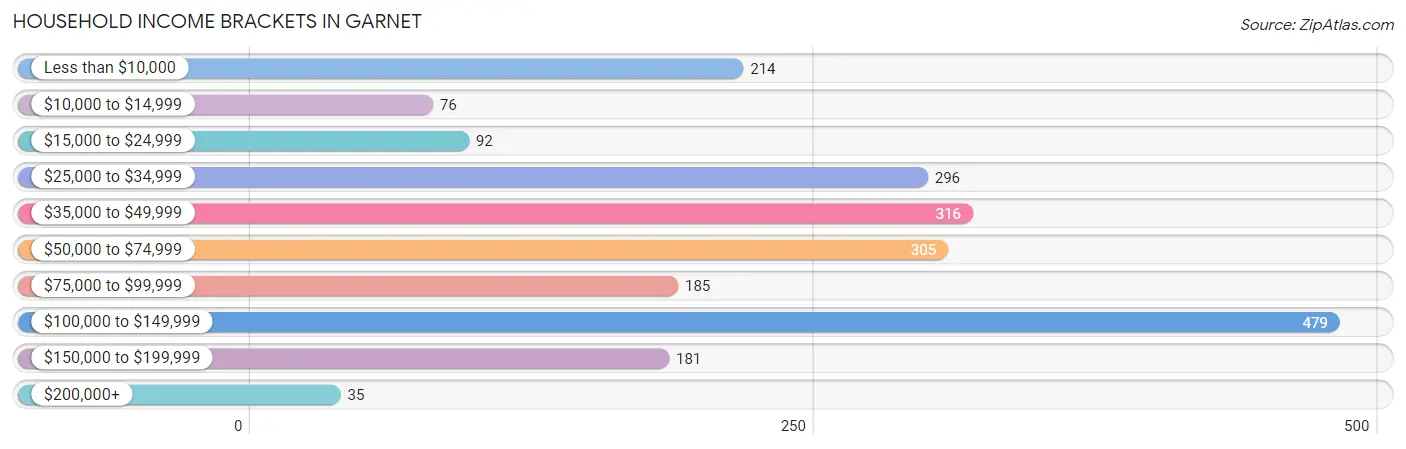
Household Income Brackets in Garnet
With 479 households falling in the category, the $100,000 to $149,999 income range is the most frequent in Garnet, accounting for 22.0% of all households. In contrast, only 35 households (1.6%) fall into the $200,000+ income bracket, making it the least populous group.
| Income Bracket | # Households | % Households |
| Less than $10,000 | 214 | 9.8% |
| $10,000 to $14,999 | 76 | 3.5% |
| $15,000 to $24,999 | 92 | 4.2% |
| $25,000 to $34,999 | 296 | 13.6% |
| $35,000 to $49,999 | 316 | 14.5% |
| $50,000 to $74,999 | 305 | 14.0% |
| $75,000 to $99,999 | 185 | 8.5% |
| $100,000 to $149,999 | 479 | 22.0% |
| $150,000 to $199,999 | 181 | 8.3% |
| $200,000+ | 35 | 1.6% |
Household Income by Householder Age in Garnet
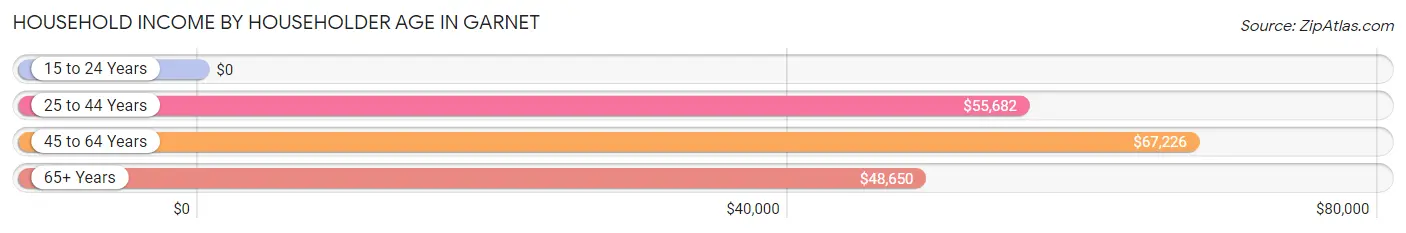
The median household income in Garnet is $61,021, with the highest median household income of $67,226 found in the 45 to 64 years age bracket for the primary householder. A total of 937 households (43.0%) fall into this category. Meanwhile, the 15 to 24 years age bracket for the primary householder has the lowest median household income of $0, with 6 households (0.3%) in this group.
| Income Bracket | # Households | Median Income |
| 15 to 24 Years | 6 (0.3%) | $0 |
| 25 to 44 Years | 848 (38.9%) | $55,682 |
| 45 to 64 Years | 937 (43.0%) | $67,226 |
| 65+ Years | 388 (17.8%) | $48,650 |
| Total | 2,179 (100.0%) | $61,021 |
Poverty in Garnet
Income Below Poverty by Sex and Age in Garnet
With 14.4% poverty level for males and 15.0% for females among the residents of Garnet, under 5 year old males and 25 to 34 year old females are the most vulnerable to poverty, with 32 males (60.4%) and 115 females (32.7%) in their respective age groups living below the poverty level.
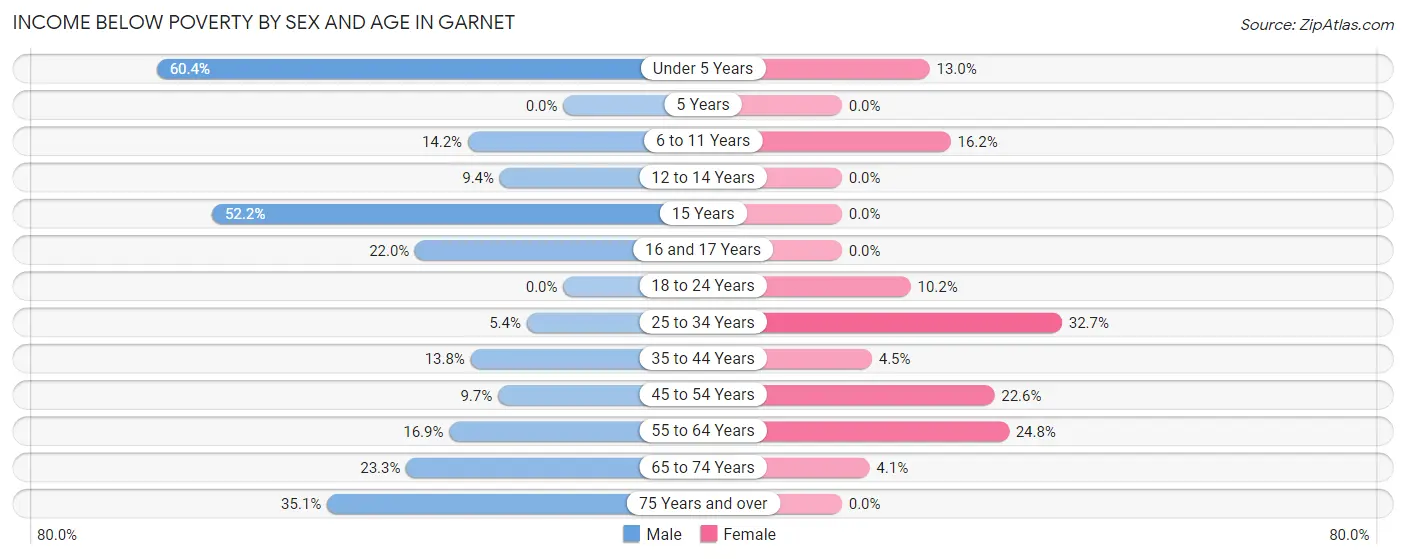
| Age Bracket | Male | Female |
| Under 5 Years | 32 (60.4%) | 49 (13.0%) |
| 5 Years | 0 (0.0%) | 0 (0.0%) |
| 6 to 11 Years | 52 (14.2%) | 83 (16.2%) |
| 12 to 14 Years | 23 (9.4%) | 0 (0.0%) |
| 15 Years | 48 (52.2%) | 0 (0.0%) |
| 16 and 17 Years | 22 (22.0%) | 0 (0.0%) |
| 18 to 24 Years | 0 (0.0%) | 39 (10.2%) |
| 25 to 34 Years | 30 (5.4%) | 115 (32.7%) |
| 35 to 44 Years | 79 (13.8%) | 17 (4.4%) |
| 45 to 54 Years | 67 (9.7%) | 139 (22.6%) |
| 55 to 64 Years | 51 (16.9%) | 86 (24.8%) |
| 65 to 74 Years | 90 (23.3%) | 8 (4.1%) |
| 75 Years and over | 47 (35.1%) | 0 (0.0%) |
| Total | 541 (14.4%) | 536 (15.0%) |
Income Above Poverty by Sex and Age in Garnet
According to the poverty statistics in Garnet, males aged 5 years and females aged 5 years are the age groups that are most secure financially, with 100.0% of males and 100.0% of females in these age groups living above the poverty line.
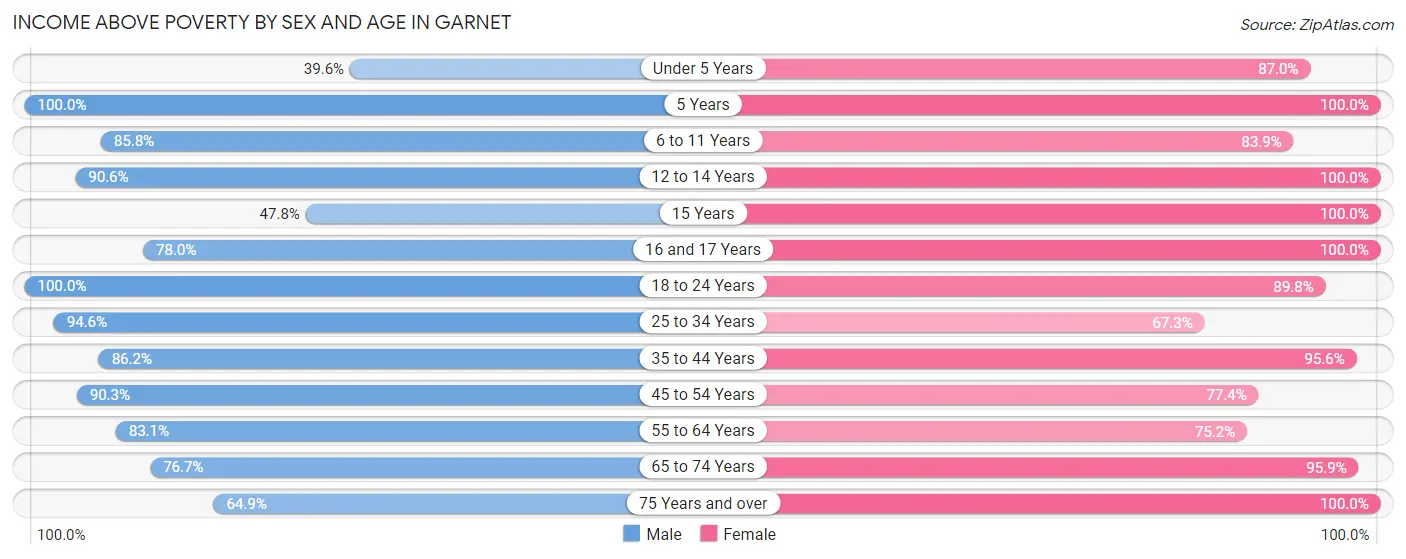
| Age Bracket | Male | Female |
| Under 5 Years | 21 (39.6%) | 327 (87.0%) |
| 5 Years | 10 (100.0%) | 80 (100.0%) |
| 6 to 11 Years | 315 (85.8%) | 431 (83.9%) |
| 12 to 14 Years | 221 (90.6%) | 93 (100.0%) |
| 15 Years | 44 (47.8%) | 64 (100.0%) |
| 16 and 17 Years | 78 (78.0%) | 50 (100.0%) |
| 18 to 24 Years | 256 (100.0%) | 343 (89.8%) |
| 25 to 34 Years | 522 (94.6%) | 237 (67.3%) |
| 35 to 44 Years | 495 (86.2%) | 365 (95.6%) |
| 45 to 54 Years | 624 (90.3%) | 475 (77.4%) |
| 55 to 64 Years | 250 (83.1%) | 261 (75.2%) |
| 65 to 74 Years | 296 (76.7%) | 187 (95.9%) |
| 75 Years and over | 87 (64.9%) | 119 (100.0%) |
| Total | 3,219 (85.6%) | 3,032 (85.0%) |
Income Below Poverty Among Married-Couple Families in Garnet
The poverty statistics for married-couple families in Garnet show that 4.4% or 52 of the total 1,189 families live below the poverty line. Families with 1 or 2 children have the highest poverty rate of 13.5%, comprising of 52 families. On the other hand, families with no children have the lowest poverty rate of 0.0%, which includes 0 families.
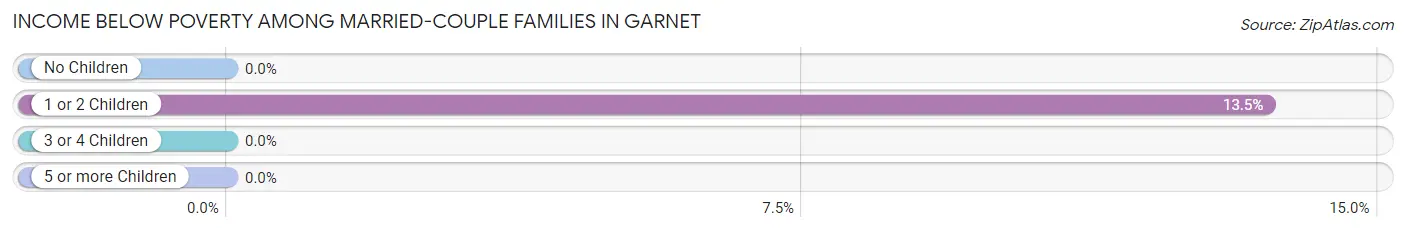
| Children | Above Poverty | Below Poverty |
| No Children | 531 (100.0%) | 0 (0.0%) |
| 1 or 2 Children | 332 (86.5%) | 52 (13.5%) |
| 3 or 4 Children | 274 (100.0%) | 0 (0.0%) |
| 5 or more Children | 0 (0.0%) | 0 (0.0%) |
| Total | 1,137 (95.6%) | 52 (4.4%) |
Income Below Poverty Among Single-Parent Households in Garnet
According to the poverty data in Garnet, 9.4% or 21 single-father households and 46.5% or 132 single-mother households are living below the poverty line. Among single-father households, those with 1 or 2 children have the highest poverty rate, with 21 households (12.9%) experiencing poverty. Likewise, among single-mother households, those with 3 or 4 children have the highest poverty rate, with 29 households (100.0%) falling below the poverty line.
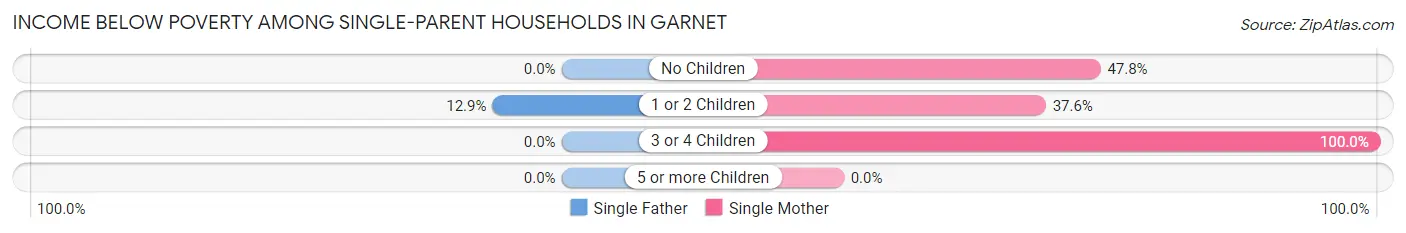
| Children | Single Father | Single Mother |
| No Children | 0 (0.0%) | 33 (47.8%) |
| 1 or 2 Children | 21 (12.9%) | 70 (37.6%) |
| 3 or 4 Children | 0 (0.0%) | 29 (100.0%) |
| 5 or more Children | 0 (0.0%) | 0 (0.0%) |
| Total | 21 (9.4%) | 132 (46.5%) |
Income Below Poverty Among Married-Couple vs Single-Parent Households in Garnet
The poverty data for Garnet shows that 52 of the married-couple family households (4.4%) and 153 of the single-parent households (30.1%) are living below the poverty level. Within the married-couple family households, those with 1 or 2 children have the highest poverty rate, with 52 households (13.5%) falling below the poverty line. Among the single-parent households, those with 3 or 4 children have the highest poverty rate, with 29 household (100.0%) living below poverty.
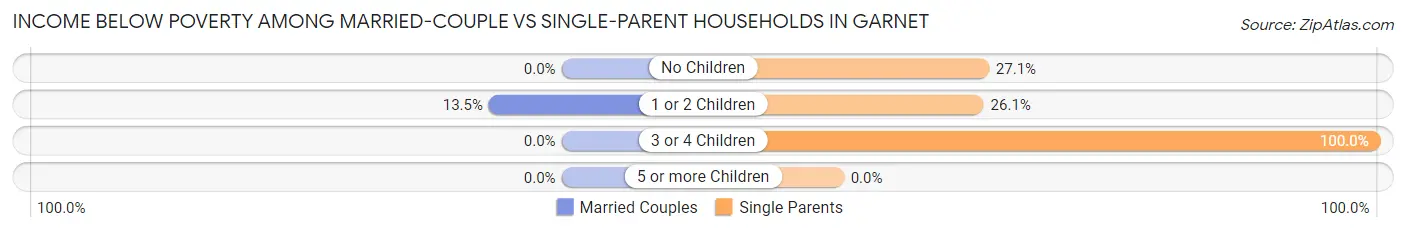
| Children | Married-Couple Families | Single-Parent Households |
| No Children | 0 (0.0%) | 33 (27.1%) |
| 1 or 2 Children | 52 (13.5%) | 91 (26.1%) |
| 3 or 4 Children | 0 (0.0%) | 29 (100.0%) |
| 5 or more Children | 0 (0.0%) | 0 (0.0%) |
| Total | 52 (4.4%) | 153 (30.1%) |
Race in Garnet
The most populous races in Garnet are Hispanic or Latino (5,894 | 80.4%), White / Caucasian (3,247 | 44.3%), and Two or more Races (2,169 | 29.6%).
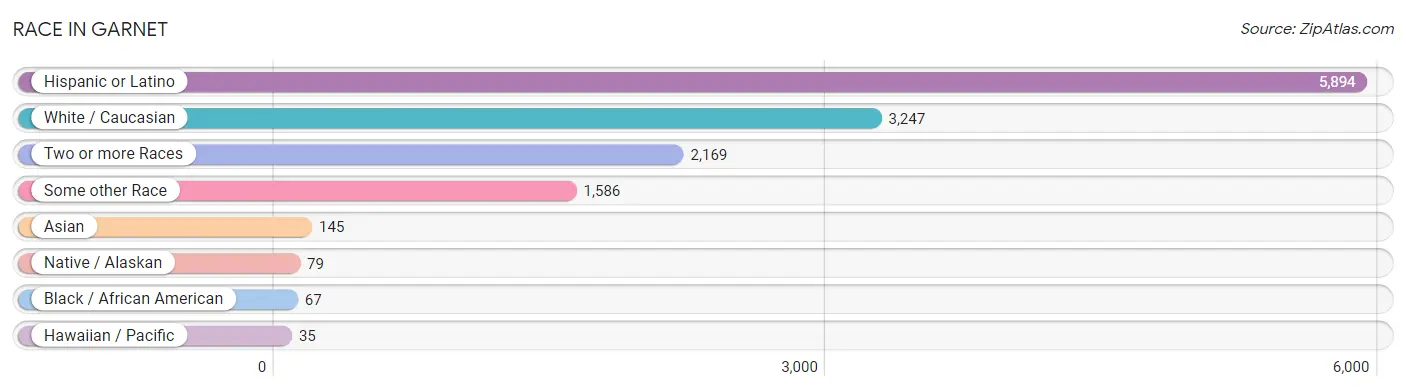
| Race | # Population | % Population |
| Asian | 145 | 2.0% |
| Black / African American | 67 | 0.9% |
| Hawaiian / Pacific | 35 | 0.5% |
| Hispanic or Latino | 5,894 | 80.4% |
| Native / Alaskan | 79 | 1.1% |
| White / Caucasian | 3,247 | 44.3% |
| Two or more Races | 2,169 | 29.6% |
| Some other Race | 1,586 | 21.6% |
| Total | 7,328 | 100.0% |
Ancestry in Garnet
The most populous ancestries reported in Garnet are Mexican (4,930 | 67.3%), Central American (643 | 8.8%), Guatemalan (626 | 8.5%), German (151 | 2.1%), and Italian (112 | 1.5%), together accounting for 88.2% of all Garnet residents.
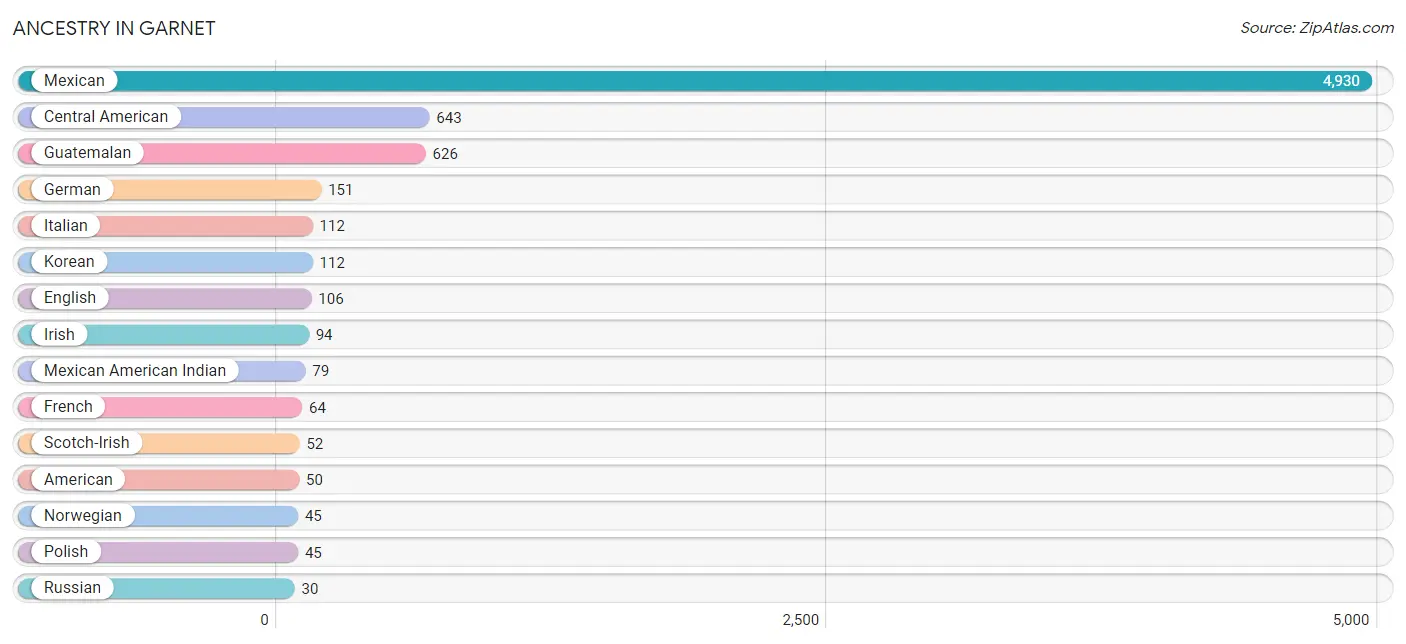
| Ancestry | # Population | % Population |
| American | 50 | 0.7% |
| Apache | 18 | 0.3% |
| Bhutanese | 25 | 0.3% |
| Canadian | 29 | 0.4% |
| Central American | 643 | 8.8% |
| Choctaw | 13 | 0.2% |
| Costa Rican | 17 | 0.2% |
| Czech | 13 | 0.2% |
| Danish | 24 | 0.3% |
| Eastern European | 14 | 0.2% |
| English | 106 | 1.5% |
| French | 64 | 0.9% |
| French Canadian | 18 | 0.3% |
| German | 151 | 2.1% |
| Guatemalan | 626 | 8.5% |
| Hungarian | 6 | 0.1% |
| Indian (Asian) | 25 | 0.3% |
| Irish | 94 | 1.3% |
| Italian | 112 | 1.5% |
| Korean | 112 | 1.5% |
| Mexican | 4,930 | 67.3% |
| Mexican American Indian | 79 | 1.1% |
| Native Hawaiian | 12 | 0.2% |
| Norwegian | 45 | 0.6% |
| Pakistani | 6 | 0.1% |
| Peruvian | 16 | 0.2% |
| Polish | 45 | 0.6% |
| Portuguese | 10 | 0.1% |
| Russian | 30 | 0.4% |
| Scotch-Irish | 52 | 0.7% |
| Scottish | 24 | 0.3% |
| Serbian | 8 | 0.1% |
| Slovak | 13 | 0.2% |
| South American | 16 | 0.2% |
| Sri Lankan | 24 | 0.3% |
| Swedish | 11 | 0.2% |
| Welsh | 22 | 0.3% | View All 37 Rows |
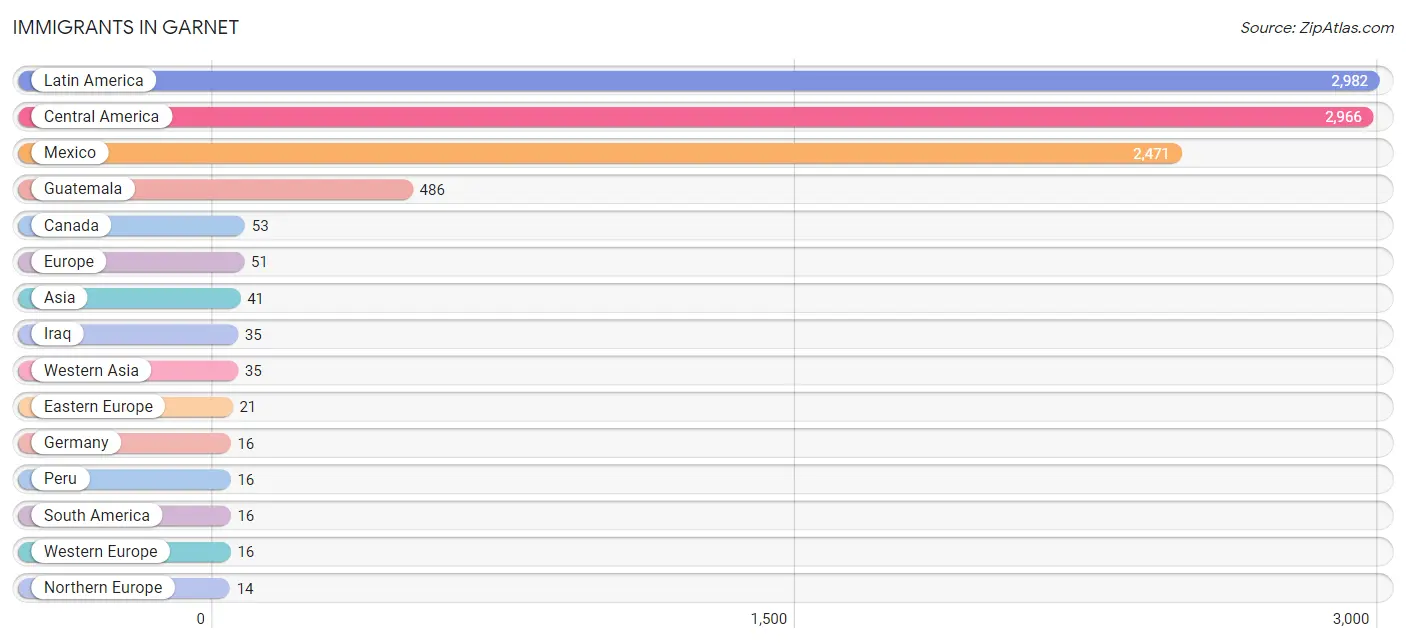
Immigrants in Garnet
The most numerous immigrant groups reported in Garnet came from Latin America (2,982 | 40.7%), Central America (2,966 | 40.5%), Mexico (2,471 | 33.7%), Guatemala (486 | 6.6%), and Canada (53 | 0.7%), together accounting for 122.2% of all Garnet residents.
| Immigration Origin | # Population | % Population |
| Asia | 41 | 0.6% |
| Canada | 53 | 0.7% |
| Central America | 2,966 | 40.5% |
| Croatia | 8 | 0.1% |
| Czechoslovakia | 13 | 0.2% |
| Eastern Europe | 21 | 0.3% |
| El Salvador | 9 | 0.1% |
| Europe | 51 | 0.7% |
| Germany | 16 | 0.2% |
| Guatemala | 486 | 6.6% |
| Iraq | 35 | 0.5% |
| Latin America | 2,982 | 40.7% |
| Mexico | 2,471 | 33.7% |
| Northern Europe | 14 | 0.2% |
| Peru | 16 | 0.2% |
| South America | 16 | 0.2% |
| South Eastern Asia | 6 | 0.1% |
| Thailand | 6 | 0.1% |
| Western Asia | 35 | 0.5% |
| Western Europe | 16 | 0.2% | View All 20 Rows |
Sex and Age in Garnet
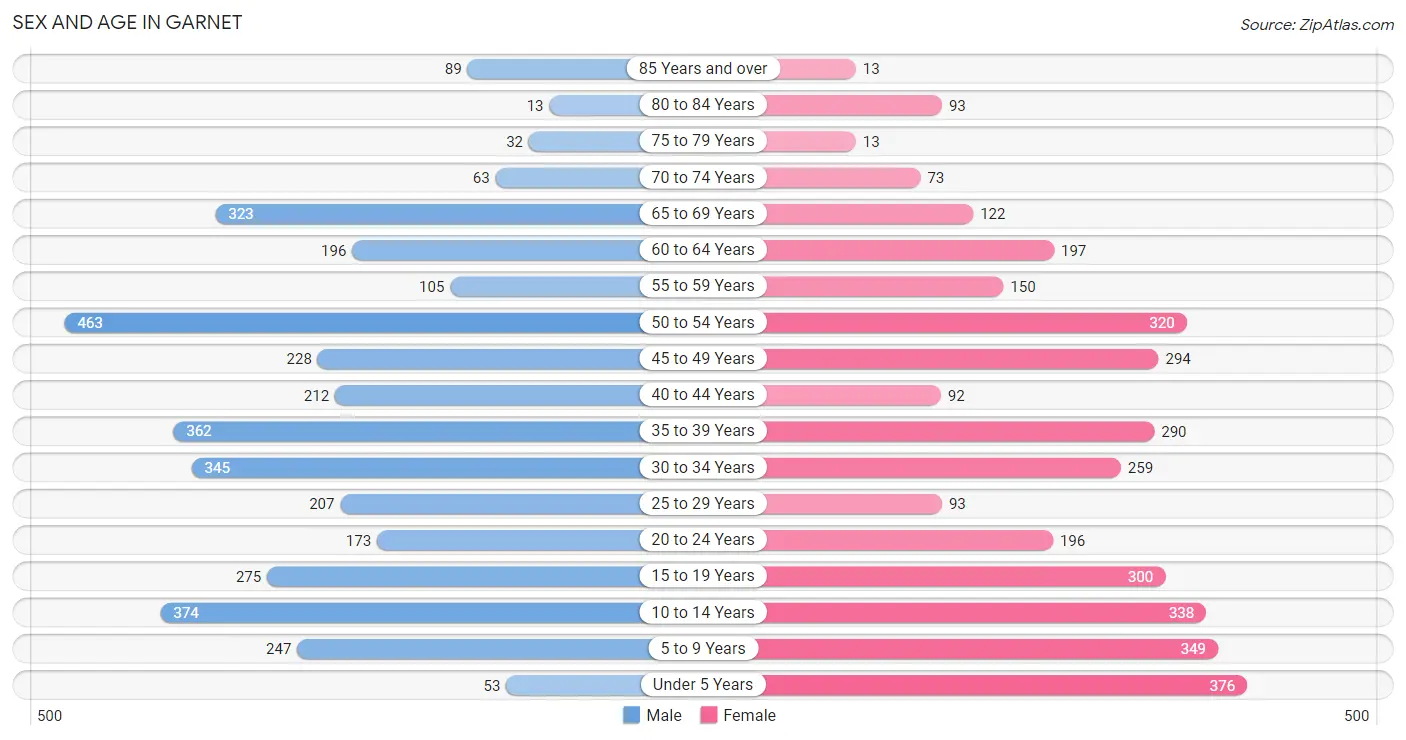
Sex and Age in Garnet
The most populous age groups in Garnet are 50 to 54 Years (463 | 12.3%) for men and Under 5 Years (376 | 10.5%) for women.
| Age Bracket | Male | Female |
| Under 5 Years | 53 (1.4%) | 376 (10.5%) |
| 5 to 9 Years | 247 (6.6%) | 349 (9.8%) |
| 10 to 14 Years | 374 (10.0%) | 338 (9.5%) |
| 15 to 19 Years | 275 (7.3%) | 300 (8.4%) |
| 20 to 24 Years | 173 (4.6%) | 196 (5.5%) |
| 25 to 29 Years | 207 (5.5%) | 93 (2.6%) |
| 30 to 34 Years | 345 (9.2%) | 259 (7.3%) |
| 35 to 39 Years | 362 (9.6%) | 290 (8.1%) |
| 40 to 44 Years | 212 (5.6%) | 92 (2.6%) |
| 45 to 49 Years | 228 (6.1%) | 294 (8.2%) |
| 50 to 54 Years | 463 (12.3%) | 320 (9.0%) |
| 55 to 59 Years | 105 (2.8%) | 150 (4.2%) |
| 60 to 64 Years | 196 (5.2%) | 197 (5.5%) |
| 65 to 69 Years | 323 (8.6%) | 122 (3.4%) |
| 70 to 74 Years | 63 (1.7%) | 73 (2.1%) |
| 75 to 79 Years | 32 (0.9%) | 13 (0.4%) |
| 80 to 84 Years | 13 (0.4%) | 93 (2.6%) |
| 85 Years and over | 89 (2.4%) | 13 (0.4%) |
| Total | 3,760 (100.0%) | 3,568 (100.0%) |
Families and Households in Garnet
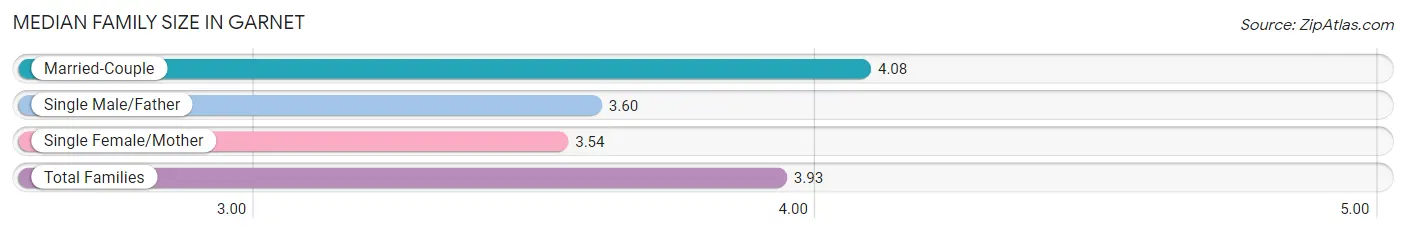
Median Family Size in Garnet
The median family size in Garnet is 3.93 persons per family, with married-couple families (1,189 | 70.1%) accounting for the largest median family size of 4.08 persons per family. On the other hand, single female/mother families (284 | 16.7%) represent the smallest median family size with 3.54 persons per family.
| Family Type | # Families | Family Size |
| Married-Couple | 1,189 (70.1%) | 4.08 |
| Single Male/Father | 224 (13.2%) | 3.60 |
| Single Female/Mother | 284 (16.7%) | 3.54 |
| Total Families | 1,697 (100.0%) | 3.93 |
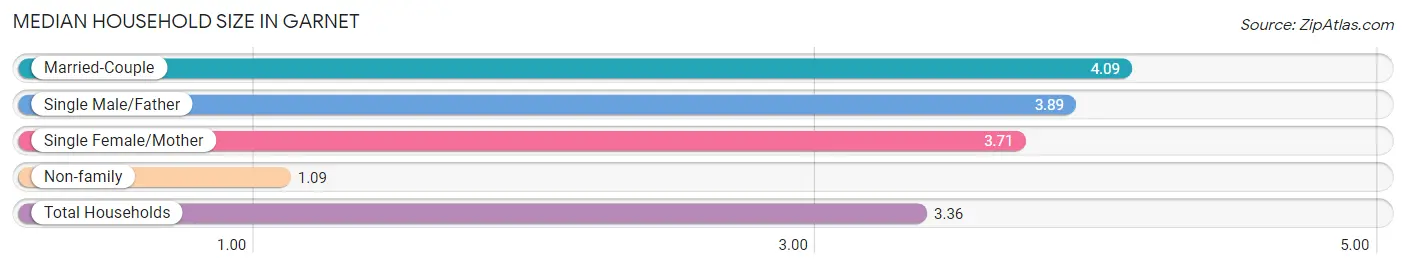
Median Household Size in Garnet
The median household size in Garnet is 3.36 persons per household, with married-couple households (1,189 | 54.6%) accounting for the largest median household size of 4.09 persons per household. non-family households (482 | 22.1%) represent the smallest median household size with 1.09 persons per household.
| Household Type | # Households | Household Size |
| Married-Couple | 1,189 (54.6%) | 4.09 |
| Single Male/Father | 224 (10.3%) | 3.89 |
| Single Female/Mother | 284 (13.0%) | 3.71 |
| Non-family | 482 (22.1%) | 1.09 |
| Total Households | 2,179 (100.0%) | 3.36 |
Household Size by Marriage Status in Garnet
Out of a total of 2,179 households in Garnet, 1,697 (77.9%) are family households, while 482 (22.1%) are nonfamily households. The most numerous type of family households are 2-person households, comprising 486, and the most common type of nonfamily households are 1-person households, comprising 439.
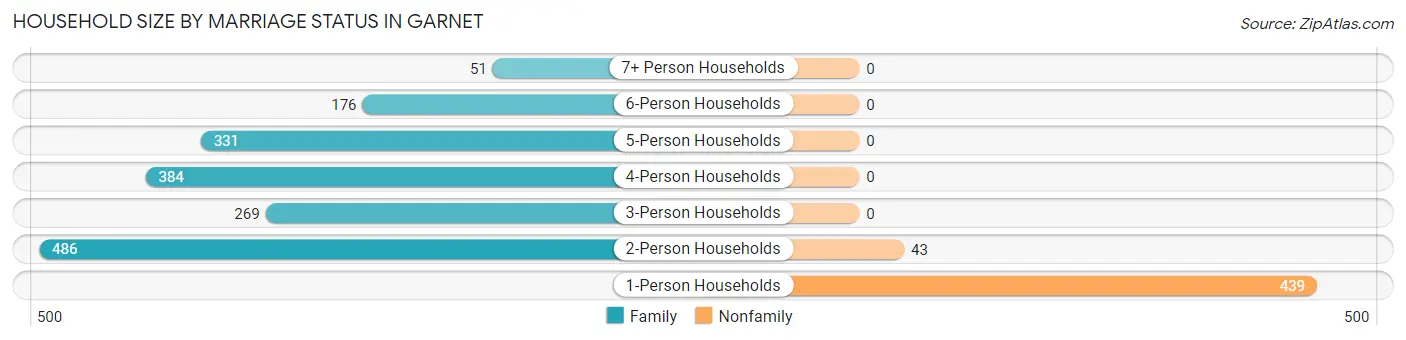
| Household Size | Family Households | Nonfamily Households |
| 1-Person Households | - | 439 (20.2%) |
| 2-Person Households | 486 (22.3%) | 43 (2.0%) |
| 3-Person Households | 269 (12.3%) | 0 (0.0%) |
| 4-Person Households | 384 (17.6%) | 0 (0.0%) |
| 5-Person Households | 331 (15.2%) | 0 (0.0%) |
| 6-Person Households | 176 (8.1%) | 0 (0.0%) |
| 7+ Person Households | 51 (2.3%) | 0 (0.0%) |
| Total | 1,697 (77.9%) | 482 (22.1%) |
Female Fertility in Garnet
Fertility by Age in Garnet
Average fertility rate in Garnet is 69.0 births per 1,000 women. Women in the age bracket of 35 to 50 years have the highest fertility rate with 95.0 births per 1,000 women. Women in the age bracket of 35 to 50 years acount for 61.7% of all women with births.
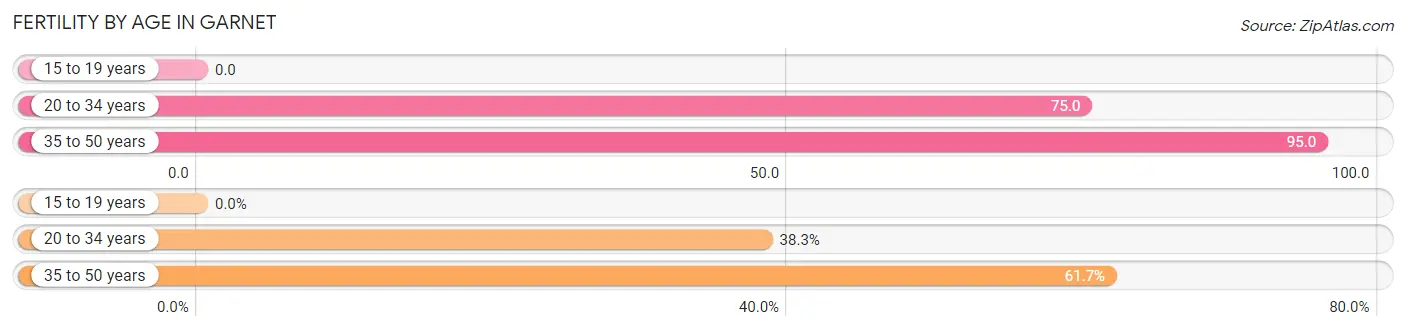
| Age Bracket | Women with Births | Births / 1,000 Women |
| 15 to 19 years | 0 (0.0%) | 0.0 |
| 20 to 34 years | 41 (38.3%) | 75.0 |
| 35 to 50 years | 66 (61.7%) | 95.0 |
| Total | 107 (100.0%) | 69.0 |
Fertility by Age by Marriage Status in Garnet
50.5% of women with births (107) in Garnet are married. The highest percentage of unmarried women with births falls into 20 to 34 years age bracket with 70.7% of them unmarried at the time of birth, while the lowest percentage of unmarried women with births belong to 35 to 50 years age bracket with 36.4% of them unmarried.
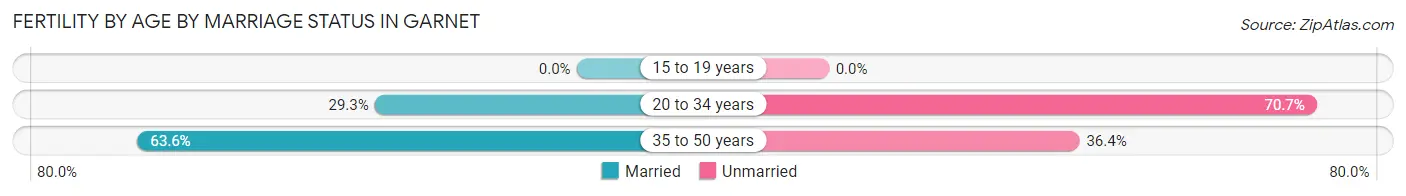
| Age Bracket | Married | Unmarried |
| 15 to 19 years | 0 (0.0%) | 0 (0.0%) |
| 20 to 34 years | 12 (29.3%) | 29 (70.7%) |
| 35 to 50 years | 42 (63.6%) | 24 (36.4%) |
| Total | 54 (50.5%) | 53 (49.5%) |
Fertility by Education in Garnet
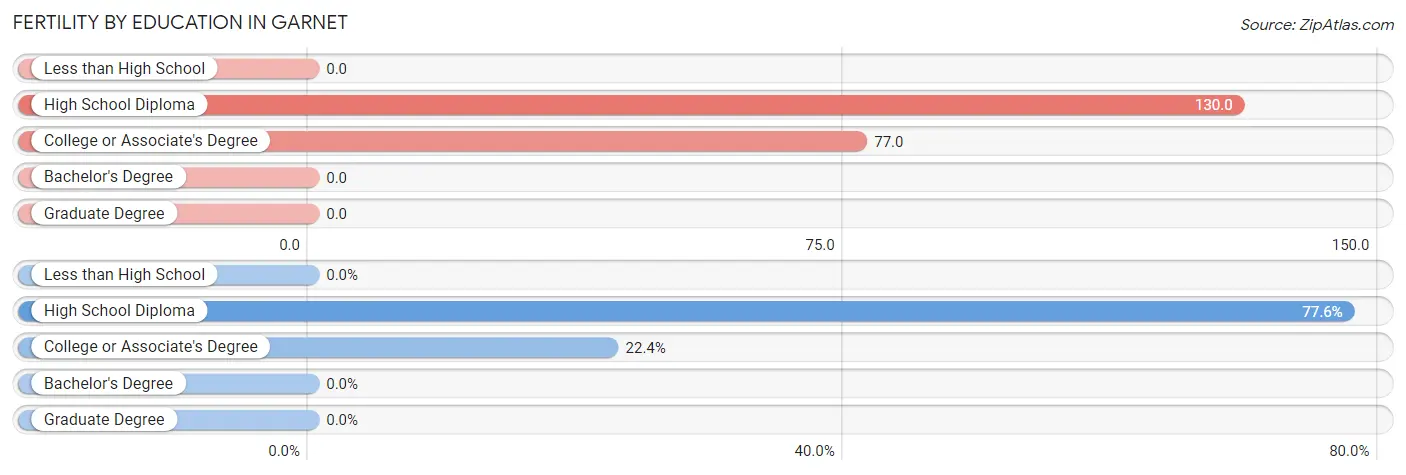
| Educational Attainment | Women with Births | Births / 1,000 Women |
| Less than High School | 0 (0.0%) | 0.0 |
| High School Diploma | 83 (77.6%) | 130.0 |
| College or Associate's Degree | 24 (22.4%) | 77.0 |
| Bachelor's Degree | 0 (0.0%) | 0.0 |
| Graduate Degree | 0 (0.0%) | 0.0 |
| Total | 107 (100.0%) | 69.0 |
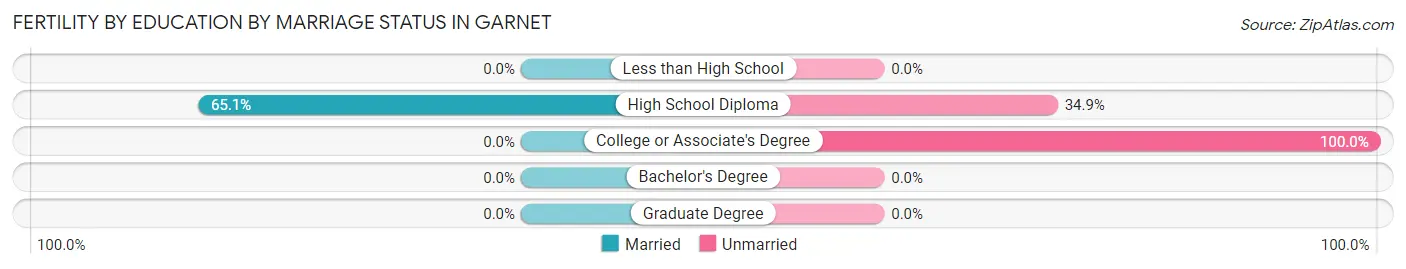
Fertility by Education by Marriage Status in Garnet
49.5% of women with births in Garnet are unmarried. Women with the educational attainment of high school diploma are most likely to be married with 65.1% of them married at childbirth, while women with the educational attainment of college or associate's degree are least likely to be married with 100.0% of them unmarried at childbirth.
| Educational Attainment | Married | Unmarried |
| Less than High School | 0 (0.0%) | 0 (0.0%) |
| High School Diploma | 54 (65.1%) | 29 (34.9%) |
| College or Associate's Degree | 0 (0.0%) | 24 (100.0%) |
| Bachelor's Degree | 0 (0.0%) | 0 (0.0%) |
| Graduate Degree | 0 (0.0%) | 0 (0.0%) |
| Total | 54 (50.5%) | 53 (49.5%) |
Employment Characteristics in Garnet
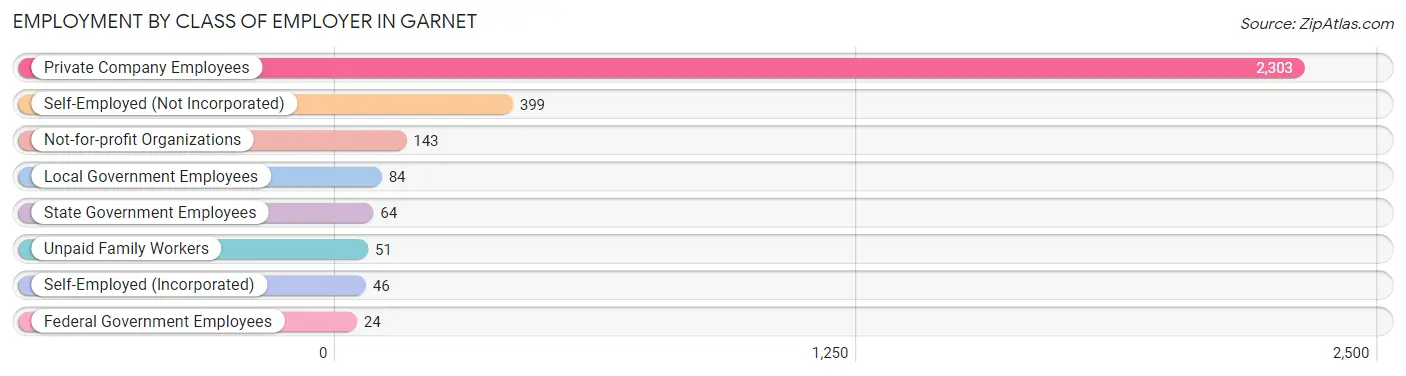
Employment by Class of Employer in Garnet
Among the 3,114 employed individuals in Garnet, private company employees (2,303 | 74.0%), self-employed (not incorporated) (399 | 12.8%), and not-for-profit organizations (143 | 4.6%) make up the most common classes of employment.
| Employer Class | # Employees | % Employees |
| Private Company Employees | 2,303 | 74.0% |
| Self-Employed (Incorporated) | 46 | 1.5% |
| Self-Employed (Not Incorporated) | 399 | 12.8% |
| Not-for-profit Organizations | 143 | 4.6% |
| Local Government Employees | 84 | 2.7% |
| State Government Employees | 64 | 2.1% |
| Federal Government Employees | 24 | 0.8% |
| Unpaid Family Workers | 51 | 1.6% |
| Total | 3,114 | 100.0% |
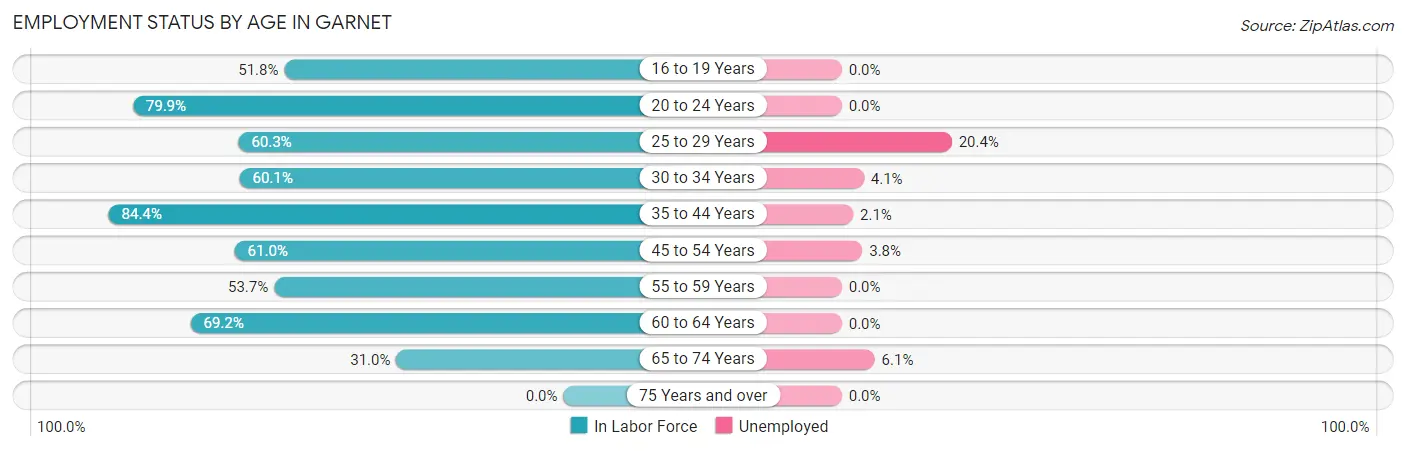
Employment Status by Age in Garnet
According to the labor force statistics for Garnet, out of the total population over 16 years of age (5,435), 59.8% or 3,250 individuals are in the labor force, with 3.4% or 111 of them unemployed. The age group with the highest labor force participation rate is 35 to 44 years, with 84.4% or 807 individuals in the labor force. Within the labor force, the 25 to 29 years age range has the highest percentage of unemployed individuals, with 20.4% or 37 of them being unemployed.
| Age Bracket | In Labor Force | Unemployed |
| 16 to 19 Years | 217 (51.8%) | 0 (0.0%) |
| 20 to 24 Years | 295 (79.9%) | 0 (0.0%) |
| 25 to 29 Years | 181 (60.3%) | 37 (20.4%) |
| 30 to 34 Years | 363 (60.1%) | 15 (4.1%) |
| 35 to 44 Years | 807 (84.4%) | 17 (2.1%) |
| 45 to 54 Years | 796 (61.0%) | 30 (3.8%) |
| 55 to 59 Years | 137 (53.7%) | 0 (0.0%) |
| 60 to 64 Years | 272 (69.2%) | 0 (0.0%) |
| 65 to 74 Years | 180 (31.0%) | 11 (6.1%) |
| 75 Years and over | 0 (0.0%) | 0 (0.0%) |
| Total | 3,250 (59.8%) | 110 (3.4%) |
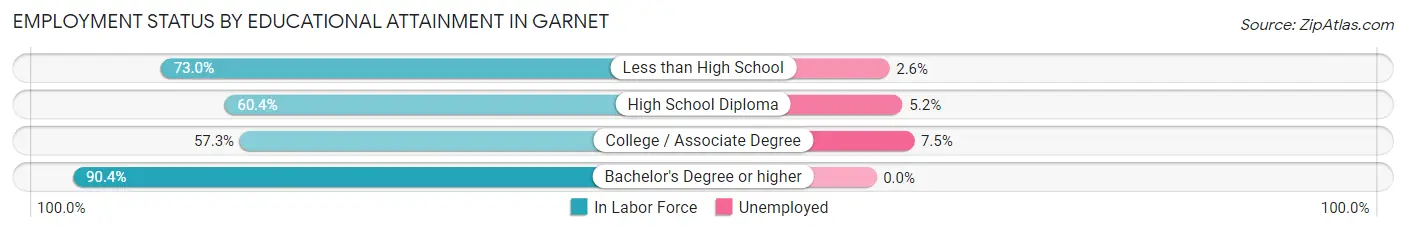
Employment Status by Educational Attainment in Garnet
According to labor force statistics for Garnet, 67.0% of individuals (2,555) out of the total population between 25 and 64 years of age (3,813) are in the labor force, with 3.9% or 100 of them being unemployed. The group with the highest labor force participation rate are those with the educational attainment of bachelor's degree or higher, with 90.4% or 217 individuals in the labor force. Within the labor force, individuals with college / associate degree education have the highest percentage of unemployment, with 7.5% or 27 of them being unemployed.
| Educational Attainment | In Labor Force | Unemployed |
| Less than High School | 1,162 (73.0%) | 41 (2.6%) |
| High School Diploma | 815 (60.4%) | 70 (5.2%) |
| College / Associate Degree | 362 (57.3%) | 47 (7.5%) |
| Bachelor's Degree or higher | 217 (90.4%) | 0 (0.0%) |
| Total | 2,555 (67.0%) | 149 (3.9%) |
Employment Occupations by Sex in Garnet
Management, Business, Science and Arts Occupations
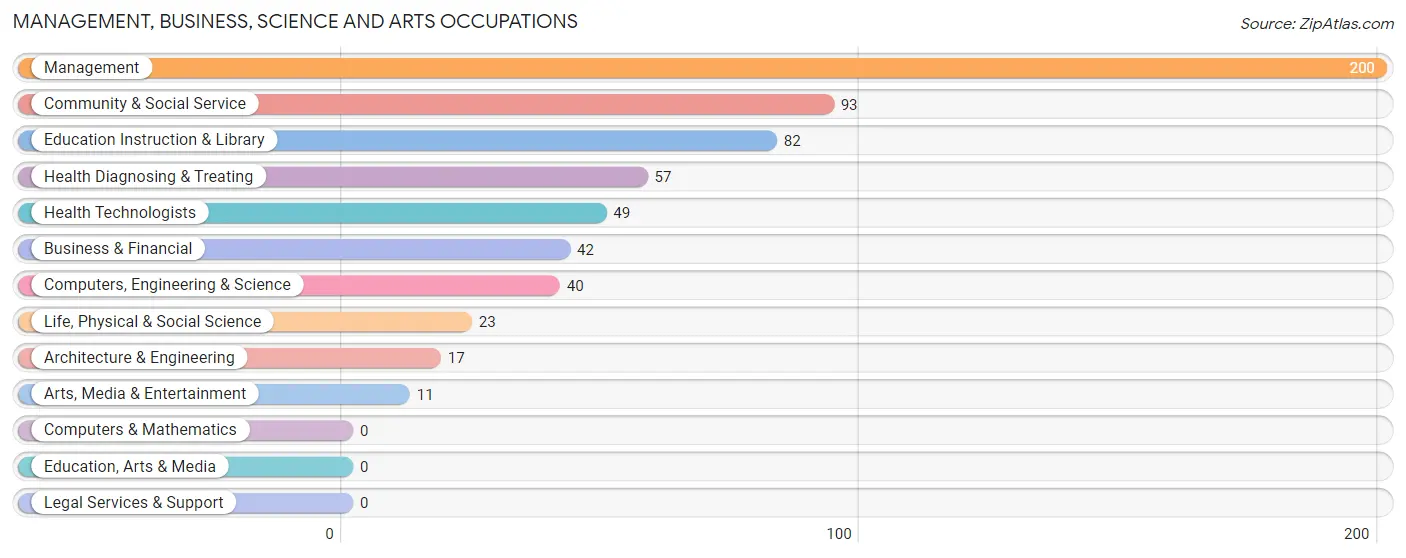
The most common Management, Business, Science and Arts occupations in Garnet are Management (200 | 6.4%), Community & Social Service (93 | 3.0%), Education Instruction & Library (82 | 2.6%), Health Diagnosing & Treating (57 | 1.8%), and Health Technologists (49 | 1.6%).
Management, Business, Science and Arts Occupations by Sex
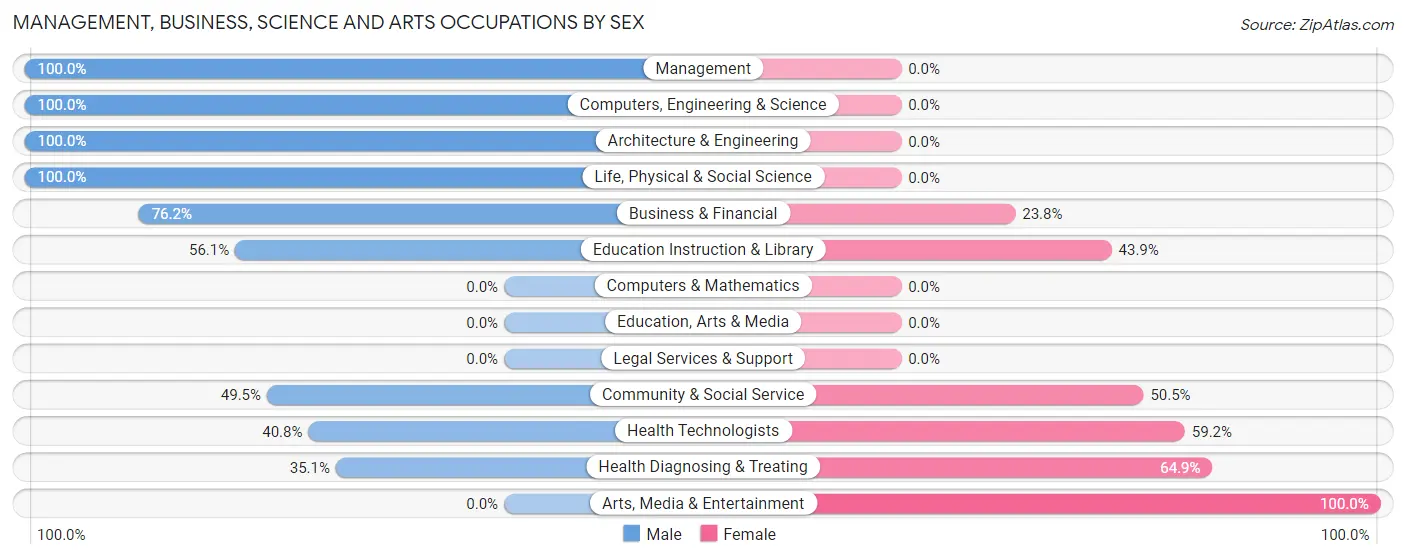
Within the Management, Business, Science and Arts occupations in Garnet, the most male-oriented occupations are Management (100.0%), Computers, Engineering & Science (100.0%), and Architecture & Engineering (100.0%), while the most female-oriented occupations are Arts, Media & Entertainment (100.0%), Health Diagnosing & Treating (64.9%), and Health Technologists (59.2%).
| Occupation | Male | Female |
| Management | 200 (100.0%) | 0 (0.0%) |
| Business & Financial | 32 (76.2%) | 10 (23.8%) |
| Computers, Engineering & Science | 40 (100.0%) | 0 (0.0%) |
| Computers & Mathematics | 0 (0.0%) | 0 (0.0%) |
| Architecture & Engineering | 17 (100.0%) | 0 (0.0%) |
| Life, Physical & Social Science | 23 (100.0%) | 0 (0.0%) |
| Community & Social Service | 46 (49.5%) | 47 (50.5%) |
| Education, Arts & Media | 0 (0.0%) | 0 (0.0%) |
| Legal Services & Support | 0 (0.0%) | 0 (0.0%) |
| Education Instruction & Library | 46 (56.1%) | 36 (43.9%) |
| Arts, Media & Entertainment | 0 (0.0%) | 11 (100.0%) |
| Health Diagnosing & Treating | 20 (35.1%) | 37 (64.9%) |
| Health Technologists | 20 (40.8%) | 29 (59.2%) |
| Total (Category) | 338 (78.2%) | 94 (21.8%) |
| Total (Overall) | 1,814 (57.8%) | 1,324 (42.2%) |
Services Occupations
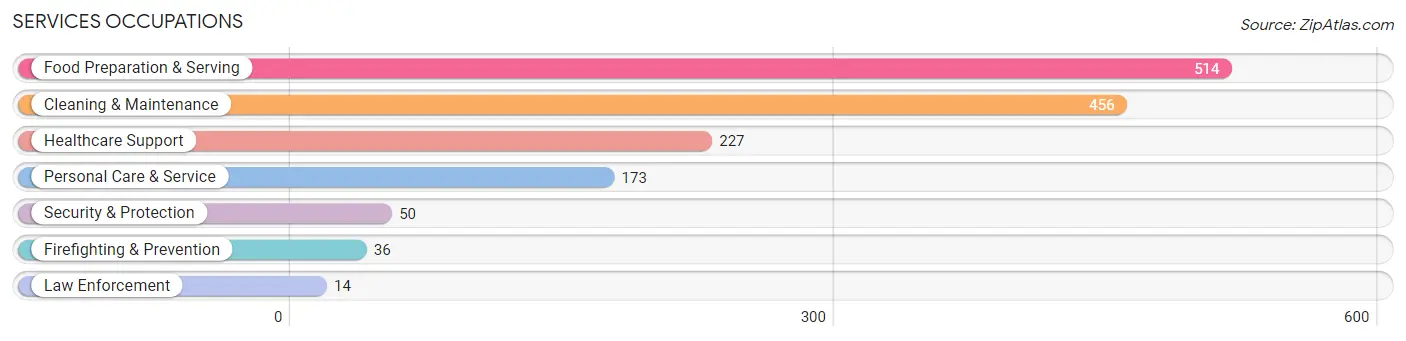
The most common Services occupations in Garnet are Food Preparation & Serving (514 | 16.4%), Cleaning & Maintenance (456 | 14.5%), Healthcare Support (227 | 7.2%), Personal Care & Service (173 | 5.5%), and Security & Protection (50 | 1.6%).
Services Occupations by Sex
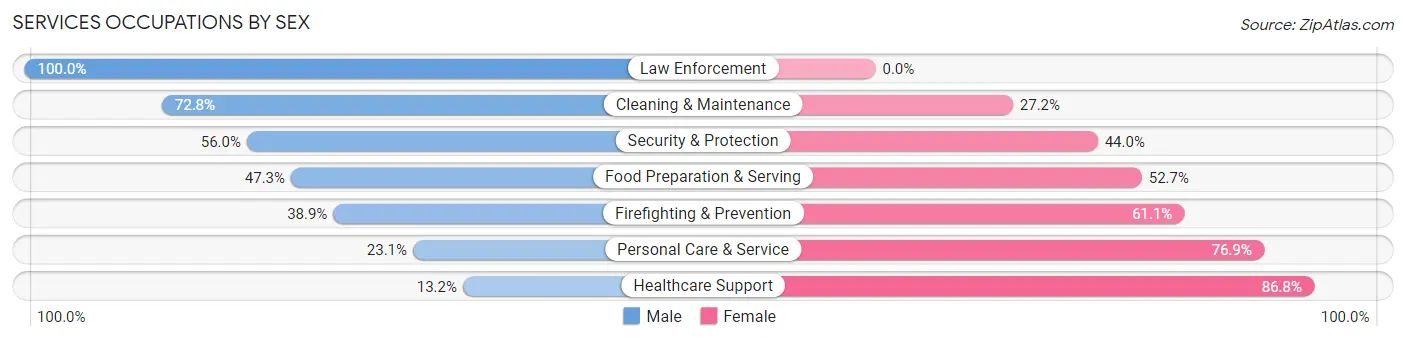
Within the Services occupations in Garnet, the most male-oriented occupations are Law Enforcement (100.0%), Cleaning & Maintenance (72.8%), and Security & Protection (56.0%), while the most female-oriented occupations are Healthcare Support (86.8%), Personal Care & Service (76.9%), and Firefighting & Prevention (61.1%).
| Occupation | Male | Female |
| Healthcare Support | 30 (13.2%) | 197 (86.8%) |
| Security & Protection | 28 (56.0%) | 22 (44.0%) |
| Firefighting & Prevention | 14 (38.9%) | 22 (61.1%) |
| Law Enforcement | 14 (100.0%) | 0 (0.0%) |
| Food Preparation & Serving | 243 (47.3%) | 271 (52.7%) |
| Cleaning & Maintenance | 332 (72.8%) | 124 (27.2%) |
| Personal Care & Service | 40 (23.1%) | 133 (76.9%) |
| Total (Category) | 673 (47.4%) | 747 (52.6%) |
| Total (Overall) | 1,814 (57.8%) | 1,324 (42.2%) |
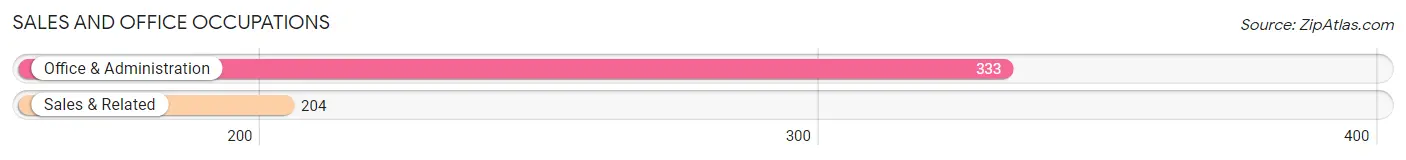
Sales and Office Occupations
The most common Sales and Office occupations in Garnet are Office & Administration (333 | 10.6%), and Sales & Related (204 | 6.5%).
Sales and Office Occupations by Sex
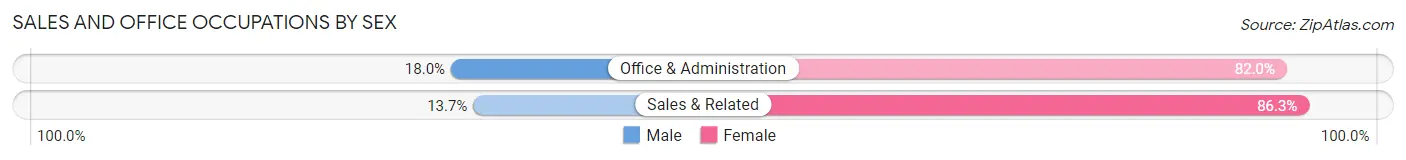
| Occupation | Male | Female |
| Sales & Related | 28 (13.7%) | 176 (86.3%) |
| Office & Administration | 60 (18.0%) | 273 (82.0%) |
| Total (Category) | 88 (16.4%) | 449 (83.6%) |
| Total (Overall) | 1,814 (57.8%) | 1,324 (42.2%) |
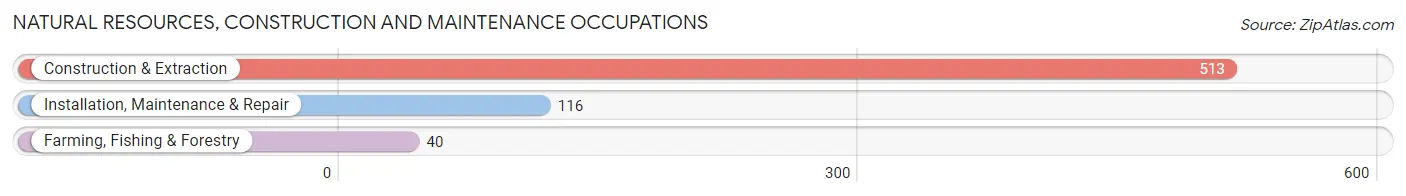
Natural Resources, Construction and Maintenance Occupations
The most common Natural Resources, Construction and Maintenance occupations in Garnet are Construction & Extraction (513 | 16.4%), Installation, Maintenance & Repair (116 | 3.7%), and Farming, Fishing & Forestry (40 | 1.3%).
Natural Resources, Construction and Maintenance Occupations by Sex
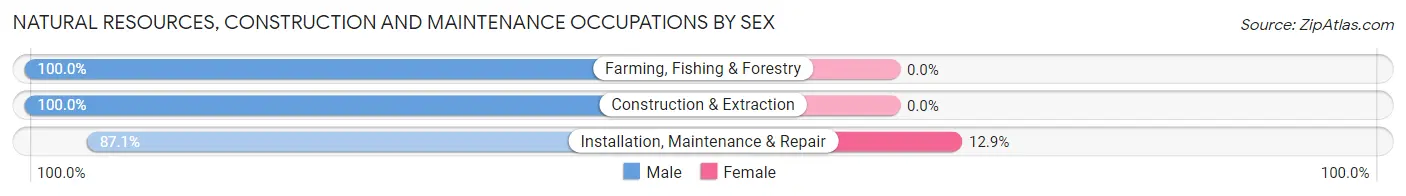
| Occupation | Male | Female |
| Farming, Fishing & Forestry | 40 (100.0%) | 0 (0.0%) |
| Construction & Extraction | 513 (100.0%) | 0 (0.0%) |
| Installation, Maintenance & Repair | 101 (87.1%) | 15 (12.9%) |
| Total (Category) | 654 (97.8%) | 15 (2.2%) |
| Total (Overall) | 1,814 (57.8%) | 1,324 (42.2%) |
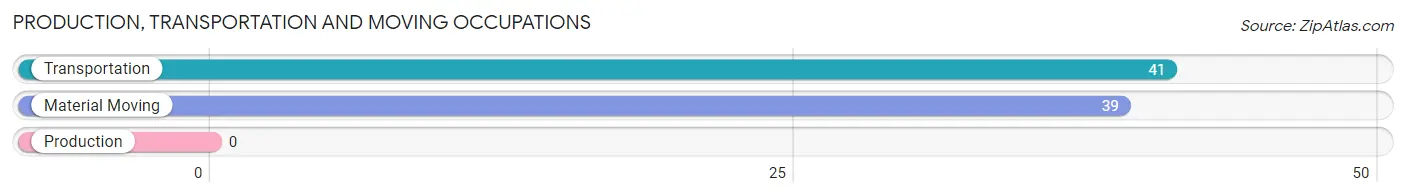
Production, Transportation and Moving Occupations
The most common Production, Transportation and Moving occupations in Garnet are Transportation (41 | 1.3%), and Material Moving (39 | 1.2%).
Production, Transportation and Moving Occupations by Sex
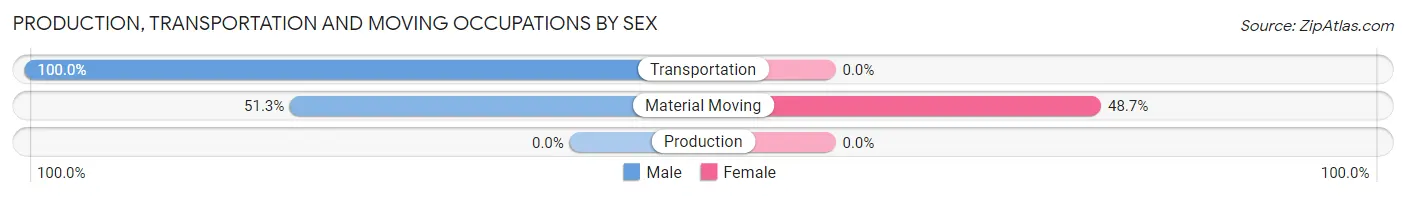
| Occupation | Male | Female |
| Production | 0 (0.0%) | 0 (0.0%) |
| Transportation | 41 (100.0%) | 0 (0.0%) |
| Material Moving | 20 (51.3%) | 19 (48.7%) |
| Total (Category) | 61 (76.2%) | 19 (23.7%) |
| Total (Overall) | 1,814 (57.8%) | 1,324 (42.2%) |
Employment Industries by Sex in Garnet
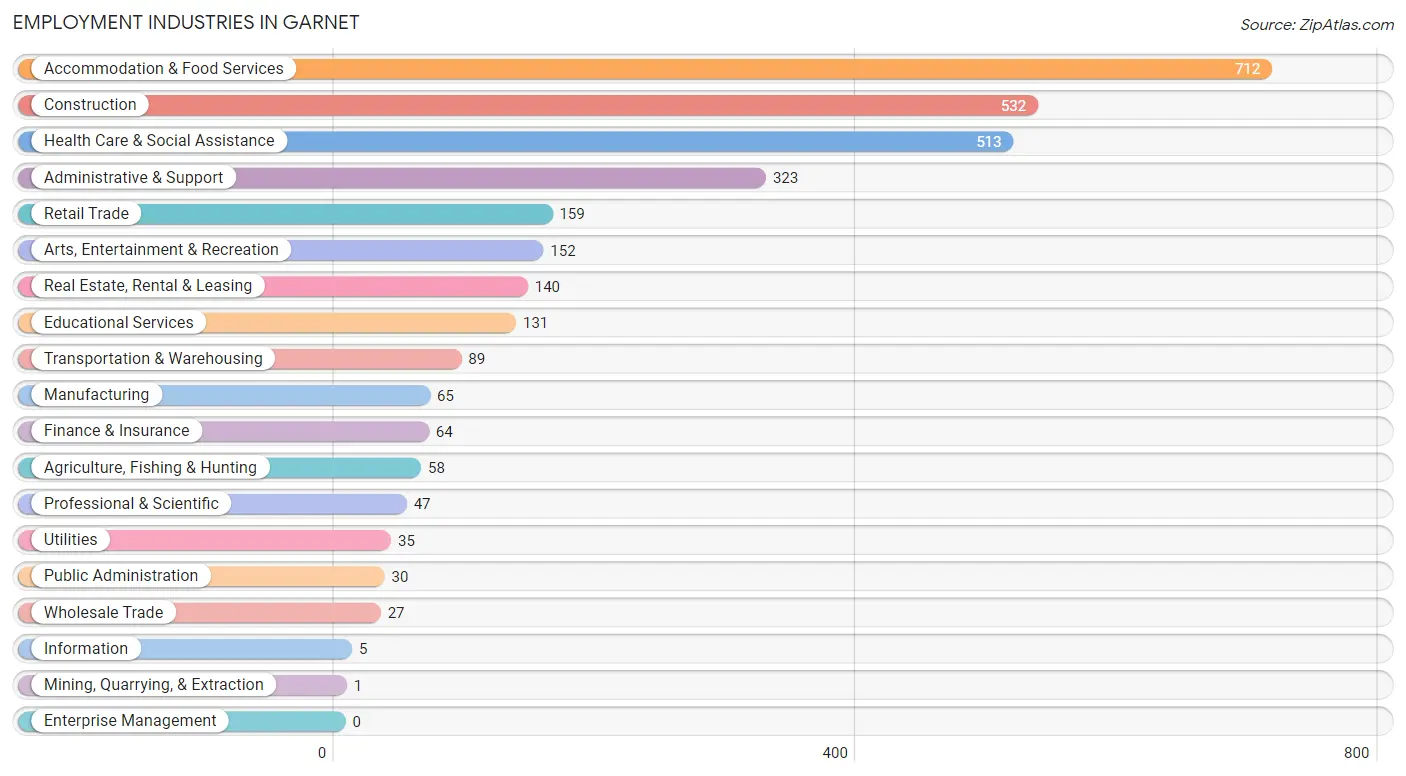
Employment Industries in Garnet
The major employment industries in Garnet include Accommodation & Food Services (712 | 22.7%), Construction (532 | 17.0%), Health Care & Social Assistance (513 | 16.4%), Administrative & Support (323 | 10.3%), and Retail Trade (159 | 5.1%).
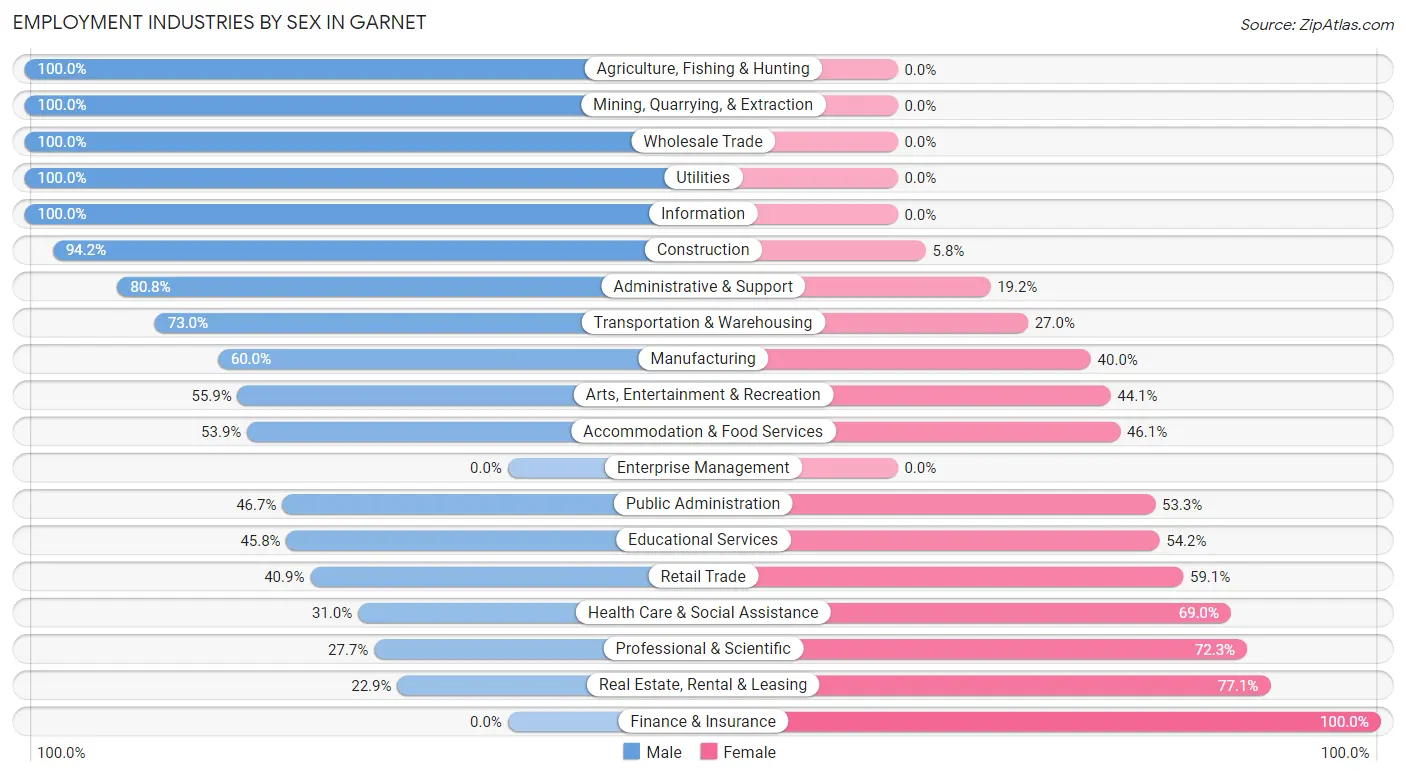
Employment Industries by Sex in Garnet
The Garnet industries that see more men than women are Agriculture, Fishing & Hunting (100.0%), Mining, Quarrying, & Extraction (100.0%), and Wholesale Trade (100.0%), whereas the industries that tend to have a higher number of women are Finance & Insurance (100.0%), Real Estate, Rental & Leasing (77.1%), and Professional & Scientific (72.3%).
| Industry | Male | Female |
| Agriculture, Fishing & Hunting | 58 (100.0%) | 0 (0.0%) |
| Mining, Quarrying, & Extraction | 1 (100.0%) | 0 (0.0%) |
| Construction | 501 (94.2%) | 31 (5.8%) |
| Manufacturing | 39 (60.0%) | 26 (40.0%) |
| Wholesale Trade | 27 (100.0%) | 0 (0.0%) |
| Retail Trade | 65 (40.9%) | 94 (59.1%) |
| Transportation & Warehousing | 65 (73.0%) | 24 (27.0%) |
| Utilities | 35 (100.0%) | 0 (0.0%) |
| Information | 5 (100.0%) | 0 (0.0%) |
| Finance & Insurance | 0 (0.0%) | 64 (100.0%) |
| Real Estate, Rental & Leasing | 32 (22.9%) | 108 (77.1%) |
| Professional & Scientific | 13 (27.7%) | 34 (72.3%) |
| Enterprise Management | 0 (0.0%) | 0 (0.0%) |
| Administrative & Support | 261 (80.8%) | 62 (19.2%) |
| Educational Services | 60 (45.8%) | 71 (54.2%) |
| Health Care & Social Assistance | 159 (31.0%) | 354 (69.0%) |
| Arts, Entertainment & Recreation | 85 (55.9%) | 67 (44.1%) |
| Accommodation & Food Services | 384 (53.9%) | 328 (46.1%) |
| Public Administration | 14 (46.7%) | 16 (53.3%) |
| Total | 1,814 (57.8%) | 1,324 (42.2%) |
Education in Garnet
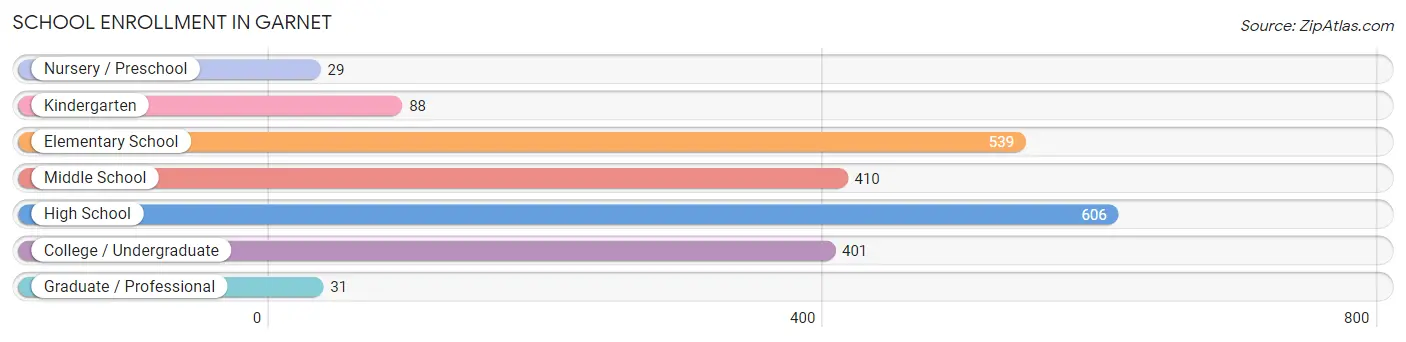
School Enrollment in Garnet
The most common levels of schooling among the 2,104 students in Garnet are high school (606 | 28.8%), elementary school (539 | 25.6%), and middle school (410 | 19.5%).
| School Level | # Students | % Students |
| Nursery / Preschool | 29 | 1.4% |
| Kindergarten | 88 | 4.2% |
| Elementary School | 539 | 25.6% |
| Middle School | 410 | 19.5% |
| High School | 606 | 28.8% |
| College / Undergraduate | 401 | 19.1% |
| Graduate / Professional | 31 | 1.5% |
| Total | 2,104 | 100.0% |
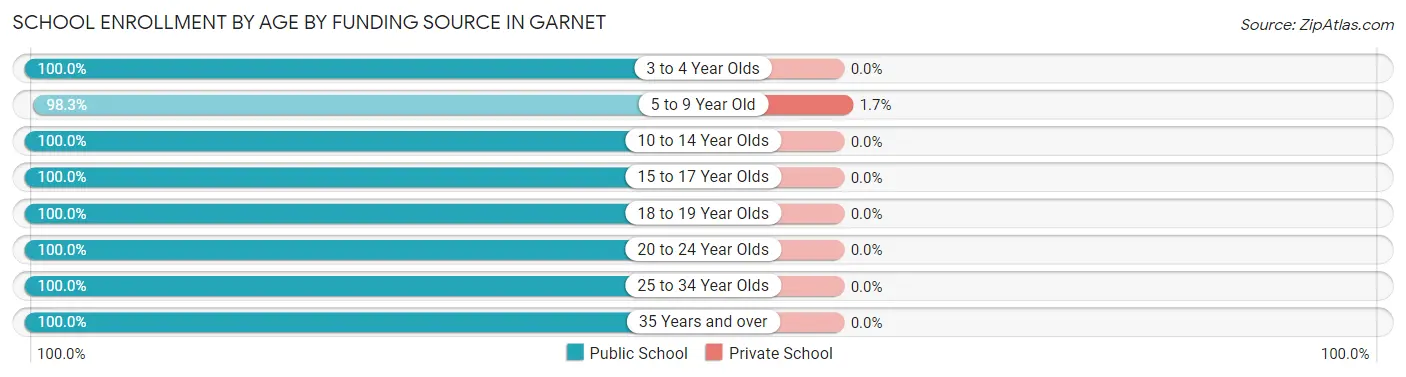
School Enrollment by Age by Funding Source in Garnet
Out of a total of 2,104 students who are enrolled in schools in Garnet, 11 (0.5%) attend a private institution, while the remaining 2,093 (99.5%) are enrolled in public schools. The age group of 5 to 9 year old has the highest likelihood of being enrolled in private schools, with 10 (1.7% in the age bracket) enrolled. Conversely, the age group of 3 to 4 year olds has the lowest likelihood of being enrolled in a private school, with 19 (100.0% in the age bracket) attending a public institution.
| Age Bracket | Public School | Private School |
| 3 to 4 Year Olds | 19 (100.0%) | 0 (0.0%) |
| 5 to 9 Year Old | 586 (98.3%) | 10 (1.7%) |
| 10 to 14 Year Olds | 712 (100.0%) | 0 (0.0%) |
| 15 to 17 Year Olds | 306 (100.0%) | 0 (0.0%) |
| 18 to 19 Year Olds | 189 (100.0%) | 0 (0.0%) |
| 20 to 24 Year Olds | 212 (100.0%) | 0 (0.0%) |
| 25 to 34 Year Olds | 22 (100.0%) | 0 (0.0%) |
| 35 Years and over | 48 (100.0%) | 0 (0.0%) |
| Total | 2,093 (99.5%) | 11 (0.5%) |
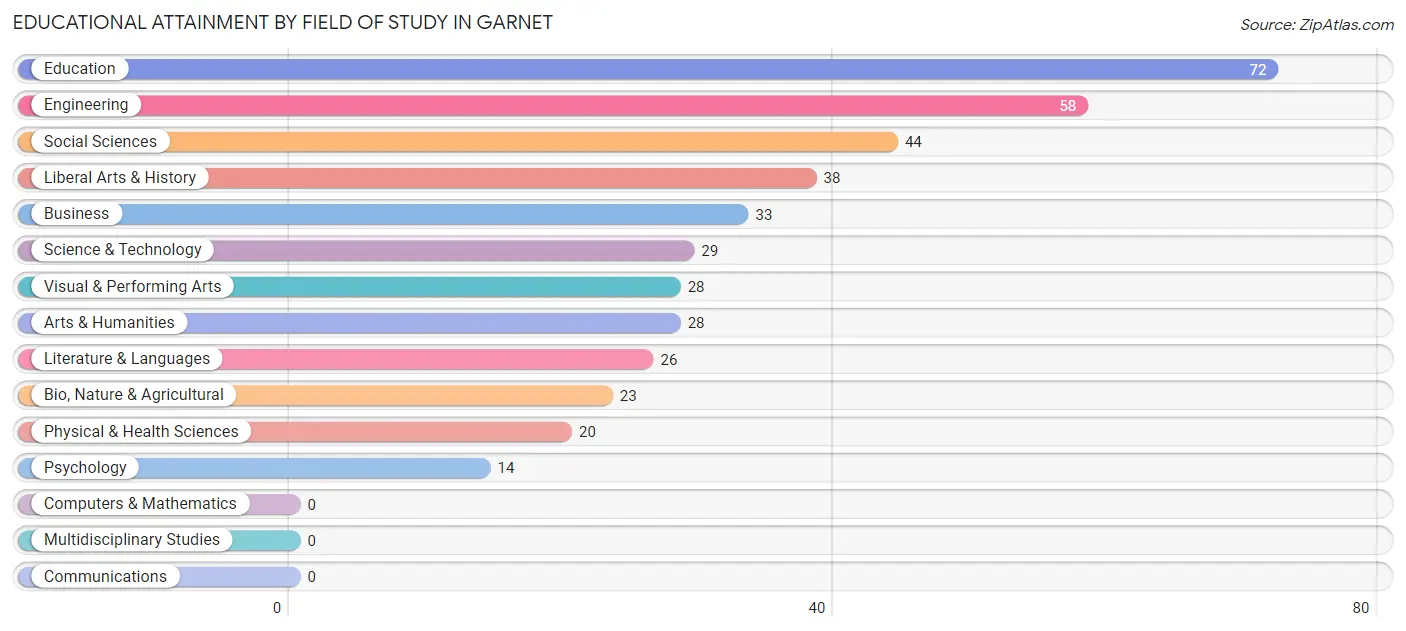
Educational Attainment by Field of Study in Garnet
Education (72 | 17.4%), engineering (58 | 14.0%), social sciences (44 | 10.6%), liberal arts & history (38 | 9.2%), and business (33 | 8.0%) are the most common fields of study among 413 individuals in Garnet who have obtained a bachelor's degree or higher.
| Field of Study | # Graduates | % Graduates |
| Computers & Mathematics | 0 | 0.0% |
| Bio, Nature & Agricultural | 23 | 5.6% |
| Physical & Health Sciences | 20 | 4.8% |
| Psychology | 14 | 3.4% |
| Social Sciences | 44 | 10.6% |
| Engineering | 58 | 14.0% |
| Multidisciplinary Studies | 0 | 0.0% |
| Science & Technology | 29 | 7.0% |
| Business | 33 | 8.0% |
| Education | 72 | 17.4% |
| Literature & Languages | 26 | 6.3% |
| Liberal Arts & History | 38 | 9.2% |
| Visual & Performing Arts | 28 | 6.8% |
| Communications | 0 | 0.0% |
| Arts & Humanities | 28 | 6.8% |
| Total | 413 | 100.0% |
Transportation & Commute in Garnet
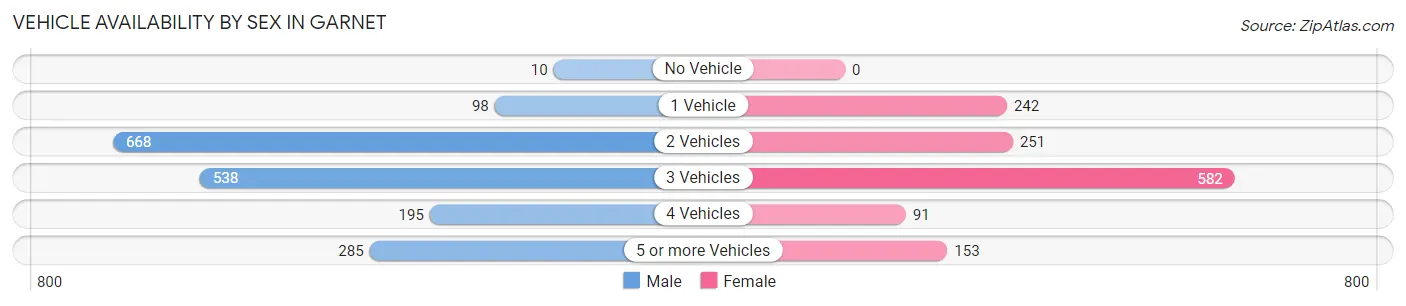
Vehicle Availability by Sex in Garnet
The most prevalent vehicle ownership categories in Garnet are males with 2 vehicles (668, accounting for 37.2%) and females with 2 vehicles (251, making up 50.6%).
| Vehicles Available | Male | Female |
| No Vehicle | 10 (0.6%) | 0 (0.0%) |
| 1 Vehicle | 98 (5.5%) | 242 (18.3%) |
| 2 Vehicles | 668 (37.2%) | 251 (19.0%) |
| 3 Vehicles | 538 (30.0%) | 582 (44.1%) |
| 4 Vehicles | 195 (10.9%) | 91 (6.9%) |
| 5 or more Vehicles | 285 (15.9%) | 153 (11.6%) |
| Total | 1,794 (100.0%) | 1,319 (100.0%) |
Commute Time in Garnet
The most frequently occuring commute durations in Garnet are 20 to 24 minutes (736 commuters, 24.8%), 15 to 19 minutes (659 commuters, 22.2%), and 30 to 34 minutes (558 commuters, 18.8%).
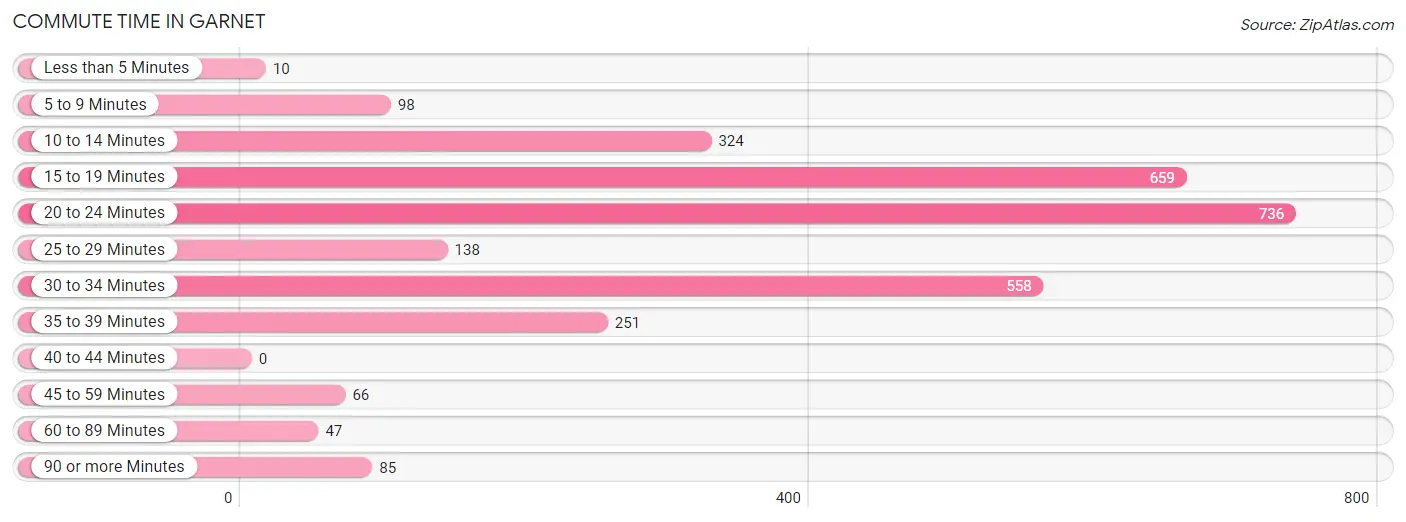
| Commute Time | # Commuters | % Commuters |
| Less than 5 Minutes | 10 | 0.3% |
| 5 to 9 Minutes | 98 | 3.3% |
| 10 to 14 Minutes | 324 | 10.9% |
| 15 to 19 Minutes | 659 | 22.2% |
| 20 to 24 Minutes | 736 | 24.8% |
| 25 to 29 Minutes | 138 | 4.6% |
| 30 to 34 Minutes | 558 | 18.8% |
| 35 to 39 Minutes | 251 | 8.5% |
| 40 to 44 Minutes | 0 | 0.0% |
| 45 to 59 Minutes | 66 | 2.2% |
| 60 to 89 Minutes | 47 | 1.6% |
| 90 or more Minutes | 85 | 2.9% |
Commute Time by Sex in Garnet
The most common commute times in Garnet are 20 to 24 minutes (500 commuters, 28.9%) for males and 15 to 19 minutes (322 commuters, 25.9%) for females.
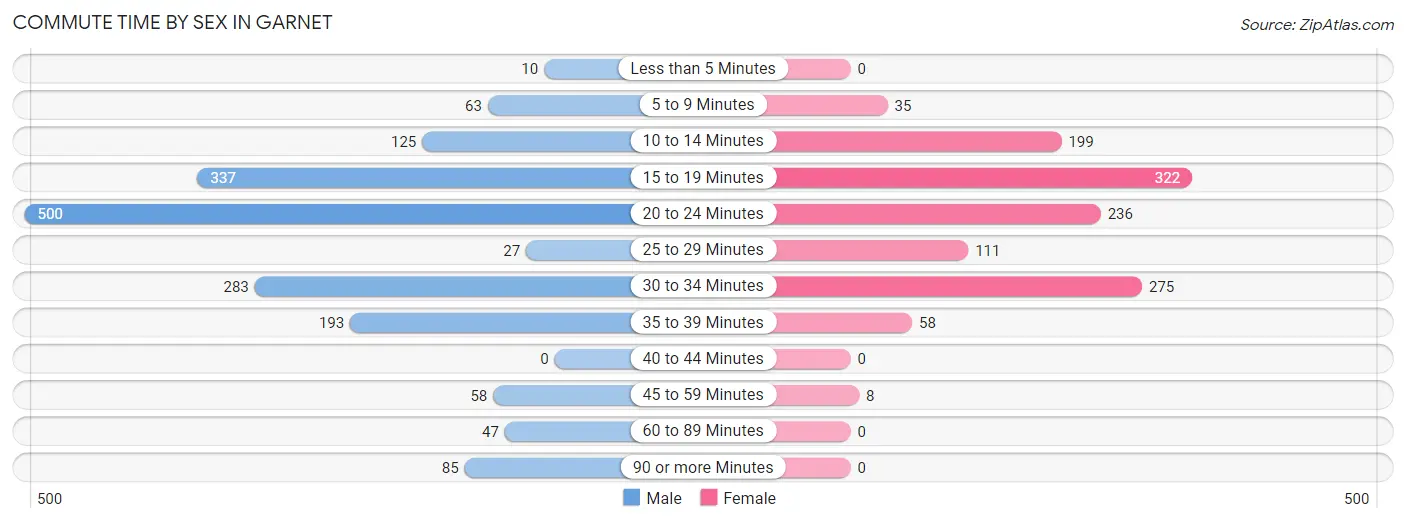
| Commute Time | Male | Female |
| Less than 5 Minutes | 10 (0.6%) | 0 (0.0%) |
| 5 to 9 Minutes | 63 (3.6%) | 35 (2.8%) |
| 10 to 14 Minutes | 125 (7.2%) | 199 (16.0%) |
| 15 to 19 Minutes | 337 (19.5%) | 322 (25.9%) |
| 20 to 24 Minutes | 500 (28.9%) | 236 (19.0%) |
| 25 to 29 Minutes | 27 (1.6%) | 111 (8.9%) |
| 30 to 34 Minutes | 283 (16.4%) | 275 (22.1%) |
| 35 to 39 Minutes | 193 (11.2%) | 58 (4.7%) |
| 40 to 44 Minutes | 0 (0.0%) | 0 (0.0%) |
| 45 to 59 Minutes | 58 (3.4%) | 8 (0.6%) |
| 60 to 89 Minutes | 47 (2.7%) | 0 (0.0%) |
| 90 or more Minutes | 85 (4.9%) | 0 (0.0%) |
Time of Departure to Work by Sex in Garnet
The most frequent times of departure to work in Garnet are 6:00 AM to 6:29 AM (322, 18.6%) for males and 7:00 AM to 7:29 AM (312, 25.1%) for females.
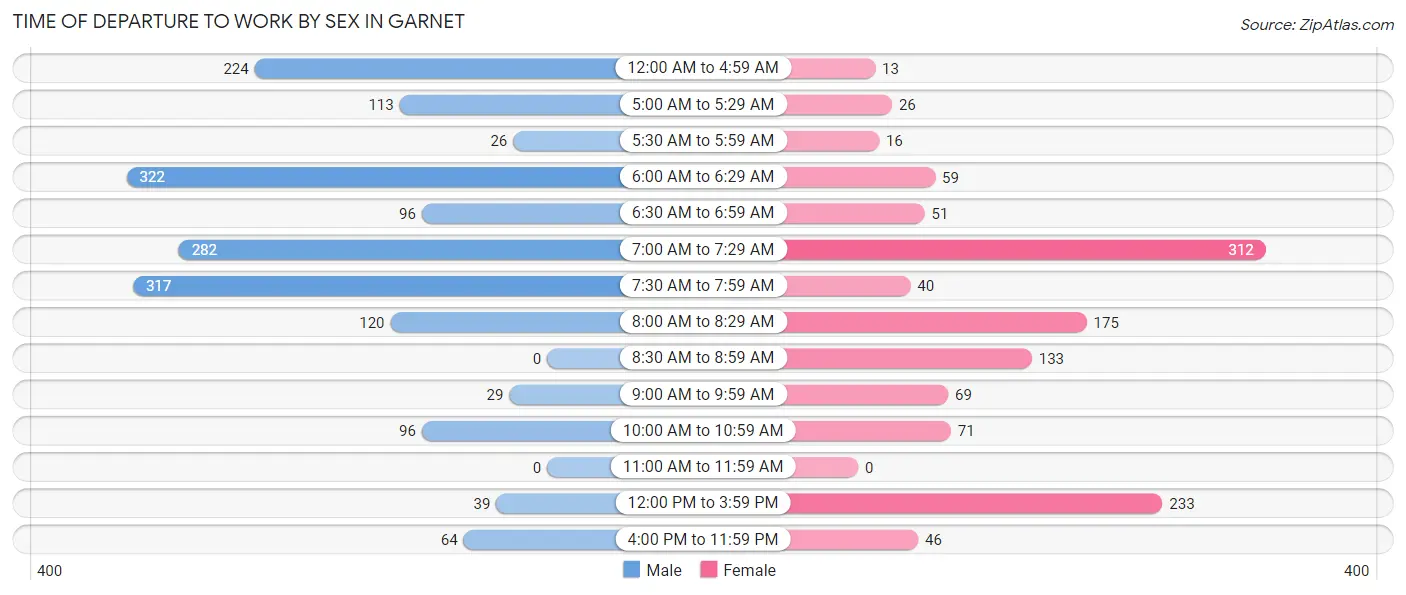
| Time of Departure | Male | Female |
| 12:00 AM to 4:59 AM | 224 (13.0%) | 13 (1.1%) |
| 5:00 AM to 5:29 AM | 113 (6.5%) | 26 (2.1%) |
| 5:30 AM to 5:59 AM | 26 (1.5%) | 16 (1.3%) |
| 6:00 AM to 6:29 AM | 322 (18.6%) | 59 (4.7%) |
| 6:30 AM to 6:59 AM | 96 (5.6%) | 51 (4.1%) |
| 7:00 AM to 7:29 AM | 282 (16.3%) | 312 (25.1%) |
| 7:30 AM to 7:59 AM | 317 (18.3%) | 40 (3.2%) |
| 8:00 AM to 8:29 AM | 120 (6.9%) | 175 (14.1%) |
| 8:30 AM to 8:59 AM | 0 (0.0%) | 133 (10.7%) |
| 9:00 AM to 9:59 AM | 29 (1.7%) | 69 (5.6%) |
| 10:00 AM to 10:59 AM | 96 (5.6%) | 71 (5.7%) |
| 11:00 AM to 11:59 AM | 0 (0.0%) | 0 (0.0%) |
| 12:00 PM to 3:59 PM | 39 (2.3%) | 233 (18.7%) |
| 4:00 PM to 11:59 PM | 64 (3.7%) | 46 (3.7%) |
| Total | 1,728 (100.0%) | 1,244 (100.0%) |
Housing Occupancy in Garnet
Occupancy by Ownership in Garnet
Of the total 2,179 dwellings in Garnet, owner-occupied units account for 1,638 (75.2%), while renter-occupied units make up 541 (24.8%).
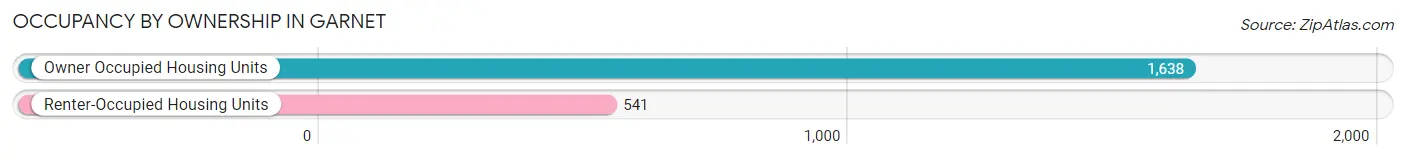
| Occupancy | # Housing Units | % Housing Units |
| Owner Occupied Housing Units | 1,638 | 75.2% |
| Renter-Occupied Housing Units | 541 | 24.8% |
| Total Occupied Housing Units | 2,179 | 100.0% |
Occupancy by Household Size in Garnet
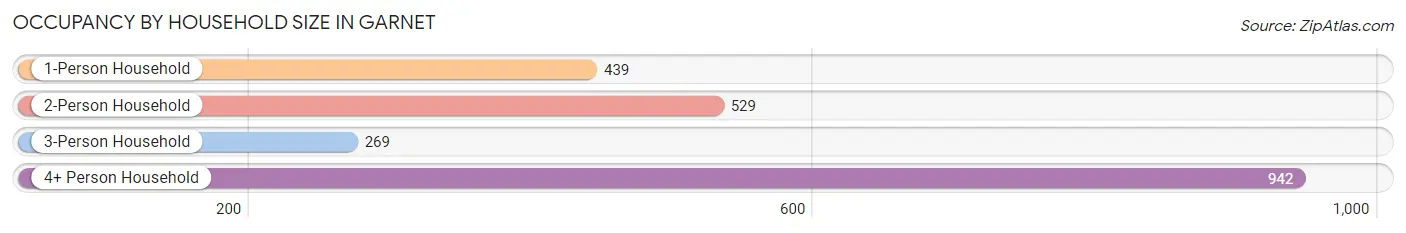
| Household Size | # Housing Units | % Housing Units |
| 1-Person Household | 439 | 20.2% |
| 2-Person Household | 529 | 24.3% |
| 3-Person Household | 269 | 12.3% |
| 4+ Person Household | 942 | 43.2% |
| Total Housing Units | 2,179 | 100.0% |
Occupancy by Ownership by Household Size in Garnet
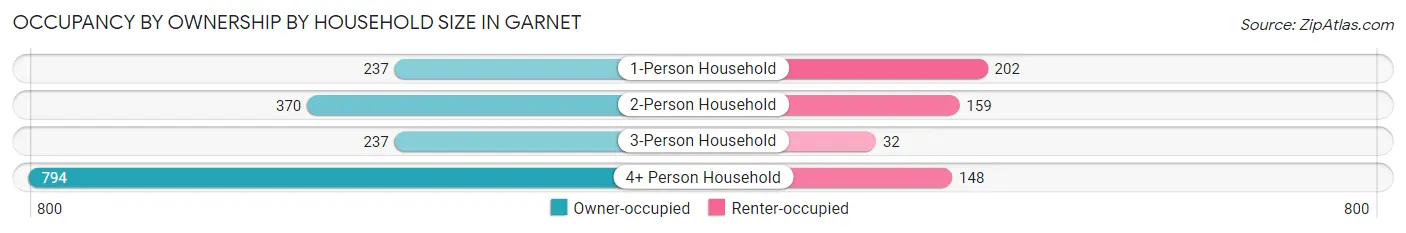
| Household Size | Owner-occupied | Renter-occupied |
| 1-Person Household | 237 (54.0%) | 202 (46.0%) |
| 2-Person Household | 370 (69.9%) | 159 (30.1%) |
| 3-Person Household | 237 (88.1%) | 32 (11.9%) |
| 4+ Person Household | 794 (84.3%) | 148 (15.7%) |
| Total Housing Units | 1,638 (75.2%) | 541 (24.8%) |
Occupancy by Educational Attainment in Garnet
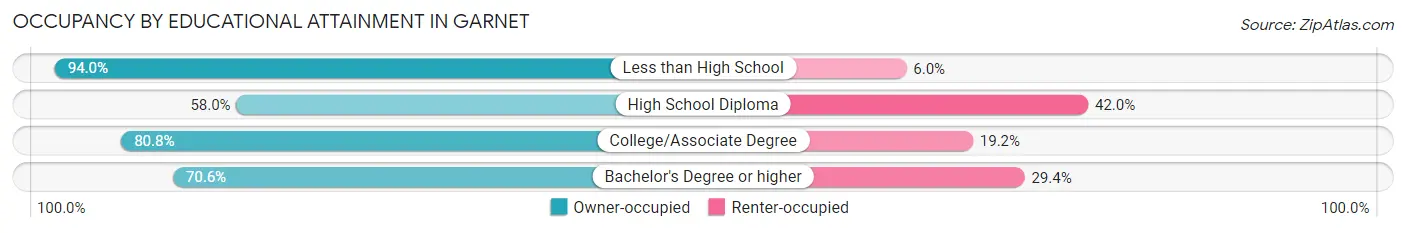
| Household Size | Owner-occupied | Renter-occupied |
| Less than High School | 691 (94.0%) | 44 (6.0%) |
| High School Diploma | 493 (58.0%) | 357 (42.0%) |
| College/Associate Degree | 274 (80.8%) | 65 (19.2%) |
| Bachelor's Degree or higher | 180 (70.6%) | 75 (29.4%) |
Occupancy by Age of Householder in Garnet
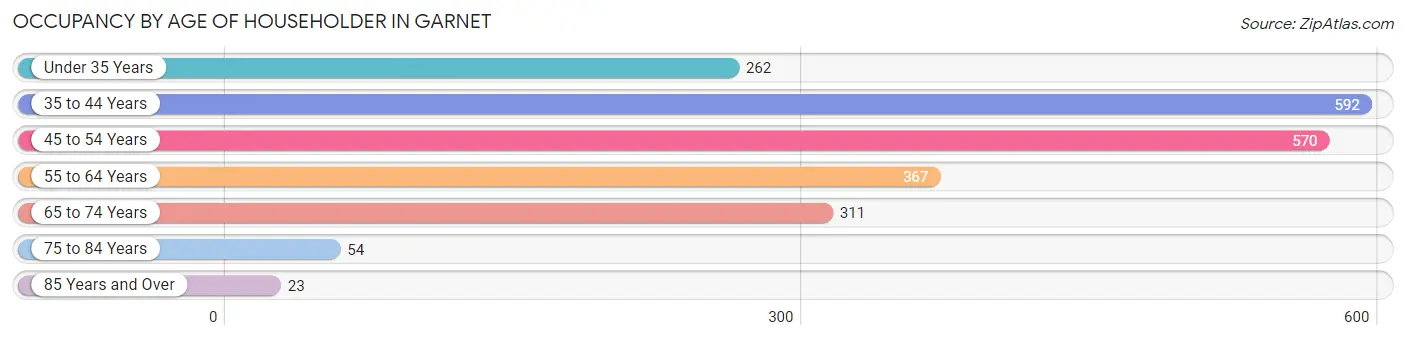
| Age Bracket | # Households | % Households |
| Under 35 Years | 262 | 12.0% |
| 35 to 44 Years | 592 | 27.2% |
| 45 to 54 Years | 570 | 26.2% |
| 55 to 64 Years | 367 | 16.8% |
| 65 to 74 Years | 311 | 14.3% |
| 75 to 84 Years | 54 | 2.5% |
| 85 Years and Over | 23 | 1.1% |
| Total | 2,179 | 100.0% |
Housing Finances in Garnet
Median Income by Occupancy in Garnet
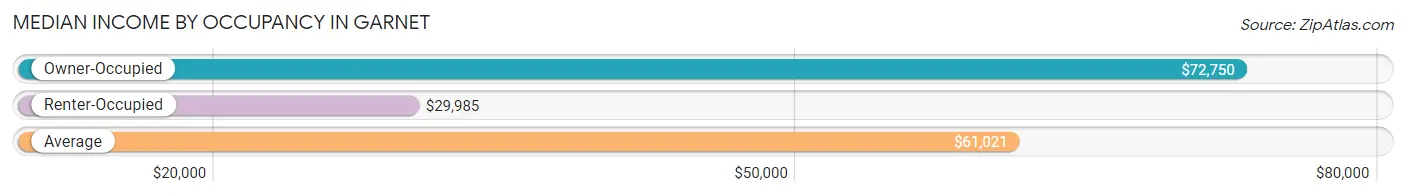
| Occupancy Type | # Households | Median Income |
| Owner-Occupied | 1,638 (75.2%) | $72,750 |
| Renter-Occupied | 541 (24.8%) | $29,985 |
| Average | 2,179 (100.0%) | $61,021 |
Occupancy by Householder Income Bracket in Garnet
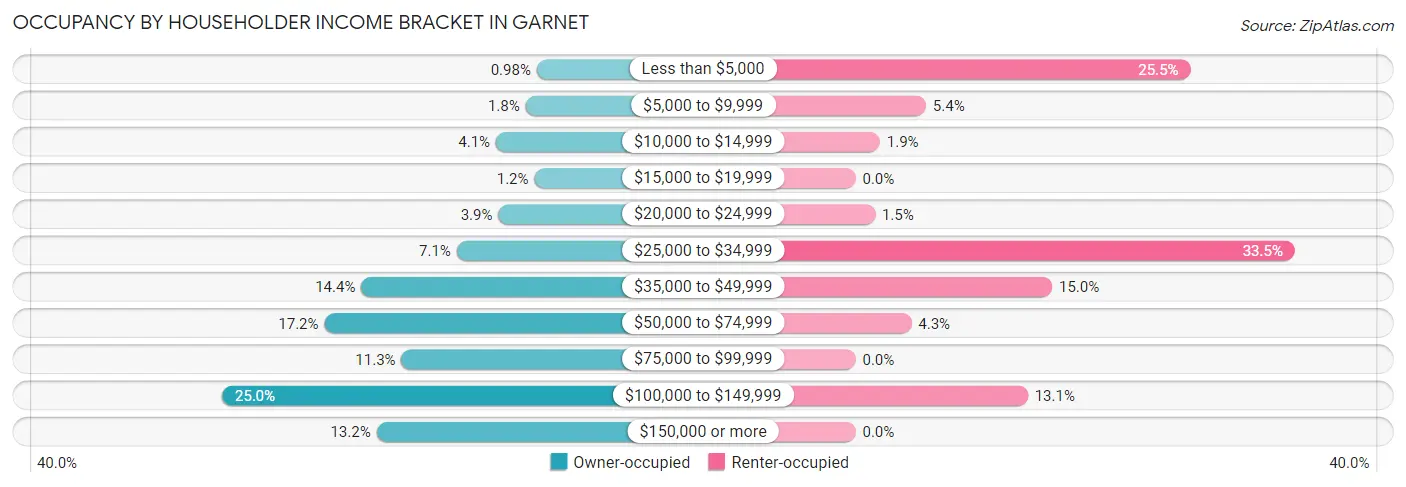
| Income Bracket | Owner-occupied | Renter-occupied |
| Less than $5,000 | 16 (1.0%) | 138 (25.5%) |
| $5,000 to $9,999 | 30 (1.8%) | 29 (5.4%) |
| $10,000 to $14,999 | 67 (4.1%) | 10 (1.8%) |
| $15,000 to $19,999 | 19 (1.2%) | 0 (0.0%) |
| $20,000 to $24,999 | 64 (3.9%) | 8 (1.5%) |
| $25,000 to $34,999 | 116 (7.1%) | 181 (33.5%) |
| $35,000 to $49,999 | 235 (14.3%) | 81 (15.0%) |
| $50,000 to $74,999 | 281 (17.2%) | 23 (4.3%) |
| $75,000 to $99,999 | 185 (11.3%) | 0 (0.0%) |
| $100,000 to $149,999 | 409 (25.0%) | 71 (13.1%) |
| $150,000 or more | 216 (13.2%) | 0 (0.0%) |
| Total | 1,638 (100.0%) | 541 (100.0%) |
Monthly Housing Cost Tiers in Garnet
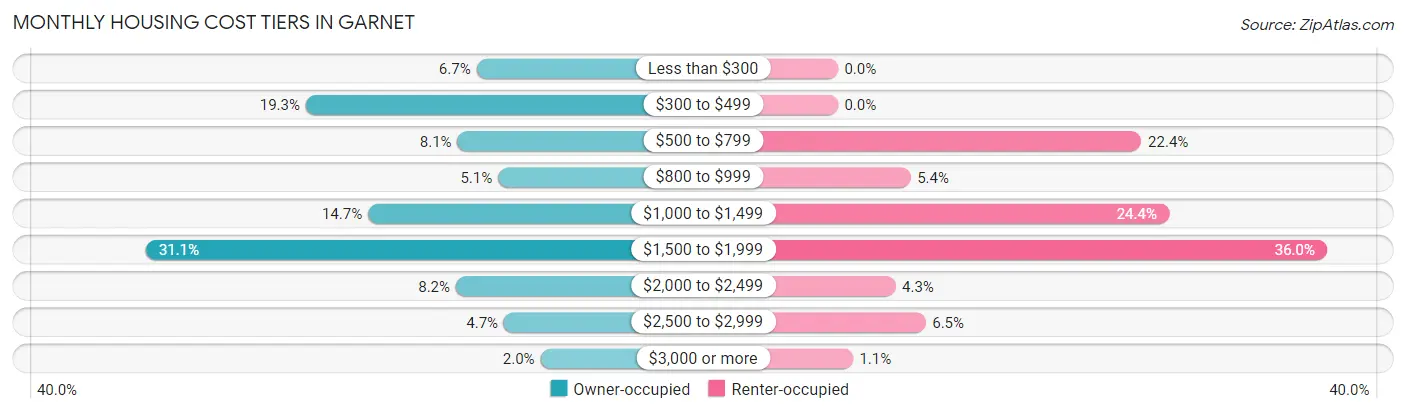
| Monthly Cost | Owner-occupied | Renter-occupied |
| Less than $300 | 110 (6.7%) | 0 (0.0%) |
| $300 to $499 | 316 (19.3%) | 0 (0.0%) |
| $500 to $799 | 133 (8.1%) | 121 (22.4%) |
| $800 to $999 | 84 (5.1%) | 29 (5.4%) |
| $1,000 to $1,499 | 241 (14.7%) | 132 (24.4%) |
| $1,500 to $1,999 | 509 (31.1%) | 195 (36.0%) |
| $2,000 to $2,499 | 135 (8.2%) | 23 (4.3%) |
| $2,500 to $2,999 | 77 (4.7%) | 35 (6.5%) |
| $3,000 or more | 33 (2.0%) | 6 (1.1%) |
| Total | 1,638 (100.0%) | 541 (100.0%) |
Physical Housing Characteristics in Garnet
Housing Structures in Garnet
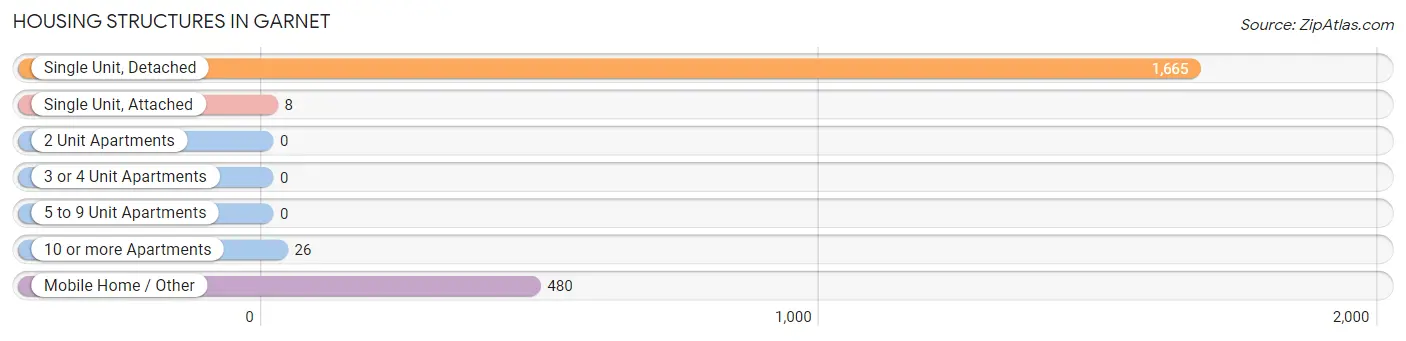
| Structure Type | # Housing Units | % Housing Units |
| Single Unit, Detached | 1,665 | 76.4% |
| Single Unit, Attached | 8 | 0.4% |
| 2 Unit Apartments | 0 | 0.0% |
| 3 or 4 Unit Apartments | 0 | 0.0% |
| 5 to 9 Unit Apartments | 0 | 0.0% |
| 10 or more Apartments | 26 | 1.2% |
| Mobile Home / Other | 480 | 22.0% |
| Total | 2,179 | 100.0% |
Housing Structures by Occupancy in Garnet
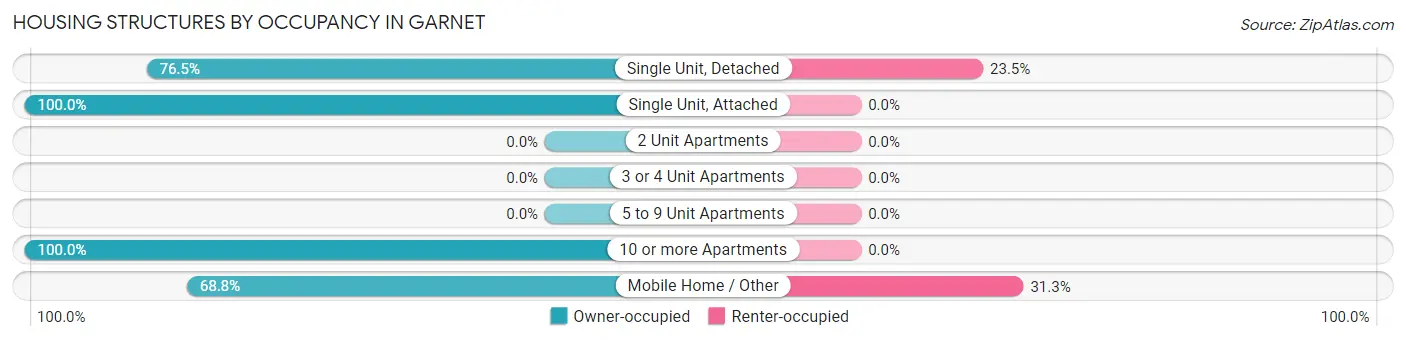
| Structure Type | Owner-occupied | Renter-occupied |
| Single Unit, Detached | 1,274 (76.5%) | 391 (23.5%) |
| Single Unit, Attached | 8 (100.0%) | 0 (0.0%) |
| 2 Unit Apartments | 0 (0.0%) | 0 (0.0%) |
| 3 or 4 Unit Apartments | 0 (0.0%) | 0 (0.0%) |
| 5 to 9 Unit Apartments | 0 (0.0%) | 0 (0.0%) |
| 10 or more Apartments | 26 (100.0%) | 0 (0.0%) |
| Mobile Home / Other | 330 (68.8%) | 150 (31.2%) |
| Total | 1,638 (75.2%) | 541 (24.8%) |
Housing Structures by Number of Rooms in Garnet
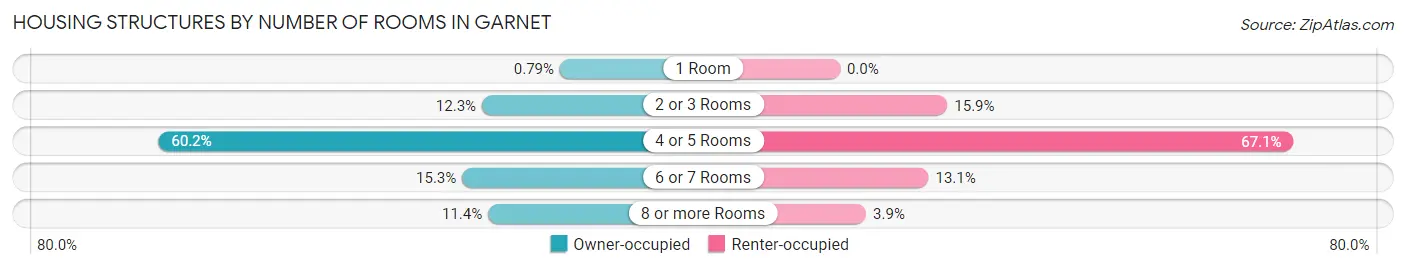
| Number of Rooms | Owner-occupied | Renter-occupied |
| 1 Room | 13 (0.8%) | 0 (0.0%) |
| 2 or 3 Rooms | 202 (12.3%) | 86 (15.9%) |
| 4 or 5 Rooms | 986 (60.2%) | 363 (67.1%) |
| 6 or 7 Rooms | 250 (15.3%) | 71 (13.1%) |
| 8 or more Rooms | 187 (11.4%) | 21 (3.9%) |
| Total | 1,638 (100.0%) | 541 (100.0%) |
Housing Structure by Heating Type in Garnet
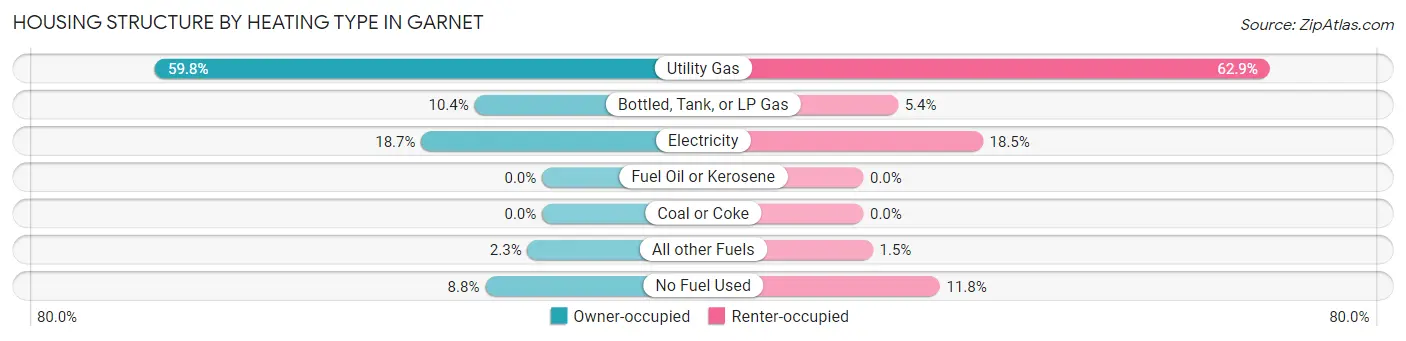
| Heating Type | Owner-occupied | Renter-occupied |
| Utility Gas | 980 (59.8%) | 340 (62.8%) |
| Bottled, Tank, or LP Gas | 171 (10.4%) | 29 (5.4%) |
| Electricity | 306 (18.7%) | 100 (18.5%) |
| Fuel Oil or Kerosene | 0 (0.0%) | 0 (0.0%) |
| Coal or Coke | 0 (0.0%) | 0 (0.0%) |
| All other Fuels | 37 (2.3%) | 8 (1.5%) |
| No Fuel Used | 144 (8.8%) | 64 (11.8%) |
| Total | 1,638 (100.0%) | 541 (100.0%) |
Household Vehicle Usage in Garnet
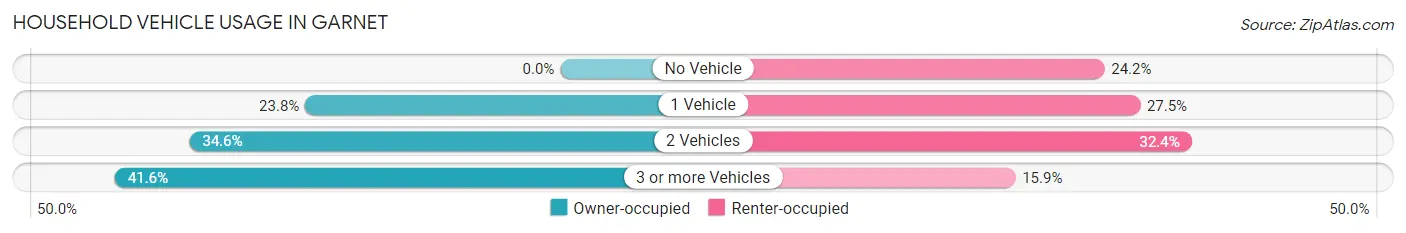
| Vehicles per Household | Owner-occupied | Renter-occupied |
| No Vehicle | 0 (0.0%) | 131 (24.2%) |
| 1 Vehicle | 390 (23.8%) | 149 (27.5%) |
| 2 Vehicles | 567 (34.6%) | 175 (32.4%) |
| 3 or more Vehicles | 681 (41.6%) | 86 (15.9%) |
| Total | 1,638 (100.0%) | 541 (100.0%) |
Real Estate & Mortgages in Garnet
Real Estate and Mortgage Overview in Garnet
| Characteristic | Without Mortgage | With Mortgage |
| Housing Units | 596 | 1,042 |
| Median Property Value | $139,100 | $279,300 |
| Median Household Income | $63,125 | $89 |
| Monthly Housing Costs | $463 | $33 |
| Real Estate Taxes | $1,013 | $28 |
Property Value by Mortgage Status in Garnet
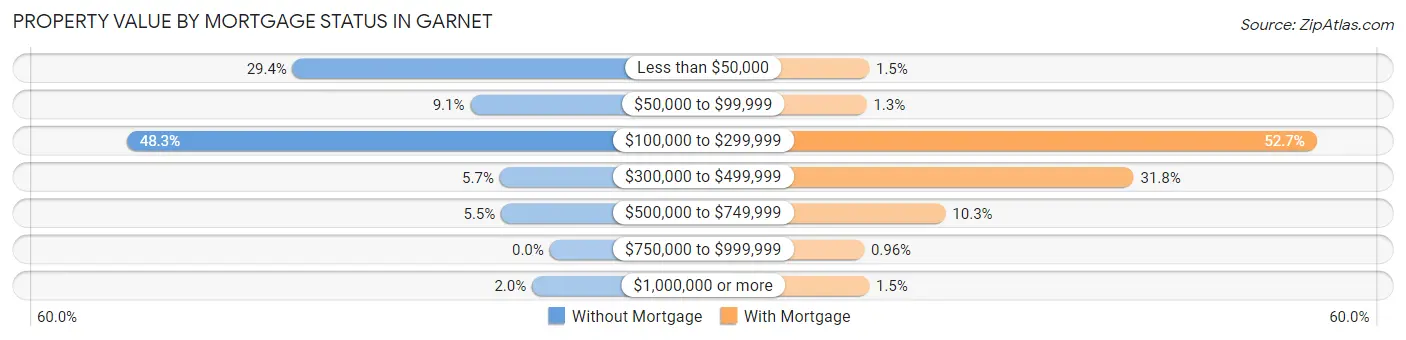
| Property Value | Without Mortgage | With Mortgage |
| Less than $50,000 | 175 (29.4%) | 16 (1.5%) |
| $50,000 to $99,999 | 54 (9.1%) | 13 (1.3%) |
| $100,000 to $299,999 | 288 (48.3%) | 549 (52.7%) |
| $300,000 to $499,999 | 34 (5.7%) | 331 (31.8%) |
| $500,000 to $749,999 | 33 (5.5%) | 107 (10.3%) |
| $750,000 to $999,999 | 0 (0.0%) | 10 (1.0%) |
| $1,000,000 or more | 12 (2.0%) | 16 (1.5%) |
| Total | 596 (100.0%) | 1,042 (100.0%) |
Household Income by Mortgage Status in Garnet
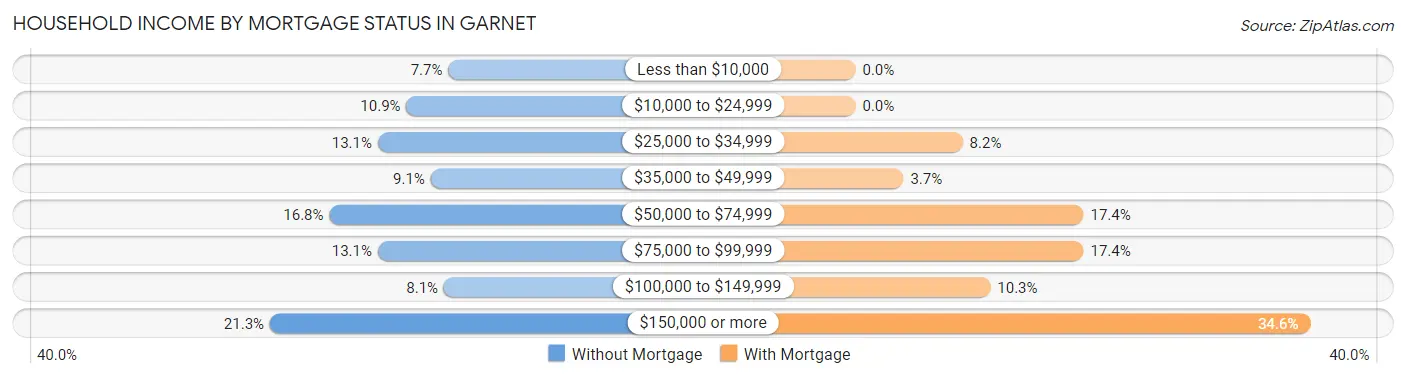
| Household Income | Without Mortgage | With Mortgage |
| Less than $10,000 | 46 (7.7%) | 0 (0.0%) |
| $10,000 to $24,999 | 65 (10.9%) | 0 (0.0%) |
| $25,000 to $34,999 | 78 (13.1%) | 85 (8.2%) |
| $35,000 to $49,999 | 54 (9.1%) | 38 (3.6%) |
| $50,000 to $74,999 | 100 (16.8%) | 181 (17.4%) |
| $75,000 to $99,999 | 78 (13.1%) | 181 (17.4%) |
| $100,000 to $149,999 | 48 (8.1%) | 107 (10.3%) |
| $150,000 or more | 127 (21.3%) | 361 (34.6%) |
| Total | 596 (100.0%) | 1,042 (100.0%) |
Property Value to Household Income Ratio in Garnet
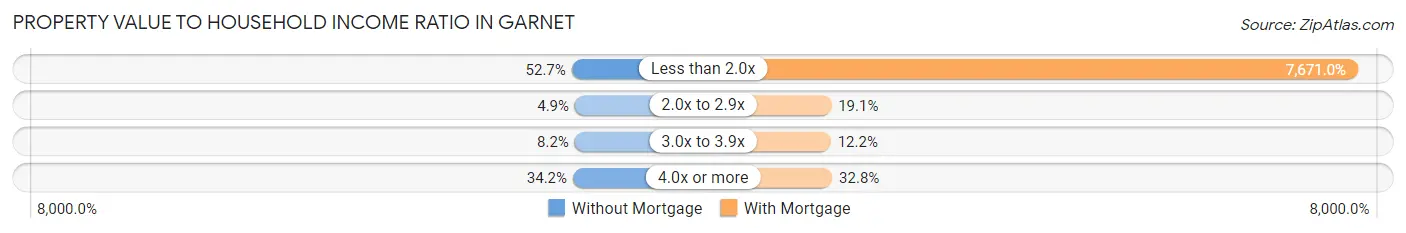
| Value-to-Income Ratio | Without Mortgage | With Mortgage |
| Less than 2.0x | 314 (52.7%) | 79,932 (7,671.0%) |
| 2.0x to 2.9x | 29 (4.9%) | 199 (19.1%) |
| 3.0x to 3.9x | 49 (8.2%) | 127 (12.2%) |
| 4.0x or more | 204 (34.2%) | 342 (32.8%) |
| Total | 596 (100.0%) | 1,042 (100.0%) |
Real Estate Taxes by Mortgage Status in Garnet
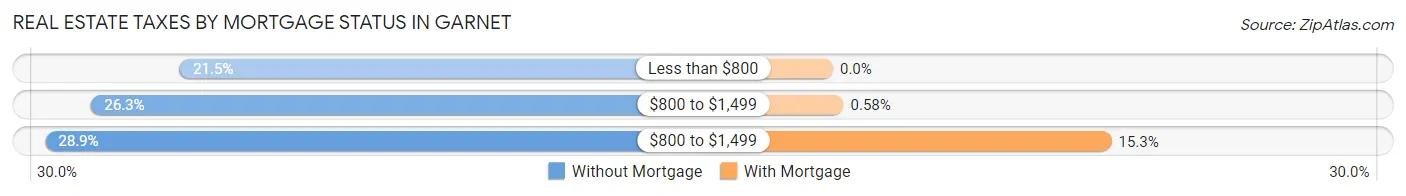
| Property Taxes | Without Mortgage | With Mortgage |
| Less than $800 | 128 (21.5%) | 0 (0.0%) |
| $800 to $1,499 | 157 (26.3%) | 6 (0.6%) |
| $800 to $1,499 | 172 (28.9%) | 159 (15.3%) |
| Total | 596 (100.0%) | 1,042 (100.0%) |
Health & Disability in Garnet
Health Insurance Coverage by Age in Garnet
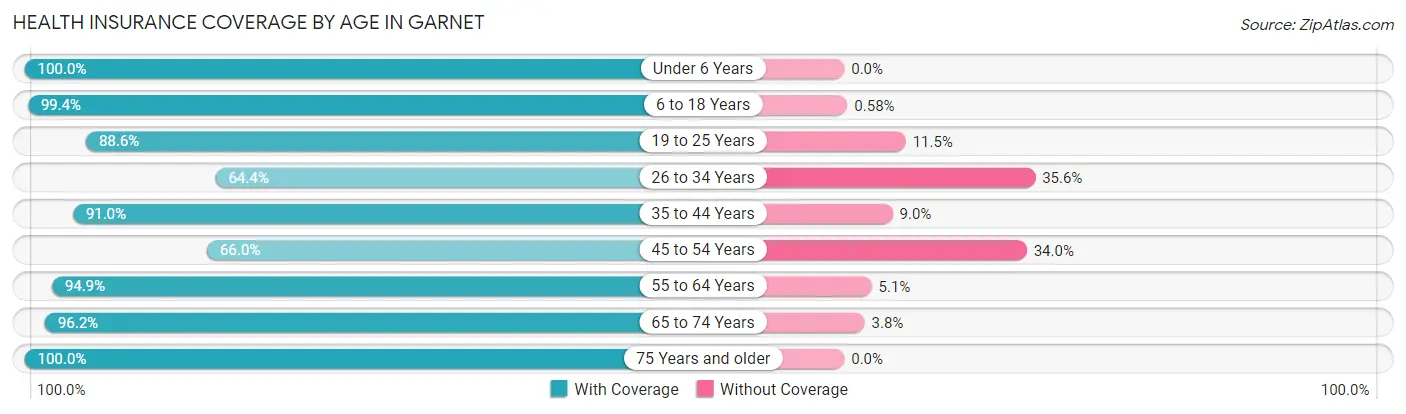
| Age Bracket | With Coverage | Without Coverage |
| Under 6 Years | 519 (100.0%) | 0 (0.0%) |
| 6 to 18 Years | 1,700 (99.4%) | 10 (0.6%) |
| 19 to 25 Years | 549 (88.5%) | 71 (11.5%) |
| 26 to 34 Years | 474 (64.4%) | 262 (35.6%) |
| 35 to 44 Years | 870 (91.0%) | 86 (9.0%) |
| 45 to 54 Years | 861 (66.0%) | 444 (34.0%) |
| 55 to 64 Years | 615 (94.9%) | 33 (5.1%) |
| 65 to 74 Years | 559 (96.2%) | 22 (3.8%) |
| 75 Years and older | 253 (100.0%) | 0 (0.0%) |
| Total | 6,400 (87.3%) | 928 (12.7%) |
Health Insurance Coverage by Citizenship Status in Garnet
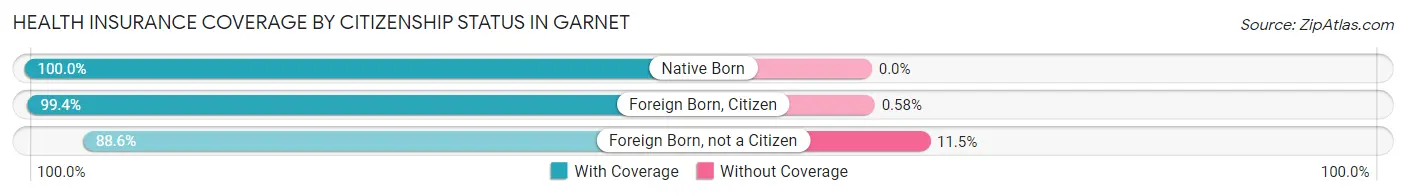
| Citizenship Status | With Coverage | Without Coverage |
| Native Born | 519 (100.0%) | 0 (0.0%) |
| Foreign Born, Citizen | 1,700 (99.4%) | 10 (0.6%) |
| Foreign Born, not a Citizen | 549 (88.5%) | 71 (11.5%) |
Health Insurance Coverage by Household Income in Garnet
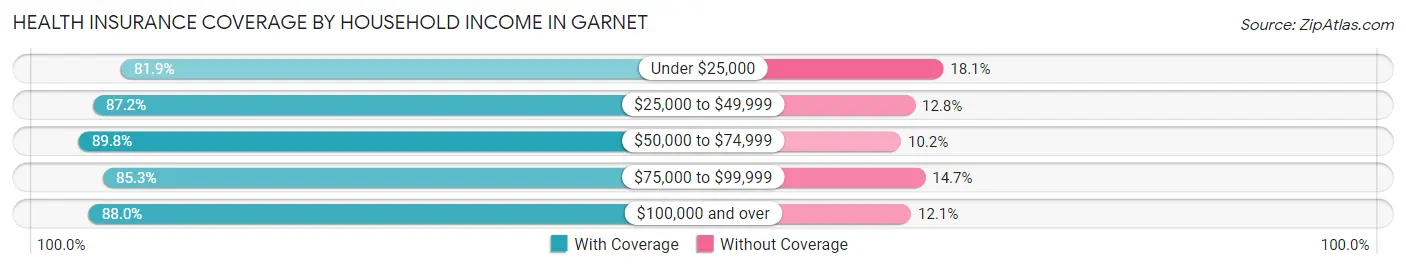
| Household Income | With Coverage | Without Coverage |
| Under $25,000 | 575 (81.9%) | 127 (18.1%) |
| $25,000 to $49,999 | 1,521 (87.2%) | 223 (12.8%) |
| $50,000 to $74,999 | 1,122 (89.8%) | 127 (10.2%) |
| $75,000 to $99,999 | 470 (85.3%) | 81 (14.7%) |
| $100,000 and over | 2,700 (87.9%) | 370 (12.0%) |
Public vs Private Health Insurance Coverage by Age in Garnet
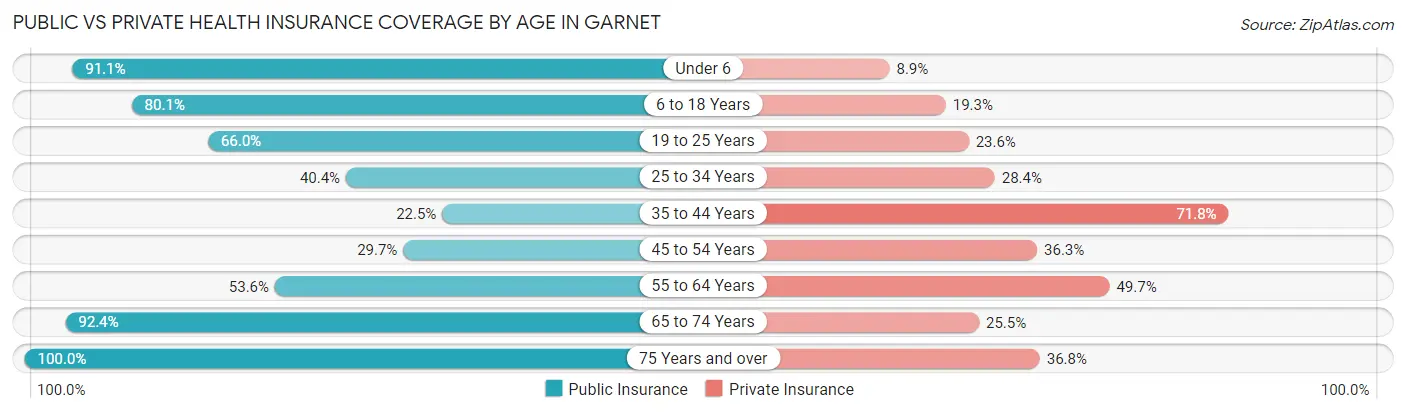
| Age Bracket | Public Insurance | Private Insurance |
| Under 6 | 473 (91.1%) | 46 (8.9%) |
| 6 to 18 Years | 1,370 (80.1%) | 330 (19.3%) |
| 19 to 25 Years | 409 (66.0%) | 146 (23.5%) |
| 25 to 34 Years | 297 (40.4%) | 209 (28.4%) |
| 35 to 44 Years | 215 (22.5%) | 686 (71.8%) |
| 45 to 54 Years | 388 (29.7%) | 473 (36.2%) |
| 55 to 64 Years | 347 (53.5%) | 322 (49.7%) |
| 65 to 74 Years | 537 (92.4%) | 148 (25.5%) |
| 75 Years and over | 253 (100.0%) | 93 (36.8%) |
| Total | 4,289 (58.5%) | 2,453 (33.5%) |
Disability Status by Sex by Age in Garnet
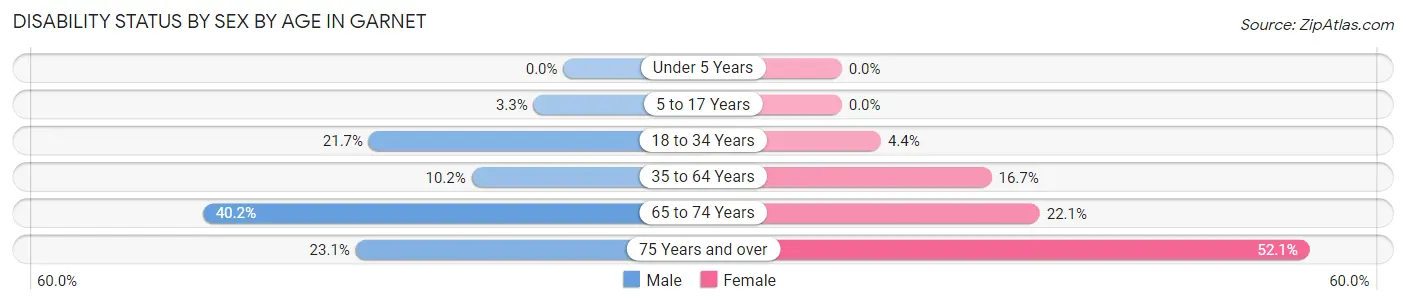
| Age Bracket | Male | Female |
| Under 5 Years | 0 (0.0%) | 0 (0.0%) |
| 5 to 17 Years | 27 (3.3%) | 0 (0.0%) |
| 18 to 34 Years | 175 (21.7%) | 32 (4.4%) |
| 35 to 64 Years | 160 (10.2%) | 224 (16.7%) |
| 65 to 74 Years | 155 (40.2%) | 43 (22.1%) |
| 75 Years and over | 31 (23.1%) | 62 (52.1%) |
Disability Class by Sex by Age in Garnet
Disability Class: Hearing Difficulty
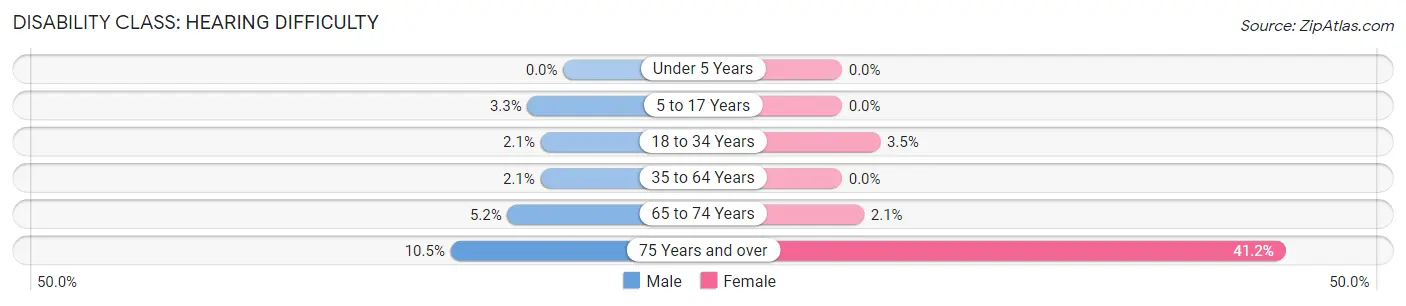
| Age Bracket | Male | Female |
| Under 5 Years | 0 (0.0%) | 0 (0.0%) |
| 5 to 17 Years | 27 (3.3%) | 0 (0.0%) |
| 18 to 34 Years | 17 (2.1%) | 26 (3.5%) |
| 35 to 64 Years | 33 (2.1%) | 0 (0.0%) |
| 65 to 74 Years | 20 (5.2%) | 4 (2.1%) |
| 75 Years and over | 14 (10.4%) | 49 (41.2%) |
Disability Class: Vision Difficulty
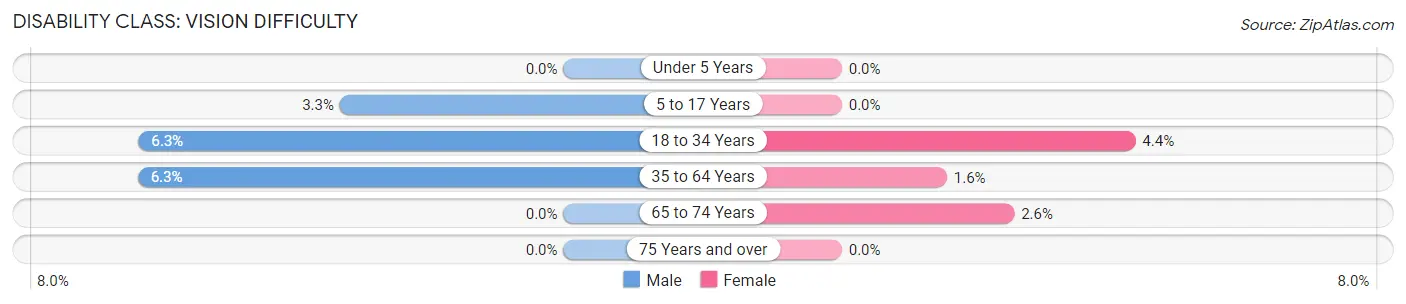
| Age Bracket | Male | Female |
| Under 5 Years | 0 (0.0%) | 0 (0.0%) |
| 5 to 17 Years | 27 (3.3%) | 0 (0.0%) |
| 18 to 34 Years | 51 (6.3%) | 32 (4.4%) |
| 35 to 64 Years | 99 (6.3%) | 21 (1.6%) |
| 65 to 74 Years | 0 (0.0%) | 5 (2.6%) |
| 75 Years and over | 0 (0.0%) | 0 (0.0%) |
Disability Class: Cognitive Difficulty
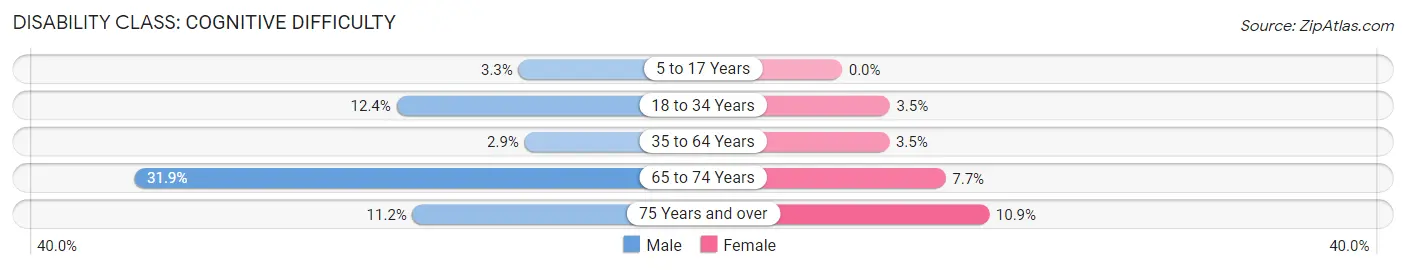
| Age Bracket | Male | Female |
| 5 to 17 Years | 27 (3.3%) | 0 (0.0%) |
| 18 to 34 Years | 100 (12.4%) | 26 (3.5%) |
| 35 to 64 Years | 45 (2.9%) | 47 (3.5%) |
| 65 to 74 Years | 123 (31.9%) | 15 (7.7%) |
| 75 Years and over | 15 (11.2%) | 13 (10.9%) |
Disability Class: Ambulatory Difficulty
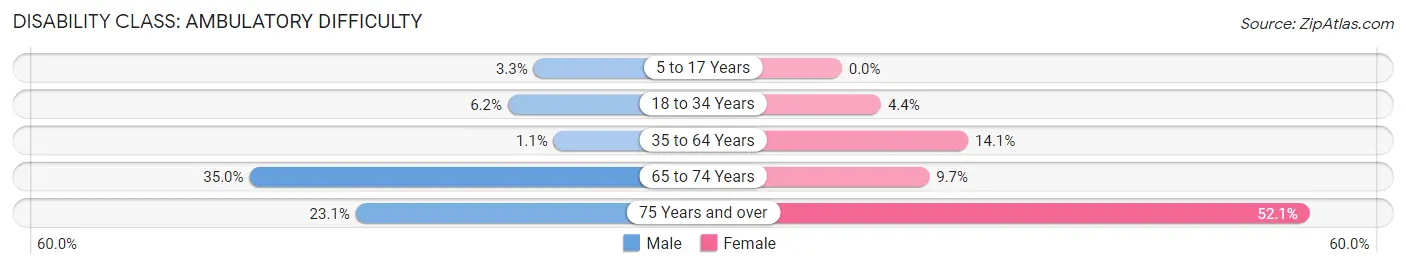
| Age Bracket | Male | Female |
| 5 to 17 Years | 27 (3.3%) | 0 (0.0%) |
| 18 to 34 Years | 50 (6.2%) | 32 (4.4%) |
| 35 to 64 Years | 17 (1.1%) | 189 (14.1%) |
| 65 to 74 Years | 135 (35.0%) | 19 (9.7%) |
| 75 Years and over | 31 (23.1%) | 62 (52.1%) |
Disability Class: Self-Care Difficulty
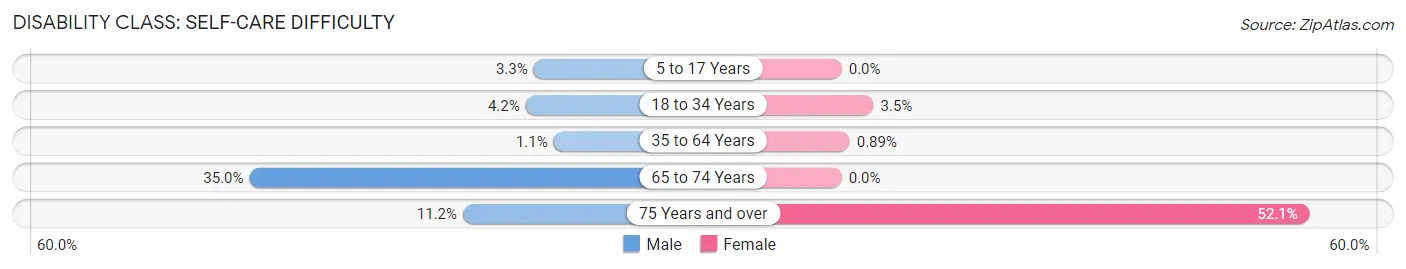
| Age Bracket | Male | Female |
| 5 to 17 Years | 27 (3.3%) | 0 (0.0%) |
| 18 to 34 Years | 34 (4.2%) | 26 (3.5%) |
| 35 to 64 Years | 17 (1.1%) | 12 (0.9%) |
| 65 to 74 Years | 135 (35.0%) | 0 (0.0%) |
| 75 Years and over | 15 (11.2%) | 62 (52.1%) |
Technology Access in Garnet
Computing Device Access in Garnet
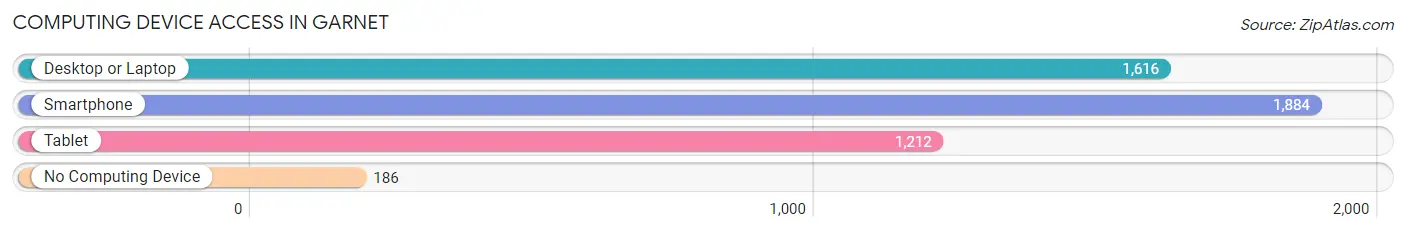
| Device Type | # Households | % Households |
| Desktop or Laptop | 1,616 | 74.2% |
| Smartphone | 1,884 | 86.5% |
| Tablet | 1,212 | 55.6% |
| No Computing Device | 186 | 8.5% |
| Total | 2,179 | 100.0% |
Internet Access in Garnet
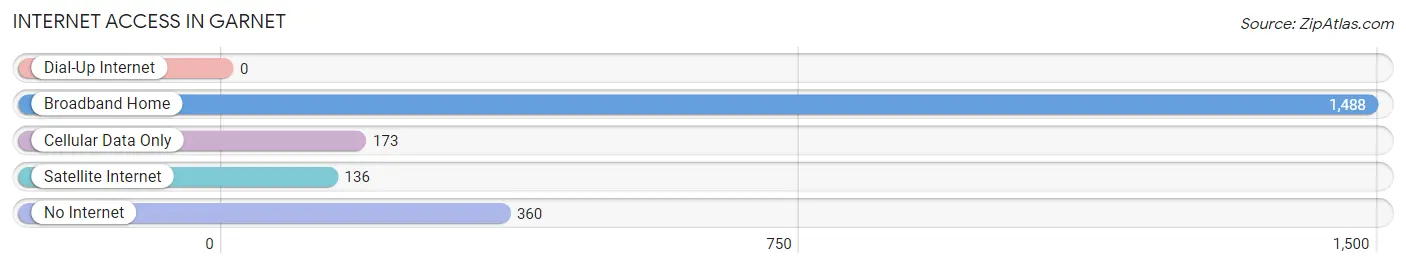
| Internet Type | # Households | % Households |
| Dial-Up Internet | 0 | 0.0% |
| Broadband Home | 1,488 | 68.3% |
| Cellular Data Only | 173 | 7.9% |
| Satellite Internet | 136 | 6.2% |
| No Internet | 360 | 16.5% |
| Total | 2,179 | 100.0% |
Garnet Summary
Garnet is a small unincorporated community located in the San Bernardino County of California. It is situated in the San Bernardino Mountains, approximately 20 miles east of the city of San Bernardino. The community is located at an elevation of 5,000 feet and is surrounded by the San Bernardino National Forest.
History
Garnet was founded in the late 1800s by gold miners who were attracted to the area by the discovery of gold in the nearby San Bernardino Mountains. The miners named the town after the garnet gemstones they found in the area. The town was initially a mining camp, but it soon grew into a small community with a post office, a general store, a hotel, and a saloon.
In the early 1900s, Garnet became a popular tourist destination due to its proximity to the San Bernardino Mountains. The town was home to a number of resorts and lodges, and it was a popular destination for hikers, campers, and fishermen.
Geography
Garnet is located in the San Bernardino Mountains, approximately 20 miles east of the city of San Bernardino. The community is situated at an elevation of 5,000 feet and is surrounded by the San Bernardino National Forest. The area is characterized by rugged terrain, with steep mountains and deep canyons. The climate is generally mild, with warm summers and cool winters.
Economy
Garnet is a small, rural community with a limited economy. The primary industry in the area is tourism, with many visitors coming to the area to enjoy the natural beauty of the San Bernardino Mountains. The town is also home to a number of small businesses, including restaurants, stores, and lodges.
Demographics
As of the 2010 census, the population of Garnet was 1,072. The racial makeup of the town was 94.3% White, 0.7% African American, 0.7% Native American, 0.7% Asian, 0.3% Pacific Islander, and 2.7% from other races. The median household income was $37,500, and the median age was 44.
Garnet is a small, rural community with a limited economy. The town is a popular tourist destination due to its proximity to the San Bernardino Mountains, and it is home to a number of small businesses. The population of the town is diverse, with a mix of different racial and ethnic backgrounds.
Common Questions
What is Per Capita Income in Garnet?
Per Capita income in Garnet is $22,604.
What is the Median Family Income in Garnet?
Median Family Income in Garnet is $68,839.
What is the Median Household income in Garnet?
Median Household Income in Garnet is $61,021.
What is Income or Wage Gap in Garnet?
Income or Wage Gap in Garnet is 36.7%.
Women in Garnet earn 63.3 cents for every dollar earned by a man.
What is Inequality or Gini Index in Garnet?
Inequality or Gini Index in Garnet is 0.41.
What is the Total Population of Garnet?
Total Population of Garnet is 7,328.
What is the Total Male Population of Garnet?
Total Male Population of Garnet is 3,760.
What is the Total Female Population of Garnet?
Total Female Population of Garnet is 3,568.
What is the Ratio of Males per 100 Females in Garnet?
There are 105.38 Males per 100 Females in Garnet.
What is the Ratio of Females per 100 Males in Garnet?
There are 94.89 Females per 100 Males in Garnet.
What is the Median Population Age in Garnet?
Median Population Age in Garnet is 36.5 Years.
What is the Average Family Size in Garnet
Average Family Size in Garnet is 3.9 People.
What is the Average Household Size in Garnet
Average Household Size in Garnet is 3.4 People.
How Large is the Labor Force in Garnet?
There are 3,250 People in the Labor Forcein in Garnet.
What is the Percentage of People in the Labor Force in Garnet?
59.8% of People are in the Labor Force in Garnet.
What is the Unemployment Rate in Garnet?
Unemployment Rate in Garnet is 3.4%.