Cities with the Highest Percentage of Population Employed in Food Preparation & Serving in New York
RELATED REPORTS & OPTIONS
Food Preparation & Serving
New York
Compare Cities
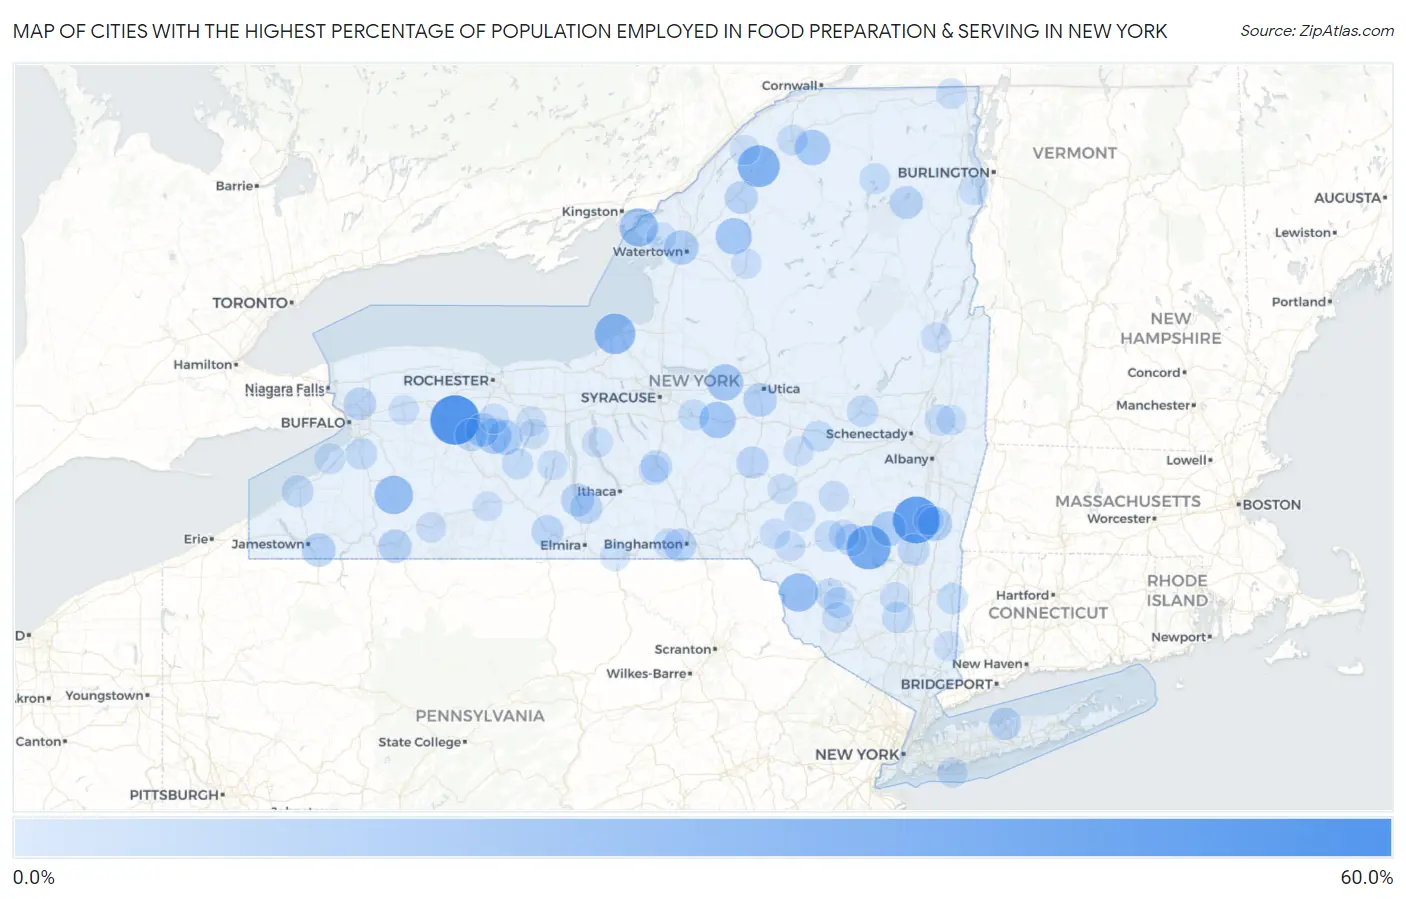
Map of Cities with the Highest Percentage of Population Employed in Food Preparation & Serving in New York
0.0%
60.0%
Cities with the Highest Percentage of Population Employed in Food Preparation & Serving in New York
| City | % Employed | vs State | vs National | |
| 1. | West Danby | 53.1% | 4.8%(+48.3)#1 | 5.3%(+47.8)#97 |
| 2. | Linwood | 50.0% | 4.8%(+45.2)#2 | 5.3%(+44.7)#113 |
| 3. | Leeds | 44.5% | 4.8%(+39.7)#3 | 5.3%(+39.2)#141 |
| 4. | Phoenicia | 38.7% | 4.8%(+33.9)#4 | 5.3%(+33.4)#200 |
| 5. | Marist College | 35.1% | 4.8%(+30.2)#5 | 5.3%(+29.8)#251 |
| 6. | Dekalb Junction | 34.5% | 4.8%(+29.7)#6 | 5.3%(+29.2)#263 |
| 7. | Suny Oswego | 31.9% | 4.8%(+27.1)#7 | 5.3%(+26.6)#299 |
| 8. | Jeffersonville | 27.8% | 4.8%(+23.0)#8 | 5.3%(+22.6)#403 |
| 9. | Machias | 27.8% | 4.8%(+23.0)#9 | 5.3%(+22.6)#404 |
| 10. | Cape Vincent | 27.6% | 4.8%(+22.7)#10 | 5.3%(+22.3)#411 |
| 11. | Bard College | 27.4% | 4.8%(+22.6)#11 | 5.3%(+22.1)#415 |
| 12. | Siena College | 25.1% | 4.8%(+20.3)#12 | 5.3%(+19.9)#497 |
| 13. | Willsboro Point | 24.6% | 4.8%(+19.8)#13 | 5.3%(+19.3)#520 |
| 14. | Eldred | 23.8% | 4.8%(+18.9)#14 | 5.3%(+18.5)#564 |
| 15. | Morrisville | 23.6% | 4.8%(+18.8)#15 | 5.3%(+18.3)#573 |
| 16. | Verona | 23.5% | 4.8%(+18.7)#16 | 5.3%(+18.2)#582 |
| 17. | Rochester Institute Of Technology | 23.5% | 4.8%(+18.6)#17 | 5.3%(+18.2)#587 |
| 18. | Natural Bridge | 23.4% | 4.8%(+18.6)#18 | 5.3%(+18.1)#591 |
| 19. | Cementon | 23.0% | 4.8%(+18.2)#19 | 5.3%(+17.7)#618 |
| 20. | Parishville | 22.0% | 4.8%(+17.1)#20 | 5.3%(+16.7)#681 |
| 21. | Hemlock | 21.0% | 4.8%(+16.2)#21 | 5.3%(+15.8)#734 |
| 22. | Niagara University | 20.7% | 4.8%(+15.9)#22 | 5.3%(+15.4)#762 |
| 23. | Honeoye | 20.6% | 4.8%(+15.8)#23 | 5.3%(+15.3)#772 |
| 24. | Tannersville | 20.4% | 4.8%(+15.6)#24 | 5.3%(+15.1)#793 |
| 25. | Hurleyville | 20.1% | 4.8%(+15.3)#25 | 5.3%(+14.8)#828 |
| 26. | Glen Park | 19.9% | 4.8%(+15.1)#26 | 5.3%(+14.6)#860 |
| 27. | Claverack Red Mills | 19.7% | 4.8%(+14.9)#27 | 5.3%(+14.4)#879 |
| 28. | Chadwicks | 18.4% | 4.8%(+13.6)#28 | 5.3%(+13.1)#1,015 |
| 29. | Lakeville | 18.4% | 4.8%(+13.6)#29 | 5.3%(+13.1)#1,020 |
| 30. | Frewsburg | 18.2% | 4.8%(+13.4)#30 | 5.3%(+12.9)#1,038 |
| 31. | St Bonaventure | 18.0% | 4.8%(+13.2)#31 | 5.3%(+12.7)#1,062 |
| 32. | Nazareth College | 17.4% | 4.8%(+12.6)#32 | 5.3%(+12.1)#1,159 |
| 33. | Lake Placid | 17.3% | 4.8%(+12.5)#33 | 5.3%(+12.0)#1,164 |
| 34. | St. John Fisher College | 17.1% | 4.8%(+12.3)#34 | 5.3%(+11.8)#1,192 |
| 35. | Watkins Glen | 16.9% | 4.8%(+12.1)#35 | 5.3%(+11.6)#1,217 |
| 36. | Hailesboro | 16.8% | 4.8%(+12.0)#36 | 5.3%(+11.5)#1,229 |
| 37. | Binghamton University | 16.8% | 4.8%(+12.0)#37 | 5.3%(+11.5)#1,230 |
| 38. | Hartwick Seminary | 16.7% | 4.8%(+11.9)#38 | 5.3%(+11.4)#1,254 |
| 39. | University At Buffalo | 16.4% | 4.8%(+11.6)#39 | 5.3%(+11.1)#1,307 |
| 40. | Geneseo | 16.1% | 4.8%(+11.3)#40 | 5.3%(+10.8)#1,377 |
| 41. | Odessa | 16.0% | 4.8%(+11.2)#41 | 5.3%(+10.7)#1,403 |
| 42. | Stony Brook University | 15.7% | 4.8%(+10.9)#42 | 5.3%(+10.4)#1,468 |
| 43. | Pine Hill | 15.7% | 4.8%(+10.9)#43 | 5.3%(+10.4)#1,476 |
| 44. | Coopers Plains | 15.6% | 4.8%(+10.8)#44 | 5.3%(+10.3)#1,494 |
| 45. | New Berlin | 15.4% | 4.8%(+10.6)#45 | 5.3%(+10.1)#1,527 |
| 46. | Cortland | 15.2% | 4.8%(+10.4)#46 | 5.3%(+9.93)#1,573 |
| 47. | Tivoli | 15.2% | 4.8%(+10.4)#47 | 5.3%(+9.91)#1,576 |
| 48. | Fredonia | 15.0% | 4.8%(+10.2)#48 | 5.3%(+9.73)#1,624 |
| 49. | North Boston | 14.5% | 4.8%(+9.73)#49 | 5.3%(+9.26)#1,754 |
| 50. | Fonda | 14.1% | 4.8%(+9.31)#50 | 5.3%(+8.84)#1,873 |
| 51. | Cadyville | 14.1% | 4.8%(+9.27)#51 | 5.3%(+8.80)#1,888 |
| 52. | Naples | 13.9% | 4.8%(+9.05)#52 | 5.3%(+8.58)#1,951 |
| 53. | Margaretville | 13.7% | 4.8%(+8.85)#53 | 5.3%(+8.38)#2,016 |
| 54. | Plattekill | 13.5% | 4.8%(+8.70)#54 | 5.3%(+8.23)#2,061 |
| 55. | Cazenovia | 13.4% | 4.8%(+8.63)#55 | 5.3%(+8.16)#2,082 |
| 56. | Loch Sheldrake | 13.4% | 4.8%(+8.60)#56 | 5.3%(+8.13)#2,095 |
| 57. | Cherry Valley | 13.4% | 4.8%(+8.56)#57 | 5.3%(+8.09)#2,114 |
| 58. | Woodridge | 13.3% | 4.8%(+8.47)#58 | 5.3%(+8.00)#2,144 |
| 59. | Dover Plains | 13.3% | 4.8%(+8.47)#59 | 5.3%(+8.00)#2,149 |
| 60. | Paul Smiths | 13.2% | 4.8%(+8.39)#60 | 5.3%(+7.92)#2,177 |
| 61. | Mechanicville | 13.2% | 4.8%(+8.38)#61 | 5.3%(+7.91)#2,183 |
| 62. | Angola On The Lake | 13.1% | 4.8%(+8.29)#62 | 5.3%(+7.82)#2,213 |
| 63. | Rock Hill | 13.0% | 4.8%(+8.16)#63 | 5.3%(+7.69)#2,265 |
| 64. | Endicott | 13.0% | 4.8%(+8.16)#64 | 5.3%(+7.69)#2,267 |
| 65. | Burlington Flats | 12.9% | 4.8%(+8.09)#65 | 5.3%(+7.62)#2,294 |
| 66. | Sleepy Hollow Lake | 12.9% | 4.8%(+8.08)#66 | 5.3%(+7.61)#2,303 |
| 67. | Potsdam | 12.7% | 4.8%(+7.92)#67 | 5.3%(+7.45)#2,383 |
| 68. | Kauneonga Lake | 12.7% | 4.8%(+7.87)#68 | 5.3%(+7.40)#2,412 |
| 69. | Fleischmanns | 12.7% | 4.8%(+7.85)#69 | 5.3%(+7.38)#2,420 |
| 70. | Delhi | 12.6% | 4.8%(+7.80)#70 | 5.3%(+7.33)#2,430 |
| 71. | Stamford | 12.6% | 4.8%(+7.76)#71 | 5.3%(+7.29)#2,453 |
| 72. | Willsboro | 12.5% | 4.8%(+7.68)#72 | 5.3%(+7.21)#2,483 |
| 73. | Mooers | 12.5% | 4.8%(+7.68)#73 | 5.3%(+7.21)#2,490 |
| 74. | Aurora | 12.3% | 4.8%(+7.47)#74 | 5.3%(+7.00)#2,603 |
| 75. | Hudson | 12.2% | 4.8%(+7.43)#75 | 5.3%(+6.96)#2,625 |
| 76. | Munsons Corners | 12.2% | 4.8%(+7.42)#76 | 5.3%(+6.95)#2,630 |
| 77. | Downsville | 12.2% | 4.8%(+7.40)#77 | 5.3%(+6.93)#2,640 |
| 78. | New Paltz | 12.2% | 4.8%(+7.37)#78 | 5.3%(+6.90)#2,655 |
| 79. | Lake George | 12.2% | 4.8%(+7.35)#79 | 5.3%(+6.88)#2,664 |
| 80. | Walton | 12.2% | 4.8%(+7.34)#80 | 5.3%(+6.87)#2,672 |
| 81. | Vassar College | 12.1% | 4.8%(+7.27)#81 | 5.3%(+6.80)#2,711 |
| 82. | Point Lookout | 12.1% | 4.8%(+7.27)#82 | 5.3%(+6.80)#2,714 |
| 83. | Wurtsboro Hills | 12.1% | 4.8%(+7.26)#83 | 5.3%(+6.79)#2,715 |
| 84. | Danby | 12.1% | 4.8%(+7.24)#84 | 5.3%(+6.77)#2,727 |
| 85. | Lima | 12.0% | 4.8%(+7.18)#85 | 5.3%(+6.71)#2,767 |
| 86. | Friendship | 12.0% | 4.8%(+7.17)#86 | 5.3%(+6.70)#2,771 |
| 87. | Croghan | 11.9% | 4.8%(+7.12)#87 | 5.3%(+6.65)#2,805 |
| 88. | Oneonta | 11.9% | 4.8%(+7.09)#88 | 5.3%(+6.62)#2,820 |
| 89. | Keuka Park | 11.9% | 4.8%(+7.05)#89 | 5.3%(+6.57)#2,843 |
| 90. | Schaghticoke | 11.8% | 4.8%(+7.03)#90 | 5.3%(+6.56)#2,854 |
| 91. | Chaumont | 11.8% | 4.8%(+6.99)#91 | 5.3%(+6.52)#2,873 |
| 92. | Canandaigua | 11.8% | 4.8%(+6.97)#92 | 5.3%(+6.50)#2,885 |
| 93. | Heuvelton | 11.7% | 4.8%(+6.90)#93 | 5.3%(+6.43)#2,935 |
| 94. | Corfu | 11.7% | 4.8%(+6.89)#94 | 5.3%(+6.42)#2,938 |
| 95. | Cooperstown | 11.7% | 4.8%(+6.85)#95 | 5.3%(+6.38)#2,959 |
| 96. | Mount Vision | 11.7% | 4.8%(+6.85)#96 | 5.3%(+6.38)#2,965 |
| 97. | Crystal Beach | 11.6% | 4.8%(+6.82)#97 | 5.3%(+6.35)#2,980 |
| 98. | Brewster Hill | 11.5% | 4.8%(+6.71)#98 | 5.3%(+6.24)#3,059 |
| 99. | Waverly | 11.5% | 4.8%(+6.68)#99 | 5.3%(+6.21)#3,077 |
| 100. | Hornell | 11.5% | 4.8%(+6.66)#100 | 5.3%(+6.19)#3,086 |
Common Questions
What are the Top 10 Cities with the Highest Percentage of Population Employed in Food Preparation & Serving in New York?
Top 10 Cities with the Highest Percentage of Population Employed in Food Preparation & Serving in New York are:
#1
50.0%
#2
44.5%
#3
38.7%
#4
34.5%
#5
31.9%
#6
27.8%
#7
27.8%
#8
27.6%
#9
23.6%
#10
23.5%
What city has the Highest Percentage of Population Employed in Food Preparation & Serving in New York?
Linwood has the Highest Percentage of Population Employed in Food Preparation & Serving in New York with 50.0%.
What is the Percentage of Population Employed in Food Preparation & Serving in the State of New York?
Percentage of Population Employed in Food Preparation & Serving in New York is 4.8%.
What is the Percentage of Population Employed in Food Preparation & Serving in the United States?
Percentage of Population Employed in Food Preparation & Serving in the United States is 5.3%.