Cities with the Highest Percentage of Population Employed in Food Preparation & Serving in Maine
RELATED REPORTS & OPTIONS
Food Preparation & Serving
Maine
Compare Cities
Map of Cities with the Highest Percentage of Population Employed in Food Preparation & Serving in Maine
0.0%
25.0%
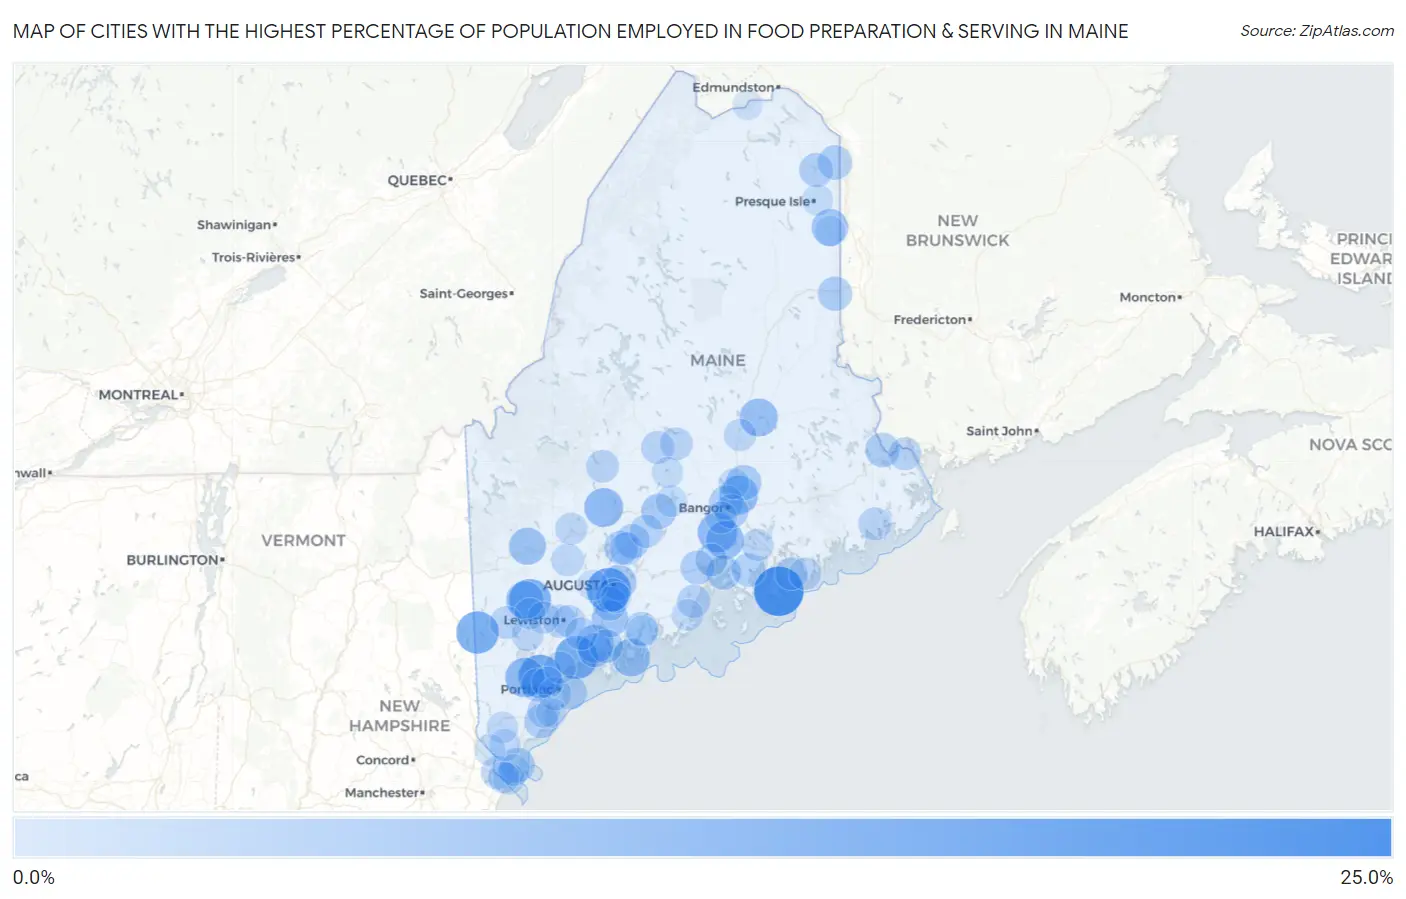
Cities with the Highest Percentage of Population Employed in Food Preparation & Serving in Maine
| City | % Employed | vs State | vs National | |
| 1. | Southwest Harbor | 25.0% | 5.0%(+20.0)#1 | 5.3%(+19.7)#499 |
| 2. | North Anson | 19.8% | 5.0%(+14.8)#2 | 5.3%(+14.5)#863 |
| 3. | Hallowell | 18.8% | 5.0%(+13.8)#3 | 5.3%(+13.5)#968 |
| 4. | Corinna | 17.7% | 5.0%(+12.7)#4 | 5.3%(+12.4)#1,102 |
| 5. | South Windham | 17.6% | 5.0%(+12.6)#5 | 5.3%(+12.4)#1,106 |
| 6. | Kezar Falls | 17.5% | 5.0%(+12.5)#6 | 5.3%(+12.2)#1,129 |
| 7. | Freeport | 17.4% | 5.0%(+12.4)#7 | 5.3%(+12.2)#1,143 |
| 8. | Fryeburg | 16.6% | 5.0%(+11.6)#8 | 5.3%(+11.3)#1,279 |
| 9. | South Paris | 16.2% | 5.0%(+11.2)#9 | 5.3%(+10.9)#1,354 |
| 10. | Dunstan | 16.0% | 5.0%(+11.0)#10 | 5.3%(+10.7)#1,404 |
| 11. | Brownville Junction | 15.0% | 5.0%(+9.95)#11 | 5.3%(+9.67)#1,649 |
| 12. | Winterport | 13.4% | 5.0%(+8.40)#12 | 5.3%(+8.11)#2,105 |
| 13. | Standish | 13.3% | 5.0%(+8.25)#13 | 5.3%(+7.97)#2,158 |
| 14. | Madison | 12.7% | 5.0%(+7.72)#14 | 5.3%(+7.44)#2,391 |
| 15. | Rangeley | 12.7% | 5.0%(+7.69)#15 | 5.3%(+7.40)#2,411 |
| 16. | Orono | 12.5% | 5.0%(+7.53)#16 | 5.3%(+7.24)#2,473 |
| 17. | Topsham | 11.8% | 5.0%(+6.75)#17 | 5.3%(+6.47)#2,906 |
| 18. | Bucksport | 11.7% | 5.0%(+6.74)#18 | 5.3%(+6.46)#2,912 |
| 19. | Lincoln | 11.6% | 5.0%(+6.64)#19 | 5.3%(+6.36)#2,975 |
| 20. | Boothbay Harbor | 11.5% | 5.0%(+6.54)#20 | 5.3%(+6.26)#3,039 |
| 21. | Norway | 11.3% | 5.0%(+6.31)#21 | 5.3%(+6.03)#3,189 |
| 22. | Mexico | 10.6% | 5.0%(+5.64)#22 | 5.3%(+5.36)#3,624 |
| 23. | Mars Hill | 10.4% | 5.0%(+5.38)#23 | 5.3%(+5.10)#3,804 |
| 24. | Richmond | 10.1% | 5.0%(+5.14)#24 | 5.3%(+4.86)#3,987 |
| 25. | Augusta | 8.9% | 5.0%(+3.92)#25 | 5.3%(+3.64)#5,166 |
| 26. | Pittsfield | 8.8% | 5.0%(+3.77)#26 | 5.3%(+3.48)#5,349 |
| 27. | Milford | 8.6% | 5.0%(+3.57)#27 | 5.3%(+3.29)#5,574 |
| 28. | Cape Neddick | 8.0% | 5.0%(+2.99)#28 | 5.3%(+2.71)#6,350 |
| 29. | Turner | 7.9% | 5.0%(+2.91)#29 | 5.3%(+2.62)#6,474 |
| 30. | Fairfield | 7.8% | 5.0%(+2.76)#30 | 5.3%(+2.48)#6,718 |
| 31. | Limestone | 7.7% | 5.0%(+2.71)#31 | 5.3%(+2.43)#6,799 |
| 32. | Woodland | 7.7% | 5.0%(+2.69)#32 | 5.3%(+2.41)#6,827 |
| 33. | Castine | 7.7% | 5.0%(+2.65)#33 | 5.3%(+2.37)#6,909 |
| 34. | Brunswick | 7.6% | 5.0%(+2.64)#34 | 5.3%(+2.35)#6,927 |
| 35. | Houlton | 7.6% | 5.0%(+2.61)#35 | 5.3%(+2.32)#6,979 |
| 36. | Bangor | 7.5% | 5.0%(+2.50)#36 | 5.3%(+2.22)#7,127 |
| 37. | Portland | 7.4% | 5.0%(+2.35)#37 | 5.3%(+2.07)#7,370 |
| 38. | Belfast | 7.3% | 5.0%(+2.34)#38 | 5.3%(+2.06)#7,383 |
| 39. | Caribou | 7.3% | 5.0%(+2.31)#39 | 5.3%(+2.02)#7,439 |
| 40. | Biddeford | 7.3% | 5.0%(+2.29)#40 | 5.3%(+2.01)#7,452 |
| 41. | Oakland | 7.3% | 5.0%(+2.28)#41 | 5.3%(+2.00)#7,469 |
| 42. | Brewer | 7.2% | 5.0%(+2.23)#42 | 5.3%(+1.95)#7,555 |
| 43. | Gardiner | 7.0% | 5.0%(+2.02)#43 | 5.3%(+1.73)#7,975 |
| 44. | Newcastle | 7.0% | 5.0%(+1.96)#44 | 5.3%(+1.67)#8,081 |
| 45. | Blue Hill | 6.9% | 5.0%(+1.86)#45 | 5.3%(+1.58)#8,258 |
| 46. | Bath | 6.8% | 5.0%(+1.85)#46 | 5.3%(+1.56)#8,297 |
| 47. | Waterville | 6.3% | 5.0%(+1.34)#47 | 5.3%(+1.06)#9,459 |
| 48. | Clinton | 6.3% | 5.0%(+1.33)#48 | 5.3%(+1.05)#9,471 |
| 49. | Gorham | 6.3% | 5.0%(+1.31)#49 | 5.3%(+1.03)#9,519 |
| 50. | Auburn | 6.3% | 5.0%(+1.30)#50 | 5.3%(+1.02)#9,545 |
| 51. | Farmingdale | 6.2% | 5.0%(+1.25)#51 | 5.3%(+0.964)#9,651 |
| 52. | Camden | 6.2% | 5.0%(+1.22)#52 | 5.3%(+0.935)#9,745 |
| 53. | Cornish | 6.1% | 5.0%(+1.14)#53 | 5.3%(+0.857)#9,956 |
| 54. | Calais | 6.1% | 5.0%(+1.13)#54 | 5.3%(+0.847)#9,985 |
| 55. | South Eliot | 6.1% | 5.0%(+1.12)#55 | 5.3%(+0.840)#10,004 |
| 56. | Guilford | 6.1% | 5.0%(+1.11)#56 | 5.3%(+0.827)#10,040 |
| 57. | South Portland | 6.1% | 5.0%(+1.05)#57 | 5.3%(+0.764)#10,198 |
| 58. | Machias | 6.0% | 5.0%(+1.00)#58 | 5.3%(+0.719)#10,323 |
| 59. | Dover Foxcroft | 6.0% | 5.0%(+1.00)#59 | 5.3%(+0.718)#10,328 |
| 60. | Bridgton | 6.0% | 5.0%(+0.950)#60 | 5.3%(+0.666)#10,449 |
| 61. | Saco | 5.8% | 5.0%(+0.810)#61 | 5.3%(+0.527)#10,773 |
| 62. | Bingham | 5.8% | 5.0%(+0.795)#62 | 5.3%(+0.511)#10,817 |
| 63. | Island Falls | 5.8% | 5.0%(+0.783)#63 | 5.3%(+0.499)#10,848 |
| 64. | Lewiston | 5.7% | 5.0%(+0.684)#64 | 5.3%(+0.401)#11,130 |
| 65. | Livermore Falls | 5.7% | 5.0%(+0.655)#65 | 5.3%(+0.372)#11,210 |
| 66. | Searsport | 5.6% | 5.0%(+0.600)#66 | 5.3%(+0.316)#11,362 |
| 67. | Bar Harbor | 5.5% | 5.0%(+0.511)#67 | 5.3%(+0.227)#11,599 |
| 68. | South Berwick | 5.4% | 5.0%(+0.397)#68 | 5.3%(+0.114)#11,876 |
| 69. | Lisbon Falls | 5.4% | 5.0%(+0.382)#69 | 5.3%(+0.099)#11,918 |
| 70. | Patten | 5.3% | 5.0%(+0.307)#70 | 5.3%(+0.024)#12,130 |
| 71. | Farmington | 5.3% | 5.0%(+0.306)#71 | 5.3%(+0.023)#12,133 |
| 72. | Howland | 5.3% | 5.0%(+0.274)#72 | 5.3%(-0.010)#12,219 |
| 73. | Winter Harbor | 5.3% | 5.0%(+0.261)#73 | 5.3%(-0.023)#12,267 |
| 74. | Ellsworth | 5.3% | 5.0%(+0.252)#74 | 5.3%(-0.031)#12,296 |
| 75. | Mechanic Falls | 5.1% | 5.0%(+0.087)#75 | 5.3%(-0.196)#12,764 |
| 76. | Cumberland Center | 5.1% | 5.0%(+0.081)#76 | 5.3%(-0.202)#12,777 |
| 77. | Casco | 5.1% | 5.0%(+0.079)#77 | 5.3%(-0.204)#12,780 |
| 78. | Jonesport | 5.1% | 5.0%(+0.065)#78 | 5.3%(-0.218)#12,809 |
| 79. | Kittery Point | 5.0% | 5.0%(-0.050)#79 | 5.3%(-0.334)#13,147 |
| 80. | Hampden | 4.9% | 5.0%(-0.063)#80 | 5.3%(-0.347)#13,180 |
| 81. | Northeast Harbor | 4.9% | 5.0%(-0.073)#81 | 5.3%(-0.356)#13,219 |
| 82. | North Berwick | 4.8% | 5.0%(-0.155)#82 | 5.3%(-0.439)#13,487 |
| 83. | York Harbor | 4.8% | 5.0%(-0.180)#83 | 5.3%(-0.464)#13,549 |
| 84. | Westbrook | 4.7% | 5.0%(-0.338)#84 | 5.3%(-0.622)#14,010 |
| 85. | Sanford | 4.6% | 5.0%(-0.363)#85 | 5.3%(-0.647)#14,073 |
| 86. | Rockland | 4.6% | 5.0%(-0.391)#86 | 5.3%(-0.675)#14,147 |
| 87. | Damariscotta | 4.6% | 5.0%(-0.405)#87 | 5.3%(-0.688)#14,180 |
| 88. | Newport | 4.6% | 5.0%(-0.417)#88 | 5.3%(-0.700)#14,219 |
| 89. | Berwick | 4.5% | 5.0%(-0.523)#89 | 5.3%(-0.807)#14,514 |
| 90. | Kittery | 4.5% | 5.0%(-0.538)#90 | 5.3%(-0.822)#14,564 |
| 91. | Dexter | 4.4% | 5.0%(-0.592)#91 | 5.3%(-0.876)#14,714 |
| 92. | Presque Isle | 4.3% | 5.0%(-0.683)#92 | 5.3%(-0.967)#14,987 |
| 93. | Oxford | 4.3% | 5.0%(-0.717)#93 | 5.3%(-1.00)#15,097 |
| 94. | Old Town | 4.0% | 5.0%(-1.04)#94 | 5.3%(-1.32)#16,098 |
| 95. | Winthrop | 3.6% | 5.0%(-1.42)#95 | 5.3%(-1.71)#17,287 |
| 96. | Veazie | 3.5% | 5.0%(-1.49)#96 | 5.3%(-1.78)#17,506 |
| 97. | Blaine | 3.5% | 5.0%(-1.53)#97 | 5.3%(-1.82)#17,640 |
| 98. | Randolph | 3.5% | 5.0%(-1.54)#98 | 5.3%(-1.82)#17,647 |
| 99. | Old Orchard Beach | 3.0% | 5.0%(-2.00)#99 | 5.3%(-2.28)#18,989 |
| 100. | Fort Kent | 3.0% | 5.0%(-2.04)#100 | 5.3%(-2.32)#19,085 |
1
2Common Questions
What are the Top 10 Cities with the Highest Percentage of Population Employed in Food Preparation & Serving in Maine?
Top 10 Cities with the Highest Percentage of Population Employed in Food Preparation & Serving in Maine are:
#1
25.0%
#2
18.8%
#3
17.6%
#4
17.4%
#5
16.6%
#6
16.2%
#7
13.4%
#8
13.3%
#9
12.7%
#10
12.5%
What city has the Highest Percentage of Population Employed in Food Preparation & Serving in Maine?
Southwest Harbor has the Highest Percentage of Population Employed in Food Preparation & Serving in Maine with 25.0%.
What is the Percentage of Population Employed in Food Preparation & Serving in the State of Maine?
Percentage of Population Employed in Food Preparation & Serving in Maine is 5.0%.
What is the Percentage of Population Employed in Food Preparation & Serving in the United States?
Percentage of Population Employed in Food Preparation & Serving in the United States is 5.3%.