Cities with the Highest Percentage of Population Employed in Food Preparation & Serving in Oklahoma
RELATED REPORTS & OPTIONS
Food Preparation & Serving
Oklahoma
Compare Cities
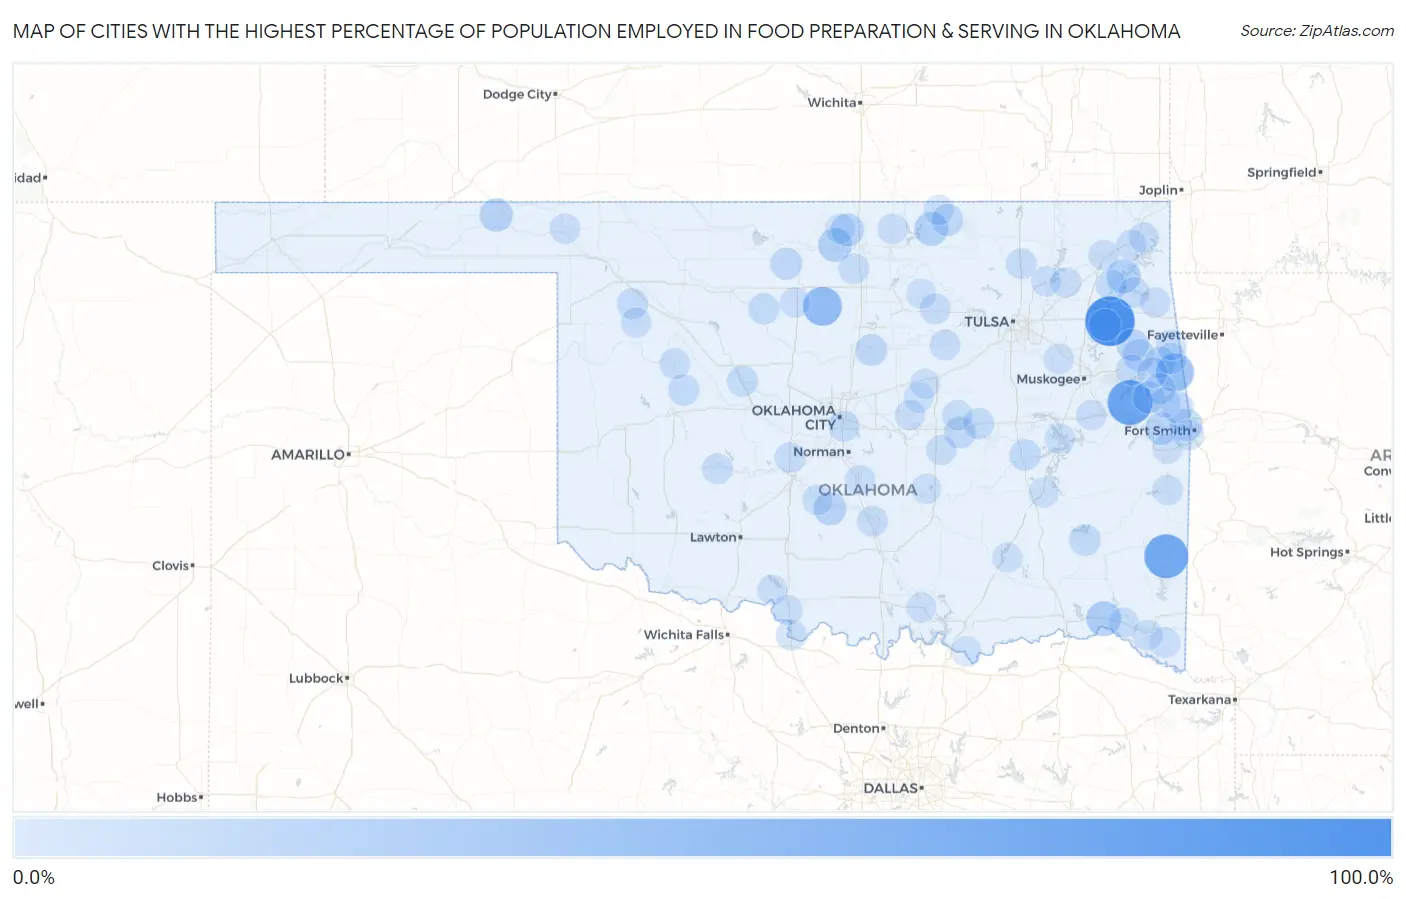
Map of Cities with the Highest Percentage of Population Employed in Food Preparation & Serving in Oklahoma
0.0%
100.0%
Cities with the Highest Percentage of Population Employed in Food Preparation & Serving in Oklahoma
| City | % Employed | vs State | vs National | |
| 1. | Iron Post | 100.0% | 5.6%(+94.4)#1 | 5.3%(+94.7)#17 |
| 2. | Box | 77.8% | 5.6%(+72.2)#2 | 5.3%(+72.5)#44 |
| 3. | Smithville | 73.1% | 5.6%(+67.5)#3 | 5.3%(+67.8)#52 |
| 4. | Douglas | 50.0% | 5.6%(+44.4)#4 | 5.3%(+44.7)#112 |
| 5. | Elm Grove | 46.3% | 5.6%(+40.7)#5 | 5.3%(+41.1)#132 |
| 6. | Edgewater Park | 43.6% | 5.6%(+38.0)#6 | 5.3%(+38.3)#154 |
| 7. | Swink | 31.6% | 5.6%(+26.0)#7 | 5.3%(+26.3)#306 |
| 8. | Bache | 29.6% | 5.6%(+24.0)#8 | 5.3%(+24.3)#356 |
| 9. | Oak Hill-Piney | 27.4% | 5.6%(+21.8)#9 | 5.3%(+22.1)#414 |
| 10. | Webb City | 27.3% | 5.6%(+21.7)#10 | 5.3%(+22.0)#420 |
| 11. | Disney | 26.9% | 5.6%(+21.3)#11 | 5.3%(+21.6)#432 |
| 12. | Watova | 26.9% | 5.6%(+21.3)#12 | 5.3%(+21.6)#435 |
| 13. | Lamont | 26.8% | 5.6%(+21.2)#13 | 5.3%(+21.5)#441 |
| 14. | Scipio | 25.8% | 5.6%(+20.2)#14 | 5.3%(+20.5)#478 |
| 15. | Forgan | 24.5% | 5.6%(+18.9)#15 | 5.3%(+19.3)#525 |
| 16. | Fay | 24.0% | 5.6%(+18.4)#16 | 5.3%(+18.7)#550 |
| 17. | Baker | 23.9% | 5.6%(+18.3)#17 | 5.3%(+18.6)#556 |
| 18. | Nardin | 23.1% | 5.6%(+17.5)#18 | 5.3%(+17.8)#610 |
| 19. | Erin Springs | 23.1% | 5.6%(+17.5)#19 | 5.3%(+17.8)#611 |
| 20. | Shady Grove Cdp Mcintosh County | 22.2% | 5.6%(+16.6)#20 | 5.3%(+16.9)#658 |
| 21. | Moffett | 21.1% | 5.6%(+15.5)#21 | 5.3%(+15.8)#732 |
| 22. | Gans | 20.7% | 5.6%(+15.1)#22 | 5.3%(+15.4)#764 |
| 23. | Cedar Crest | 20.2% | 5.6%(+14.6)#23 | 5.3%(+14.9)#820 |
| 24. | Briggs | 19.6% | 5.6%(+14.0)#24 | 5.3%(+14.3)#884 |
| 25. | Steely Hollow | 19.5% | 5.6%(+13.9)#25 | 5.3%(+14.2)#891 |
| 26. | Flute Springs | 19.4% | 5.6%(+13.8)#26 | 5.3%(+14.2)#900 |
| 27. | Hillsdale | 18.9% | 5.6%(+13.3)#27 | 5.3%(+13.6)#956 |
| 28. | Coyle | 18.7% | 5.6%(+13.1)#28 | 5.3%(+13.4)#982 |
| 29. | Reagan | 18.2% | 5.6%(+12.6)#29 | 5.3%(+12.9)#1,048 |
| 30. | Foraker | 18.2% | 5.6%(+12.6)#30 | 5.3%(+12.9)#1,049 |
| 31. | Cromwell | 17.9% | 5.6%(+12.4)#31 | 5.3%(+12.7)#1,075 |
| 32. | Belfonte | 17.9% | 5.6%(+12.3)#32 | 5.3%(+12.6)#1,087 |
| 33. | Hanna | 17.4% | 5.6%(+11.8)#33 | 5.3%(+12.1)#1,154 |
| 34. | Clayton | 16.7% | 5.6%(+11.1)#34 | 5.3%(+11.4)#1,239 |
| 35. | Mulberry | 16.7% | 5.6%(+11.1)#35 | 5.3%(+11.4)#1,268 |
| 36. | Bunch | 16.7% | 5.6%(+11.1)#36 | 5.3%(+11.4)#1,274 |
| 37. | Greenfield | 15.9% | 5.6%(+10.3)#37 | 5.3%(+10.6)#1,426 |
| 38. | Ames | 15.6% | 5.6%(+10.0)#38 | 5.3%(+10.3)#1,492 |
| 39. | Custer City | 15.4% | 5.6%(+9.82)#39 | 5.3%(+10.1)#1,522 |
| 40. | Whippoorwill | 15.4% | 5.6%(+9.79)#40 | 5.3%(+10.1)#1,538 |
| 41. | Peavine | 15.3% | 5.6%(+9.73)#41 | 5.3%(+10.0)#1,551 |
| 42. | Valley Brook | 15.3% | 5.6%(+9.68)#42 | 5.3%(+9.99)#1,564 |
| 43. | Greasy | 15.1% | 5.6%(+9.52)#43 | 5.3%(+9.83)#1,594 |
| 44. | Sand Point | 15.1% | 5.6%(+9.51)#44 | 5.3%(+9.82)#1,597 |
| 45. | Sharon | 14.9% | 5.6%(+9.35)#45 | 5.3%(+9.66)#1,656 |
| 46. | Strang | 14.8% | 5.6%(+9.22)#46 | 5.3%(+9.53)#1,686 |
| 47. | Okemah | 14.8% | 5.6%(+9.16)#47 | 5.3%(+9.47)#1,697 |
| 48. | Old Eucha | 14.3% | 5.6%(+8.69)#48 | 5.3%(+9.00)#1,837 |
| 49. | Keys | 14.2% | 5.6%(+8.59)#49 | 5.3%(+8.90)#1,864 |
| 50. | Terral | 14.2% | 5.6%(+8.58)#50 | 5.3%(+8.89)#1,867 |
| 51. | Carnegie | 13.8% | 5.6%(+8.24)#51 | 5.3%(+8.55)#1,963 |
| 52. | Pauls Valley | 13.7% | 5.6%(+8.08)#52 | 5.3%(+8.39)#2,011 |
| 53. | Maramec | 13.6% | 5.6%(+8.04)#53 | 5.3%(+8.35)#2,026 |
| 54. | Billings | 13.6% | 5.6%(+8.01)#54 | 5.3%(+8.32)#2,034 |
| 55. | Putnam | 13.3% | 5.6%(+7.74)#55 | 5.3%(+8.05)#2,134 |
| 56. | Drumright | 13.3% | 5.6%(+7.66)#56 | 5.3%(+7.97)#2,156 |
| 57. | Ramona | 13.1% | 5.6%(+7.48)#57 | 5.3%(+7.79)#2,224 |
| 58. | Stoney Point | 13.0% | 5.6%(+7.45)#58 | 5.3%(+7.76)#2,239 |
| 59. | Pocasset | 13.0% | 5.6%(+7.45)#59 | 5.3%(+7.76)#2,242 |
| 60. | Cloud Creek | 13.0% | 5.6%(+7.37)#60 | 5.3%(+7.68)#2,272 |
| 61. | Vinita | 12.9% | 5.6%(+7.34)#61 | 5.3%(+7.64)#2,282 |
| 62. | Barber | 12.9% | 5.6%(+7.31)#62 | 5.3%(+7.62)#2,292 |
| 63. | Bradley | 12.9% | 5.6%(+7.31)#63 | 5.3%(+7.62)#2,295 |
| 64. | Old Green | 12.7% | 5.6%(+7.13)#64 | 5.3%(+7.44)#2,390 |
| 65. | Little Rock | 12.7% | 5.6%(+7.10)#65 | 5.3%(+7.41)#2,404 |
| 66. | Howe | 12.7% | 5.6%(+7.06)#66 | 5.3%(+7.36)#2,422 |
| 67. | Warner | 12.5% | 5.6%(+6.90)#67 | 5.3%(+7.21)#2,480 |
| 68. | Rocky Mountain | 12.5% | 5.6%(+6.90)#68 | 5.3%(+7.21)#2,487 |
| 69. | Sugden | 12.5% | 5.6%(+6.90)#69 | 5.3%(+7.21)#2,518 |
| 70. | Rosston | 12.5% | 5.6%(+6.90)#70 | 5.3%(+7.21)#2,521 |
| 71. | Afton | 12.5% | 5.6%(+6.86)#71 | 5.3%(+7.17)#2,537 |
| 72. | Haworth | 12.4% | 5.6%(+6.79)#72 | 5.3%(+7.09)#2,570 |
| 73. | Arkoma | 12.2% | 5.6%(+6.57)#73 | 5.3%(+6.88)#2,668 |
| 74. | Kildare | 12.1% | 5.6%(+6.53)#74 | 5.3%(+6.84)#2,696 |
| 75. | Foyil | 12.1% | 5.6%(+6.50)#75 | 5.3%(+6.81)#2,705 |
| 76. | Idabel | 12.1% | 5.6%(+6.48)#76 | 5.3%(+6.79)#2,716 |
| 77. | Vici | 12.0% | 5.6%(+6.45)#77 | 5.3%(+6.76)#2,731 |
| 78. | Meeker | 11.9% | 5.6%(+6.26)#78 | 5.3%(+6.57)#2,847 |
| 79. | Boley | 11.8% | 5.6%(+6.23)#79 | 5.3%(+6.54)#2,862 |
| 80. | Oologah | 11.8% | 5.6%(+6.18)#80 | 5.3%(+6.49)#2,889 |
| 81. | Waukomis | 11.7% | 5.6%(+6.13)#81 | 5.3%(+6.44)#2,920 |
| 82. | White Eagle | 11.7% | 5.6%(+6.07)#82 | 5.3%(+6.38)#2,962 |
| 83. | Seminole | 11.6% | 5.6%(+6.02)#83 | 5.3%(+6.33)#2,997 |
| 84. | Lexington | 11.6% | 5.6%(+6.01)#84 | 5.3%(+6.32)#2,999 |
| 85. | Fairland | 11.6% | 5.6%(+6.00)#85 | 5.3%(+6.31)#3,003 |
| 86. | Hastings | 11.5% | 5.6%(+5.94)#86 | 5.3%(+6.25)#3,052 |
| 87. | Hendrix | 11.5% | 5.6%(+5.94)#87 | 5.3%(+6.25)#3,054 |
| 88. | Pawnee | 11.5% | 5.6%(+5.91)#88 | 5.3%(+6.22)#3,068 |
| 89. | Redbird | 11.3% | 5.6%(+5.73)#89 | 5.3%(+6.03)#3,185 |
| 90. | Stringtown | 11.2% | 5.6%(+5.64)#90 | 5.3%(+5.95)#3,240 |
| 91. | Millerton | 11.2% | 5.6%(+5.64)#91 | 5.3%(+5.95)#3,243 |
| 92. | Krebs | 11.2% | 5.6%(+5.59)#92 | 5.3%(+5.90)#3,273 |
| 93. | Oakland | 11.2% | 5.6%(+5.58)#93 | 5.3%(+5.89)#3,281 |
| 94. | Grainola | 11.1% | 5.6%(+5.52)#94 | 5.3%(+5.83)#3,329 |
| 95. | Spiro | 11.1% | 5.6%(+5.50)#95 | 5.3%(+5.81)#3,337 |
| 96. | Konawa | 11.0% | 5.6%(+5.45)#96 | 5.3%(+5.76)#3,359 |
| 97. | Eufaula | 11.0% | 5.6%(+5.41)#97 | 5.3%(+5.72)#3,390 |
| 98. | Sparks | 10.9% | 5.6%(+5.31)#98 | 5.3%(+5.62)#3,440 |
| 99. | Davenport | 10.9% | 5.6%(+5.27)#99 | 5.3%(+5.58)#3,463 |
| 100. | Deer Creek | 10.8% | 5.6%(+5.22)#100 | 5.3%(+5.52)#3,510 |
Common Questions
What are the Top 10 Cities with the Highest Percentage of Population Employed in Food Preparation & Serving in Oklahoma?
Top 10 Cities with the Highest Percentage of Population Employed in Food Preparation & Serving in Oklahoma are:
What city has the Highest Percentage of Population Employed in Food Preparation & Serving in Oklahoma?
Iron Post has the Highest Percentage of Population Employed in Food Preparation & Serving in Oklahoma with 100.0%.
What is the Percentage of Population Employed in Food Preparation & Serving in the State of Oklahoma?
Percentage of Population Employed in Food Preparation & Serving in Oklahoma is 5.6%.
What is the Percentage of Population Employed in Food Preparation & Serving in the United States?
Percentage of Population Employed in Food Preparation & Serving in the United States is 5.3%.