Weaverville, CA Map & Demographics
Weaverville Map
Weaverville Overview
$33,792
PER CAPITA INCOME
$77,098
AVG FAMILY INCOME
$49,539
AVG HOUSEHOLD INCOME
12.1%
WAGE / INCOME GAP [ % ]
87.9¢/ $1
WAGE / INCOME GAP [ $ ]
$13,322
FAMILY INCOME DEFICIT
0.51
INEQUALITY / GINI INDEX
3,582
TOTAL POPULATION
1,615
MALE POPULATION
1,967
FEMALE POPULATION
82.10
MALES / 100 FEMALES
121.80
FEMALES / 100 MALES
43.9
MEDIAN AGE
3.1
AVG FAMILY SIZE
2.4
AVG HOUSEHOLD SIZE
1,515
LABOR FORCE [ PEOPLE ]
51.1%
PERCENT IN LABOR FORCE
10.5%
UNEMPLOYMENT RATE
Weaverville Zip Codes
Income in Weaverville
Income Overview in Weaverville
Per Capita Income in Weaverville is $33,792, while median incomes of families and households are $77,098 and $49,539 respectively.
| Characteristic | Number | Measure |
| Per Capita Income | 3,582 | $33,792 |
| Median Family Income | 786 | $77,098 |
| Mean Family Income | 786 | $112,912 |
| Median Household Income | 1,481 | $49,539 |
| Mean Household Income | 1,481 | $81,615 |
| Income Deficit | 786 | $13,322 |
| Wage / Income Gap (%) | 3,582 | 12.09% |
| Wage / Income Gap ($) | 3,582 | 87.91¢ per $1 |
| Gini / Inequality Index | 3,582 | 0.51 |
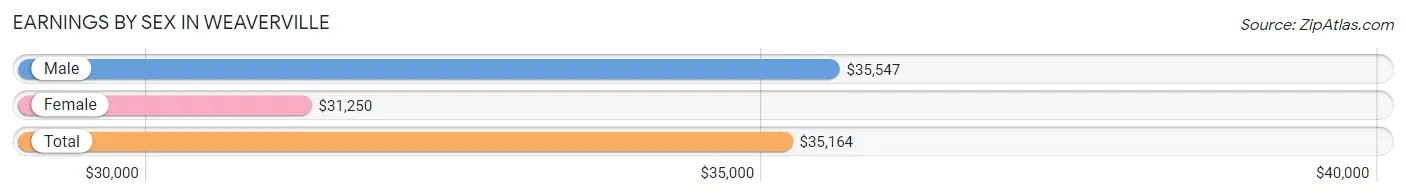
Earnings by Sex in Weaverville
Average Earnings in Weaverville are $35,164, $35,547 for men and $31,250 for women, a difference of 12.1%.
| Sex | Number | Average Earnings |
| Male | 760 (52.7%) | $35,547 |
| Female | 682 (47.3%) | $31,250 |
| Total | 1,442 (100.0%) | $35,164 |
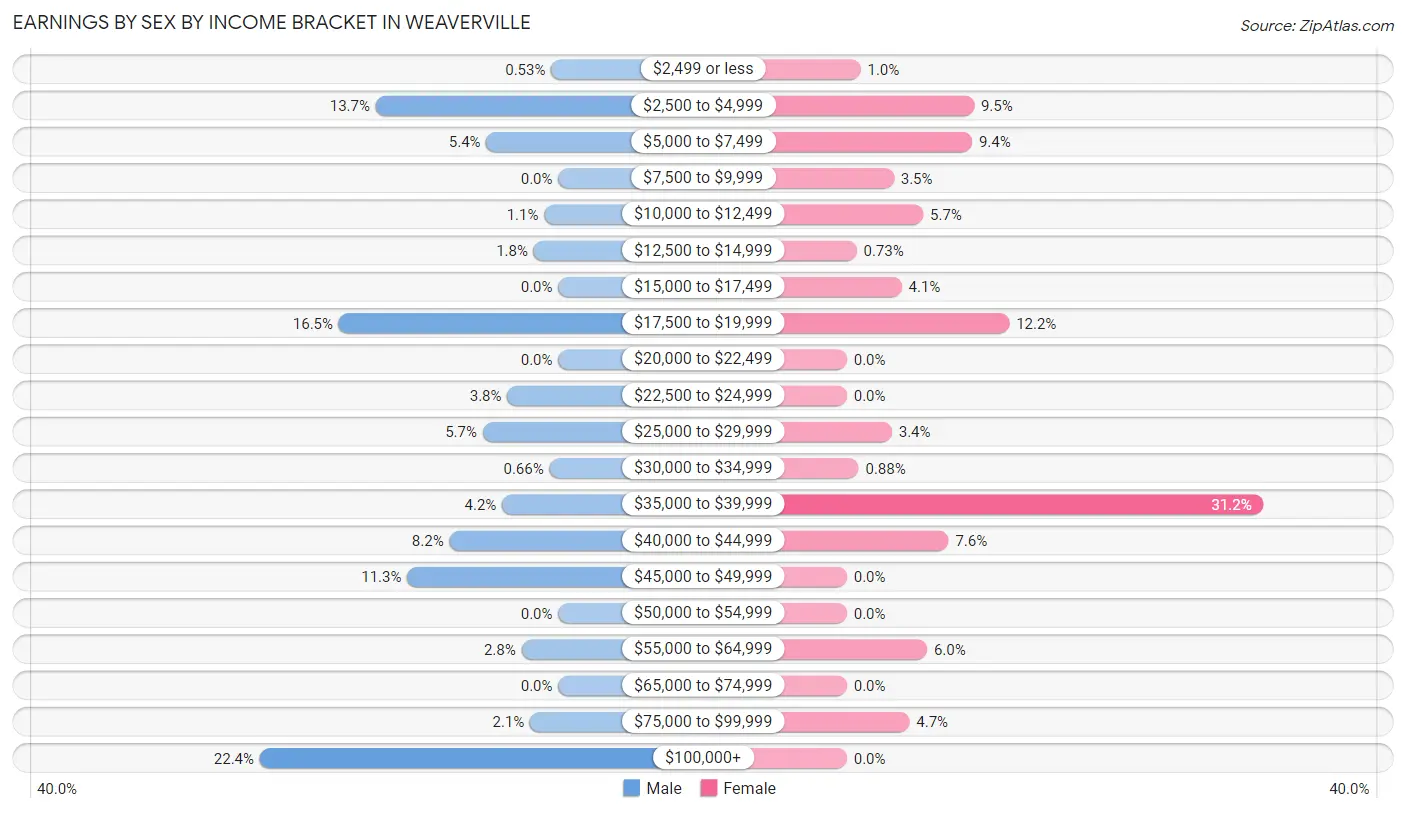
Earnings by Sex by Income Bracket in Weaverville
The most common earnings brackets in Weaverville are $100,000+ for men (170 | 22.4%) and $35,000 to $39,999 for women (213 | 31.2%).
| Income | Male | Female |
| $2,499 or less | 4 (0.5%) | 7 (1.0%) |
| $2,500 to $4,999 | 104 (13.7%) | 65 (9.5%) |
| $5,000 to $7,499 | 41 (5.4%) | 64 (9.4%) |
| $7,500 to $9,999 | 0 (0.0%) | 24 (3.5%) |
| $10,000 to $12,499 | 8 (1.1%) | 39 (5.7%) |
| $12,500 to $14,999 | 14 (1.8%) | 5 (0.7%) |
| $15,000 to $17,499 | 0 (0.0%) | 28 (4.1%) |
| $17,500 to $19,999 | 125 (16.5%) | 83 (12.2%) |
| $20,000 to $22,499 | 0 (0.0%) | 0 (0.0%) |
| $22,500 to $24,999 | 29 (3.8%) | 0 (0.0%) |
| $25,000 to $29,999 | 43 (5.7%) | 23 (3.4%) |
| $30,000 to $34,999 | 5 (0.7%) | 6 (0.9%) |
| $35,000 to $39,999 | 32 (4.2%) | 213 (31.2%) |
| $40,000 to $44,999 | 62 (8.2%) | 52 (7.6%) |
| $45,000 to $49,999 | 86 (11.3%) | 0 (0.0%) |
| $50,000 to $54,999 | 0 (0.0%) | 0 (0.0%) |
| $55,000 to $64,999 | 21 (2.8%) | 41 (6.0%) |
| $65,000 to $74,999 | 0 (0.0%) | 0 (0.0%) |
| $75,000 to $99,999 | 16 (2.1%) | 32 (4.7%) |
| $100,000+ | 170 (22.4%) | 0 (0.0%) |
| Total | 760 (100.0%) | 682 (100.0%) |
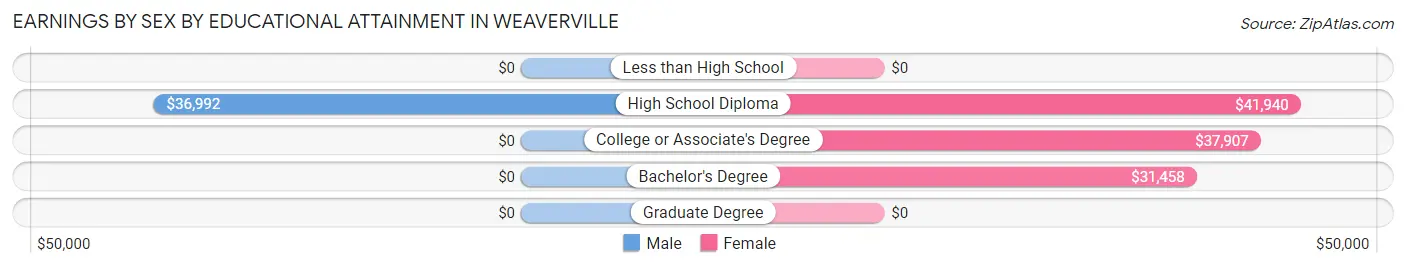
Earnings by Sex by Educational Attainment in Weaverville
Average earnings in Weaverville are $43,972 for men and $35,991 for women, a difference of 18.1%. Men with an educational attainment of high school diploma enjoy the highest average annual earnings of $36,992, while those with high school diploma education earn the least with $36,992. Women with an educational attainment of high school diploma earn the most with the average annual earnings of $41,940, while those with bachelor's degree education have the smallest earnings of $31,458.
| Educational Attainment | Male Income | Female Income |
| Less than High School | - | - |
| High School Diploma | $36,992 | $41,940 |
| College or Associate's Degree | - | - |
| Bachelor's Degree | - | - |
| Graduate Degree | - | - |
| Total | $43,972 | $35,991 |
Family Income in Weaverville
Family Income Brackets in Weaverville
According to the Weaverville family income data, there are 198 families falling into the $100,000 to $149,999 income range, which is the most common income bracket and makes up 25.2% of all families. Conversely, the $10,000 to $14,999 income bracket is the least frequent group with only 5 families (0.6%) belonging to this category.
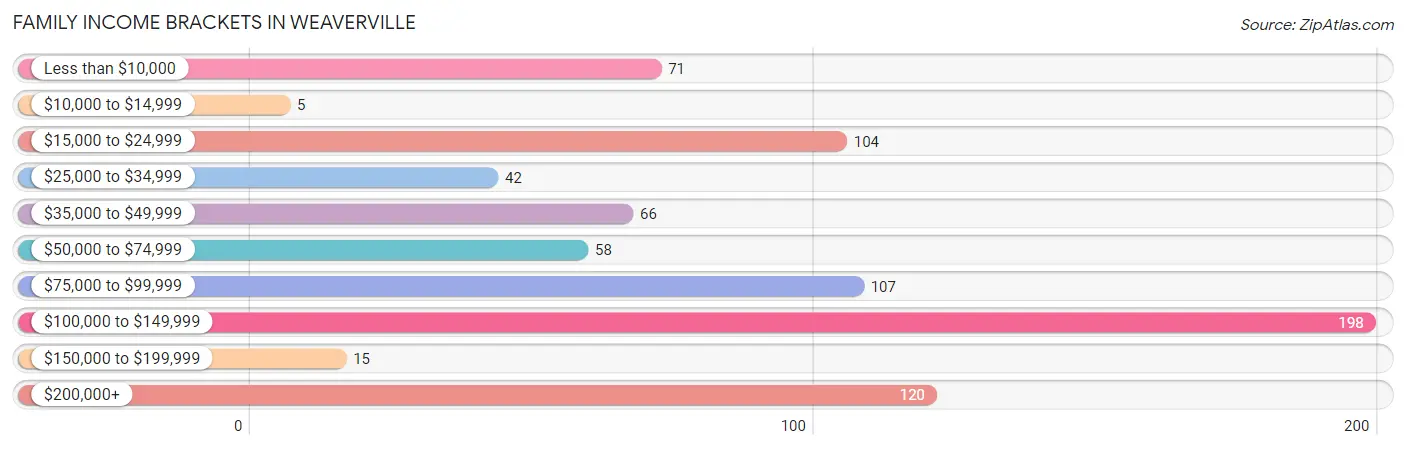
| Income Bracket | # Families | % Families |
| Less than $10,000 | 71 | 9.0% |
| $10,000 to $14,999 | 5 | 0.6% |
| $15,000 to $24,999 | 104 | 13.2% |
| $25,000 to $34,999 | 42 | 5.3% |
| $35,000 to $49,999 | 66 | 8.4% |
| $50,000 to $74,999 | 58 | 7.4% |
| $75,000 to $99,999 | 107 | 13.6% |
| $100,000 to $149,999 | 198 | 25.2% |
| $150,000 to $199,999 | 15 | 1.9% |
| $200,000+ | 120 | 15.3% |
Family Income by Famaliy Size in Weaverville
3-person families (133 | 16.9%) account for the highest median family income in Weaverville with $250,001 per family, while 3-person families (133 | 16.9%) have the highest median income of $83,334 per family member.
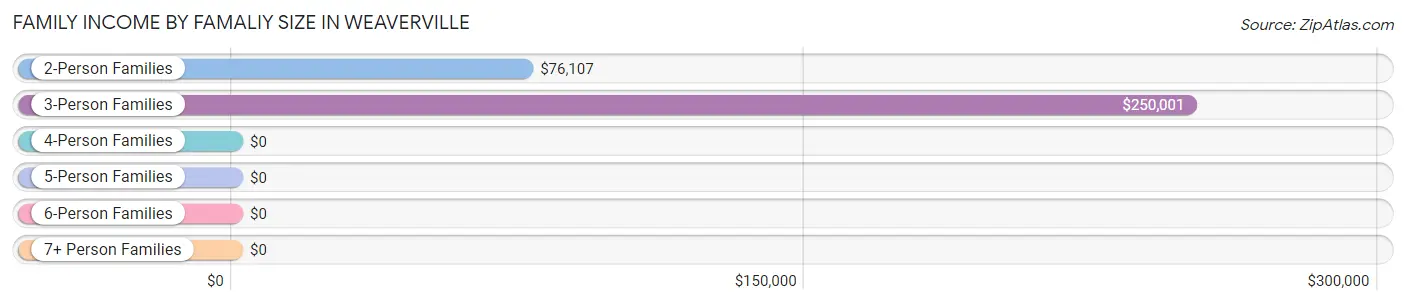
| Income Bracket | # Families | Median Income |
| 2-Person Families | 475 (60.4%) | $76,107 |
| 3-Person Families | 133 (16.9%) | $250,001 |
| 4-Person Families | 178 (22.7%) | $0 |
| 5-Person Families | 0 (0.0%) | $0 |
| 6-Person Families | 0 (0.0%) | $0 |
| 7+ Person Families | 0 (0.0%) | $0 |
| Total | 786 (100.0%) | $77,098 |
Family Income by Number of Earners in Weaverville
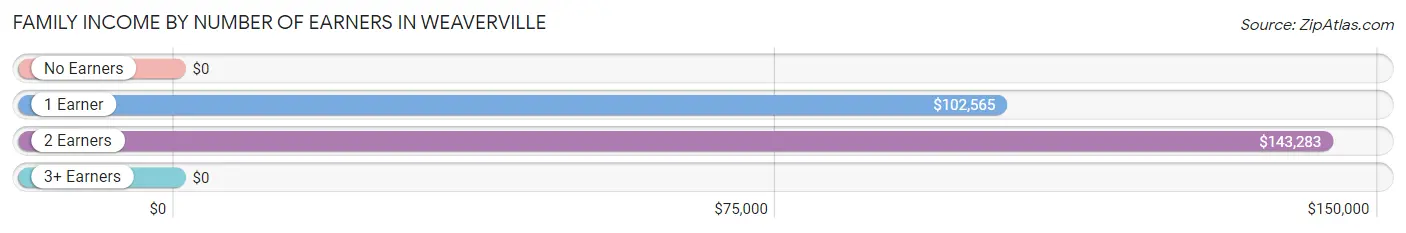
| Number of Earners | # Families | Median Income |
| No Earners | 342 (43.5%) | $0 |
| 1 Earner | 150 (19.1%) | $102,565 |
| 2 Earners | 278 (35.4%) | $143,283 |
| 3+ Earners | 16 (2.0%) | $0 |
| Total | 786 (100.0%) | $77,098 |
Household Income in Weaverville
Household Income Brackets in Weaverville
With 298 households falling in the category, the $35,000 to $49,999 income range is the most frequent in Weaverville, accounting for 20.1% of all households. In contrast, only 15 households (1.0%) fall into the $150,000 to $199,999 income bracket, making it the least populous group.
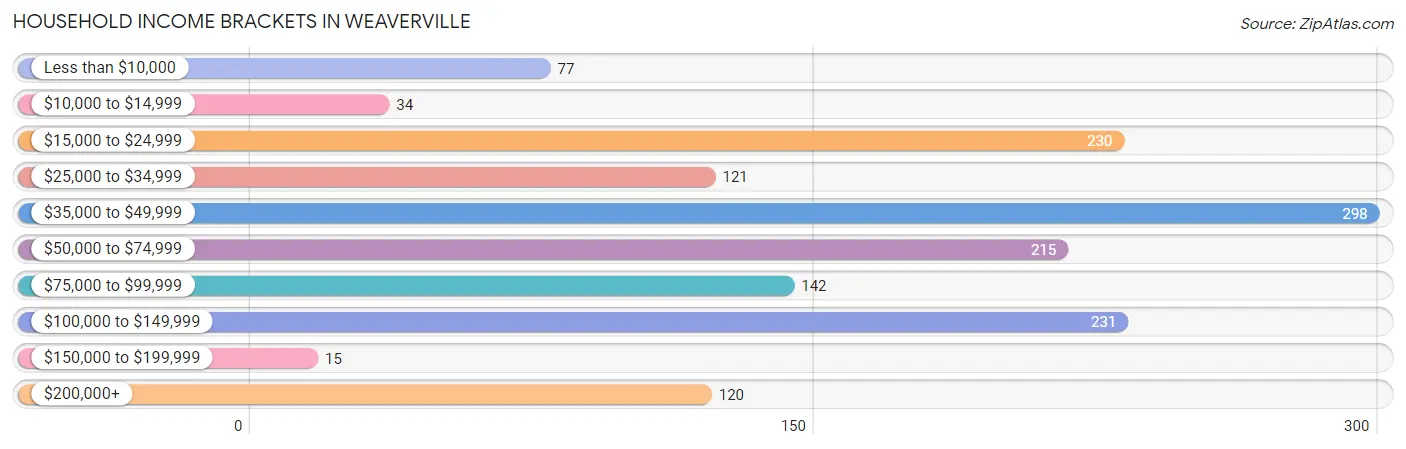
| Income Bracket | # Households | % Households |
| Less than $10,000 | 77 | 5.2% |
| $10,000 to $14,999 | 34 | 2.3% |
| $15,000 to $24,999 | 230 | 15.5% |
| $25,000 to $34,999 | 121 | 8.2% |
| $35,000 to $49,999 | 298 | 20.1% |
| $50,000 to $74,999 | 215 | 14.5% |
| $75,000 to $99,999 | 142 | 9.6% |
| $100,000 to $149,999 | 231 | 15.6% |
| $150,000 to $199,999 | 15 | 1.0% |
| $200,000+ | 120 | 8.1% |
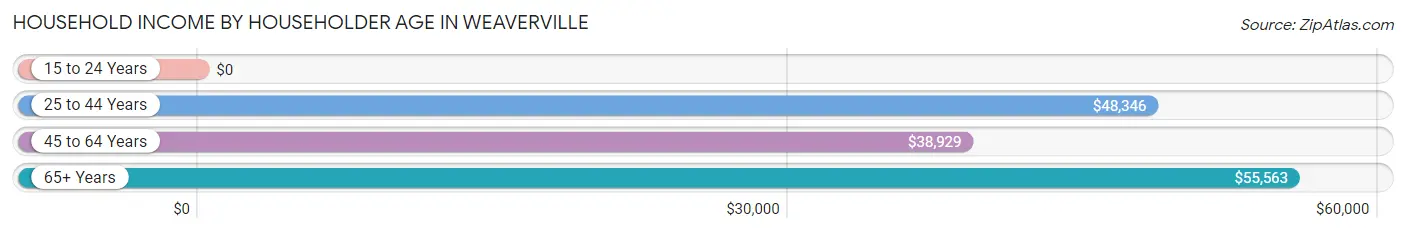
Household Income by Householder Age in Weaverville
The median household income in Weaverville is $49,539, with the highest median household income of $55,563 found in the 65+ years age bracket for the primary householder. A total of 734 households (49.6%) fall into this category. Meanwhile, the 15 to 24 years age bracket for the primary householder has the lowest median household income of $0, with 36 households (2.4%) in this group.
| Income Bracket | # Households | Median Income |
| 15 to 24 Years | 36 (2.4%) | $0 |
| 25 to 44 Years | 401 (27.1%) | $48,346 |
| 45 to 64 Years | 310 (20.9%) | $38,929 |
| 65+ Years | 734 (49.6%) | $55,563 |
| Total | 1,481 (100.0%) | $49,539 |
Poverty in Weaverville
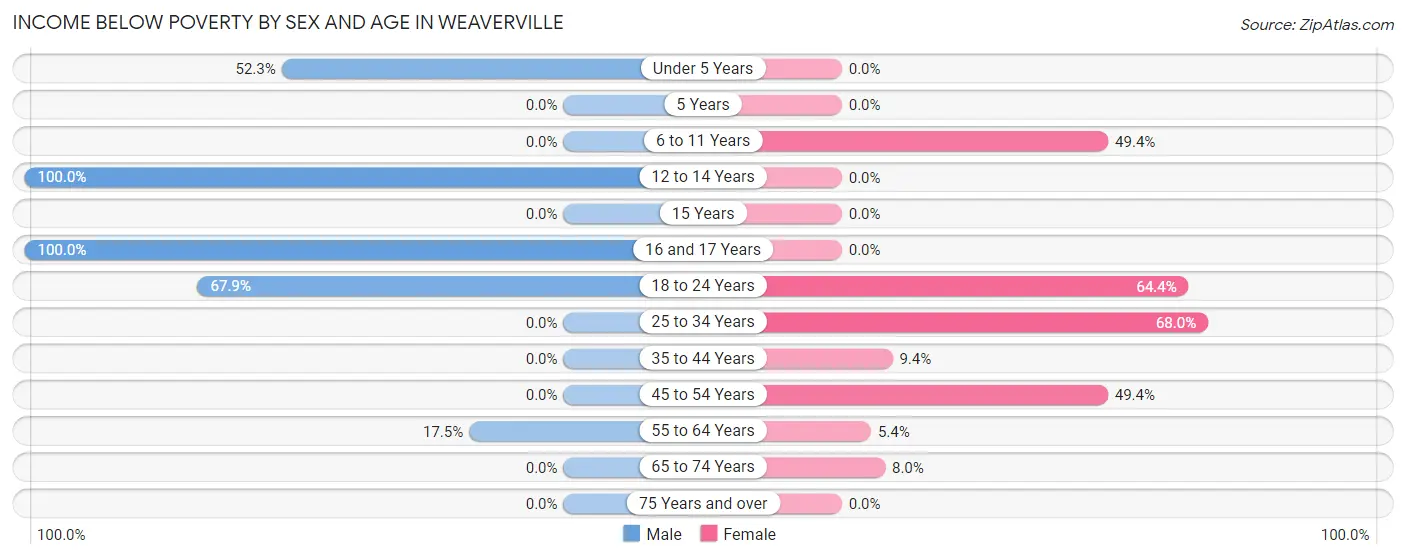
Income Below Poverty by Sex and Age in Weaverville
With 21.0% poverty level for males and 24.6% for females among the residents of Weaverville, 12 to 14 year old males and 25 to 34 year old females are the most vulnerable to poverty, with 48 males (100.0%) and 123 females (68.0%) in their respective age groups living below the poverty level.
| Age Bracket | Male | Female |
| Under 5 Years | 34 (52.3%) | 0 (0.0%) |
| 5 Years | 0 (0.0%) | 0 (0.0%) |
| 6 to 11 Years | 0 (0.0%) | 177 (49.4%) |
| 12 to 14 Years | 48 (100.0%) | 0 (0.0%) |
| 15 Years | 0 (0.0%) | 0 (0.0%) |
| 16 and 17 Years | 76 (100.0%) | 0 (0.0%) |
| 18 to 24 Years | 131 (67.9%) | 65 (64.4%) |
| 25 to 34 Years | 0 (0.0%) | 123 (68.0%) |
| 35 to 44 Years | 0 (0.0%) | 37 (9.4%) |
| 45 to 54 Years | 0 (0.0%) | 39 (49.4%) |
| 55 to 64 Years | 42 (17.5%) | 11 (5.4%) |
| 65 to 74 Years | 0 (0.0%) | 29 (8.0%) |
| 75 Years and over | 0 (0.0%) | 0 (0.0%) |
| Total | 331 (21.0%) | 481 (24.6%) |
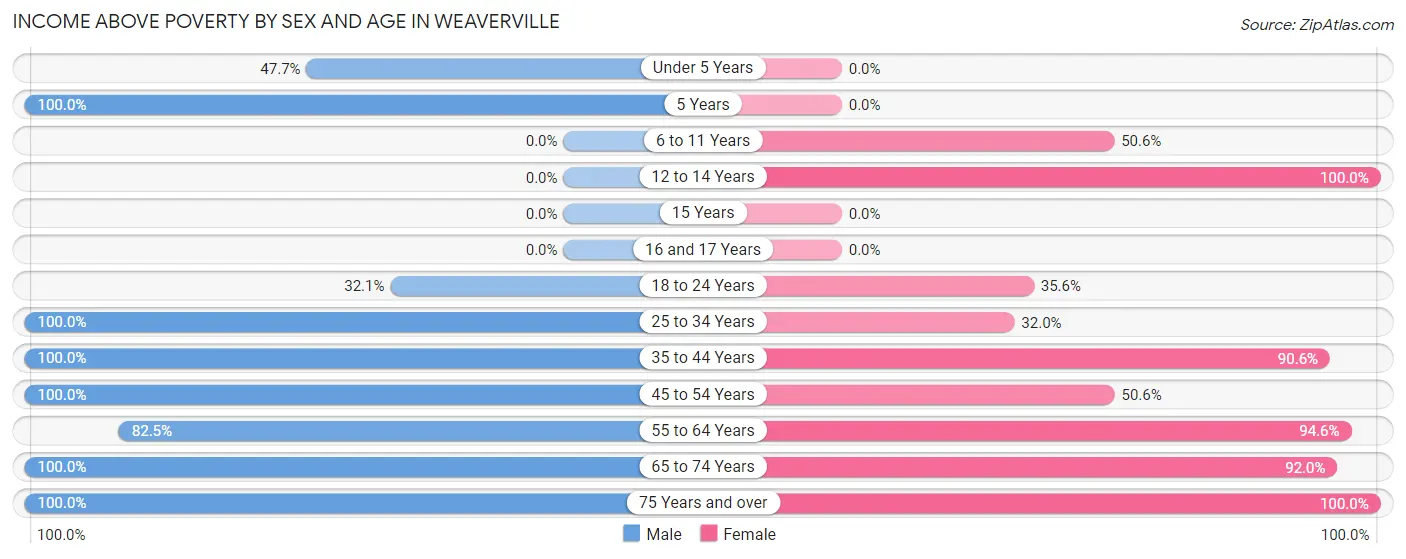
Income Above Poverty by Sex and Age in Weaverville
According to the poverty statistics in Weaverville, males aged 5 years and females aged 12 to 14 years are the age groups that are most secure financially, with 100.0% of males and 100.0% of females in these age groups living above the poverty line.
| Age Bracket | Male | Female |
| Under 5 Years | 31 (47.7%) | 0 (0.0%) |
| 5 Years | 40 (100.0%) | 0 (0.0%) |
| 6 to 11 Years | 0 (0.0%) | 181 (50.6%) |
| 12 to 14 Years | 0 (0.0%) | 105 (100.0%) |
| 15 Years | 0 (0.0%) | 0 (0.0%) |
| 16 and 17 Years | 0 (0.0%) | 0 (0.0%) |
| 18 to 24 Years | 62 (32.1%) | 36 (35.6%) |
| 25 to 34 Years | 147 (100.0%) | 58 (32.0%) |
| 35 to 44 Years | 180 (100.0%) | 356 (90.6%) |
| 45 to 54 Years | 84 (100.0%) | 40 (50.6%) |
| 55 to 64 Years | 198 (82.5%) | 192 (94.6%) |
| 65 to 74 Years | 332 (100.0%) | 332 (92.0%) |
| 75 Years and over | 170 (100.0%) | 172 (100.0%) |
| Total | 1,244 (79.0%) | 1,472 (75.4%) |
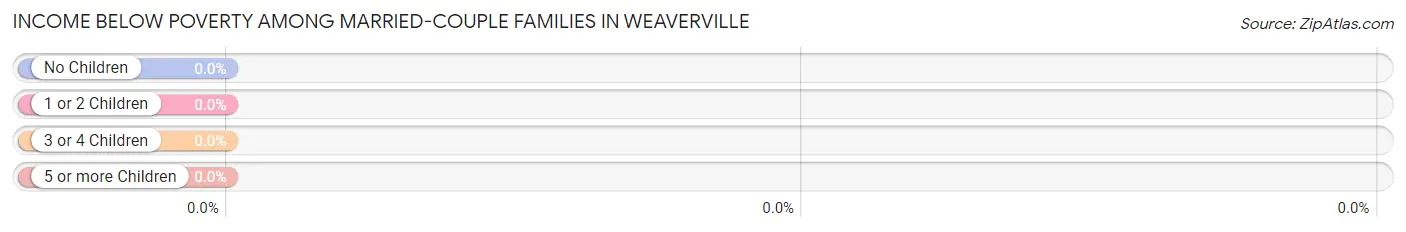
Income Below Poverty Among Married-Couple Families in Weaverville
| Children | Above Poverty | Below Poverty |
| No Children | 539 (100.0%) | 0 (0.0%) |
| 1 or 2 Children | 94 (100.0%) | 0 (0.0%) |
| 3 or 4 Children | 0 (0.0%) | 0 (0.0%) |
| 5 or more Children | 0 (0.0%) | 0 (0.0%) |
| Total | 633 (100.0%) | 0 (0.0%) |
Income Below Poverty Among Single-Parent Households in Weaverville
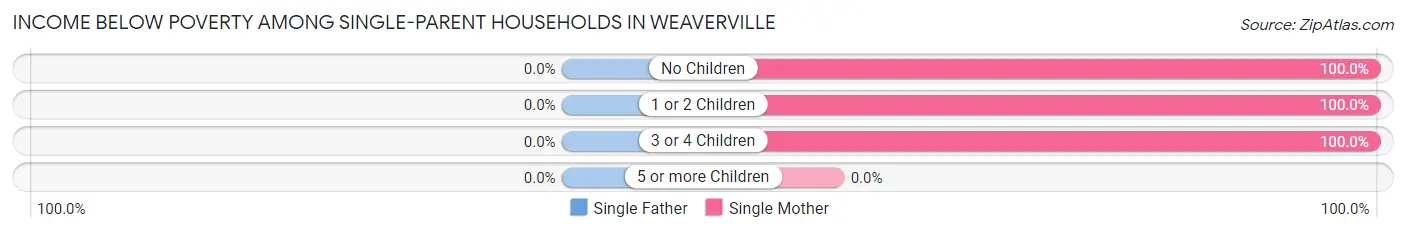
| Children | Single Father | Single Mother |
| No Children | 0 (0.0%) | 5 (100.0%) |
| 1 or 2 Children | 0 (0.0%) | 71 (100.0%) |
| 3 or 4 Children | 0 (0.0%) | 42 (100.0%) |
| 5 or more Children | 0 (0.0%) | 0 (0.0%) |
| Total | 0 (0.0%) | 118 (100.0%) |
Income Below Poverty Among Married-Couple vs Single-Parent Households in Weaverville
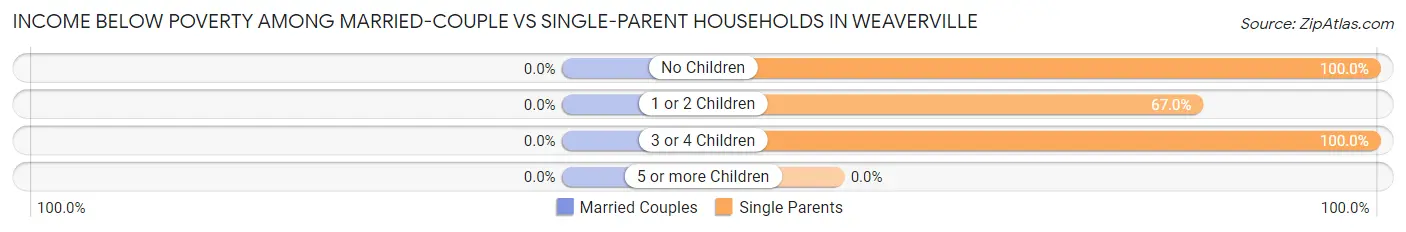
| Children | Married-Couple Families | Single-Parent Households |
| No Children | 0 (0.0%) | 5 (100.0%) |
| 1 or 2 Children | 0 (0.0%) | 71 (67.0%) |
| 3 or 4 Children | 0 (0.0%) | 42 (100.0%) |
| 5 or more Children | 0 (0.0%) | 0 (0.0%) |
| Total | 0 (0.0%) | 118 (77.1%) |
Race in Weaverville
The most populous races in Weaverville are White / Caucasian (2,654 | 74.1%), Some other Race (359 | 10.0%), and Native / Alaskan (302 | 8.4%).
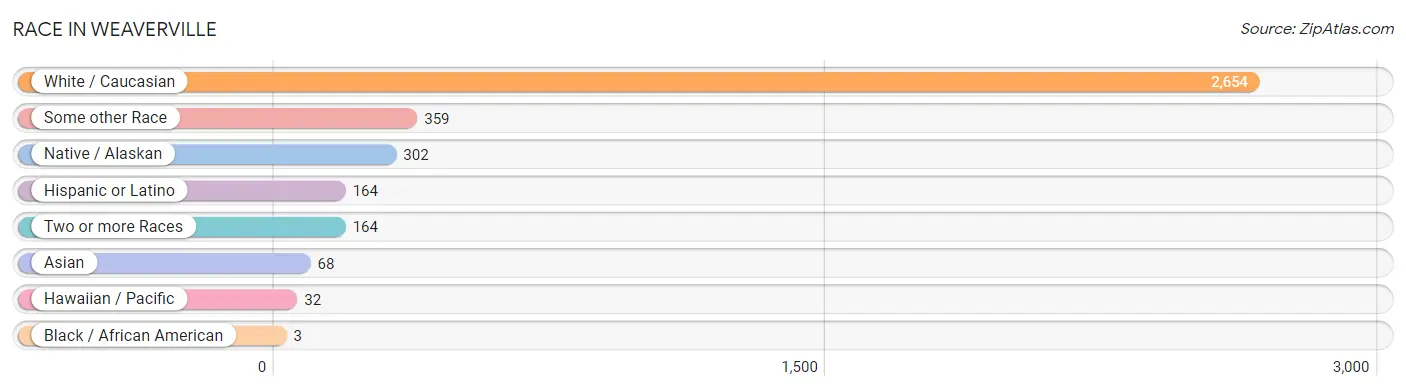
| Race | # Population | % Population |
| Asian | 68 | 1.9% |
| Black / African American | 3 | 0.1% |
| Hawaiian / Pacific | 32 | 0.9% |
| Hispanic or Latino | 164 | 4.6% |
| Native / Alaskan | 302 | 8.4% |
| White / Caucasian | 2,654 | 74.1% |
| Two or more Races | 164 | 4.6% |
| Some other Race | 359 | 10.0% |
| Total | 3,582 | 100.0% |
Ancestry in Weaverville
The most populous ancestries reported in Weaverville are American (784 | 21.9%), Irish (230 | 6.4%), English (195 | 5.4%), German (172 | 4.8%), and Northern European (172 | 4.8%), together accounting for 43.3% of all Weaverville residents.
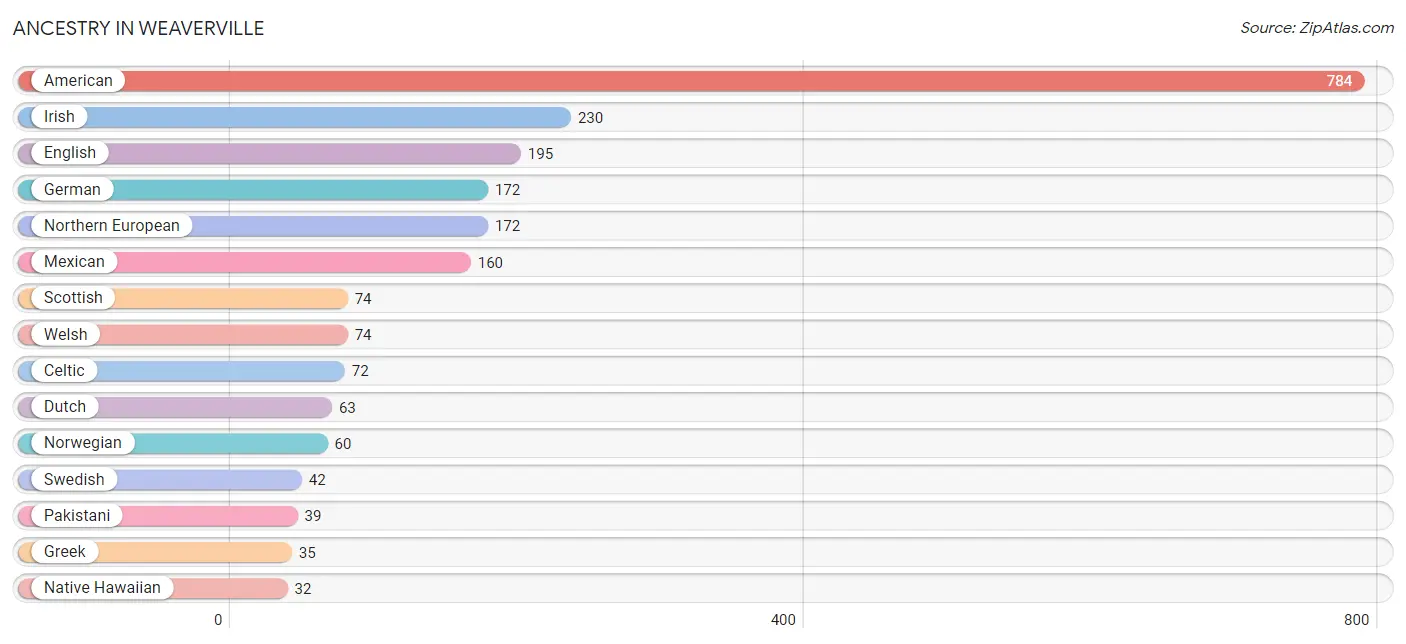
| Ancestry | # Population | % Population |
| African | 1 | 0.0% |
| American | 784 | 21.9% |
| Celtic | 72 | 2.0% |
| Cherokee | 9 | 0.3% |
| Dutch | 63 | 1.8% |
| English | 195 | 5.4% |
| French | 28 | 0.8% |
| German | 172 | 4.8% |
| Greek | 35 | 1.0% |
| Indian (Asian) | 29 | 0.8% |
| Iranian | 6 | 0.2% |
| Irish | 230 | 6.4% |
| Mexican | 160 | 4.5% |
| Native Hawaiian | 32 | 0.9% |
| Northern European | 172 | 4.8% |
| Norwegian | 60 | 1.7% |
| Pakistani | 39 | 1.1% |
| Puerto Rican | 3 | 0.1% |
| Scottish | 74 | 2.1% |
| Subsaharan African | 1 | 0.0% |
| Swedish | 42 | 1.2% |
| Swiss | 2 | 0.1% |
| Welsh | 74 | 2.1% | View All 23 Rows |
Immigrants in Weaverville
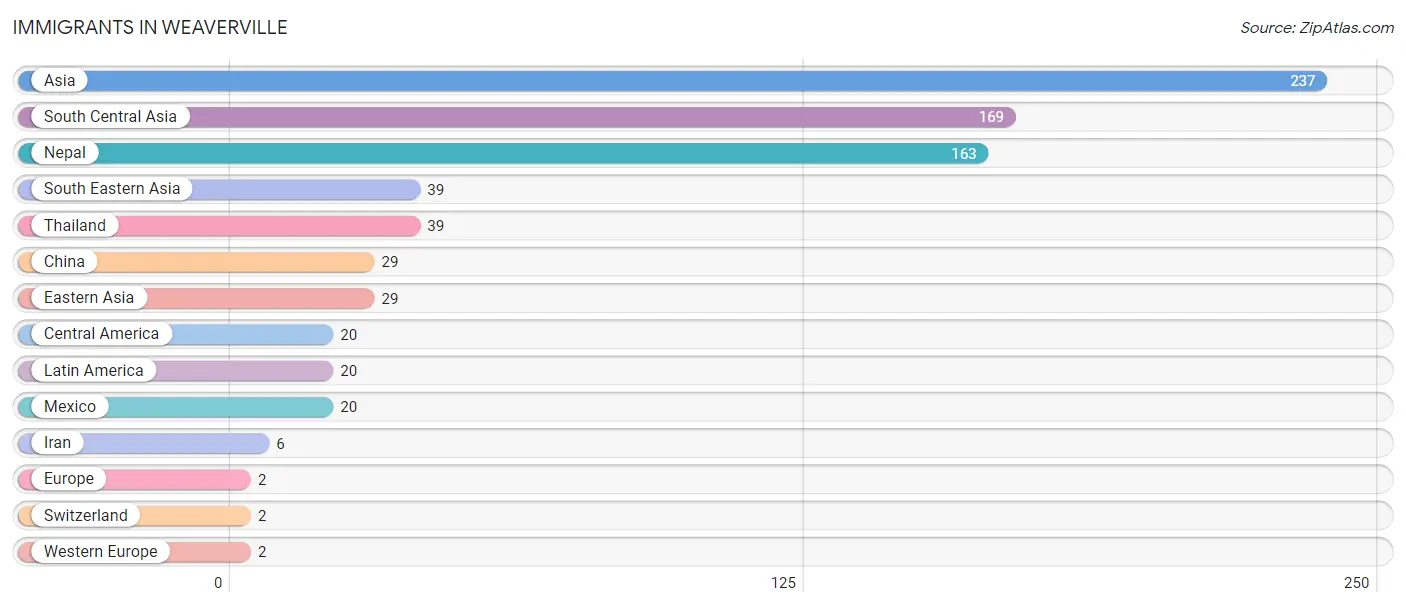
The most numerous immigrant groups reported in Weaverville came from Asia (237 | 6.6%), South Central Asia (169 | 4.7%), Nepal (163 | 4.5%), South Eastern Asia (39 | 1.1%), and Thailand (39 | 1.1%), together accounting for 18.1% of all Weaverville residents.
| Immigration Origin | # Population | % Population |
| Asia | 237 | 6.6% |
| Central America | 20 | 0.6% |
| China | 29 | 0.8% |
| Eastern Asia | 29 | 0.8% |
| Europe | 2 | 0.1% |
| Iran | 6 | 0.2% |
| Latin America | 20 | 0.6% |
| Mexico | 20 | 0.6% |
| Nepal | 163 | 4.5% |
| South Central Asia | 169 | 4.7% |
| South Eastern Asia | 39 | 1.1% |
| Switzerland | 2 | 0.1% |
| Thailand | 39 | 1.1% |
| Western Europe | 2 | 0.1% | View All 14 Rows |
Sex and Age in Weaverville
Sex and Age in Weaverville
The most populous age groups in Weaverville are 15 to 19 Years (206 | 12.8%) for men and 35 to 39 Years (339 | 17.2%) for women.
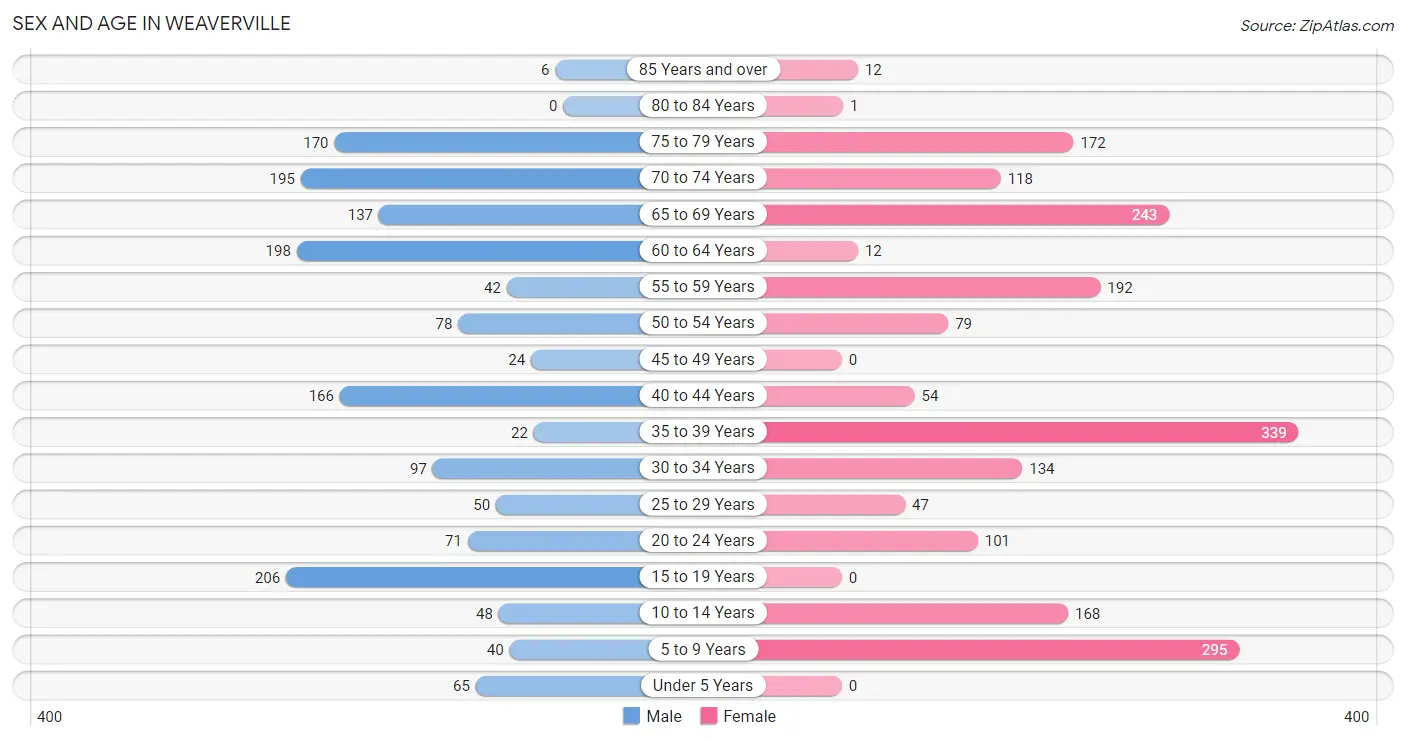
| Age Bracket | Male | Female |
| Under 5 Years | 65 (4.0%) | 0 (0.0%) |
| 5 to 9 Years | 40 (2.5%) | 295 (15.0%) |
| 10 to 14 Years | 48 (3.0%) | 168 (8.5%) |
| 15 to 19 Years | 206 (12.8%) | 0 (0.0%) |
| 20 to 24 Years | 71 (4.4%) | 101 (5.1%) |
| 25 to 29 Years | 50 (3.1%) | 47 (2.4%) |
| 30 to 34 Years | 97 (6.0%) | 134 (6.8%) |
| 35 to 39 Years | 22 (1.4%) | 339 (17.2%) |
| 40 to 44 Years | 166 (10.3%) | 54 (2.8%) |
| 45 to 49 Years | 24 (1.5%) | 0 (0.0%) |
| 50 to 54 Years | 78 (4.8%) | 79 (4.0%) |
| 55 to 59 Years | 42 (2.6%) | 192 (9.8%) |
| 60 to 64 Years | 198 (12.3%) | 12 (0.6%) |
| 65 to 69 Years | 137 (8.5%) | 243 (12.3%) |
| 70 to 74 Years | 195 (12.1%) | 118 (6.0%) |
| 75 to 79 Years | 170 (10.5%) | 172 (8.7%) |
| 80 to 84 Years | 0 (0.0%) | 1 (0.1%) |
| 85 Years and over | 6 (0.4%) | 12 (0.6%) |
| Total | 1,615 (100.0%) | 1,967 (100.0%) |
Families and Households in Weaverville
Median Family Size in Weaverville
The median family size in Weaverville is 3.10 persons per family, with single female/mother families (118 | 15.0%) accounting for the largest median family size of 5.39 persons per family. On the other hand, married-couple families (633 | 80.5%) represent the smallest median family size with 2.61 persons per family.
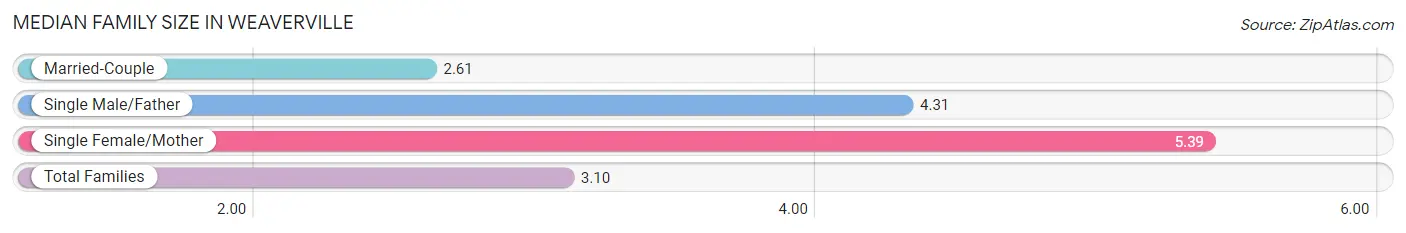
| Family Type | # Families | Family Size |
| Married-Couple | 633 (80.5%) | 2.61 |
| Single Male/Father | 35 (4.4%) | 4.31 |
| Single Female/Mother | 118 (15.0%) | 5.39 |
| Total Families | 786 (100.0%) | 3.10 |
Median Household Size in Weaverville
The median household size in Weaverville is 2.37 persons per household, with single female/mother households (118 | 8.0%) accounting for the largest median household size of 6.3 persons per household. non-family households (695 | 46.9%) represent the smallest median household size with 1.38 persons per household.
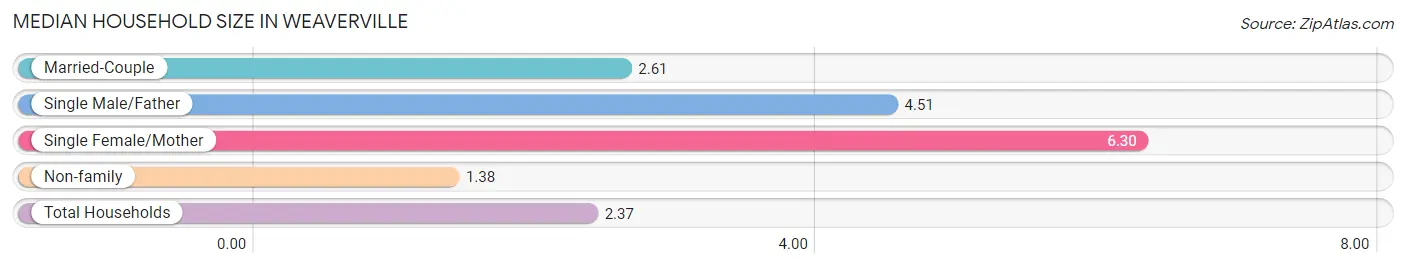
| Household Type | # Households | Household Size |
| Married-Couple | 633 (42.7%) | 2.61 |
| Single Male/Father | 35 (2.4%) | 4.51 |
| Single Female/Mother | 118 (8.0%) | 6.30 |
| Non-family | 695 (46.9%) | 1.38 |
| Total Households | 1,481 (100.0%) | 2.37 |
Household Size by Marriage Status in Weaverville
Out of a total of 1,481 households in Weaverville, 786 (53.1%) are family households, while 695 (46.9%) are nonfamily households. The most numerous type of family households are 2-person households, comprising 470, and the most common type of nonfamily households are 1-person households, comprising 569.
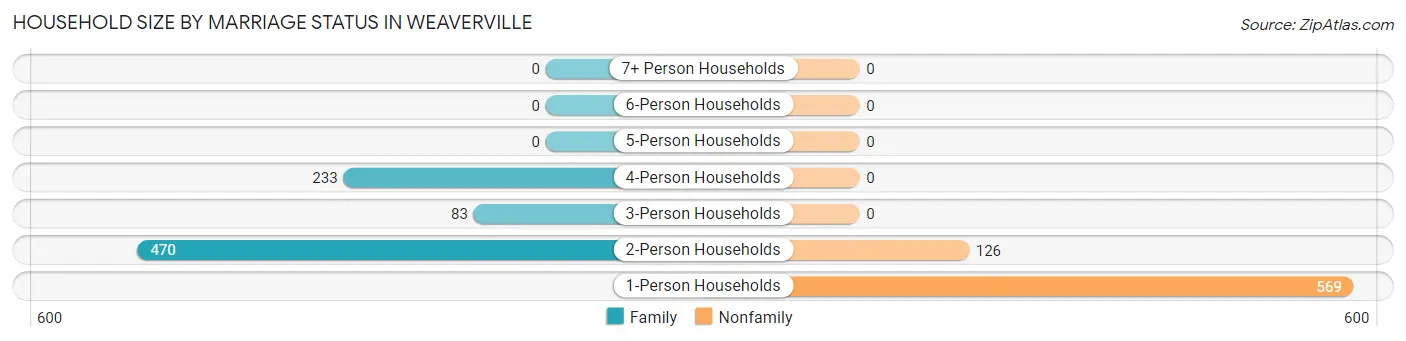
| Household Size | Family Households | Nonfamily Households |
| 1-Person Households | - | 569 (38.4%) |
| 2-Person Households | 470 (31.7%) | 126 (8.5%) |
| 3-Person Households | 83 (5.6%) | 0 (0.0%) |
| 4-Person Households | 233 (15.7%) | 0 (0.0%) |
| 5-Person Households | 0 (0.0%) | 0 (0.0%) |
| 6-Person Households | 0 (0.0%) | 0 (0.0%) |
| 7+ Person Households | 0 (0.0%) | 0 (0.0%) |
| Total | 786 (53.1%) | 695 (46.9%) |
Female Fertility in Weaverville
Fertility by Age in Weaverville
Average fertility rate in Weaverville is 50.0 births per 1,000 women. Women in the age bracket of 20 to 34 years have the highest fertility rate with 121.0 births per 1,000 women. Women in the age bracket of 20 to 34 years acount for 100.0% of all women with births.
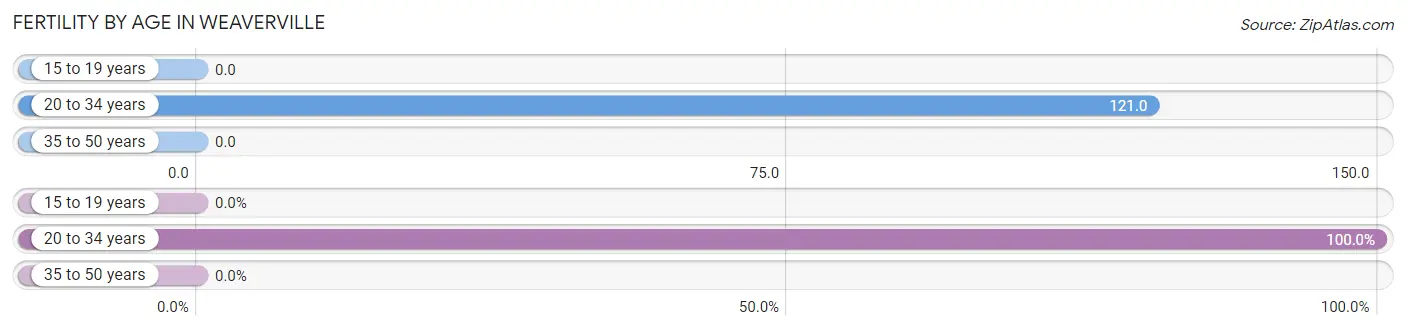
| Age Bracket | Women with Births | Births / 1,000 Women |
| 15 to 19 years | 0 (0.0%) | 0.0 |
| 20 to 34 years | 34 (100.0%) | 121.0 |
| 35 to 50 years | 0 (0.0%) | 0.0 |
| Total | 34 (100.0%) | 50.0 |
Fertility by Age by Marriage Status in Weaverville
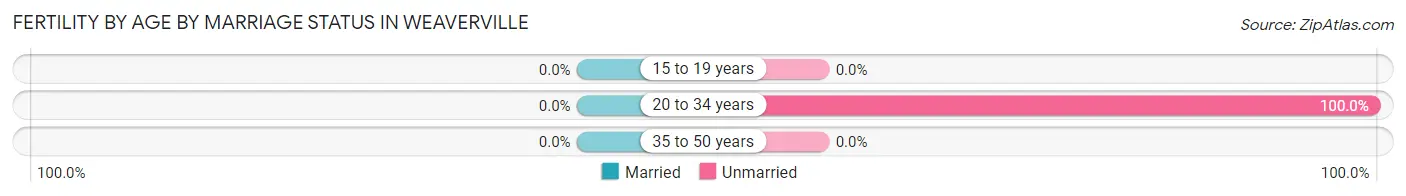
| Age Bracket | Married | Unmarried |
| 15 to 19 years | 0 (0.0%) | 0 (0.0%) |
| 20 to 34 years | 0 (0.0%) | 34 (100.0%) |
| 35 to 50 years | 0 (0.0%) | 0 (0.0%) |
| Total | 0 (0.0%) | 34 (100.0%) |
Fertility by Education in Weaverville
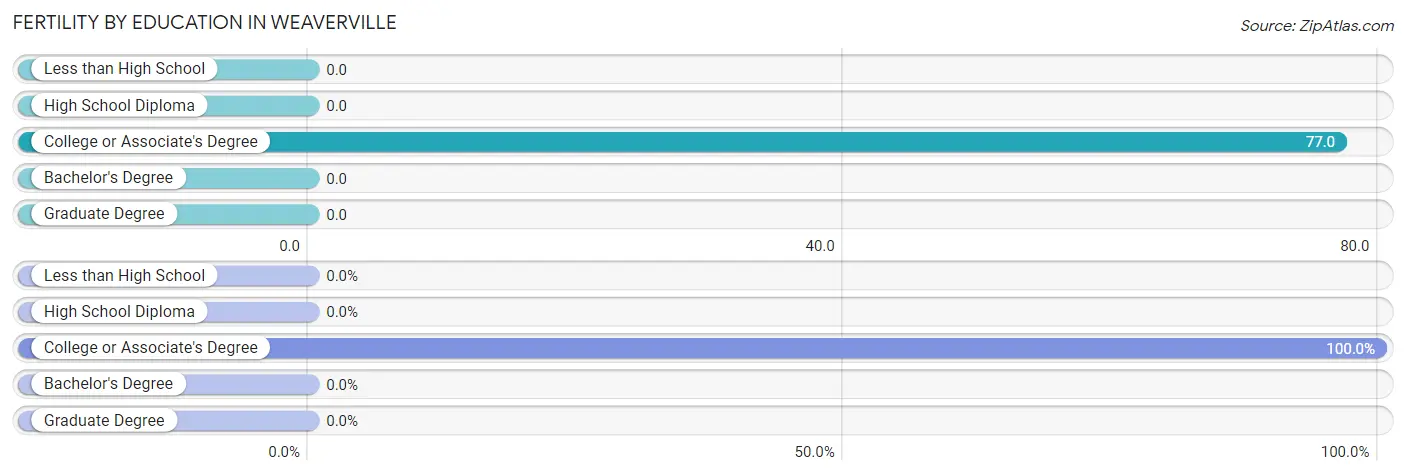
| Educational Attainment | Women with Births | Births / 1,000 Women |
| Less than High School | 0 (0.0%) | 0.0 |
| High School Diploma | 0 (0.0%) | 0.0 |
| College or Associate's Degree | 34 (100.0%) | 77.0 |
| Bachelor's Degree | 0 (0.0%) | 0.0 |
| Graduate Degree | 0 (0.0%) | 0.0 |
| Total | 34 (100.0%) | 50.0 |
Fertility by Education by Marriage Status in Weaverville
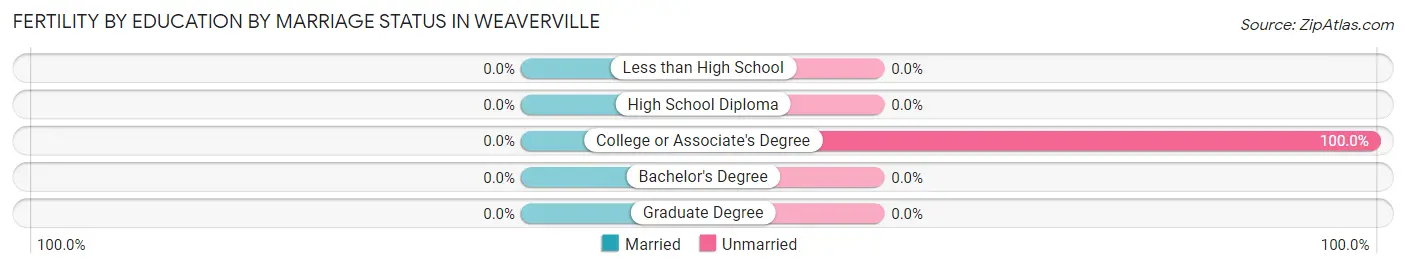
| Educational Attainment | Married | Unmarried |
| Less than High School | 0 (0.0%) | 0 (0.0%) |
| High School Diploma | 0 (0.0%) | 0 (0.0%) |
| College or Associate's Degree | 0 (0.0%) | 34 (100.0%) |
| Bachelor's Degree | 0 (0.0%) | 0 (0.0%) |
| Graduate Degree | 0 (0.0%) | 0 (0.0%) |
| Total | 0 (0.0%) | 34 (100.0%) |
Employment Characteristics in Weaverville
Employment by Class of Employer in Weaverville
Among the 1,348 employed individuals in Weaverville, private company employees (473 | 35.1%), local government employees (372 | 27.6%), and self-employed (not incorporated) (245 | 18.2%) make up the most common classes of employment.
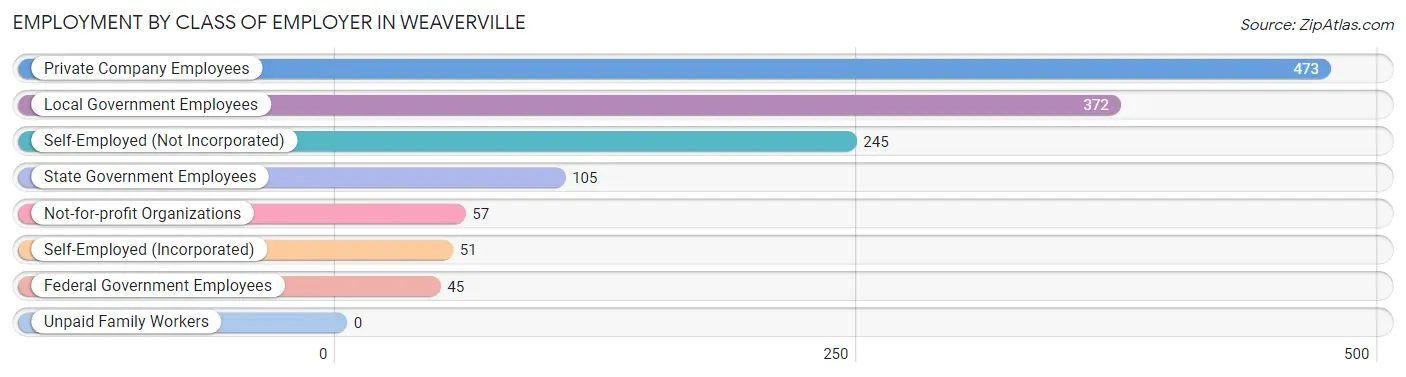
| Employer Class | # Employees | % Employees |
| Private Company Employees | 473 | 35.1% |
| Self-Employed (Incorporated) | 51 | 3.8% |
| Self-Employed (Not Incorporated) | 245 | 18.2% |
| Not-for-profit Organizations | 57 | 4.2% |
| Local Government Employees | 372 | 27.6% |
| State Government Employees | 105 | 7.8% |
| Federal Government Employees | 45 | 3.3% |
| Unpaid Family Workers | 0 | 0.0% |
| Total | 1,348 | 100.0% |
Employment Status by Age in Weaverville
According to the labor force statistics for Weaverville, out of the total population over 16 years of age (2,964), 51.1% or 1,515 individuals are in the labor force, with 10.5% or 159 of them unemployed. The age group with the highest labor force participation rate is 25 to 29 years, with 100.0% or 97 individuals in the labor force. Within the labor force, the 45 to 54 years age range has the highest percentage of unemployed individuals, with 47.2% or 77 of them being unemployed.
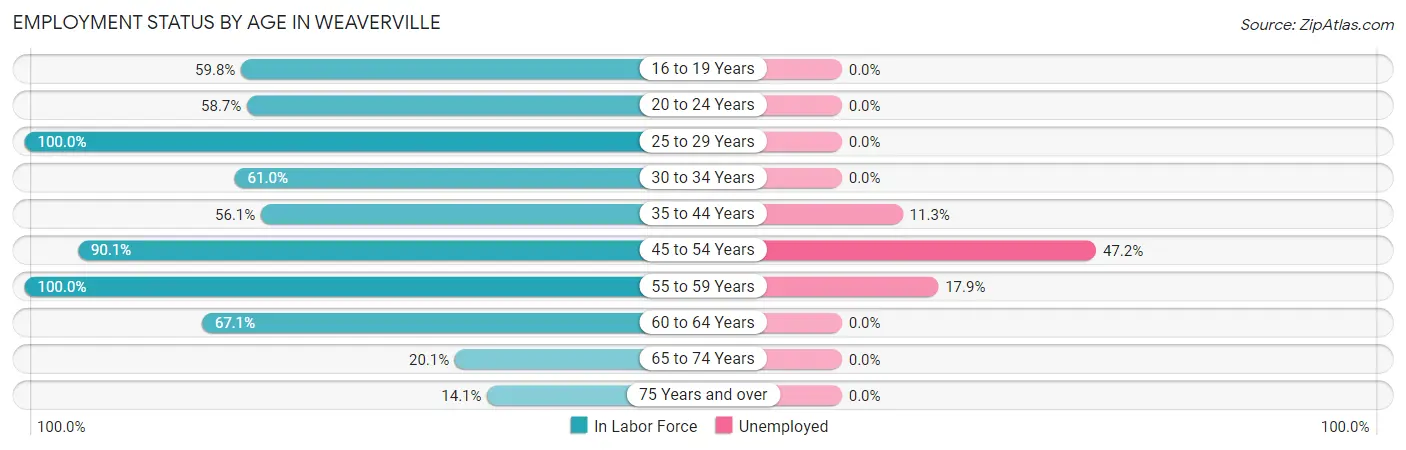
| Age Bracket | In Labor Force | Unemployed |
| 16 to 19 Years | 122 (59.8%) | 0 (0.0%) |
| 20 to 24 Years | 101 (58.7%) | 0 (0.0%) |
| 25 to 29 Years | 97 (100.0%) | 0 (0.0%) |
| 30 to 34 Years | 141 (61.0%) | 0 (0.0%) |
| 35 to 44 Years | 326 (56.1%) | 37 (11.3%) |
| 45 to 54 Years | 163 (90.1%) | 77 (47.2%) |
| 55 to 59 Years | 234 (100.0%) | 42 (17.9%) |
| 60 to 64 Years | 141 (67.1%) | 0 (0.0%) |
| 65 to 74 Years | 139 (20.1%) | 0 (0.0%) |
| 75 Years and over | 51 (14.1%) | 0 (0.0%) |
| Total | 1,515 (51.1%) | 159 (10.5%) |
Employment Status by Educational Attainment in Weaverville
According to labor force statistics for Weaverville, 71.8% of individuals (1,101) out of the total population between 25 and 64 years of age (1,534) are in the labor force, with 14.2% or 156 of them being unemployed. The group with the highest labor force participation rate are those with the educational attainment of bachelor's degree or higher, with 100.0% or 271 individuals in the labor force. Within the labor force, individuals with less than high school education have the highest percentage of unemployment, with 41.7% or 5 of them being unemployed.
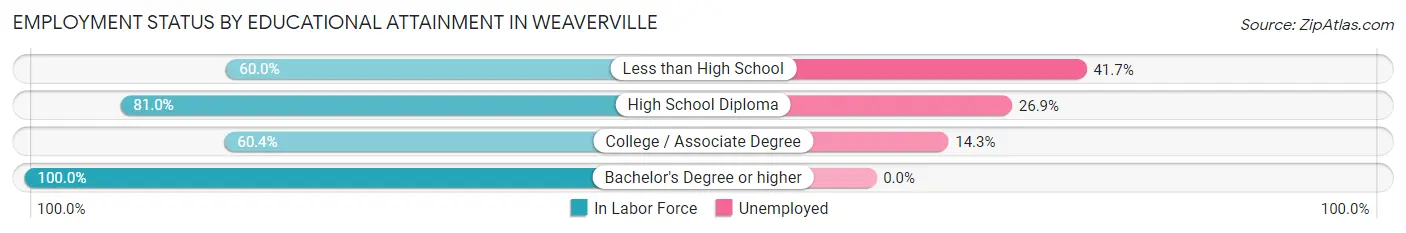
| Educational Attainment | In Labor Force | Unemployed |
| Less than High School | 12 (60.0%) | 8 (41.7%) |
| High School Diploma | 268 (81.0%) | 89 (26.9%) |
| College / Associate Degree | 551 (60.4%) | 130 (14.3%) |
| Bachelor's Degree or higher | 271 (100.0%) | 0 (0.0%) |
| Total | 1,101 (71.8%) | 218 (14.2%) |
Employment Occupations by Sex in Weaverville
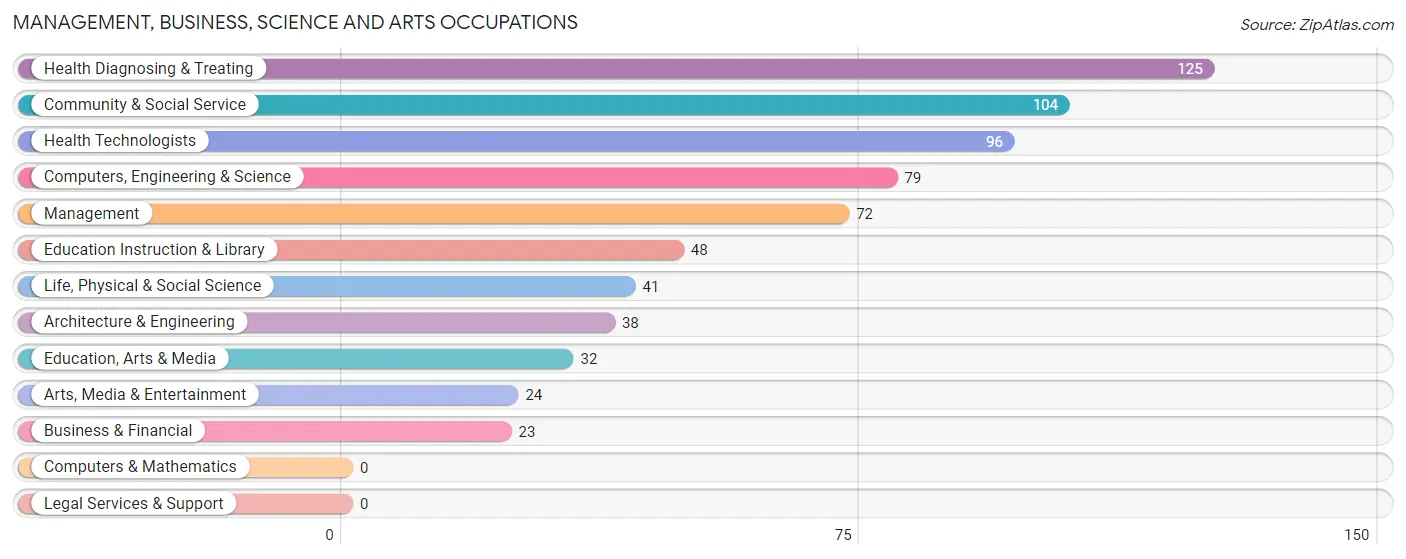
Management, Business, Science and Arts Occupations
The most common Management, Business, Science and Arts occupations in Weaverville are Health Diagnosing & Treating (125 | 9.4%), Community & Social Service (104 | 7.8%), Health Technologists (96 | 7.2%), Computers, Engineering & Science (79 | 5.9%), and Management (72 | 5.4%).
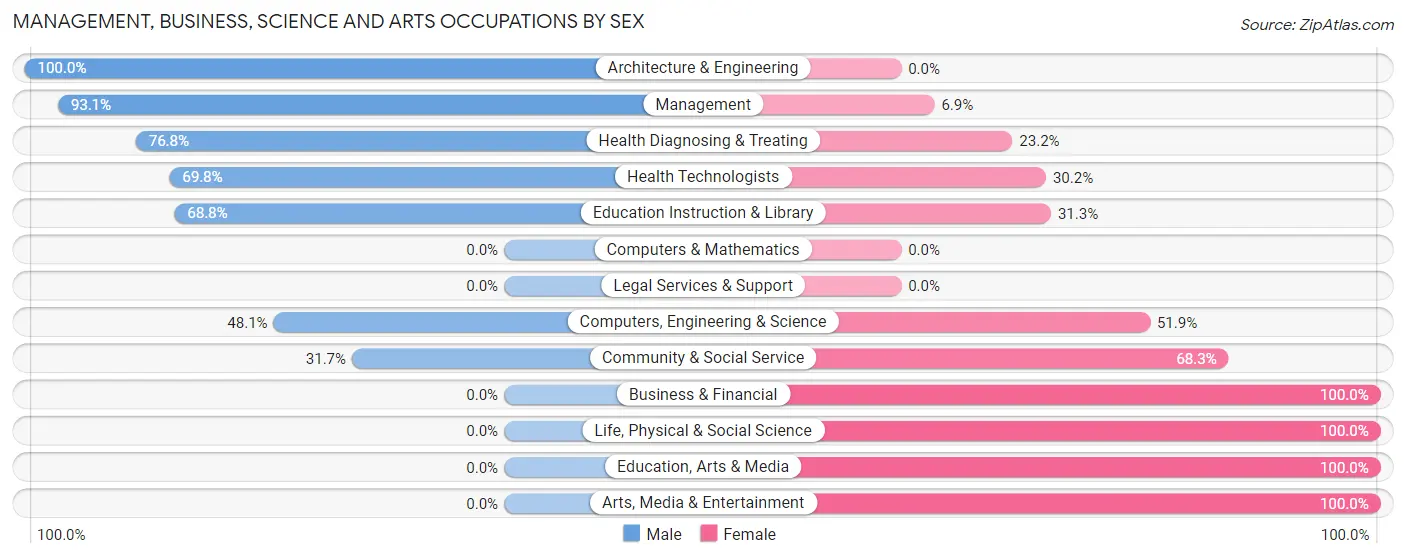
Management, Business, Science and Arts Occupations by Sex
Within the Management, Business, Science and Arts occupations in Weaverville, the most male-oriented occupations are Architecture & Engineering (100.0%), Management (93.1%), and Health Diagnosing & Treating (76.8%), while the most female-oriented occupations are Business & Financial (100.0%), Life, Physical & Social Science (100.0%), and Education, Arts & Media (100.0%).
| Occupation | Male | Female |
| Management | 67 (93.1%) | 5 (6.9%) |
| Business & Financial | 0 (0.0%) | 23 (100.0%) |
| Computers, Engineering & Science | 38 (48.1%) | 41 (51.9%) |
| Computers & Mathematics | 0 (0.0%) | 0 (0.0%) |
| Architecture & Engineering | 38 (100.0%) | 0 (0.0%) |
| Life, Physical & Social Science | 0 (0.0%) | 41 (100.0%) |
| Community & Social Service | 33 (31.7%) | 71 (68.3%) |
| Education, Arts & Media | 0 (0.0%) | 32 (100.0%) |
| Legal Services & Support | 0 (0.0%) | 0 (0.0%) |
| Education Instruction & Library | 33 (68.8%) | 15 (31.2%) |
| Arts, Media & Entertainment | 0 (0.0%) | 24 (100.0%) |
| Health Diagnosing & Treating | 96 (76.8%) | 29 (23.2%) |
| Health Technologists | 67 (69.8%) | 29 (30.2%) |
| Total (Category) | 234 (58.1%) | 169 (41.9%) |
| Total (Overall) | 653 (48.9%) | 682 (51.1%) |
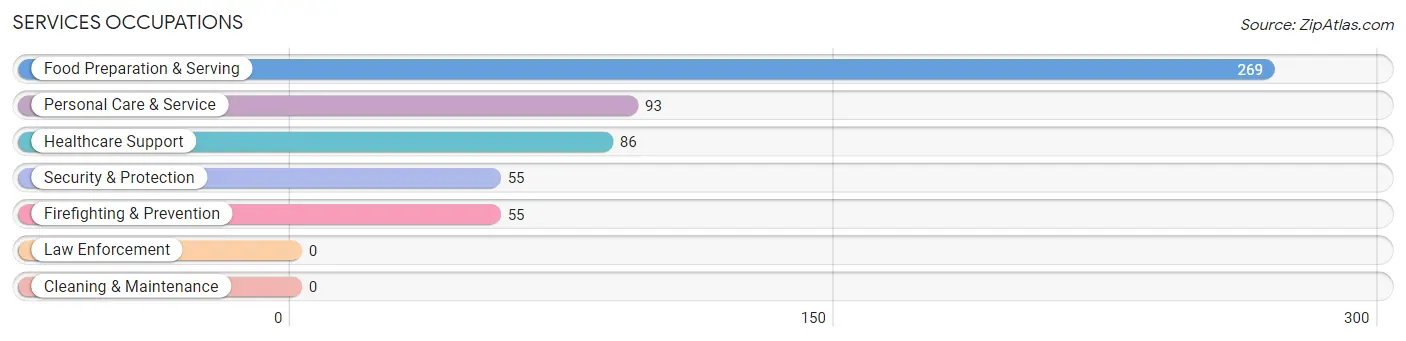
Services Occupations
The most common Services occupations in Weaverville are Food Preparation & Serving (269 | 20.2%), Personal Care & Service (93 | 7.0%), Healthcare Support (86 | 6.4%), Security & Protection (55 | 4.1%), and Firefighting & Prevention (55 | 4.1%).
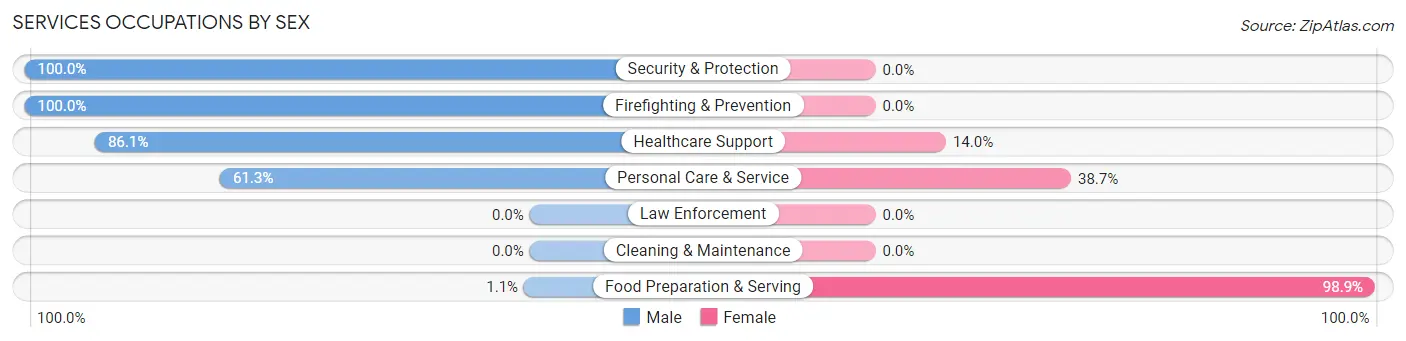
Services Occupations by Sex
Within the Services occupations in Weaverville, the most male-oriented occupations are Security & Protection (100.0%), Firefighting & Prevention (100.0%), and Healthcare Support (86.1%), while the most female-oriented occupations are Food Preparation & Serving (98.9%), Personal Care & Service (38.7%), and Healthcare Support (14.0%).
| Occupation | Male | Female |
| Healthcare Support | 74 (86.1%) | 12 (14.0%) |
| Security & Protection | 55 (100.0%) | 0 (0.0%) |
| Firefighting & Prevention | 55 (100.0%) | 0 (0.0%) |
| Law Enforcement | 0 (0.0%) | 0 (0.0%) |
| Food Preparation & Serving | 3 (1.1%) | 266 (98.9%) |
| Cleaning & Maintenance | 0 (0.0%) | 0 (0.0%) |
| Personal Care & Service | 57 (61.3%) | 36 (38.7%) |
| Total (Category) | 189 (37.6%) | 314 (62.4%) |
| Total (Overall) | 653 (48.9%) | 682 (51.1%) |
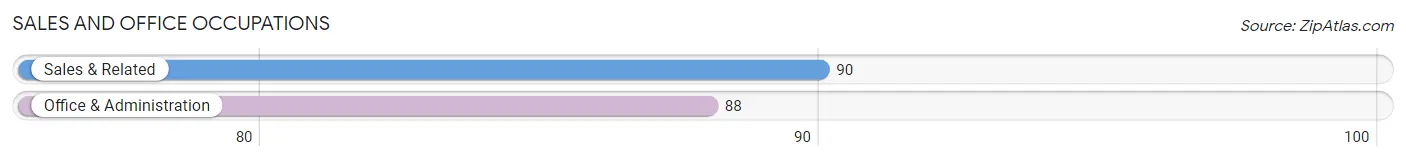
Sales and Office Occupations
The most common Sales and Office occupations in Weaverville are Sales & Related (90 | 6.7%), and Office & Administration (88 | 6.6%).
Sales and Office Occupations by Sex
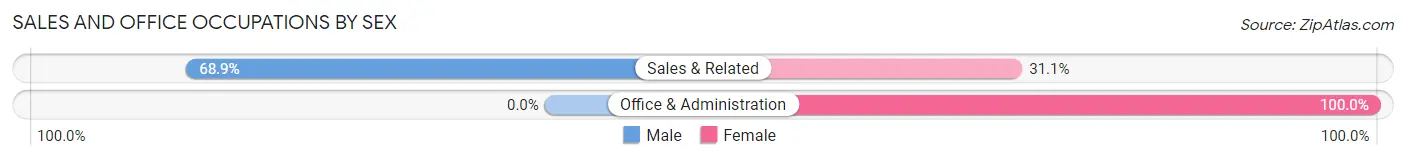
| Occupation | Male | Female |
| Sales & Related | 62 (68.9%) | 28 (31.1%) |
| Office & Administration | 0 (0.0%) | 88 (100.0%) |
| Total (Category) | 62 (34.8%) | 116 (65.2%) |
| Total (Overall) | 653 (48.9%) | 682 (51.1%) |
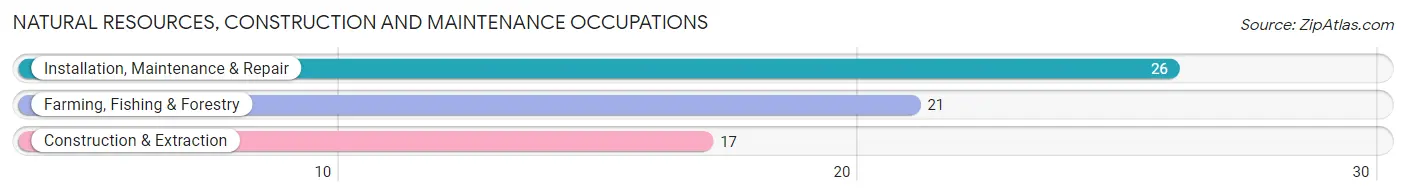
Natural Resources, Construction and Maintenance Occupations
The most common Natural Resources, Construction and Maintenance occupations in Weaverville are Installation, Maintenance & Repair (26 | 1.9%), Farming, Fishing & Forestry (21 | 1.6%), and Construction & Extraction (17 | 1.3%).
Natural Resources, Construction and Maintenance Occupations by Sex
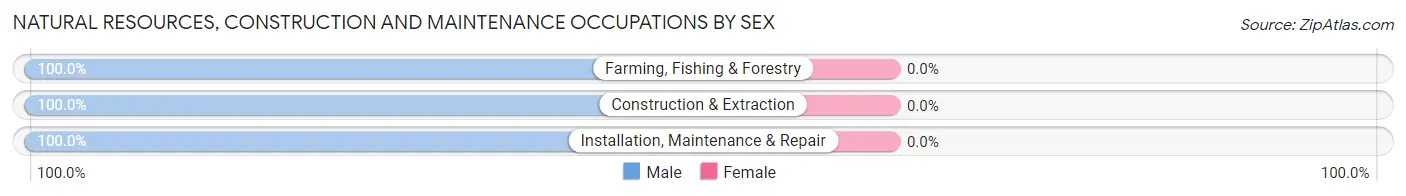
| Occupation | Male | Female |
| Farming, Fishing & Forestry | 21 (100.0%) | 0 (0.0%) |
| Construction & Extraction | 17 (100.0%) | 0 (0.0%) |
| Installation, Maintenance & Repair | 26 (100.0%) | 0 (0.0%) |
| Total (Category) | 64 (100.0%) | 0 (0.0%) |
| Total (Overall) | 653 (48.9%) | 682 (51.1%) |
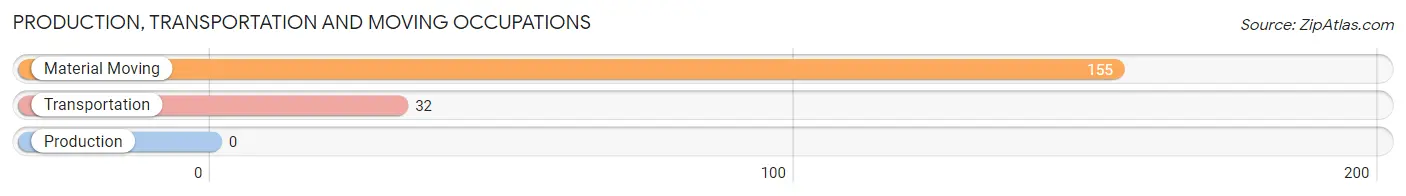
Production, Transportation and Moving Occupations
The most common Production, Transportation and Moving occupations in Weaverville are Material Moving (155 | 11.6%), and Transportation (32 | 2.4%).
Production, Transportation and Moving Occupations by Sex
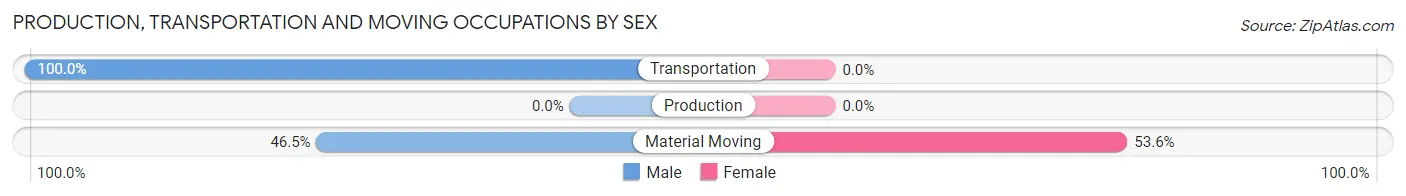
| Occupation | Male | Female |
| Production | 0 (0.0%) | 0 (0.0%) |
| Transportation | 32 (100.0%) | 0 (0.0%) |
| Material Moving | 72 (46.5%) | 83 (53.5%) |
| Total (Category) | 104 (55.6%) | 83 (44.4%) |
| Total (Overall) | 653 (48.9%) | 682 (51.1%) |
Employment Industries by Sex in Weaverville
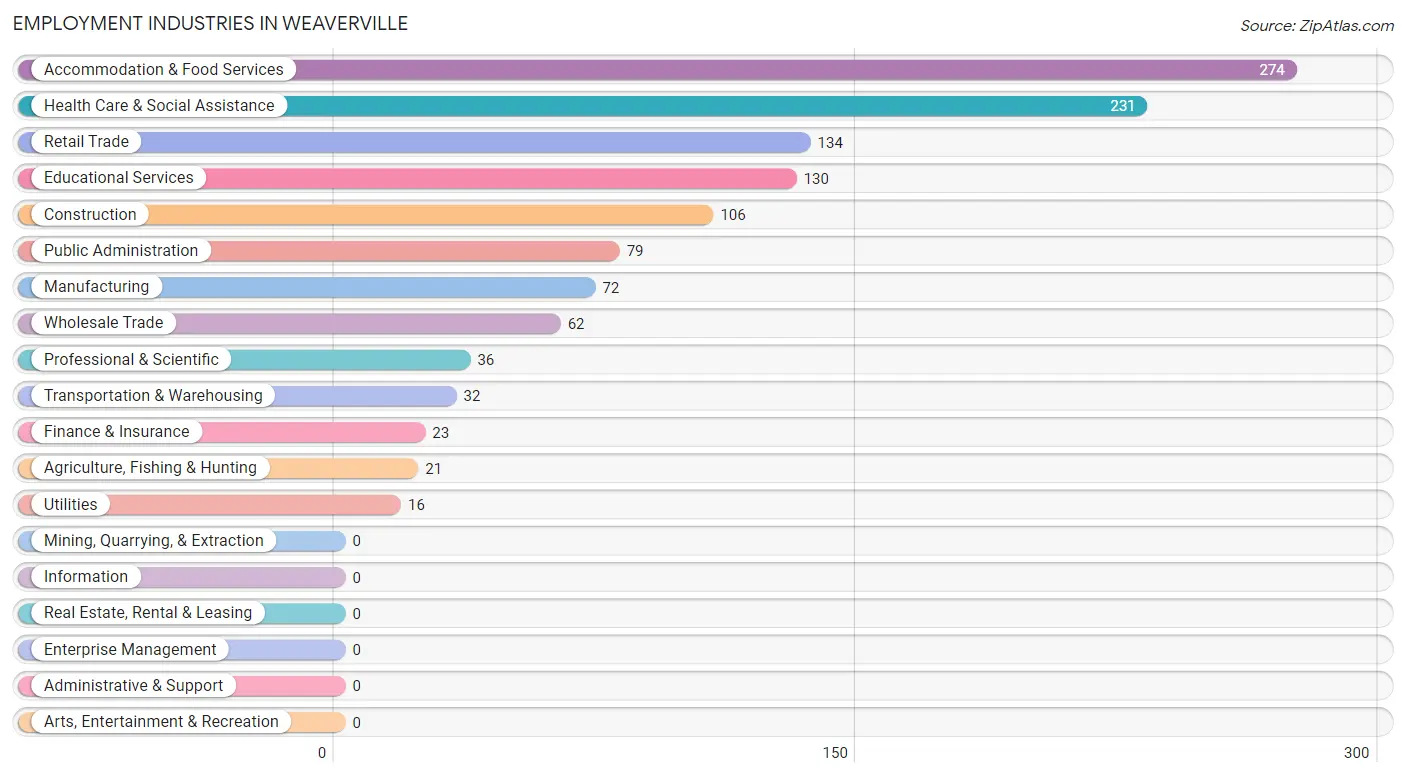
Employment Industries in Weaverville
The major employment industries in Weaverville include Accommodation & Food Services (274 | 20.5%), Health Care & Social Assistance (231 | 17.3%), Retail Trade (134 | 10.0%), Educational Services (130 | 9.7%), and Construction (106 | 7.9%).
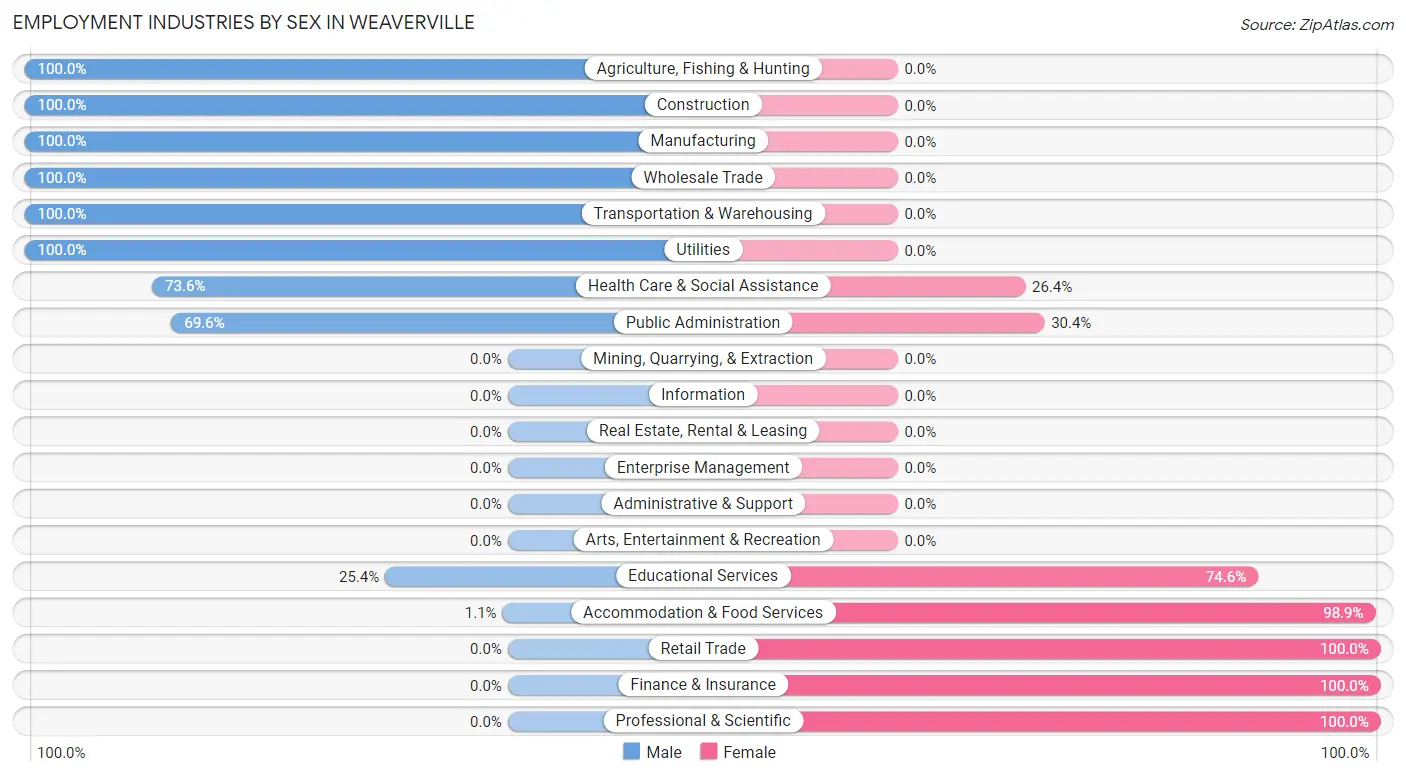
Employment Industries by Sex in Weaverville
The Weaverville industries that see more men than women are Agriculture, Fishing & Hunting (100.0%), Construction (100.0%), and Manufacturing (100.0%), whereas the industries that tend to have a higher number of women are Retail Trade (100.0%), Finance & Insurance (100.0%), and Professional & Scientific (100.0%).
| Industry | Male | Female |
| Agriculture, Fishing & Hunting | 21 (100.0%) | 0 (0.0%) |
| Mining, Quarrying, & Extraction | 0 (0.0%) | 0 (0.0%) |
| Construction | 106 (100.0%) | 0 (0.0%) |
| Manufacturing | 72 (100.0%) | 0 (0.0%) |
| Wholesale Trade | 62 (100.0%) | 0 (0.0%) |
| Retail Trade | 0 (0.0%) | 134 (100.0%) |
| Transportation & Warehousing | 32 (100.0%) | 0 (0.0%) |
| Utilities | 16 (100.0%) | 0 (0.0%) |
| Information | 0 (0.0%) | 0 (0.0%) |
| Finance & Insurance | 0 (0.0%) | 23 (100.0%) |
| Real Estate, Rental & Leasing | 0 (0.0%) | 0 (0.0%) |
| Professional & Scientific | 0 (0.0%) | 36 (100.0%) |
| Enterprise Management | 0 (0.0%) | 0 (0.0%) |
| Administrative & Support | 0 (0.0%) | 0 (0.0%) |
| Educational Services | 33 (25.4%) | 97 (74.6%) |
| Health Care & Social Assistance | 170 (73.6%) | 61 (26.4%) |
| Arts, Entertainment & Recreation | 0 (0.0%) | 0 (0.0%) |
| Accommodation & Food Services | 3 (1.1%) | 271 (98.9%) |
| Public Administration | 55 (69.6%) | 24 (30.4%) |
| Total | 653 (48.9%) | 682 (51.1%) |
Education in Weaverville
School Enrollment in Weaverville
The most common levels of schooling among the 834 students in Weaverville are elementary school (190 | 22.8%), college / undergraduate (184 | 22.1%), and middle school (168 | 20.1%).
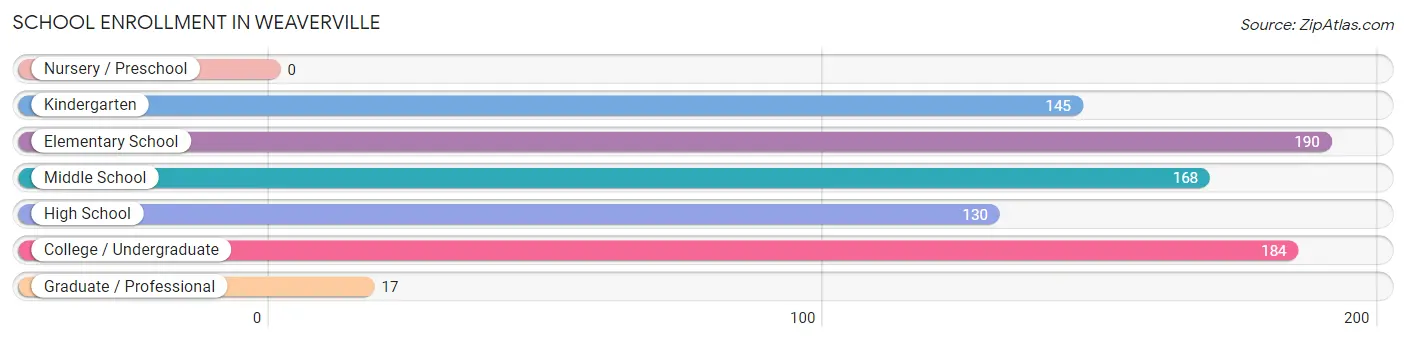
| School Level | # Students | % Students |
| Nursery / Preschool | 0 | 0.0% |
| Kindergarten | 145 | 17.4% |
| Elementary School | 190 | 22.8% |
| Middle School | 168 | 20.1% |
| High School | 130 | 15.6% |
| College / Undergraduate | 184 | 22.1% |
| Graduate / Professional | 17 | 2.0% |
| Total | 834 | 100.0% |
School Enrollment by Age by Funding Source in Weaverville
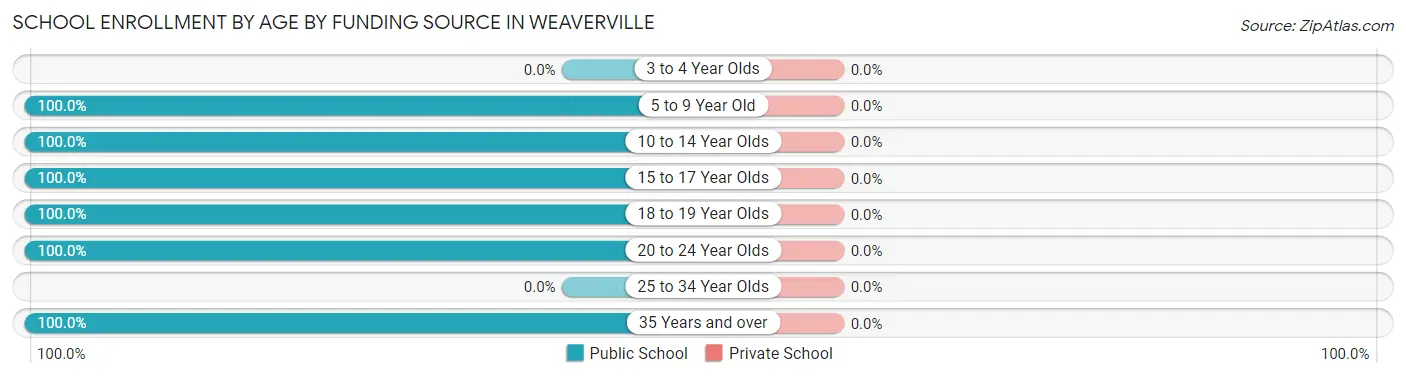
| Age Bracket | Public School | Private School |
| 3 to 4 Year Olds | 0 (0.0%) | 0 (0.0%) |
| 5 to 9 Year Old | 335 (100.0%) | 0 (0.0%) |
| 10 to 14 Year Olds | 216 (100.0%) | 0 (0.0%) |
| 15 to 17 Year Olds | 80 (100.0%) | 0 (0.0%) |
| 18 to 19 Year Olds | 101 (100.0%) | 0 (0.0%) |
| 20 to 24 Year Olds | 85 (100.0%) | 0 (0.0%) |
| 25 to 34 Year Olds | 0 (0.0%) | 0 (0.0%) |
| 35 Years and over | 17 (100.0%) | 0 (0.0%) |
| Total | 834 (100.0%) | 0 (0.0%) |
Educational Attainment by Field of Study in Weaverville
Education (174 | 24.0%), bio, nature & agricultural (168 | 23.2%), psychology (117 | 16.1%), social sciences (102 | 14.1%), and engineering (83 | 11.5%) are the most common fields of study among 725 individuals in Weaverville who have obtained a bachelor's degree or higher.
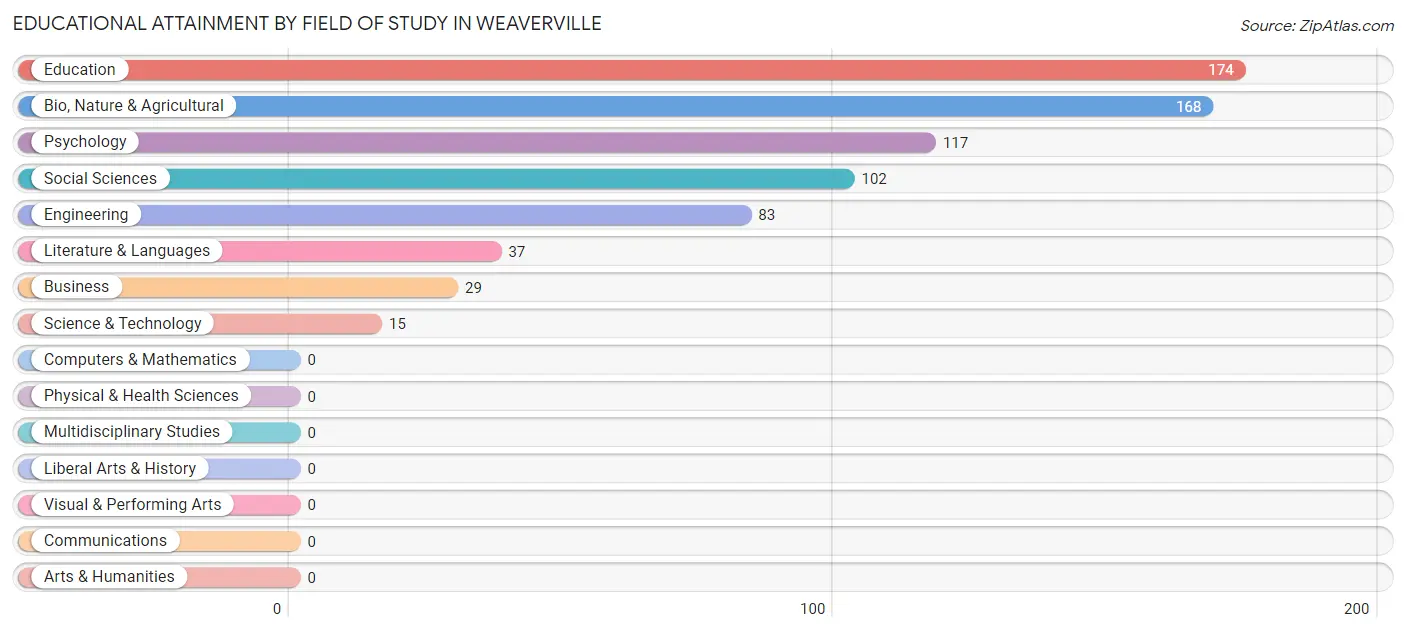
| Field of Study | # Graduates | % Graduates |
| Computers & Mathematics | 0 | 0.0% |
| Bio, Nature & Agricultural | 168 | 23.2% |
| Physical & Health Sciences | 0 | 0.0% |
| Psychology | 117 | 16.1% |
| Social Sciences | 102 | 14.1% |
| Engineering | 83 | 11.5% |
| Multidisciplinary Studies | 0 | 0.0% |
| Science & Technology | 15 | 2.1% |
| Business | 29 | 4.0% |
| Education | 174 | 24.0% |
| Literature & Languages | 37 | 5.1% |
| Liberal Arts & History | 0 | 0.0% |
| Visual & Performing Arts | 0 | 0.0% |
| Communications | 0 | 0.0% |
| Arts & Humanities | 0 | 0.0% |
| Total | 725 | 100.0% |
Transportation & Commute in Weaverville
Vehicle Availability by Sex in Weaverville
The most prevalent vehicle ownership categories in Weaverville are males with 2 vehicles (327, accounting for 49.3%) and females with 2 vehicles (422, making up 47.9%).
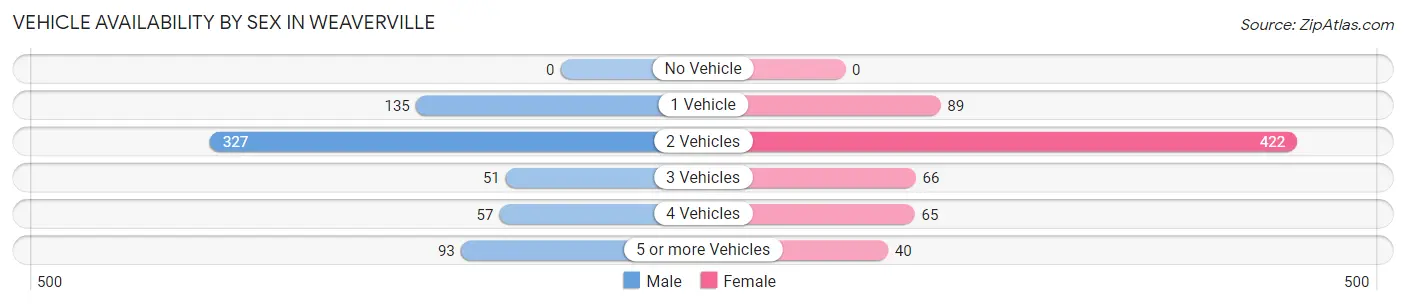
| Vehicles Available | Male | Female |
| No Vehicle | 0 (0.0%) | 0 (0.0%) |
| 1 Vehicle | 135 (20.4%) | 89 (13.1%) |
| 2 Vehicles | 327 (49.3%) | 422 (61.9%) |
| 3 Vehicles | 51 (7.7%) | 66 (9.7%) |
| 4 Vehicles | 57 (8.6%) | 65 (9.5%) |
| 5 or more Vehicles | 93 (14.0%) | 40 (5.9%) |
| Total | 663 (100.0%) | 682 (100.0%) |
Commute Time in Weaverville
The most frequently occuring commute durations in Weaverville are 15 to 19 minutes (360 commuters, 34.7%), 5 to 9 minutes (260 commuters, 25.1%), and 10 to 14 minutes (146 commuters, 14.1%).
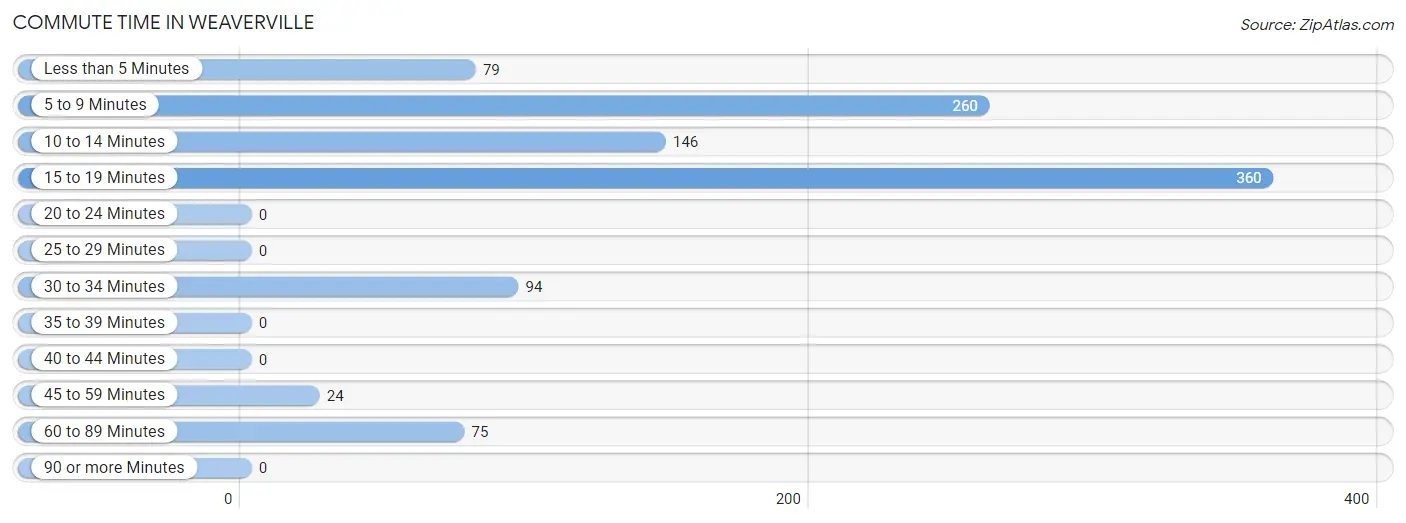
| Commute Time | # Commuters | % Commuters |
| Less than 5 Minutes | 79 | 7.6% |
| 5 to 9 Minutes | 260 | 25.1% |
| 10 to 14 Minutes | 146 | 14.1% |
| 15 to 19 Minutes | 360 | 34.7% |
| 20 to 24 Minutes | 0 | 0.0% |
| 25 to 29 Minutes | 0 | 0.0% |
| 30 to 34 Minutes | 94 | 9.1% |
| 35 to 39 Minutes | 0 | 0.0% |
| 40 to 44 Minutes | 0 | 0.0% |
| 45 to 59 Minutes | 24 | 2.3% |
| 60 to 89 Minutes | 75 | 7.2% |
| 90 or more Minutes | 0 | 0.0% |
Commute Time by Sex in Weaverville
The most common commute times in Weaverville are 15 to 19 minutes (274 commuters, 45.0%) for males and 30 to 34 minutes (94 commuters, 21.9%) for females.
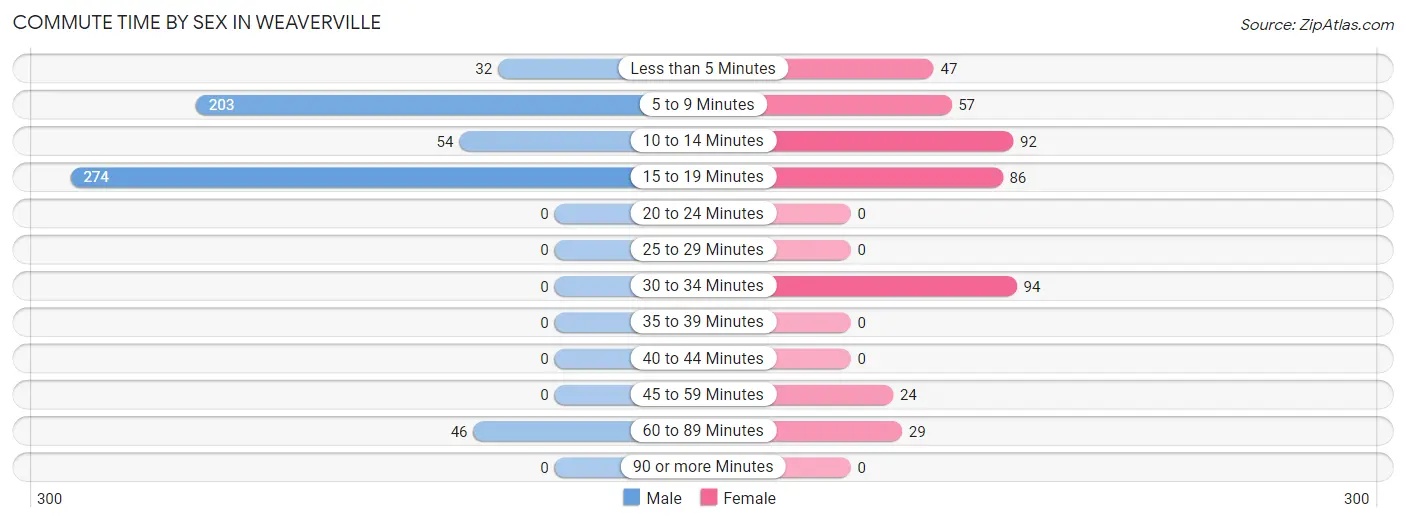
| Commute Time | Male | Female |
| Less than 5 Minutes | 32 (5.2%) | 47 (11.0%) |
| 5 to 9 Minutes | 203 (33.3%) | 57 (13.3%) |
| 10 to 14 Minutes | 54 (8.9%) | 92 (21.4%) |
| 15 to 19 Minutes | 274 (45.0%) | 86 (20.1%) |
| 20 to 24 Minutes | 0 (0.0%) | 0 (0.0%) |
| 25 to 29 Minutes | 0 (0.0%) | 0 (0.0%) |
| 30 to 34 Minutes | 0 (0.0%) | 94 (21.9%) |
| 35 to 39 Minutes | 0 (0.0%) | 0 (0.0%) |
| 40 to 44 Minutes | 0 (0.0%) | 0 (0.0%) |
| 45 to 59 Minutes | 0 (0.0%) | 24 (5.6%) |
| 60 to 89 Minutes | 46 (7.5%) | 29 (6.8%) |
| 90 or more Minutes | 0 (0.0%) | 0 (0.0%) |
Time of Departure to Work by Sex in Weaverville
The most frequent times of departure to work in Weaverville are 8:00 AM to 8:29 AM (129, 21.2%) for males and 7:00 AM to 7:29 AM (168, 39.2%) for females.
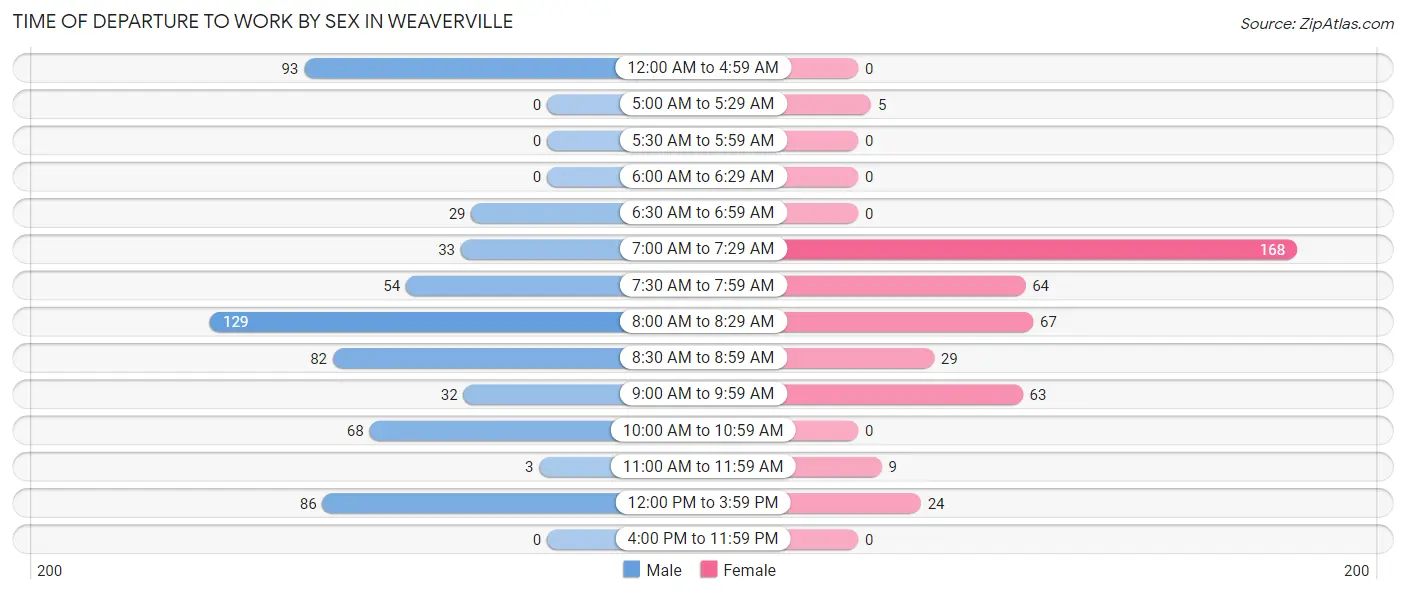
| Time of Departure | Male | Female |
| 12:00 AM to 4:59 AM | 93 (15.3%) | 0 (0.0%) |
| 5:00 AM to 5:29 AM | 0 (0.0%) | 5 (1.2%) |
| 5:30 AM to 5:59 AM | 0 (0.0%) | 0 (0.0%) |
| 6:00 AM to 6:29 AM | 0 (0.0%) | 0 (0.0%) |
| 6:30 AM to 6:59 AM | 29 (4.8%) | 0 (0.0%) |
| 7:00 AM to 7:29 AM | 33 (5.4%) | 168 (39.2%) |
| 7:30 AM to 7:59 AM | 54 (8.9%) | 64 (14.9%) |
| 8:00 AM to 8:29 AM | 129 (21.2%) | 67 (15.6%) |
| 8:30 AM to 8:59 AM | 82 (13.5%) | 29 (6.8%) |
| 9:00 AM to 9:59 AM | 32 (5.2%) | 63 (14.7%) |
| 10:00 AM to 10:59 AM | 68 (11.2%) | 0 (0.0%) |
| 11:00 AM to 11:59 AM | 3 (0.5%) | 9 (2.1%) |
| 12:00 PM to 3:59 PM | 86 (14.1%) | 24 (5.6%) |
| 4:00 PM to 11:59 PM | 0 (0.0%) | 0 (0.0%) |
| Total | 609 (100.0%) | 429 (100.0%) |
Housing Occupancy in Weaverville
Occupancy by Ownership in Weaverville
Of the total 1,481 dwellings in Weaverville, owner-occupied units account for 1,053 (71.1%), while renter-occupied units make up 428 (28.9%).
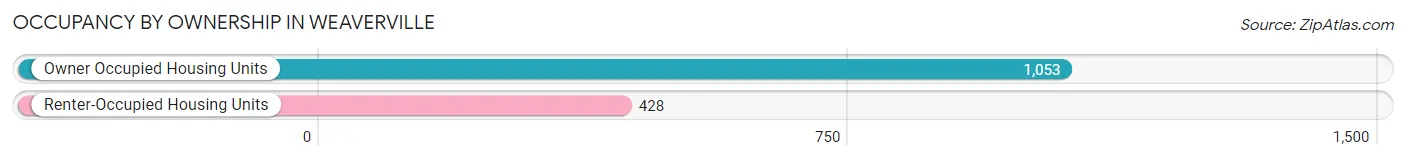
| Occupancy | # Housing Units | % Housing Units |
| Owner Occupied Housing Units | 1,053 | 71.1% |
| Renter-Occupied Housing Units | 428 | 28.9% |
| Total Occupied Housing Units | 1,481 | 100.0% |
Occupancy by Household Size in Weaverville
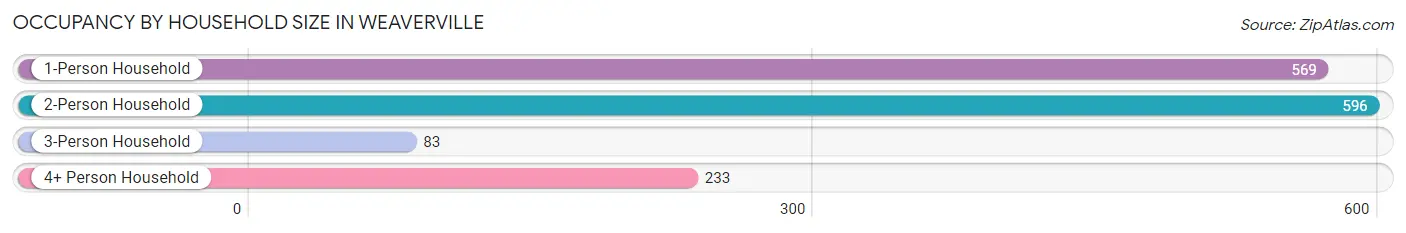
| Household Size | # Housing Units | % Housing Units |
| 1-Person Household | 569 | 38.4% |
| 2-Person Household | 596 | 40.2% |
| 3-Person Household | 83 | 5.6% |
| 4+ Person Household | 233 | 15.7% |
| Total Housing Units | 1,481 | 100.0% |
Occupancy by Ownership by Household Size in Weaverville
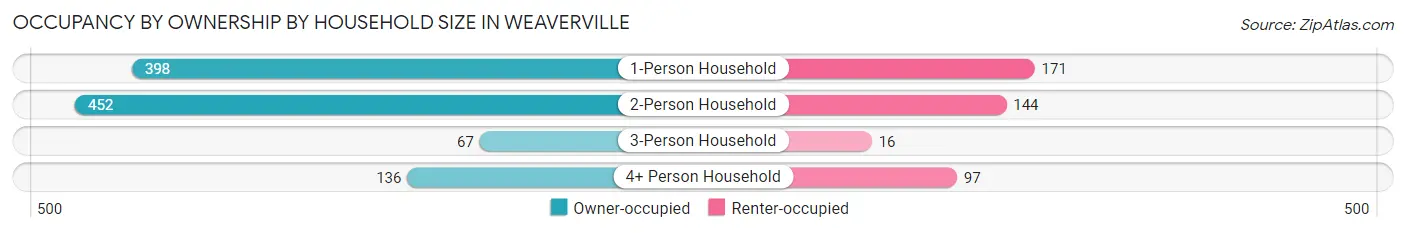
| Household Size | Owner-occupied | Renter-occupied |
| 1-Person Household | 398 (70.0%) | 171 (30.0%) |
| 2-Person Household | 452 (75.8%) | 144 (24.2%) |
| 3-Person Household | 67 (80.7%) | 16 (19.3%) |
| 4+ Person Household | 136 (58.4%) | 97 (41.6%) |
| Total Housing Units | 1,053 (71.1%) | 428 (28.9%) |
Occupancy by Educational Attainment in Weaverville
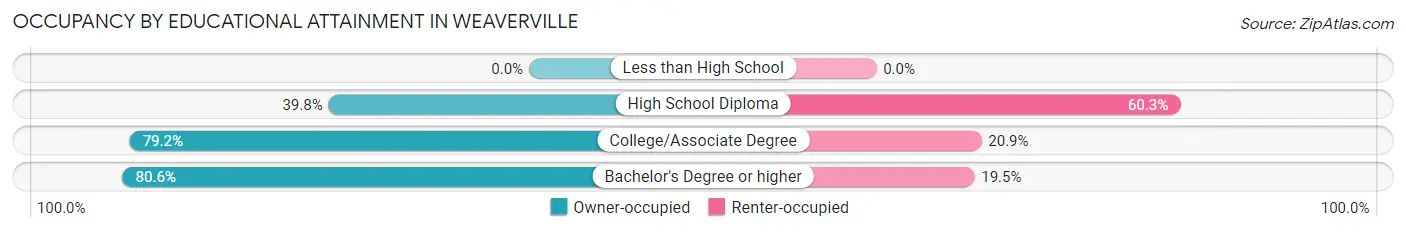
| Household Size | Owner-occupied | Renter-occupied |
| Less than High School | 0 (0.0%) | 0 (0.0%) |
| High School Diploma | 128 (39.8%) | 194 (60.3%) |
| College/Associate Degree | 482 (79.1%) | 127 (20.8%) |
| Bachelor's Degree or higher | 443 (80.5%) | 107 (19.5%) |
Occupancy by Age of Householder in Weaverville
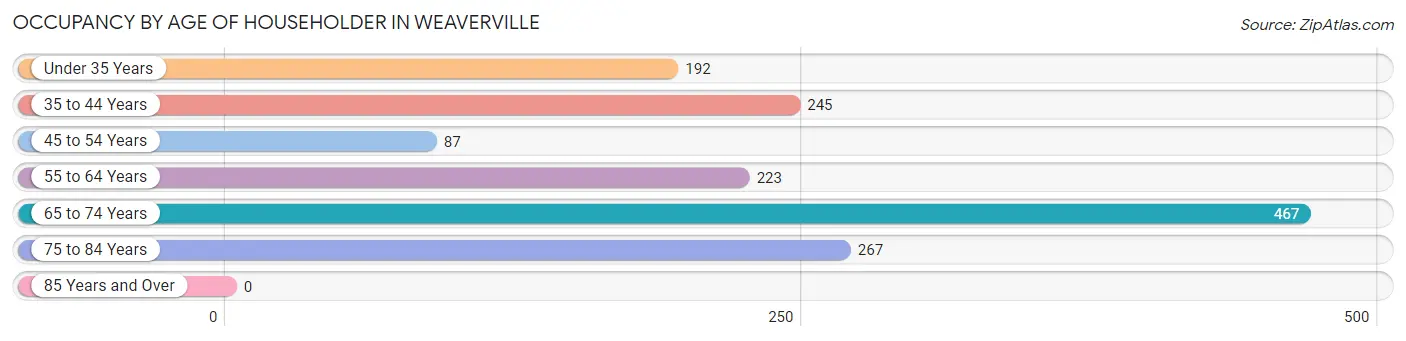
| Age Bracket | # Households | % Households |
| Under 35 Years | 192 | 13.0% |
| 35 to 44 Years | 245 | 16.5% |
| 45 to 54 Years | 87 | 5.9% |
| 55 to 64 Years | 223 | 15.1% |
| 65 to 74 Years | 467 | 31.5% |
| 75 to 84 Years | 267 | 18.0% |
| 85 Years and Over | 0 | 0.0% |
| Total | 1,481 | 100.0% |
Housing Finances in Weaverville
Median Income by Occupancy in Weaverville
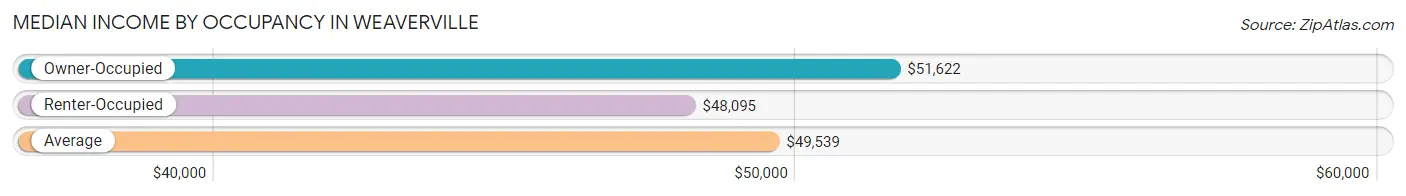
| Occupancy Type | # Households | Median Income |
| Owner-Occupied | 1,053 (71.1%) | $51,622 |
| Renter-Occupied | 428 (28.9%) | $48,095 |
| Average | 1,481 (100.0%) | $49,539 |
Occupancy by Householder Income Bracket in Weaverville
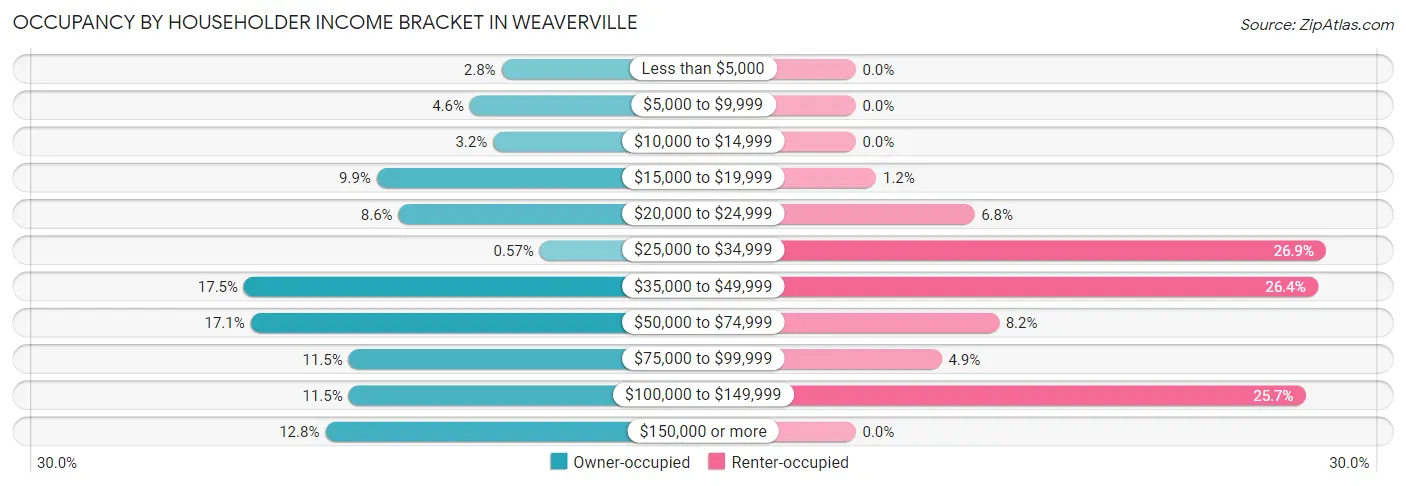
| Income Bracket | Owner-occupied | Renter-occupied |
| Less than $5,000 | 29 (2.8%) | 0 (0.0%) |
| $5,000 to $9,999 | 48 (4.6%) | 0 (0.0%) |
| $10,000 to $14,999 | 34 (3.2%) | 0 (0.0%) |
| $15,000 to $19,999 | 104 (9.9%) | 5 (1.2%) |
| $20,000 to $24,999 | 91 (8.6%) | 29 (6.8%) |
| $25,000 to $34,999 | 6 (0.6%) | 115 (26.9%) |
| $35,000 to $49,999 | 184 (17.5%) | 113 (26.4%) |
| $50,000 to $74,999 | 180 (17.1%) | 35 (8.2%) |
| $75,000 to $99,999 | 121 (11.5%) | 21 (4.9%) |
| $100,000 to $149,999 | 121 (11.5%) | 110 (25.7%) |
| $150,000 or more | 135 (12.8%) | 0 (0.0%) |
| Total | 1,053 (100.0%) | 428 (100.0%) |
Monthly Housing Cost Tiers in Weaverville
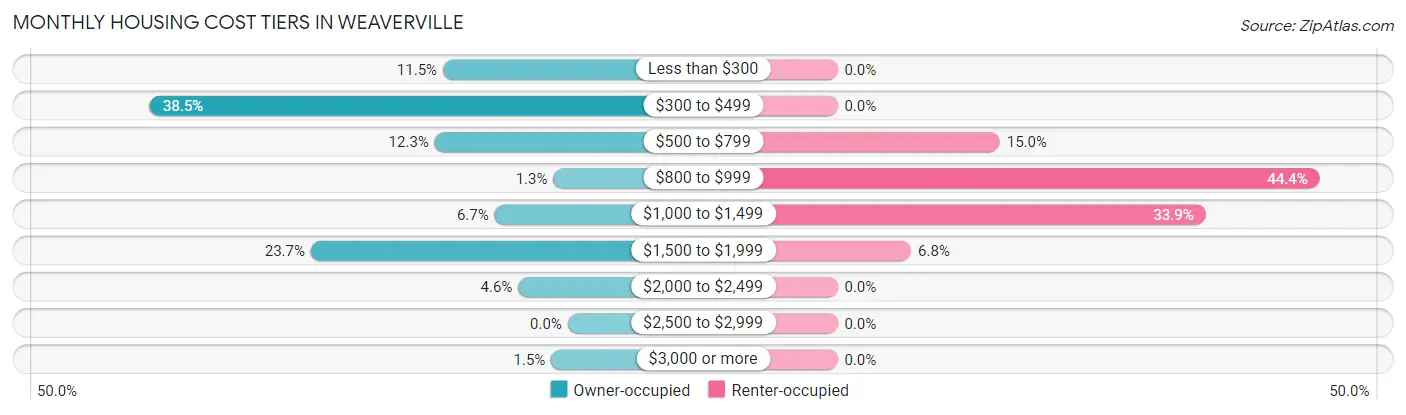
| Monthly Cost | Owner-occupied | Renter-occupied |
| Less than $300 | 121 (11.5%) | 0 (0.0%) |
| $300 to $499 | 405 (38.5%) | 0 (0.0%) |
| $500 to $799 | 129 (12.2%) | 64 (14.9%) |
| $800 to $999 | 14 (1.3%) | 190 (44.4%) |
| $1,000 to $1,499 | 71 (6.7%) | 145 (33.9%) |
| $1,500 to $1,999 | 249 (23.6%) | 29 (6.8%) |
| $2,000 to $2,499 | 48 (4.6%) | 0 (0.0%) |
| $2,500 to $2,999 | 0 (0.0%) | 0 (0.0%) |
| $3,000 or more | 16 (1.5%) | 0 (0.0%) |
| Total | 1,053 (100.0%) | 428 (100.0%) |
Physical Housing Characteristics in Weaverville
Housing Structures in Weaverville
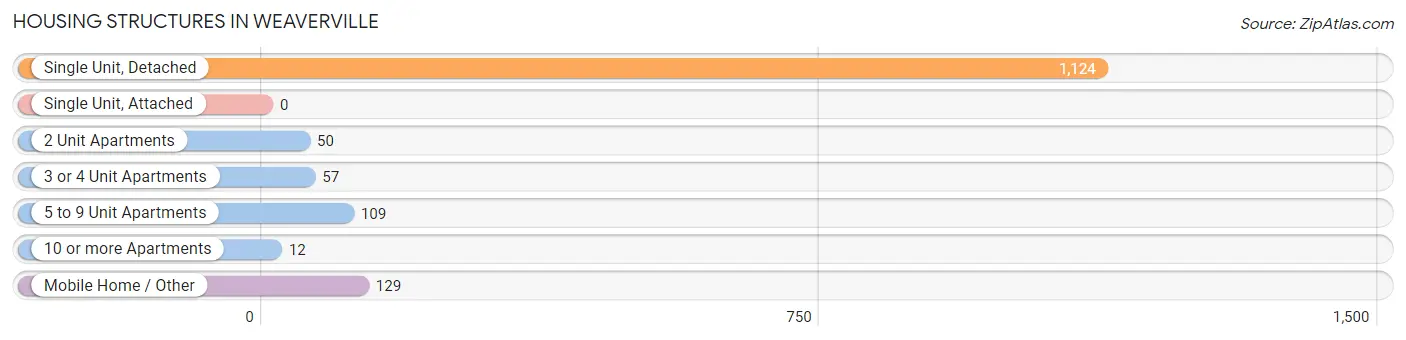
| Structure Type | # Housing Units | % Housing Units |
| Single Unit, Detached | 1,124 | 75.9% |
| Single Unit, Attached | 0 | 0.0% |
| 2 Unit Apartments | 50 | 3.4% |
| 3 or 4 Unit Apartments | 57 | 3.8% |
| 5 to 9 Unit Apartments | 109 | 7.4% |
| 10 or more Apartments | 12 | 0.8% |
| Mobile Home / Other | 129 | 8.7% |
| Total | 1,481 | 100.0% |
Housing Structures by Occupancy in Weaverville
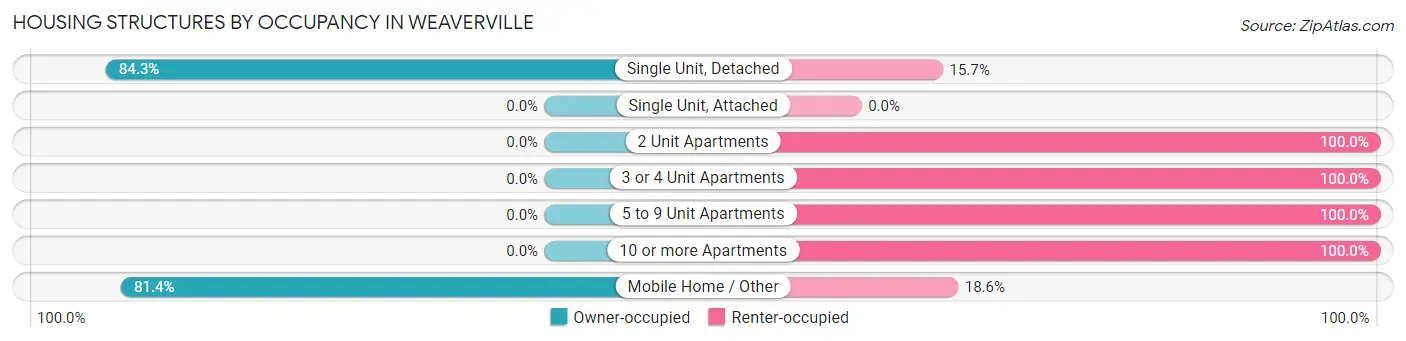
| Structure Type | Owner-occupied | Renter-occupied |
| Single Unit, Detached | 948 (84.3%) | 176 (15.7%) |
| Single Unit, Attached | 0 (0.0%) | 0 (0.0%) |
| 2 Unit Apartments | 0 (0.0%) | 50 (100.0%) |
| 3 or 4 Unit Apartments | 0 (0.0%) | 57 (100.0%) |
| 5 to 9 Unit Apartments | 0 (0.0%) | 109 (100.0%) |
| 10 or more Apartments | 0 (0.0%) | 12 (100.0%) |
| Mobile Home / Other | 105 (81.4%) | 24 (18.6%) |
| Total | 1,053 (71.1%) | 428 (28.9%) |
Housing Structures by Number of Rooms in Weaverville
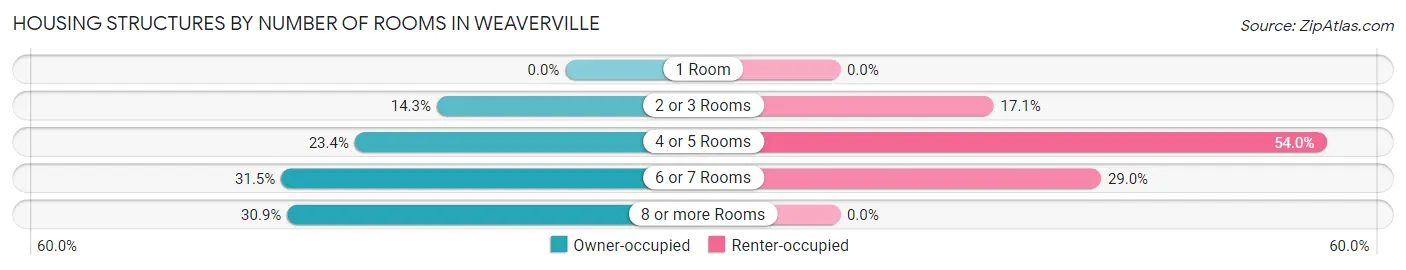
| Number of Rooms | Owner-occupied | Renter-occupied |
| 1 Room | 0 (0.0%) | 0 (0.0%) |
| 2 or 3 Rooms | 150 (14.2%) | 73 (17.1%) |
| 4 or 5 Rooms | 246 (23.4%) | 231 (54.0%) |
| 6 or 7 Rooms | 332 (31.5%) | 124 (29.0%) |
| 8 or more Rooms | 325 (30.9%) | 0 (0.0%) |
| Total | 1,053 (100.0%) | 428 (100.0%) |
Housing Structure by Heating Type in Weaverville
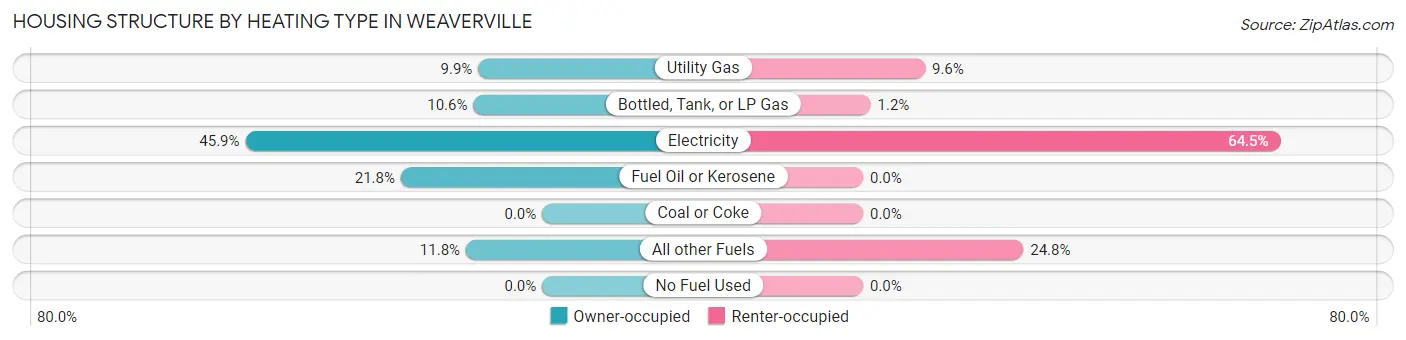
| Heating Type | Owner-occupied | Renter-occupied |
| Utility Gas | 104 (9.9%) | 41 (9.6%) |
| Bottled, Tank, or LP Gas | 112 (10.6%) | 5 (1.2%) |
| Electricity | 483 (45.9%) | 276 (64.5%) |
| Fuel Oil or Kerosene | 230 (21.8%) | 0 (0.0%) |
| Coal or Coke | 0 (0.0%) | 0 (0.0%) |
| All other Fuels | 124 (11.8%) | 106 (24.8%) |
| No Fuel Used | 0 (0.0%) | 0 (0.0%) |
| Total | 1,053 (100.0%) | 428 (100.0%) |
Household Vehicle Usage in Weaverville
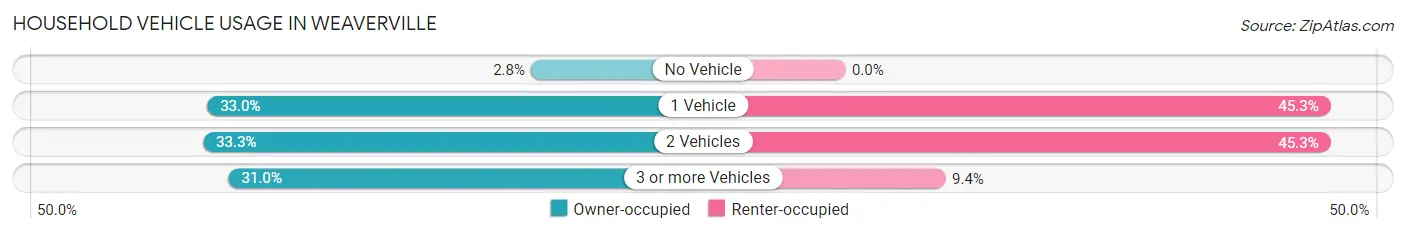
| Vehicles per Household | Owner-occupied | Renter-occupied |
| No Vehicle | 29 (2.8%) | 0 (0.0%) |
| 1 Vehicle | 347 (33.0%) | 194 (45.3%) |
| 2 Vehicles | 351 (33.3%) | 194 (45.3%) |
| 3 or more Vehicles | 326 (31.0%) | 40 (9.3%) |
| Total | 1,053 (100.0%) | 428 (100.0%) |
Real Estate & Mortgages in Weaverville
Real Estate and Mortgage Overview in Weaverville
| Characteristic | Without Mortgage | With Mortgage |
| Housing Units | 621 | 432 |
| Median Property Value | $286,100 | $353,100 |
| Median Household Income | $39,435 | $135 |
| Monthly Housing Costs | $396 | $16 |
| Real Estate Taxes | $1,336 | $34 |
Property Value by Mortgage Status in Weaverville
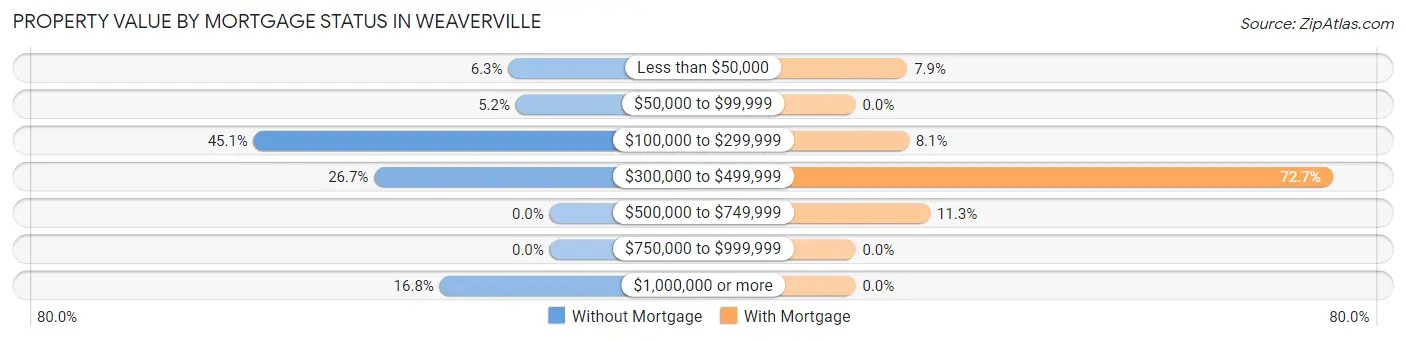
| Property Value | Without Mortgage | With Mortgage |
| Less than $50,000 | 39 (6.3%) | 34 (7.9%) |
| $50,000 to $99,999 | 32 (5.1%) | 0 (0.0%) |
| $100,000 to $299,999 | 280 (45.1%) | 35 (8.1%) |
| $300,000 to $499,999 | 166 (26.7%) | 314 (72.7%) |
| $500,000 to $749,999 | 0 (0.0%) | 49 (11.3%) |
| $750,000 to $999,999 | 0 (0.0%) | 0 (0.0%) |
| $1,000,000 or more | 104 (16.8%) | 0 (0.0%) |
| Total | 621 (100.0%) | 432 (100.0%) |
Household Income by Mortgage Status in Weaverville
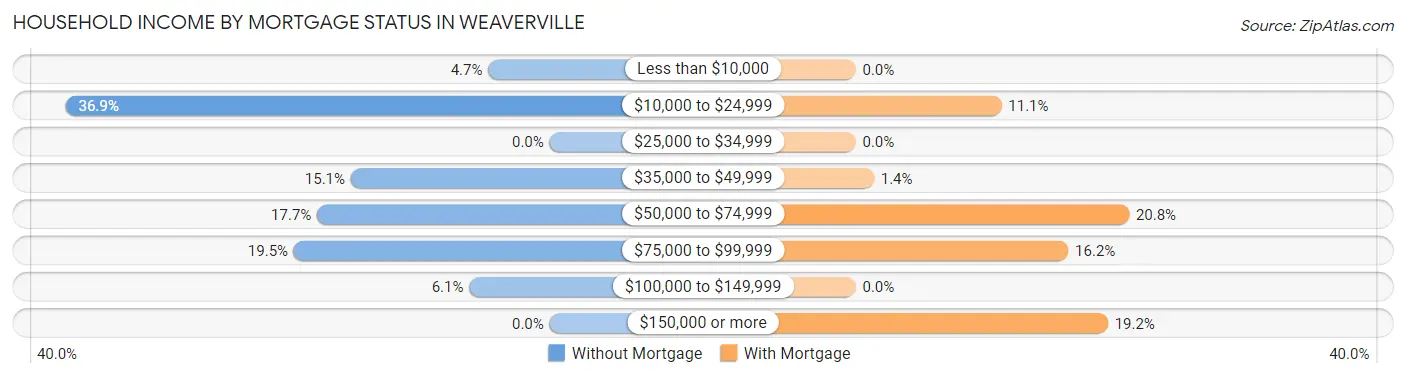
| Household Income | Without Mortgage | With Mortgage |
| Less than $10,000 | 29 (4.7%) | 0 (0.0%) |
| $10,000 to $24,999 | 229 (36.9%) | 48 (11.1%) |
| $25,000 to $34,999 | 0 (0.0%) | 0 (0.0%) |
| $35,000 to $49,999 | 94 (15.1%) | 6 (1.4%) |
| $50,000 to $74,999 | 110 (17.7%) | 90 (20.8%) |
| $75,000 to $99,999 | 121 (19.5%) | 70 (16.2%) |
| $100,000 to $149,999 | 38 (6.1%) | 0 (0.0%) |
| $150,000 or more | 0 (0.0%) | 83 (19.2%) |
| Total | 621 (100.0%) | 432 (100.0%) |
Property Value to Household Income Ratio in Weaverville
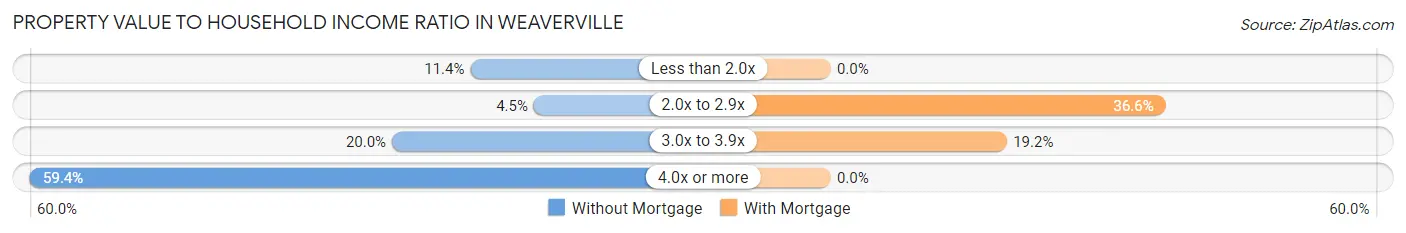
| Value-to-Income Ratio | Without Mortgage | With Mortgage |
| Less than 2.0x | 71 (11.4%) | 0 (0.0%) |
| 2.0x to 2.9x | 28 (4.5%) | 158 (36.6%) |
| 3.0x to 3.9x | 124 (20.0%) | 83 (19.2%) |
| 4.0x or more | 369 (59.4%) | 0 (0.0%) |
| Total | 621 (100.0%) | 432 (100.0%) |
Real Estate Taxes by Mortgage Status in Weaverville
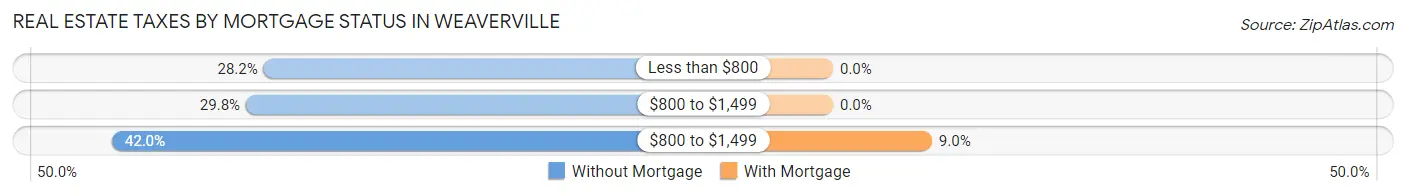
| Property Taxes | Without Mortgage | With Mortgage |
| Less than $800 | 175 (28.2%) | 0 (0.0%) |
| $800 to $1,499 | 185 (29.8%) | 0 (0.0%) |
| $800 to $1,499 | 261 (42.0%) | 39 (9.0%) |
| Total | 621 (100.0%) | 432 (100.0%) |
Health & Disability in Weaverville
Health Insurance Coverage by Age in Weaverville
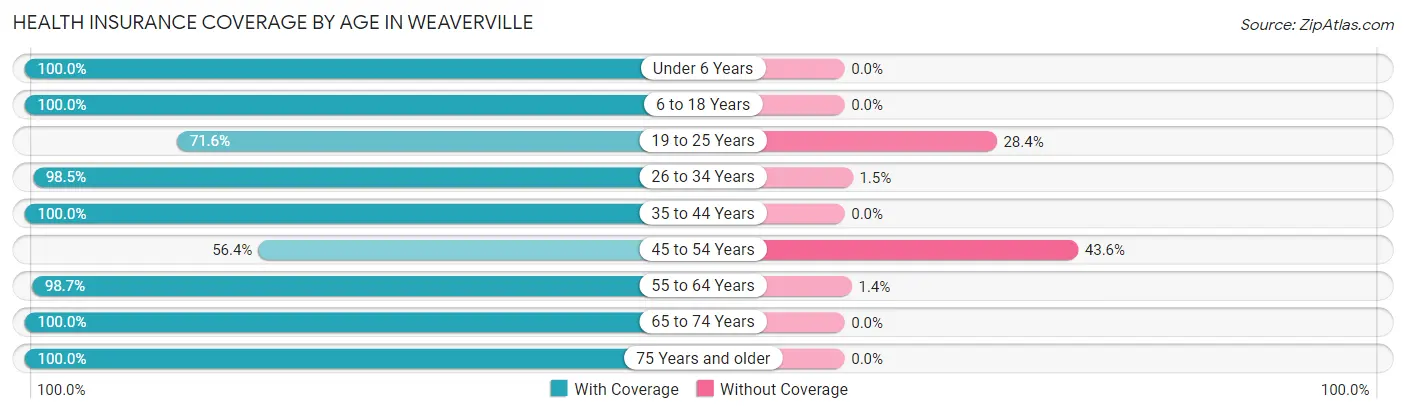
| Age Bracket | With Coverage | Without Coverage |
| Under 6 Years | 105 (100.0%) | 0 (0.0%) |
| 6 to 18 Years | 628 (100.0%) | 0 (0.0%) |
| 19 to 25 Years | 164 (71.6%) | 65 (28.4%) |
| 26 to 34 Years | 323 (98.5%) | 5 (1.5%) |
| 35 to 44 Years | 573 (100.0%) | 0 (0.0%) |
| 45 to 54 Years | 92 (56.4%) | 71 (43.6%) |
| 55 to 64 Years | 437 (98.7%) | 6 (1.3%) |
| 65 to 74 Years | 693 (100.0%) | 0 (0.0%) |
| 75 Years and older | 342 (100.0%) | 0 (0.0%) |
| Total | 3,357 (95.8%) | 147 (4.2%) |
Health Insurance Coverage by Citizenship Status in Weaverville
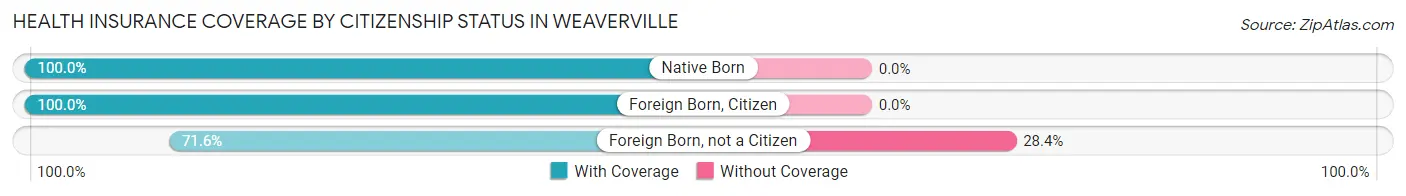
| Citizenship Status | With Coverage | Without Coverage |
| Native Born | 105 (100.0%) | 0 (0.0%) |
| Foreign Born, Citizen | 628 (100.0%) | 0 (0.0%) |
| Foreign Born, not a Citizen | 164 (71.6%) | 65 (28.4%) |
Health Insurance Coverage by Household Income in Weaverville
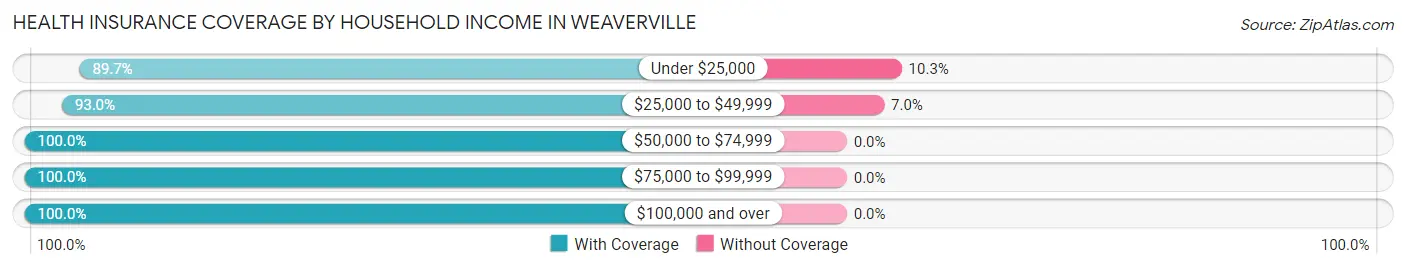
| Household Income | With Coverage | Without Coverage |
| Under $25,000 | 611 (89.7%) | 70 (10.3%) |
| $25,000 to $49,999 | 1,025 (93.0%) | 77 (7.0%) |
| $50,000 to $74,999 | 360 (100.0%) | 0 (0.0%) |
| $75,000 to $99,999 | 276 (100.0%) | 0 (0.0%) |
| $100,000 and over | 1,067 (100.0%) | 0 (0.0%) |
Public vs Private Health Insurance Coverage by Age in Weaverville
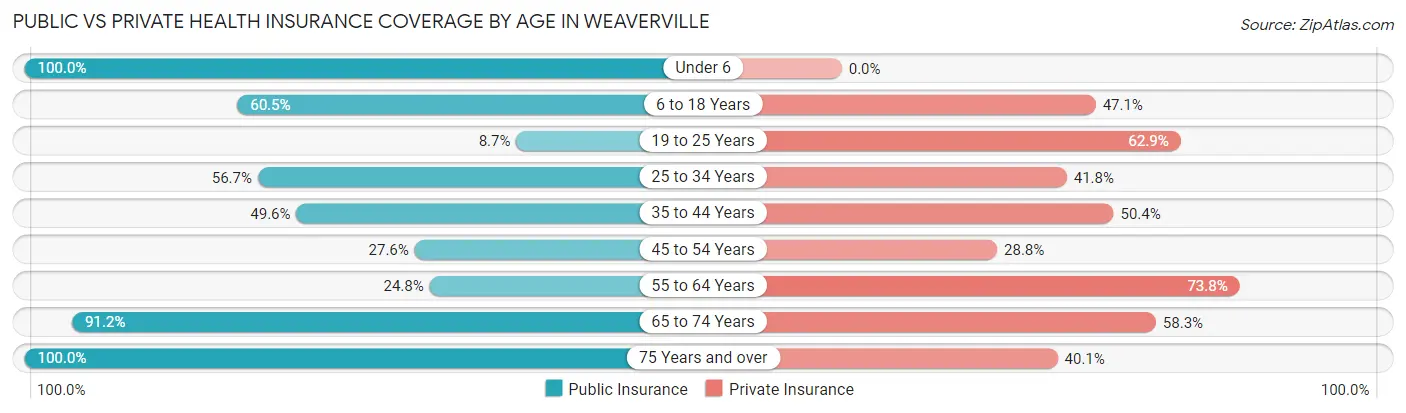
| Age Bracket | Public Insurance | Private Insurance |
| Under 6 | 105 (100.0%) | 0 (0.0%) |
| 6 to 18 Years | 380 (60.5%) | 296 (47.1%) |
| 19 to 25 Years | 20 (8.7%) | 144 (62.9%) |
| 25 to 34 Years | 186 (56.7%) | 137 (41.8%) |
| 35 to 44 Years | 284 (49.6%) | 289 (50.4%) |
| 45 to 54 Years | 45 (27.6%) | 47 (28.8%) |
| 55 to 64 Years | 110 (24.8%) | 327 (73.8%) |
| 65 to 74 Years | 632 (91.2%) | 404 (58.3%) |
| 75 Years and over | 342 (100.0%) | 137 (40.1%) |
| Total | 2,104 (60.1%) | 1,781 (50.8%) |
Disability Status by Sex by Age in Weaverville
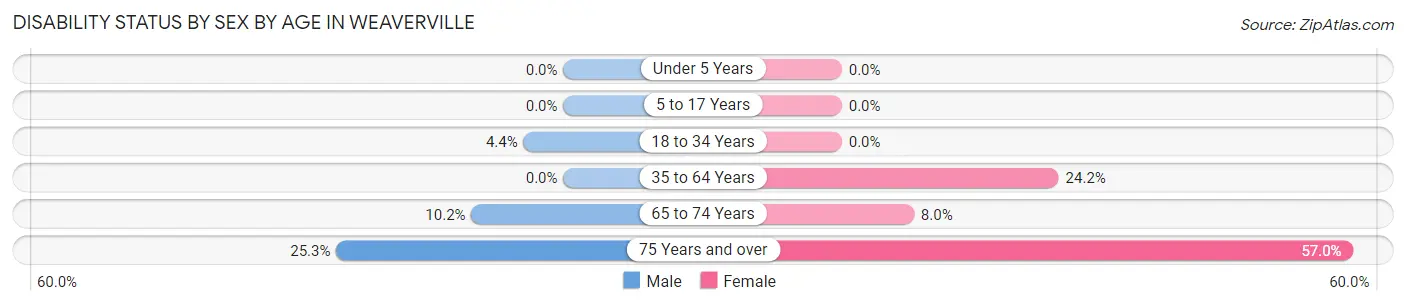
| Age Bracket | Male | Female |
| Under 5 Years | 0 (0.0%) | 0 (0.0%) |
| 5 to 17 Years | 0 (0.0%) | 0 (0.0%) |
| 18 to 34 Years | 14 (4.4%) | 0 (0.0%) |
| 35 to 64 Years | 0 (0.0%) | 163 (24.1%) |
| 65 to 74 Years | 34 (10.2%) | 29 (8.0%) |
| 75 Years and over | 43 (25.3%) | 98 (57.0%) |
Disability Class by Sex by Age in Weaverville
Disability Class: Hearing Difficulty
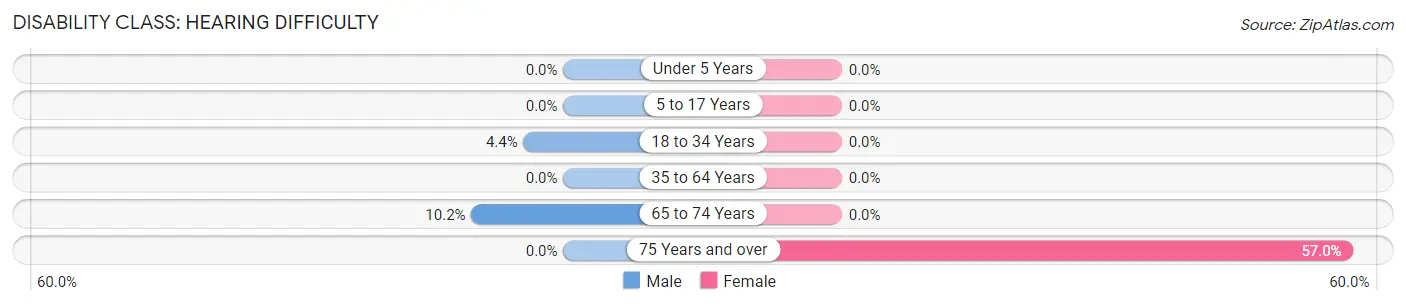
| Age Bracket | Male | Female |
| Under 5 Years | 0 (0.0%) | 0 (0.0%) |
| 5 to 17 Years | 0 (0.0%) | 0 (0.0%) |
| 18 to 34 Years | 14 (4.4%) | 0 (0.0%) |
| 35 to 64 Years | 0 (0.0%) | 0 (0.0%) |
| 65 to 74 Years | 34 (10.2%) | 0 (0.0%) |
| 75 Years and over | 0 (0.0%) | 98 (57.0%) |
Disability Class: Vision Difficulty
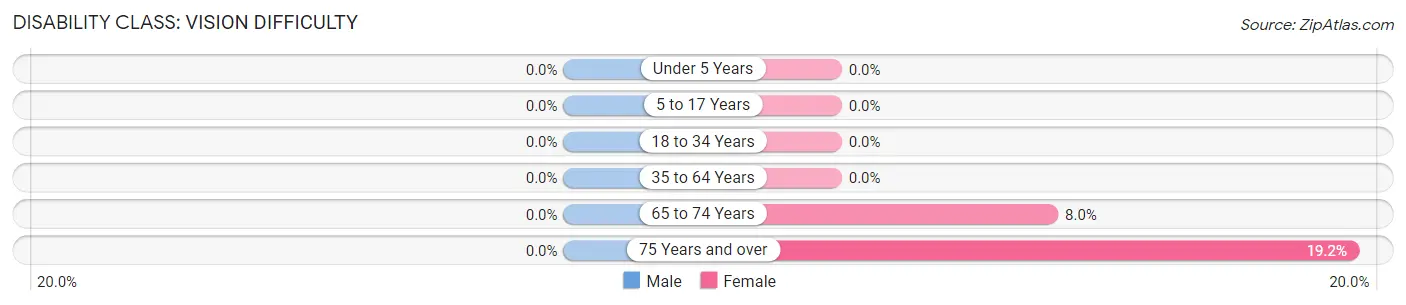
| Age Bracket | Male | Female |
| Under 5 Years | 0 (0.0%) | 0 (0.0%) |
| 5 to 17 Years | 0 (0.0%) | 0 (0.0%) |
| 18 to 34 Years | 0 (0.0%) | 0 (0.0%) |
| 35 to 64 Years | 0 (0.0%) | 0 (0.0%) |
| 65 to 74 Years | 0 (0.0%) | 29 (8.0%) |
| 75 Years and over | 0 (0.0%) | 33 (19.2%) |
Disability Class: Cognitive Difficulty
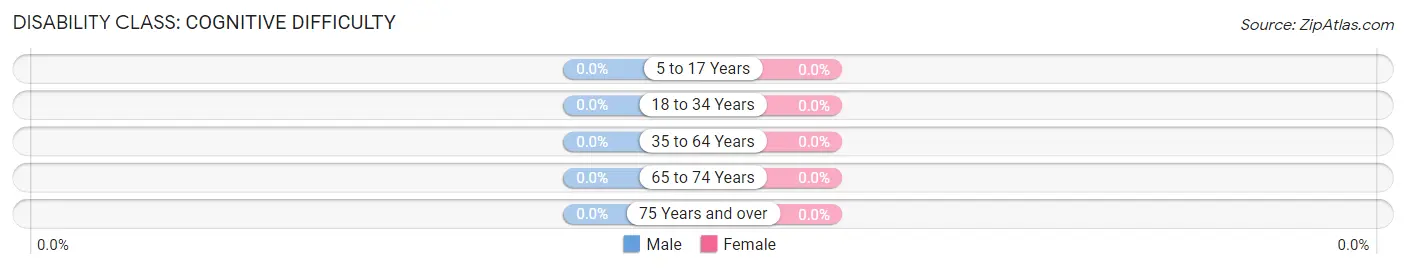
| Age Bracket | Male | Female |
| 5 to 17 Years | 0 (0.0%) | 0 (0.0%) |
| 18 to 34 Years | 0 (0.0%) | 0 (0.0%) |
| 35 to 64 Years | 0 (0.0%) | 0 (0.0%) |
| 65 to 74 Years | 0 (0.0%) | 0 (0.0%) |
| 75 Years and over | 0 (0.0%) | 0 (0.0%) |
Disability Class: Ambulatory Difficulty
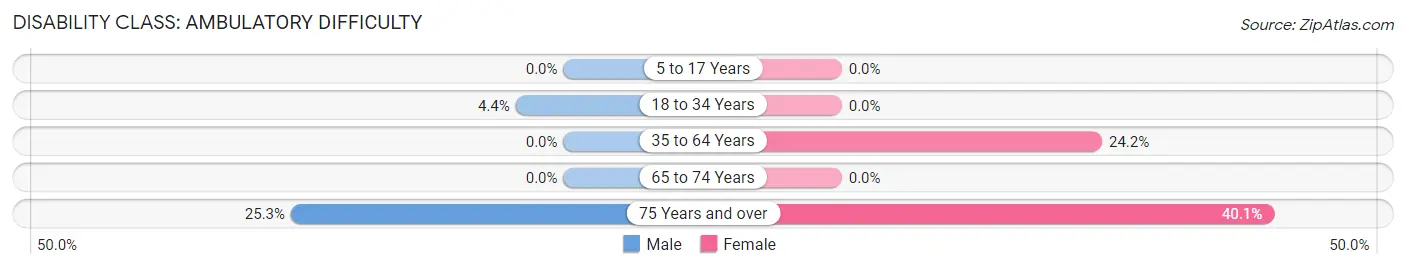
| Age Bracket | Male | Female |
| 5 to 17 Years | 0 (0.0%) | 0 (0.0%) |
| 18 to 34 Years | 14 (4.4%) | 0 (0.0%) |
| 35 to 64 Years | 0 (0.0%) | 163 (24.1%) |
| 65 to 74 Years | 0 (0.0%) | 0 (0.0%) |
| 75 Years and over | 43 (25.3%) | 69 (40.1%) |
Disability Class: Self-Care Difficulty
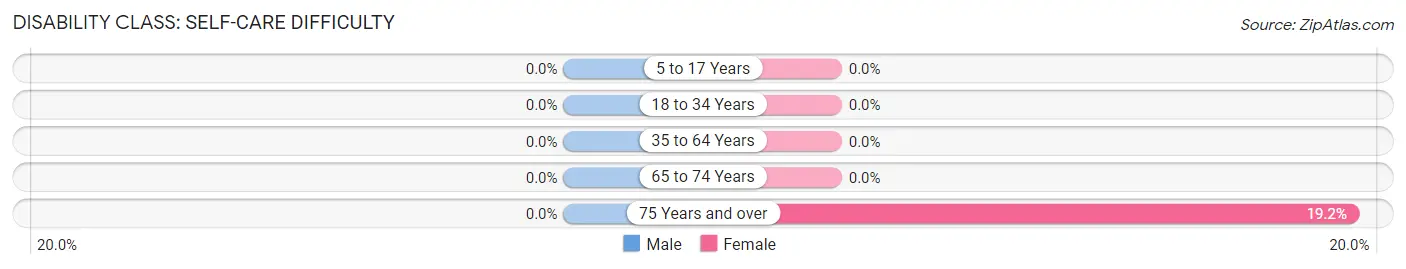
| Age Bracket | Male | Female |
| 5 to 17 Years | 0 (0.0%) | 0 (0.0%) |
| 18 to 34 Years | 0 (0.0%) | 0 (0.0%) |
| 35 to 64 Years | 0 (0.0%) | 0 (0.0%) |
| 65 to 74 Years | 0 (0.0%) | 0 (0.0%) |
| 75 Years and over | 0 (0.0%) | 33 (19.2%) |
Technology Access in Weaverville
Computing Device Access in Weaverville
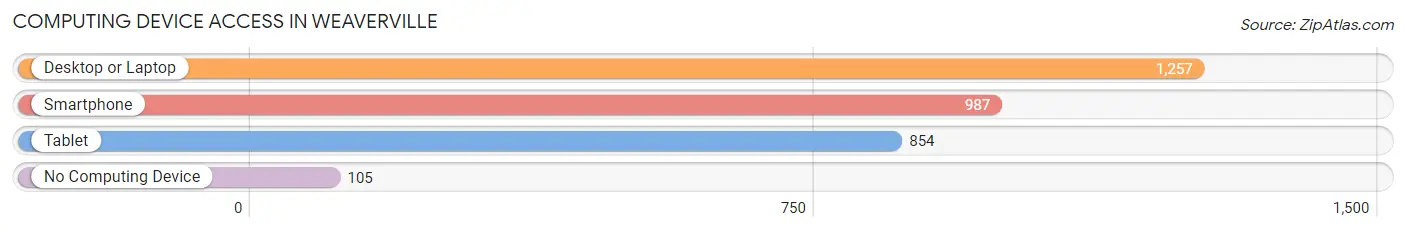
| Device Type | # Households | % Households |
| Desktop or Laptop | 1,257 | 84.9% |
| Smartphone | 987 | 66.6% |
| Tablet | 854 | 57.7% |
| No Computing Device | 105 | 7.1% |
| Total | 1,481 | 100.0% |
Internet Access in Weaverville
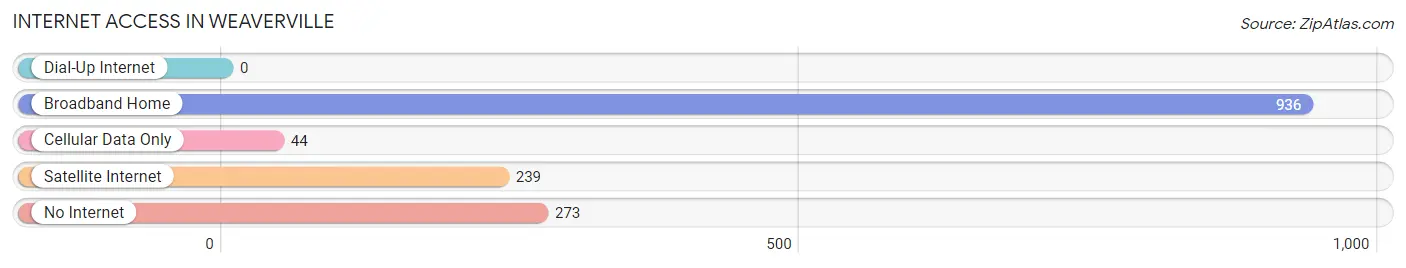
| Internet Type | # Households | % Households |
| Dial-Up Internet | 0 | 0.0% |
| Broadband Home | 936 | 63.2% |
| Cellular Data Only | 44 | 3.0% |
| Satellite Internet | 239 | 16.1% |
| No Internet | 273 | 18.4% |
| Total | 1,481 | 100.0% |
Weaverville Summary
Weaverville is a small town located in Trinity County, California, United States. It is situated in the Trinity Alps of the Salmon Mountains, about 30 miles west of Redding. The population was 3,600 at the 2010 census, up from 3,554 at the 2000 census. Weaverville is known for its historic downtown, which features many 19th century buildings, including the Weaverville Drug Store, the oldest continuously operating drug store in California.
History
Weaverville was founded in 1849 by German immigrant and gold miner, John Weaver. He established a trading post and a hotel, which became a popular stop for miners and travelers. The town was officially incorporated in 1854, and by 1860, it had a population of over 1,000.
In the late 19th century, Weaverville was a major center for logging and lumber production. The town was also home to several gold mines, including the Weaverville Mine, which operated until the early 20th century.
Geography
Weaverville is located at 40°44'25"N 122°56'45"W (40.740278, -122.945833). According to the United States Census Bureau, the town has a total area of 1.3 square miles (3.4 km2), all of it land.
The town is situated in the Trinity Alps of the Salmon Mountains, about 30 miles west of Redding. It is surrounded by the Trinity National Forest and is located at the confluence of the Trinity and Weaver rivers.
Economy
Weaverville's economy is largely based on tourism and the timber industry. The town is home to several tourist attractions, including the Weaverville Joss House State Historic Park, which is the oldest Chinese temple in California. The town also has several restaurants, shops, and galleries.
The timber industry is a major employer in Weaverville. The town is home to several lumber mills, including the Weaverville Lumber Company, which produces lumber for the construction industry.
Demographics
As of the 2010 census, Weaverville had a population of 3,600. The racial makeup of the town was 87.3% White, 0.7% African American, 1.2% Native American, 0.7% Asian, 0.1% Pacific Islander, 6.2% from other races, and 3.9% from two or more races. Hispanic or Latino of any race were 11.2% of the population.
The median income for a household in Weaverville was $37,917, and the median income for a family was $45,625. Males had a median income of $35,938 versus $25,938 for females. The per capita income for the town was $19,945. About 11.2% of families and 14.2% of the population were below the poverty line, including 18.2% of those under age 18 and 8.2% of those age 65 or over.
Common Questions
What is Per Capita Income in Weaverville?
Per Capita income in Weaverville is $33,792.
What is the Median Family Income in Weaverville?
Median Family Income in Weaverville is $77,098.
What is the Median Household income in Weaverville?
Median Household Income in Weaverville is $49,539.
What is Income or Wage Gap in Weaverville?
Income or Wage Gap in Weaverville is 12.1%.
Women in Weaverville earn 87.9 cents for every dollar earned by a man.
What is Family Income Deficit in Weaverville?
Family Income Deficit in Weaverville is $13,322.
Families that are below poverty line in Weaverville earn $13,322 less on average than the poverty threshold level.
What is Inequality or Gini Index in Weaverville?
Inequality or Gini Index in Weaverville is 0.51.
What is the Total Population of Weaverville?
Total Population of Weaverville is 3,582.
What is the Total Male Population of Weaverville?
Total Male Population of Weaverville is 1,615.
What is the Total Female Population of Weaverville?
Total Female Population of Weaverville is 1,967.
What is the Ratio of Males per 100 Females in Weaverville?
There are 82.10 Males per 100 Females in Weaverville.
What is the Ratio of Females per 100 Males in Weaverville?
There are 121.80 Females per 100 Males in Weaverville.
What is the Median Population Age in Weaverville?
Median Population Age in Weaverville is 43.9 Years.
What is the Average Family Size in Weaverville
Average Family Size in Weaverville is 3.1 People.
What is the Average Household Size in Weaverville
Average Household Size in Weaverville is 2.4 People.
How Large is the Labor Force in Weaverville?
There are 1,515 People in the Labor Forcein in Weaverville.
What is the Percentage of People in the Labor Force in Weaverville?
51.1% of People are in the Labor Force in Weaverville.
What is the Unemployment Rate in Weaverville?
Unemployment Rate in Weaverville is 10.5%.