Cities with the Highest Percentage of Population Employed in Food Preparation & Serving in Illinois
RELATED REPORTS & OPTIONS
Food Preparation & Serving
Illinois
Compare Cities
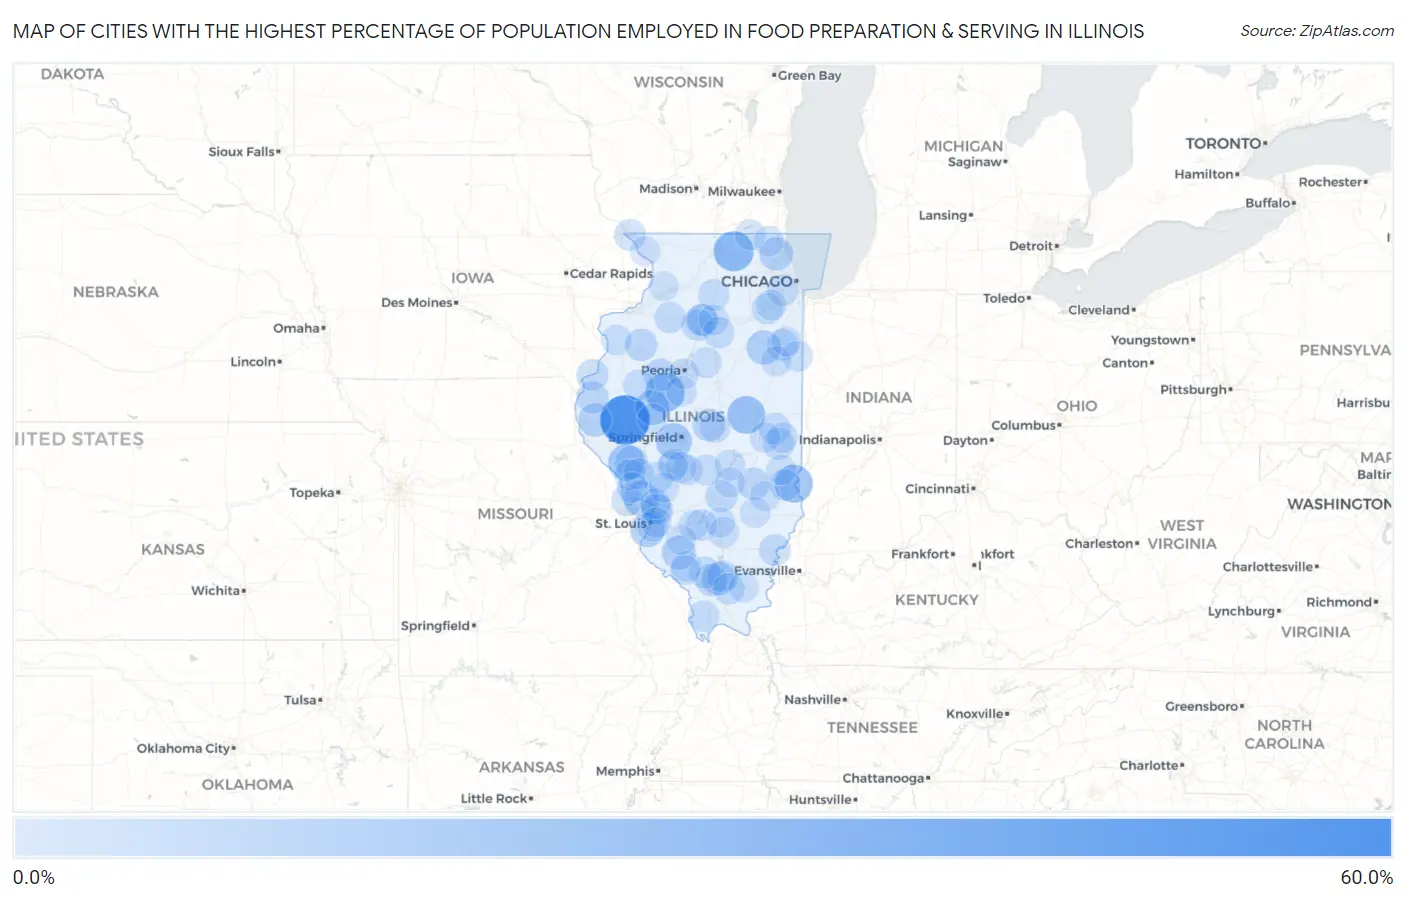
Map of Cities with the Highest Percentage of Population Employed in Food Preparation & Serving in Illinois
0.0%
60.0%
Cities with the Highest Percentage of Population Employed in Food Preparation & Serving in Illinois
| City | % Employed | vs State | vs National | |
| 1. | Ripley | 60.0% | 5.0%(+55.0)#1 | 5.3%(+54.7)#71 |
| 2. | Marley | 44.0% | 5.0%(+39.0)#2 | 5.3%(+38.7)#150 |
| 3. | Garden Prairie | 35.6% | 5.0%(+30.6)#3 | 5.3%(+30.3)#242 |
| 4. | Goofy Ridge | 34.0% | 5.0%(+29.0)#4 | 5.3%(+28.7)#268 |
| 5. | West York | 30.8% | 5.0%(+25.7)#5 | 5.3%(+25.5)#324 |
| 6. | White Heath | 30.4% | 5.0%(+25.4)#6 | 5.3%(+25.1)#338 |
| 7. | Pearl | 26.5% | 5.0%(+21.4)#7 | 5.3%(+21.2)#447 |
| 8. | Curran | 26.1% | 5.0%(+21.1)#8 | 5.3%(+20.9)#463 |
| 9. | Custer Park | 25.6% | 5.0%(+20.5)#9 | 5.3%(+20.3)#484 |
| 10. | Dundas | 25.3% | 5.0%(+20.3)#10 | 5.3%(+20.0)#490 |
| 11. | Elsah | 24.1% | 5.0%(+19.0)#11 | 5.3%(+18.8)#547 |
| 12. | Bath | 22.7% | 5.0%(+17.7)#12 | 5.3%(+17.4)#633 |
| 13. | East Carondelet | 21.9% | 5.0%(+16.8)#13 | 5.3%(+16.6)#684 |
| 14. | Cabery | 21.6% | 5.0%(+16.6)#14 | 5.3%(+16.3)#704 |
| 15. | Baileyville | 21.5% | 5.0%(+16.5)#15 | 5.3%(+16.3)#708 |
| 16. | Campbell's Island | 20.9% | 5.0%(+15.8)#16 | 5.3%(+15.6)#748 |
| 17. | Tilden | 20.3% | 5.0%(+15.2)#17 | 5.3%(+15.0)#807 |
| 18. | Indian Creek | 20.2% | 5.0%(+15.2)#18 | 5.3%(+14.9)#815 |
| 19. | Ophiem | 20.2% | 5.0%(+15.2)#19 | 5.3%(+14.9)#816 |
| 20. | Coatsburg | 19.5% | 5.0%(+14.5)#20 | 5.3%(+14.2)#889 |
| 21. | Freeman Spur | 19.3% | 5.0%(+14.3)#21 | 5.3%(+14.0)#914 |
| 22. | Hillview | 19.0% | 5.0%(+13.9)#22 | 5.3%(+13.7)#953 |
| 23. | Holcomb | 18.7% | 5.0%(+13.6)#23 | 5.3%(+13.4)#985 |
| 24. | Latham | 17.9% | 5.0%(+12.9)#24 | 5.3%(+12.6)#1,081 |
| 25. | Norris | 17.5% | 5.0%(+12.5)#25 | 5.3%(+12.2)#1,132 |
| 26. | Henderson | 17.4% | 5.0%(+12.4)#26 | 5.3%(+12.1)#1,148 |
| 27. | Montrose | 16.9% | 5.0%(+11.9)#27 | 5.3%(+11.6)#1,219 |
| 28. | Basco | 16.7% | 5.0%(+11.6)#28 | 5.3%(+11.4)#1,264 |
| 29. | Hollowayville | 16.7% | 5.0%(+11.6)#29 | 5.3%(+11.4)#1,271 |
| 30. | Bush | 16.6% | 5.0%(+11.5)#30 | 5.3%(+11.3)#1,286 |
| 31. | Galt | 16.4% | 5.0%(+11.3)#31 | 5.3%(+11.1)#1,321 |
| 32. | Brussels | 16.1% | 5.0%(+11.1)#32 | 5.3%(+10.8)#1,380 |
| 33. | Pontoosuc | 15.8% | 5.0%(+10.8)#33 | 5.3%(+10.5)#1,448 |
| 34. | Bureau Junction | 15.8% | 5.0%(+10.7)#34 | 5.3%(+10.5)#1,460 |
| 35. | Rest Haven | 15.7% | 5.0%(+10.7)#35 | 5.3%(+10.5)#1,465 |
| 36. | Grayville | 15.7% | 5.0%(+10.6)#36 | 5.3%(+10.4)#1,481 |
| 37. | Brocton | 15.6% | 5.0%(+10.6)#37 | 5.3%(+10.3)#1,485 |
| 38. | Brownstown | 15.4% | 5.0%(+10.4)#38 | 5.3%(+10.2)#1,519 |
| 39. | Sammons Point | 15.4% | 5.0%(+10.4)#39 | 5.3%(+10.1)#1,534 |
| 40. | South Roxana | 15.3% | 5.0%(+10.3)#40 | 5.3%(+10.0)#1,553 |
| 41. | Chesterfield | 15.3% | 5.0%(+10.3)#41 | 5.3%(+10.0)#1,559 |
| 42. | West Frankfort | 15.2% | 5.0%(+10.2)#42 | 5.3%(+9.95)#1,571 |
| 43. | Dowell | 15.2% | 5.0%(+10.2)#43 | 5.3%(+9.91)#1,577 |
| 44. | Broadlands | 15.1% | 5.0%(+10.1)#44 | 5.3%(+9.82)#1,596 |
| 45. | Crab Orchard | 15.0% | 5.0%(+10.00)#45 | 5.3%(+9.75)#1,619 |
| 46. | Annapolis | 15.0% | 5.0%(+9.97)#46 | 5.3%(+9.71)#1,632 |
| 47. | Seatonville | 15.0% | 5.0%(+9.94)#47 | 5.3%(+9.69)#1,641 |
| 48. | Menominee | 14.8% | 5.0%(+9.78)#48 | 5.3%(+9.53)#1,683 |
| 49. | Leonore | 14.7% | 5.0%(+9.67)#49 | 5.3%(+9.42)#1,712 |
| 50. | Rockdale | 14.6% | 5.0%(+9.56)#50 | 5.3%(+9.31)#1,737 |
| 51. | Mineral | 14.6% | 5.0%(+9.55)#52 | 5.3%(+9.30)#1,741 |
| 52. | Eldred | 14.6% | 5.0%(+9.55)#53 | 5.3%(+9.30)#1,742 |
| 53. | Huey | 14.5% | 5.0%(+9.48)#54 | 5.3%(+9.23)#1,767 |
| 54. | Compton | 14.4% | 5.0%(+9.38)#55 | 5.3%(+9.13)#1,788 |
| 55. | Mill Creek | 14.3% | 5.0%(+9.25)#56 | 5.3%(+9.00)#1,834 |
| 56. | Hodgkins | 14.2% | 5.0%(+9.19)#57 | 5.3%(+8.94)#1,850 |
| 57. | Sauget | 14.1% | 5.0%(+9.05)#58 | 5.3%(+8.80)#1,889 |
| 58. | Marietta | 13.9% | 5.0%(+8.85)#59 | 5.3%(+8.60)#1,944 |
| 59. | Ohlman | 13.8% | 5.0%(+8.76)#60 | 5.3%(+8.51)#1,973 |
| 60. | Hartford | 13.8% | 5.0%(+8.74)#61 | 5.3%(+8.49)#1,979 |
| 61. | Girard | 13.6% | 5.0%(+8.58)#62 | 5.3%(+8.33)#2,033 |
| 62. | Hume | 13.6% | 5.0%(+8.52)#63 | 5.3%(+8.27)#2,049 |
| 63. | Shelbyville | 13.5% | 5.0%(+8.49)#64 | 5.3%(+8.24)#2,059 |
| 64. | Hebron | 13.5% | 5.0%(+8.46)#65 | 5.3%(+8.21)#2,066 |
| 65. | Waggoner | 13.5% | 5.0%(+8.45)#66 | 5.3%(+8.20)#2,073 |
| 66. | Carrollton | 13.4% | 5.0%(+8.40)#67 | 5.3%(+8.15)#2,086 |
| 67. | Warrensburg | 13.4% | 5.0%(+8.37)#68 | 5.3%(+8.12)#2,103 |
| 68. | Roanoke | 13.4% | 5.0%(+8.33)#69 | 5.3%(+8.07)#2,119 |
| 69. | Fieldon | 13.3% | 5.0%(+8.30)#70 | 5.3%(+8.05)#2,127 |
| 70. | Donovan | 13.2% | 5.0%(+8.14)#71 | 5.3%(+7.89)#2,195 |
| 71. | Fairmont | 13.2% | 5.0%(+8.14)#72 | 5.3%(+7.89)#2,196 |
| 72. | Seaton | 13.2% | 5.0%(+8.12)#73 | 5.3%(+7.87)#2,201 |
| 73. | Kell | 13.0% | 5.0%(+8.01)#74 | 5.3%(+7.76)#2,240 |
| 74. | Creve Coeur | 13.0% | 5.0%(+8.01)#75 | 5.3%(+7.76)#2,247 |
| 75. | East Alton | 13.0% | 5.0%(+7.98)#76 | 5.3%(+7.73)#2,254 |
| 76. | Harvel | 13.0% | 5.0%(+7.93)#77 | 5.3%(+7.68)#2,271 |
| 77. | Cutler | 12.9% | 5.0%(+7.84)#78 | 5.3%(+7.59)#2,307 |
| 78. | Camargo | 12.8% | 5.0%(+7.80)#79 | 5.3%(+7.54)#2,334 |
| 79. | Sailor Springs | 12.8% | 5.0%(+7.73)#80 | 5.3%(+7.48)#2,366 |
| 80. | Green Valley | 12.7% | 5.0%(+7.71)#81 | 5.3%(+7.45)#2,376 |
| 81. | Washington Park | 12.6% | 5.0%(+7.56)#82 | 5.3%(+7.31)#2,445 |
| 82. | Beckemeyer | 12.6% | 5.0%(+7.52)#83 | 5.3%(+7.27)#2,458 |
| 83. | Round Lake Heights | 12.5% | 5.0%(+7.50)#84 | 5.3%(+7.25)#2,469 |
| 84. | Lasalle | 12.5% | 5.0%(+7.50)#85 | 5.3%(+7.25)#2,471 |
| 85. | Martinsville | 12.5% | 5.0%(+7.43)#86 | 5.3%(+7.18)#2,534 |
| 86. | Westlake | 12.5% | 5.0%(+7.42)#87 | 5.3%(+7.17)#2,538 |
| 87. | Chandlerville | 12.4% | 5.0%(+7.41)#88 | 5.3%(+7.16)#2,541 |
| 88. | Salem | 12.4% | 5.0%(+7.39)#89 | 5.3%(+7.13)#2,554 |
| 89. | Danforth | 12.4% | 5.0%(+7.34)#90 | 5.3%(+7.09)#2,576 |
| 90. | Beecher City | 12.4% | 5.0%(+7.34)#91 | 5.3%(+7.09)#2,577 |
| 91. | Nilwood | 12.3% | 5.0%(+7.25)#92 | 5.3%(+6.99)#2,604 |
| 92. | Lake Carroll | 12.2% | 5.0%(+7.18)#93 | 5.3%(+6.93)#2,639 |
| 93. | Hanover | 12.2% | 5.0%(+7.16)#94 | 5.3%(+6.91)#2,646 |
| 94. | Willisville | 12.1% | 5.0%(+7.12)#95 | 5.3%(+6.86)#2,675 |
| 95. | Venedy | 12.1% | 5.0%(+7.09)#96 | 5.3%(+6.84)#2,695 |
| 96. | Royal Lakes | 12.0% | 5.0%(+6.97)#97 | 5.3%(+6.71)#2,760 |
| 97. | Newton | 12.0% | 5.0%(+6.93)#98 | 5.3%(+6.68)#2,784 |
| 98. | Harrisburg | 11.8% | 5.0%(+6.77)#99 | 5.3%(+6.52)#2,877 |
| 99. | Aroma Park | 11.7% | 5.0%(+6.70)#100 | 5.3%(+6.44)#2,919 |
| 100. | Morrison | 11.7% | 5.0%(+6.68)#101 | 5.3%(+6.42)#2,937 |
Common Questions
What are the Top 10 Cities with the Highest Percentage of Population Employed in Food Preparation & Serving in Illinois?
Top 10 Cities with the Highest Percentage of Population Employed in Food Preparation & Serving in Illinois are:
#1
60.0%
#2
35.6%
#3
34.0%
#4
30.8%
#5
30.4%
#6
26.5%
#7
26.1%
#8
24.1%
#9
22.7%
#10
21.9%
What city has the Highest Percentage of Population Employed in Food Preparation & Serving in Illinois?
Ripley has the Highest Percentage of Population Employed in Food Preparation & Serving in Illinois with 60.0%.
What is the Percentage of Population Employed in Food Preparation & Serving in the State of Illinois?
Percentage of Population Employed in Food Preparation & Serving in Illinois is 5.0%.
What is the Percentage of Population Employed in Food Preparation & Serving in the United States?
Percentage of Population Employed in Food Preparation & Serving in the United States is 5.3%.