Grenada, CA Map & Demographics
Grenada Map
Grenada Overview
$26,687
PER CAPITA INCOME
$57,500
AVG FAMILY INCOME
$47,083
AVG HOUSEHOLD INCOME
0.40
INEQUALITY / GINI INDEX
230
TOTAL POPULATION
124
MALE POPULATION
106
FEMALE POPULATION
116.98
MALES / 100 FEMALES
85.48
FEMALES / 100 MALES
61.1
MEDIAN AGE
2.1
AVG FAMILY SIZE
1.9
AVG HOUSEHOLD SIZE
119
LABOR FORCE [ PEOPLE ]
54.1%
PERCENT IN LABOR FORCE
22.7%
UNEMPLOYMENT RATE
Grenada Zip Codes
Grenada Area Codes
Income in Grenada
Income Overview in Grenada
Per Capita Income in Grenada is $26,687, while median incomes of families and households are $57,500 and $47,083 respectively.
| Characteristic | Number | Measure |
| Per Capita Income | 230 | $26,687 |
| Median Family Income | 68 | $57,500 |
| Mean Family Income | 68 | $58,521 |
| Median Household Income | 121 | $47,083 |
| Mean Household Income | 121 | $48,173 |
| Income Deficit | 68 | $0 |
| Wage / Income Gap (%) | 230 | 0.00% |
| Wage / Income Gap ($) | 230 | 100.00¢ per $1 |
| Gini / Inequality Index | 230 | 0.40 |
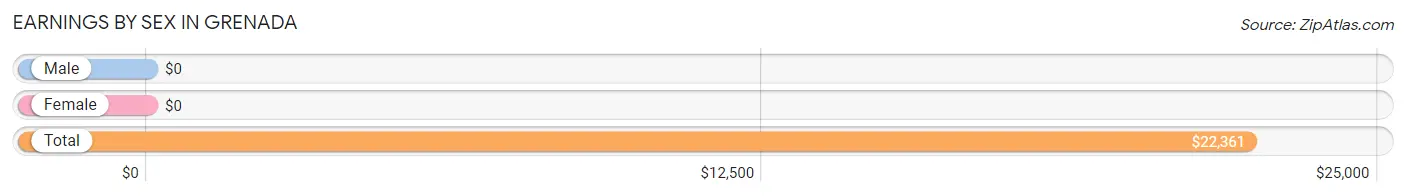
Earnings by Sex in Grenada
| Sex | Number | Average Earnings |
| Male | 102 (85.7%) | $0 |
| Female | 17 (14.3%) | $0 |
| Total | 119 (100.0%) | $22,361 |
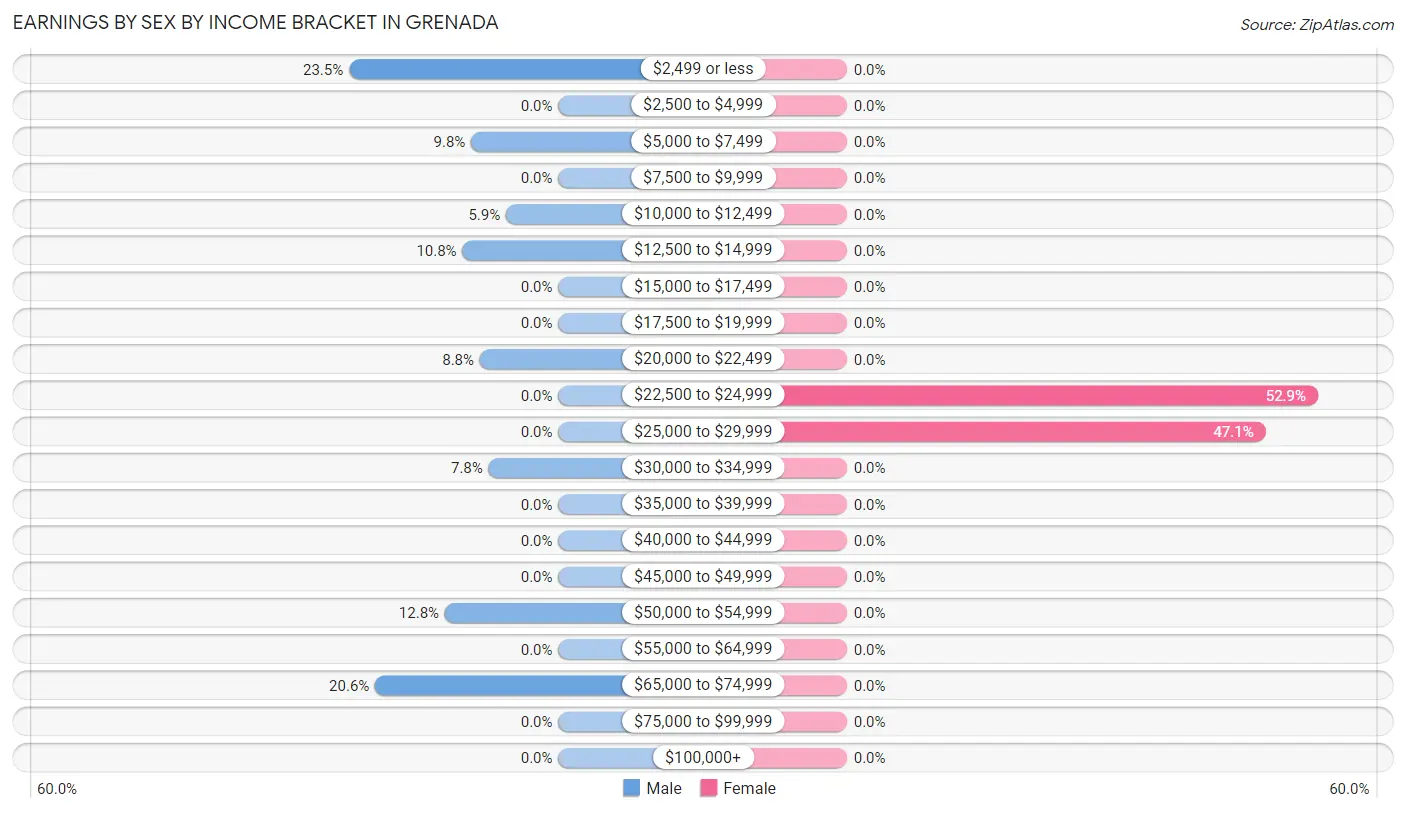
Earnings by Sex by Income Bracket in Grenada
The most common earnings brackets in Grenada are $2,499 or less for men (24 | 23.5%) and $22,500 to $24,999 for women (9 | 52.9%).
| Income | Male | Female |
| $2,499 or less | 24 (23.5%) | 0 (0.0%) |
| $2,500 to $4,999 | 0 (0.0%) | 0 (0.0%) |
| $5,000 to $7,499 | 10 (9.8%) | 0 (0.0%) |
| $7,500 to $9,999 | 0 (0.0%) | 0 (0.0%) |
| $10,000 to $12,499 | 6 (5.9%) | 0 (0.0%) |
| $12,500 to $14,999 | 11 (10.8%) | 0 (0.0%) |
| $15,000 to $17,499 | 0 (0.0%) | 0 (0.0%) |
| $17,500 to $19,999 | 0 (0.0%) | 0 (0.0%) |
| $20,000 to $22,499 | 9 (8.8%) | 0 (0.0%) |
| $22,500 to $24,999 | 0 (0.0%) | 9 (52.9%) |
| $25,000 to $29,999 | 0 (0.0%) | 8 (47.1%) |
| $30,000 to $34,999 | 8 (7.8%) | 0 (0.0%) |
| $35,000 to $39,999 | 0 (0.0%) | 0 (0.0%) |
| $40,000 to $44,999 | 0 (0.0%) | 0 (0.0%) |
| $45,000 to $49,999 | 0 (0.0%) | 0 (0.0%) |
| $50,000 to $54,999 | 13 (12.8%) | 0 (0.0%) |
| $55,000 to $64,999 | 0 (0.0%) | 0 (0.0%) |
| $65,000 to $74,999 | 21 (20.6%) | 0 (0.0%) |
| $75,000 to $99,999 | 0 (0.0%) | 0 (0.0%) |
| $100,000+ | 0 (0.0%) | 0 (0.0%) |
| Total | 102 (100.0%) | 17 (100.0%) |
Earnings by Sex by Educational Attainment in Grenada
| Educational Attainment | Male Income | Female Income |
| Less than High School | - | - |
| High School Diploma | - | - |
| College or Associate's Degree | - | - |
| Bachelor's Degree | - | - |
| Graduate Degree | - | - |
| Total | - | - |
Family Income in Grenada
Family Income Brackets in Grenada
According to the Grenada family income data, there are 34 families falling into the $50,000 to $74,999 income range, which is the most common income bracket and makes up 50.0% of all families.
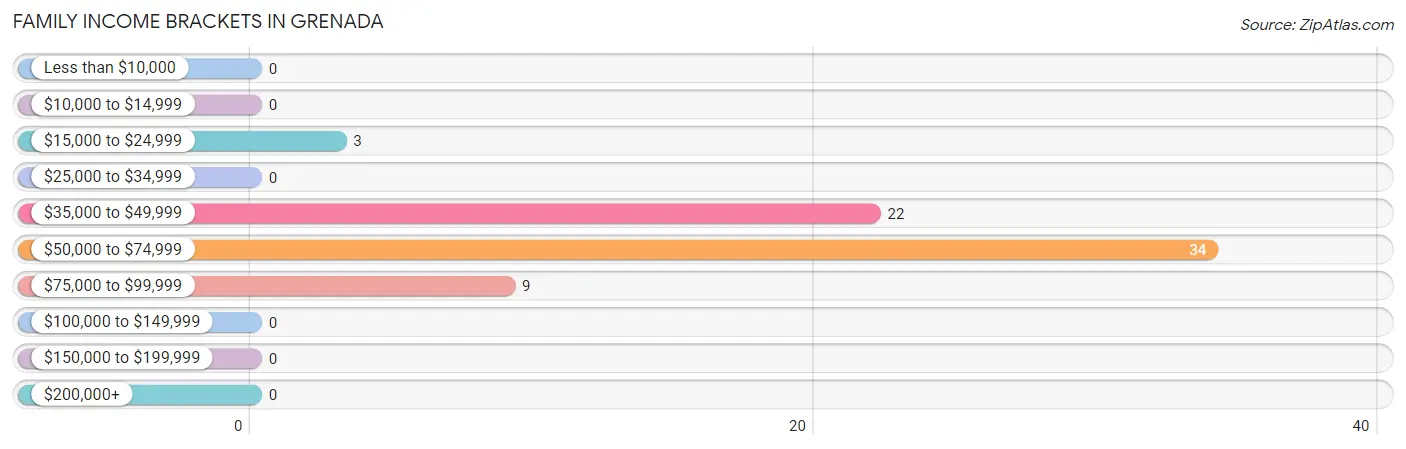
| Income Bracket | # Families | % Families |
| Less than $10,000 | 0 | 0.0% |
| $10,000 to $14,999 | 0 | 0.0% |
| $15,000 to $24,999 | 3 | 4.4% |
| $25,000 to $34,999 | 0 | 0.0% |
| $35,000 to $49,999 | 22 | 32.4% |
| $50,000 to $74,999 | 34 | 50.0% |
| $75,000 to $99,999 | 9 | 13.2% |
| $100,000 to $149,999 | 0 | 0.0% |
| $150,000 to $199,999 | 0 | 0.0% |
| $200,000+ | 0 | 0.0% |
Family Income by Famaliy Size in Grenada
2-person families (51 | 75.0%) account for the highest median family income in Grenada with $57,656 per family, while 2-person families (51 | 75.0%) have the highest median income of $28,828 per family member.
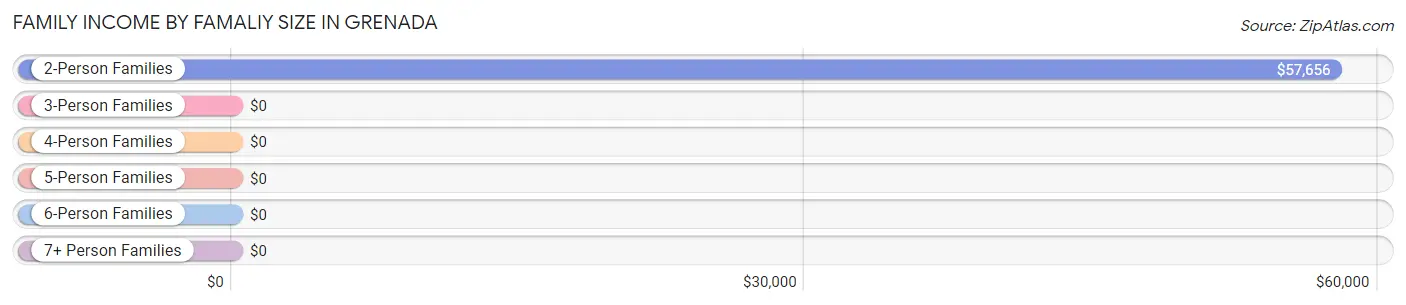
| Income Bracket | # Families | Median Income |
| 2-Person Families | 51 (75.0%) | $57,656 |
| 3-Person Families | 17 (25.0%) | $0 |
| 4-Person Families | 0 (0.0%) | $0 |
| 5-Person Families | 0 (0.0%) | $0 |
| 6-Person Families | 0 (0.0%) | $0 |
| 7+ Person Families | 0 (0.0%) | $0 |
| Total | 68 (100.0%) | $57,500 |
Family Income by Number of Earners in Grenada
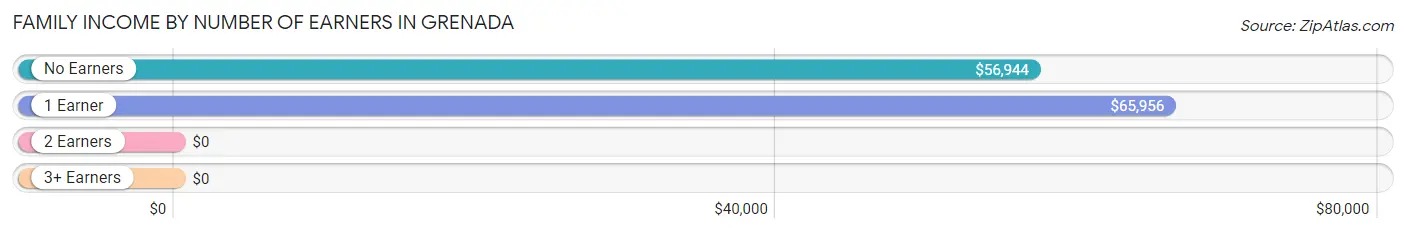
| Number of Earners | # Families | Median Income |
| No Earners | 20 (29.4%) | $56,944 |
| 1 Earner | 39 (57.4%) | $65,956 |
| 2 Earners | 9 (13.2%) | $0 |
| 3+ Earners | 0 (0.0%) | $0 |
| Total | 68 (100.0%) | $57,500 |
Household Income in Grenada
Household Income Brackets in Grenada
With 34 households falling in the category, the $50,000 to $74,999 income range is the most frequent in Grenada, accounting for 28.1% of all households.
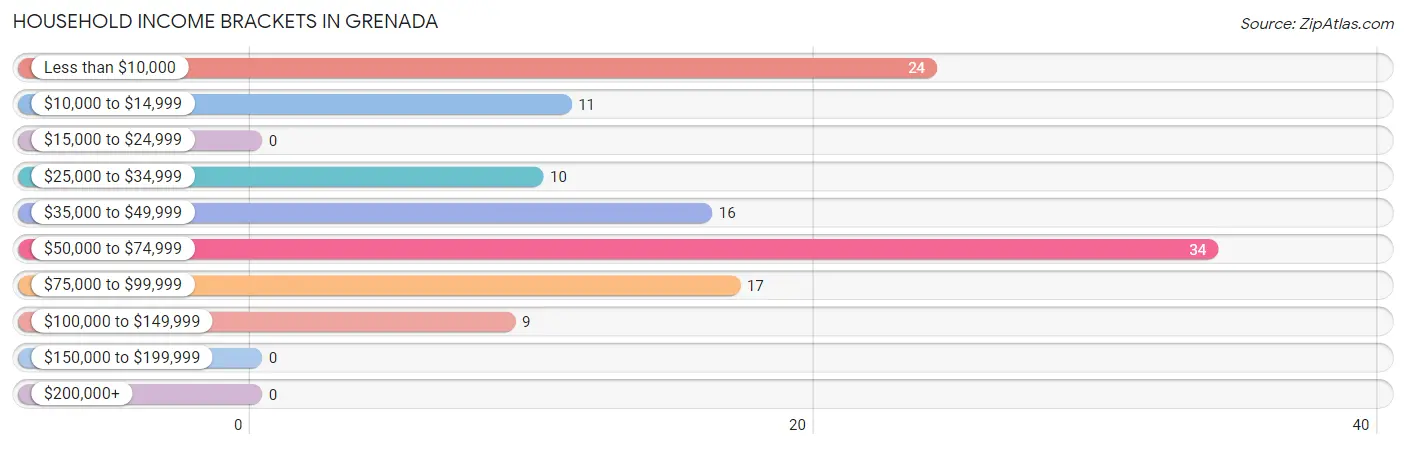
| Income Bracket | # Households | % Households |
| Less than $10,000 | 24 | 19.8% |
| $10,000 to $14,999 | 11 | 9.1% |
| $15,000 to $24,999 | 0 | 0.0% |
| $25,000 to $34,999 | 10 | 8.3% |
| $35,000 to $49,999 | 16 | 13.2% |
| $50,000 to $74,999 | 34 | 28.1% |
| $75,000 to $99,999 | 17 | 14.0% |
| $100,000 to $149,999 | 9 | 7.4% |
| $150,000 to $199,999 | 0 | 0.0% |
| $200,000+ | 0 | 0.0% |
Household Income by Householder Age in Grenada
The median household income in Grenada is $47,083, with the highest median household income of $65,156 found in the 45 to 64 years age bracket for the primary householder. A total of 33 households (27.3%) fall into this category. Meanwhile, the 15 to 24 years age bracket for the primary householder has the lowest median household income of $0, with 32 households (26.5%) in this group.
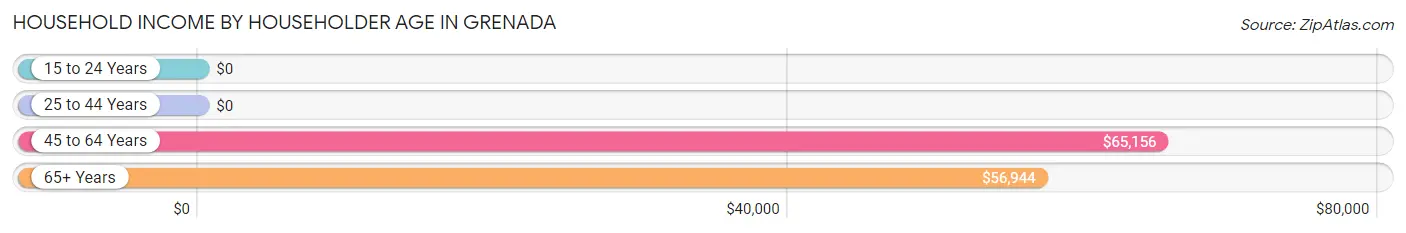
| Income Bracket | # Households | Median Income |
| 15 to 24 Years | 32 (26.5%) | $0 |
| 25 to 44 Years | 0 (0.0%) | $0 |
| 45 to 64 Years | 33 (27.3%) | $65,156 |
| 65+ Years | 56 (46.3%) | $56,944 |
| Total | 121 (100.0%) | $47,083 |
Poverty in Grenada
Income Below Poverty by Sex and Age in Grenada
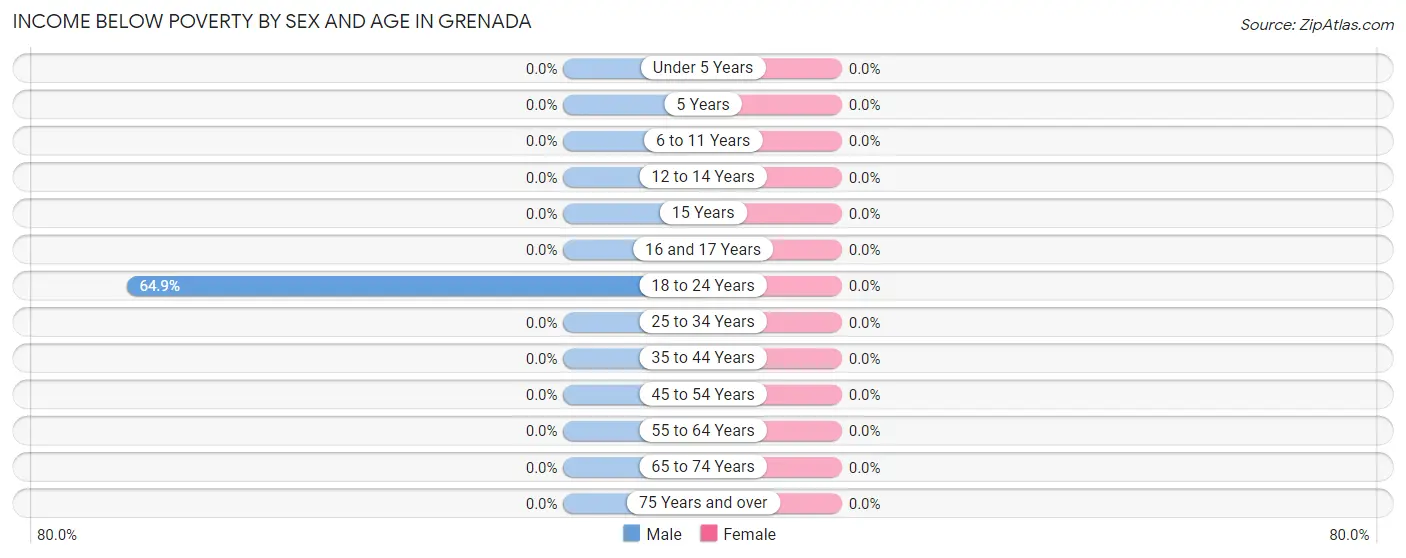
| Age Bracket | Male | Female |
| Under 5 Years | 0 (0.0%) | 0 (0.0%) |
| 5 Years | 0 (0.0%) | 0 (0.0%) |
| 6 to 11 Years | 0 (0.0%) | 0 (0.0%) |
| 12 to 14 Years | 0 (0.0%) | 0 (0.0%) |
| 15 Years | 0 (0.0%) | 0 (0.0%) |
| 16 and 17 Years | 0 (0.0%) | 0 (0.0%) |
| 18 to 24 Years | 24 (64.9%) | 0 (0.0%) |
| 25 to 34 Years | 0 (0.0%) | 0 (0.0%) |
| 35 to 44 Years | 0 (0.0%) | 0 (0.0%) |
| 45 to 54 Years | 0 (0.0%) | 0 (0.0%) |
| 55 to 64 Years | 0 (0.0%) | 0 (0.0%) |
| 65 to 74 Years | 0 (0.0%) | 0 (0.0%) |
| 75 Years and over | 0 (0.0%) | 0 (0.0%) |
| Total | 24 (19.4%) | 0 (0.0%) |
Income Above Poverty by Sex and Age in Grenada
According to the poverty statistics in Grenada, males aged 16 and 17 years and females aged 12 to 14 years are the age groups that are most secure financially, with 100.0% of males and 100.0% of females in these age groups living above the poverty line.
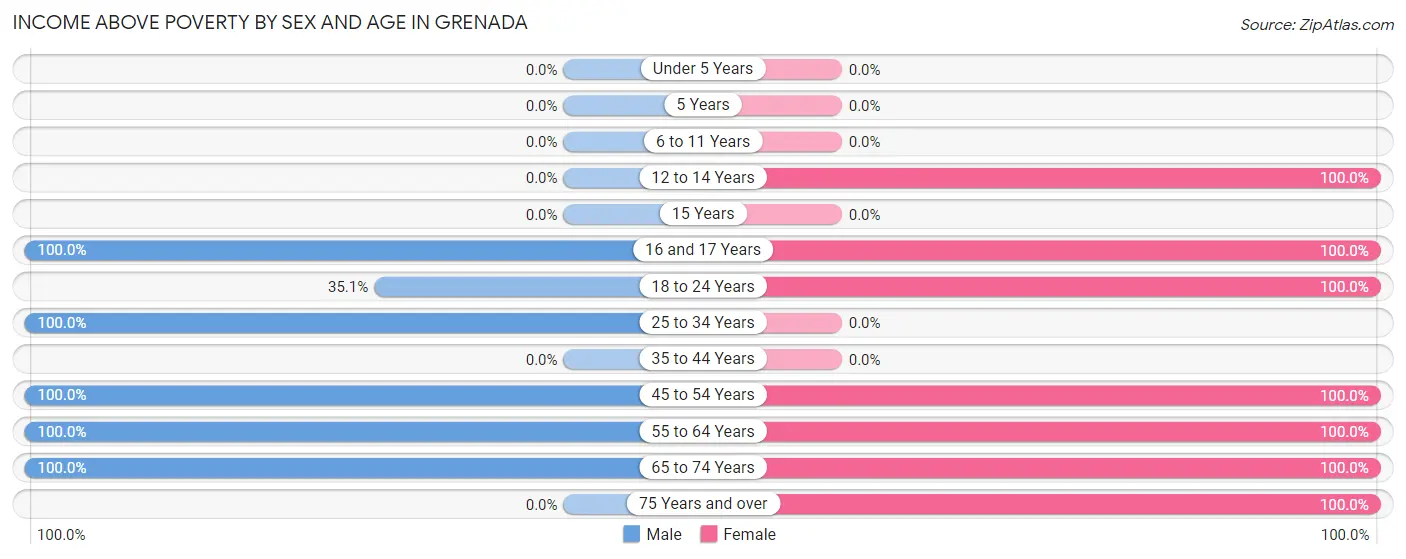
| Age Bracket | Male | Female |
| Under 5 Years | 0 (0.0%) | 0 (0.0%) |
| 5 Years | 0 (0.0%) | 0 (0.0%) |
| 6 to 11 Years | 0 (0.0%) | 0 (0.0%) |
| 12 to 14 Years | 0 (0.0%) | 10 (100.0%) |
| 15 Years | 0 (0.0%) | 0 (0.0%) |
| 16 and 17 Years | 11 (100.0%) | 3 (100.0%) |
| 18 to 24 Years | 13 (35.1%) | 8 (100.0%) |
| 25 to 34 Years | 6 (100.0%) | 0 (0.0%) |
| 35 to 44 Years | 0 (0.0%) | 0 (0.0%) |
| 45 to 54 Years | 14 (100.0%) | 25 (100.0%) |
| 55 to 64 Years | 18 (100.0%) | 10 (100.0%) |
| 65 to 74 Years | 38 (100.0%) | 26 (100.0%) |
| 75 Years and over | 0 (0.0%) | 20 (100.0%) |
| Total | 100 (80.6%) | 102 (100.0%) |
Income Below Poverty Among Married-Couple Families in Grenada
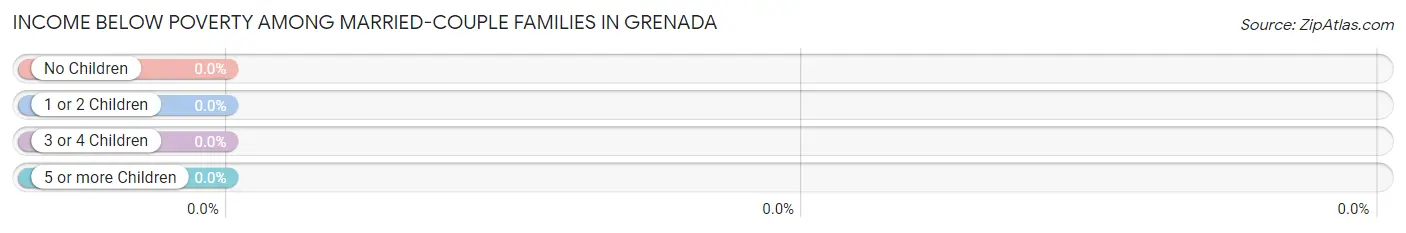
| Children | Above Poverty | Below Poverty |
| No Children | 56 (100.0%) | 0 (0.0%) |
| 1 or 2 Children | 0 (0.0%) | 0 (0.0%) |
| 3 or 4 Children | 0 (0.0%) | 0 (0.0%) |
| 5 or more Children | 0 (0.0%) | 0 (0.0%) |
| Total | 56 (100.0%) | 0 (0.0%) |
Income Below Poverty Among Single-Parent Households in Grenada
| Children | Single Father | Single Mother |
| No Children | 0 (0.0%) | 0 (0.0%) |
| 1 or 2 Children | 0 (0.0%) | 0 (0.0%) |
| 3 or 4 Children | 0 (0.0%) | 0 (0.0%) |
| 5 or more Children | 0 (0.0%) | 0 (0.0%) |
| Total | 0 (0.0%) | 0 (0.0%) |
Income Below Poverty Among Married-Couple vs Single-Parent Households in Grenada
| Children | Married-Couple Families | Single-Parent Households |
| No Children | 0 (0.0%) | 0 (0.0%) |
| 1 or 2 Children | 0 (0.0%) | 0 (0.0%) |
| 3 or 4 Children | 0 (0.0%) | 0 (0.0%) |
| 5 or more Children | 0 (0.0%) | 0 (0.0%) |
| Total | 0 (0.0%) | 0 (0.0%) |
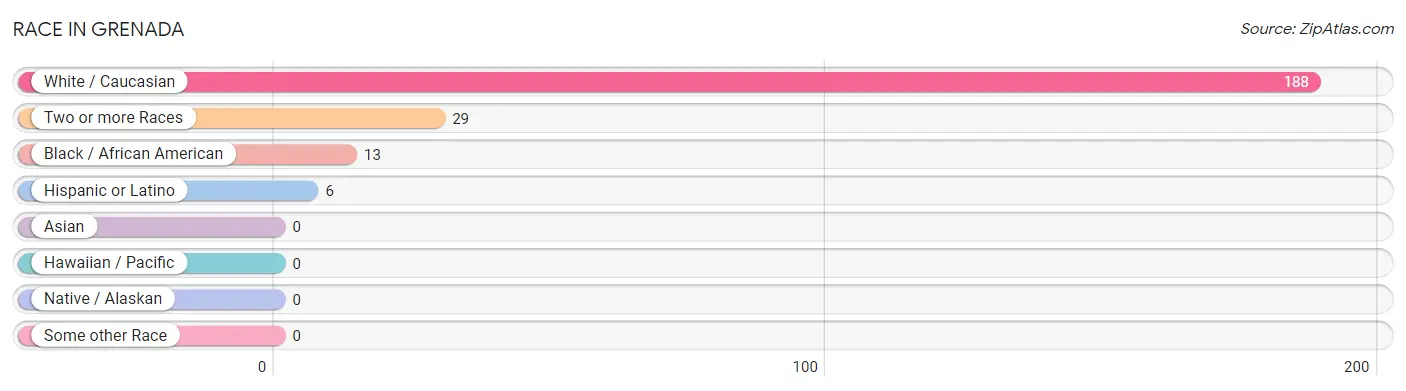
Race in Grenada
The most populous races in Grenada are White / Caucasian (188 | 81.7%), Two or more Races (29 | 12.6%), and Black / African American (13 | 5.7%).
| Race | # Population | % Population |
| Asian | 0 | 0.0% |
| Black / African American | 13 | 5.7% |
| Hawaiian / Pacific | 0 | 0.0% |
| Hispanic or Latino | 6 | 2.6% |
| Native / Alaskan | 0 | 0.0% |
| White / Caucasian | 188 | 81.7% |
| Two or more Races | 29 | 12.6% |
| Some other Race | 0 | 0.0% |
| Total | 230 | 100.0% |
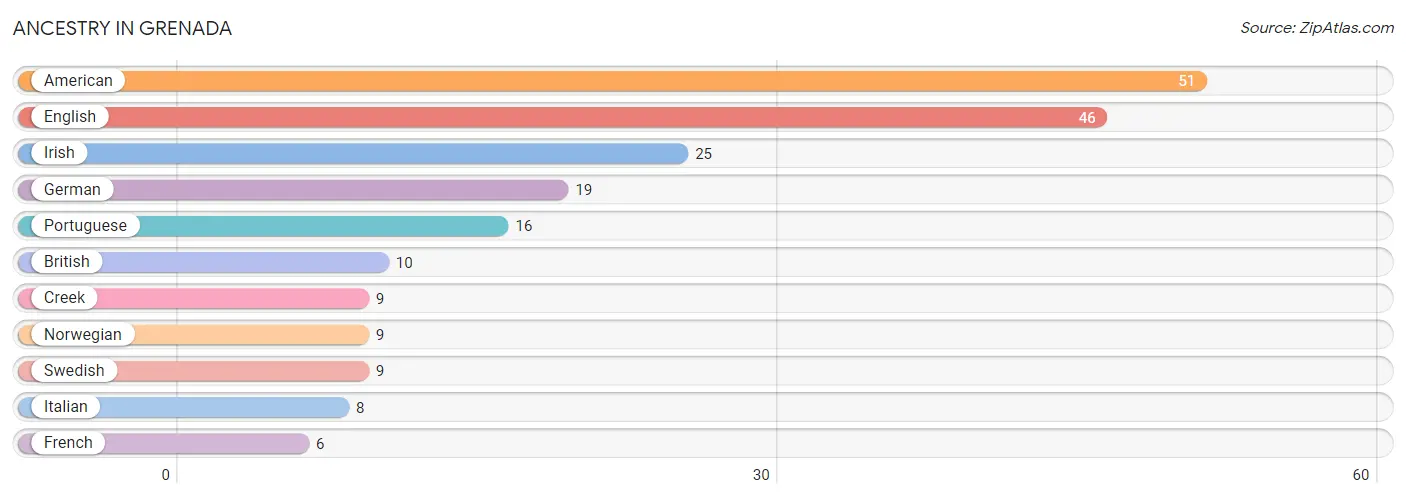
Ancestry in Grenada
The most populous ancestries reported in Grenada are American (51 | 22.2%), English (46 | 20.0%), Irish (25 | 10.9%), German (19 | 8.3%), and Portuguese (16 | 7.0%), together accounting for 68.3% of all Grenada residents.
| Ancestry | # Population | % Population |
| American | 51 | 22.2% |
| British | 10 | 4.3% |
| Creek | 9 | 3.9% |
| English | 46 | 20.0% |
| French | 6 | 2.6% |
| German | 19 | 8.3% |
| Irish | 25 | 10.9% |
| Italian | 8 | 3.5% |
| Norwegian | 9 | 3.9% |
| Portuguese | 16 | 7.0% |
| Swedish | 9 | 3.9% | View All 11 Rows |
Immigrants in Grenada
The most numerous immigrant groups reported in Grenada came from , and Canada (6 | 2.6%), together accounting for 2.6% of all Grenada residents.

| Immigration Origin | # Population | % Population |
| Canada | 6 | 2.6% | View All 1 Rows |
Sex and Age in Grenada
Sex and Age in Grenada
The most populous age groups in Grenada are 20 to 24 Years (37 | 29.8%) for men and 45 to 49 Years (25 | 23.6%) for women.
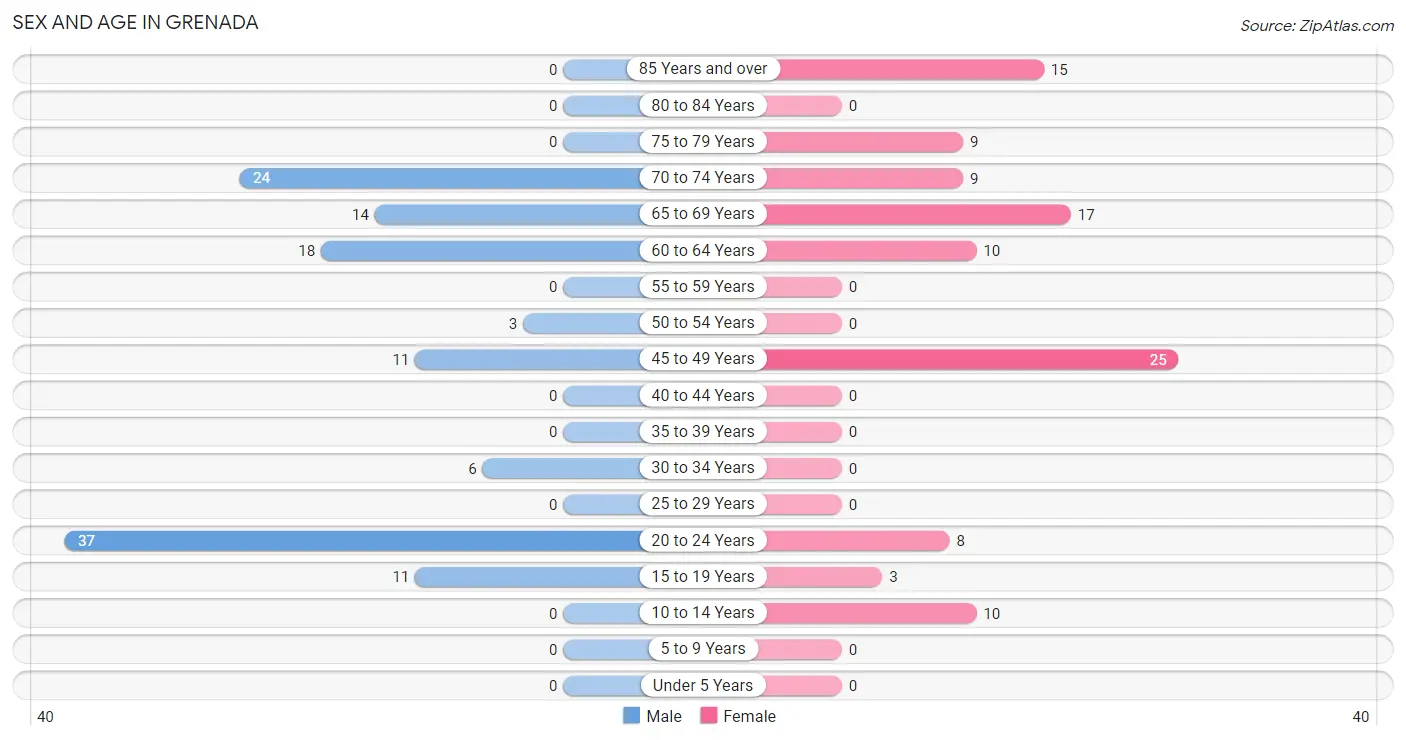
| Age Bracket | Male | Female |
| Under 5 Years | 0 (0.0%) | 0 (0.0%) |
| 5 to 9 Years | 0 (0.0%) | 0 (0.0%) |
| 10 to 14 Years | 0 (0.0%) | 10 (9.4%) |
| 15 to 19 Years | 11 (8.9%) | 3 (2.8%) |
| 20 to 24 Years | 37 (29.8%) | 8 (7.5%) |
| 25 to 29 Years | 0 (0.0%) | 0 (0.0%) |
| 30 to 34 Years | 6 (4.8%) | 0 (0.0%) |
| 35 to 39 Years | 0 (0.0%) | 0 (0.0%) |
| 40 to 44 Years | 0 (0.0%) | 0 (0.0%) |
| 45 to 49 Years | 11 (8.9%) | 25 (23.6%) |
| 50 to 54 Years | 3 (2.4%) | 0 (0.0%) |
| 55 to 59 Years | 0 (0.0%) | 0 (0.0%) |
| 60 to 64 Years | 18 (14.5%) | 10 (9.4%) |
| 65 to 69 Years | 14 (11.3%) | 17 (16.0%) |
| 70 to 74 Years | 24 (19.4%) | 9 (8.5%) |
| 75 to 79 Years | 0 (0.0%) | 9 (8.5%) |
| 80 to 84 Years | 0 (0.0%) | 0 (0.0%) |
| 85 Years and over | 0 (0.0%) | 15 (14.1%) |
| Total | 124 (100.0%) | 106 (100.0%) |
Families and Households in Grenada
Median Family Size in Grenada
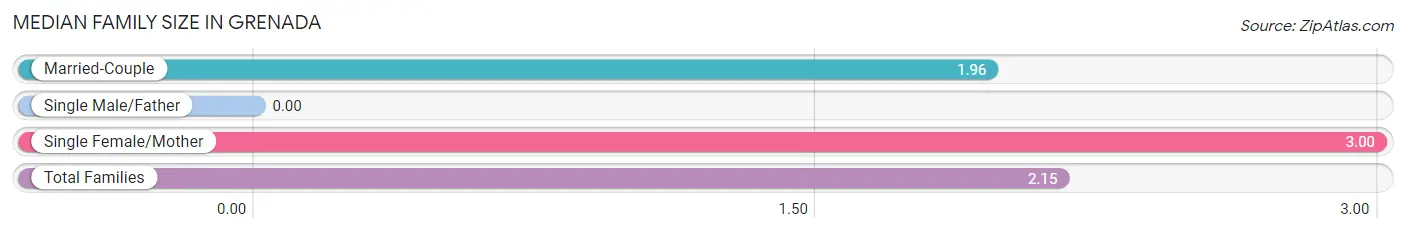
| Family Type | # Families | Family Size |
| Married-Couple | 56 (82.4%) | 1.96 |
| Single Male/Father | 0 (0.0%) | - |
| Single Female/Mother | 12 (17.6%) | 3.00 |
| Total Families | 68 (100.0%) | 2.15 |
Median Household Size in Grenada
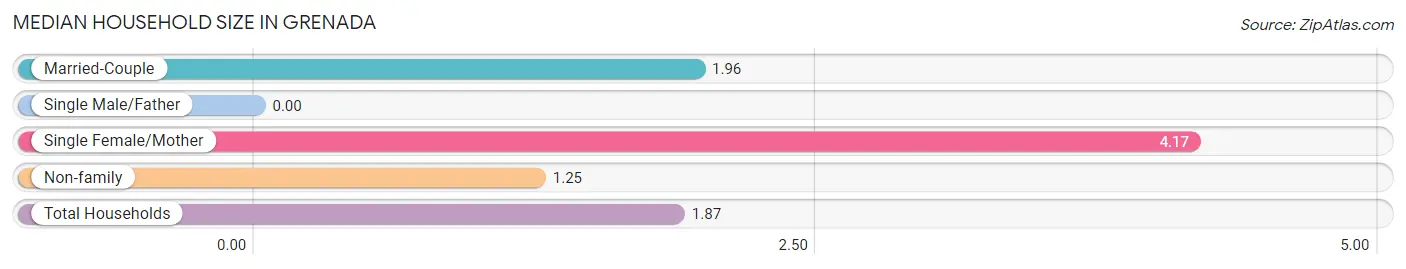
| Household Type | # Households | Household Size |
| Married-Couple | 56 (46.3%) | 1.96 |
| Single Male/Father | 0 (0.0%) | - |
| Single Female/Mother | 12 (9.9%) | 4.17 |
| Non-family | 53 (43.8%) | 1.25 |
| Total Households | 121 (100.0%) | 1.87 |
Household Size by Marriage Status in Grenada
Out of a total of 121 households in Grenada, 68 (56.2%) are family households, while 53 (43.8%) are nonfamily households. The most numerous type of family households are 2-person households, comprising 48, and the most common type of nonfamily households are 1-person households, comprising 45.
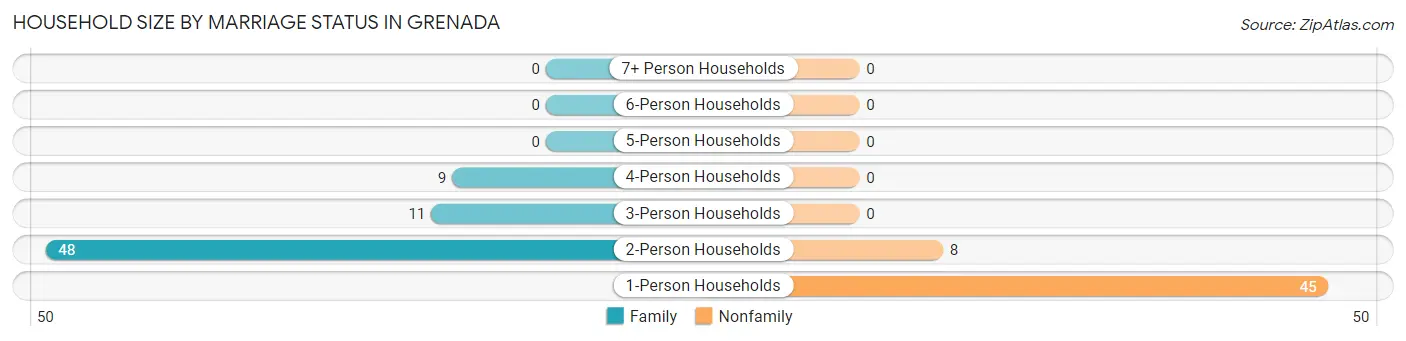
| Household Size | Family Households | Nonfamily Households |
| 1-Person Households | - | 45 (37.2%) |
| 2-Person Households | 48 (39.7%) | 8 (6.6%) |
| 3-Person Households | 11 (9.1%) | 0 (0.0%) |
| 4-Person Households | 9 (7.4%) | 0 (0.0%) |
| 5-Person Households | 0 (0.0%) | 0 (0.0%) |
| 6-Person Households | 0 (0.0%) | 0 (0.0%) |
| 7+ Person Households | 0 (0.0%) | 0 (0.0%) |
| Total | 68 (56.2%) | 53 (43.8%) |
Female Fertility in Grenada
Fertility by Age in Grenada
| Age Bracket | Women with Births | Births / 1,000 Women |
| 15 to 19 years | 0 (0.0%) | 0.0 |
| 20 to 34 years | 0 (0.0%) | 0.0 |
| 35 to 50 years | 0 (0.0%) | 0.0 |
| Total | 0 (0.0%) | 0.0 |
Fertility by Age by Marriage Status in Grenada
| Age Bracket | Married | Unmarried |
| 15 to 19 years | 0 (0.0%) | 0 (0.0%) |
| 20 to 34 years | 0 (0.0%) | 0 (0.0%) |
| 35 to 50 years | 0 (0.0%) | 0 (0.0%) |
| Total | 0 (0.0%) | 0 (0.0%) |
Fertility by Education in Grenada
| Educational Attainment | Women with Births | Births / 1,000 Women |
| Less than High School | 0 (0.0%) | 0.0 |
| High School Diploma | 0 (0.0%) | 0.0 |
| College or Associate's Degree | 0 (0.0%) | 0.0 |
| Bachelor's Degree | 0 (0.0%) | 0.0 |
| Graduate Degree | 0 (0.0%) | 0.0 |
| Total | 0 (0.0%) | 0.0 |
Fertility by Education by Marriage Status in Grenada
| Educational Attainment | Married | Unmarried |
| Less than High School | 0 (0.0%) | 0 (0.0%) |
| High School Diploma | 0 (0.0%) | 0 (0.0%) |
| College or Associate's Degree | 0 (0.0%) | 0 (0.0%) |
| Bachelor's Degree | 0 (0.0%) | 0 (0.0%) |
| Graduate Degree | 0 (0.0%) | 0 (0.0%) |
| Total | 0 (0.0%) | 0 (0.0%) |
Employment Characteristics in Grenada
Employment by Class of Employer in Grenada
Among the 92 employed individuals in Grenada, private company employees (37 | 40.2%), local government employees (25 | 27.2%), and state government employees (13 | 14.1%) make up the most common classes of employment.
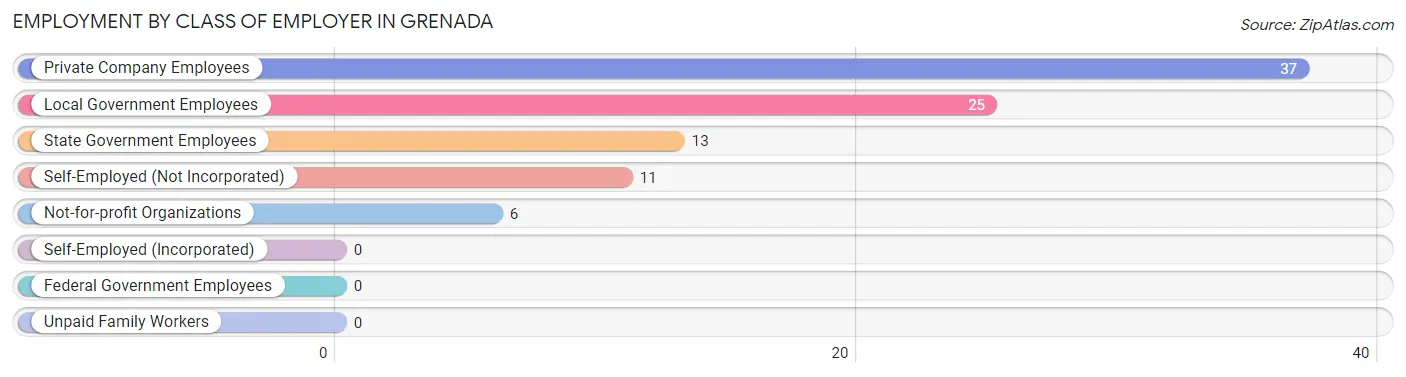
| Employer Class | # Employees | % Employees |
| Private Company Employees | 37 | 40.2% |
| Self-Employed (Incorporated) | 0 | 0.0% |
| Self-Employed (Not Incorporated) | 11 | 12.0% |
| Not-for-profit Organizations | 6 | 6.5% |
| Local Government Employees | 25 | 27.2% |
| State Government Employees | 13 | 14.1% |
| Federal Government Employees | 0 | 0.0% |
| Unpaid Family Workers | 0 | 0.0% |
| Total | 92 | 100.0% |
Employment Status by Age in Grenada
According to the labor force statistics for Grenada, out of the total population over 16 years of age (220), 54.1% or 119 individuals are in the labor force, with 22.7% or 27 of them unemployed. The age group with the highest labor force participation rate is 20 to 24 years, with 100.0% or 45 individuals in the labor force. Within the labor force, the 20 to 24 years age range has the highest percentage of unemployed individuals, with 53.3% or 24 of them being unemployed.
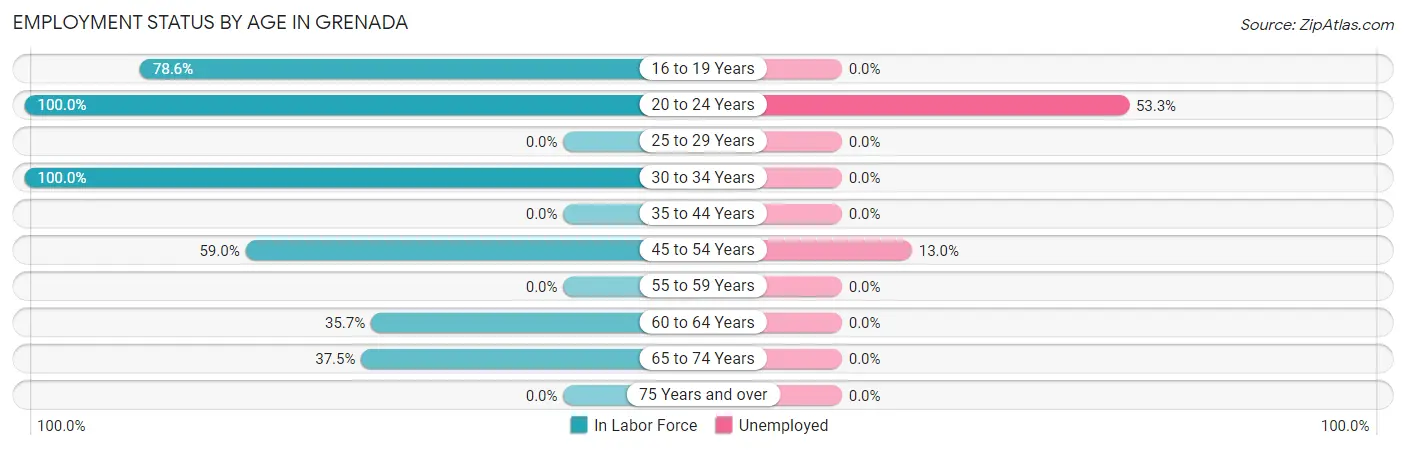
| Age Bracket | In Labor Force | Unemployed |
| 16 to 19 Years | 11 (78.6%) | 0 (0.0%) |
| 20 to 24 Years | 45 (100.0%) | 24 (53.3%) |
| 25 to 29 Years | 0 (0.0%) | 0 (0.0%) |
| 30 to 34 Years | 6 (100.0%) | 0 (0.0%) |
| 35 to 44 Years | 0 (0.0%) | 0 (0.0%) |
| 45 to 54 Years | 23 (59.0%) | 3 (13.0%) |
| 55 to 59 Years | 0 (0.0%) | 0 (0.0%) |
| 60 to 64 Years | 10 (35.7%) | 0 (0.0%) |
| 65 to 74 Years | 24 (37.5%) | 0 (0.0%) |
| 75 Years and over | 0 (0.0%) | 0 (0.0%) |
| Total | 119 (54.1%) | 27 (22.7%) |
Employment Status by Educational Attainment in Grenada
According to labor force statistics for Grenada, 53.4% of individuals (39) out of the total population between 25 and 64 years of age (73) are in the labor force, with 7.7% or 3 of them being unemployed. The group with the highest labor force participation rate are those with the educational attainment of less than high school, with 100.0% or 11 individuals in the labor force. Within the labor force, individuals with college / associate degree education have the highest percentage of unemployment, with 33.3% or 3 of them being unemployed.
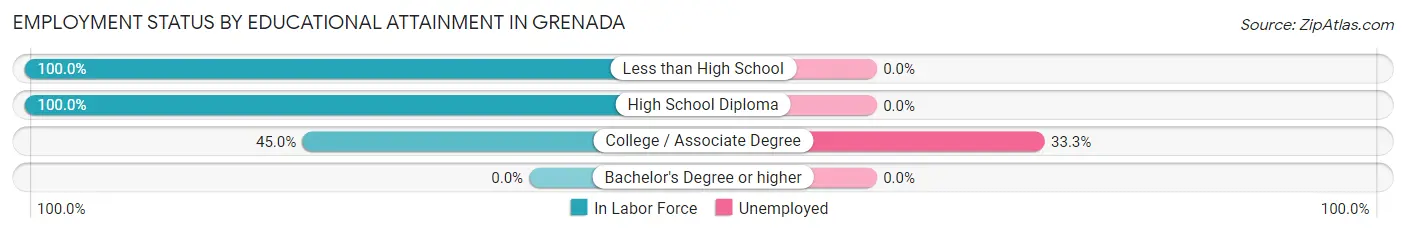
| Educational Attainment | In Labor Force | Unemployed |
| Less than High School | 11 (100.0%) | 0 (0.0%) |
| High School Diploma | 19 (100.0%) | 0 (0.0%) |
| College / Associate Degree | 9 (45.0%) | 7 (33.3%) |
| Bachelor's Degree or higher | 0 (0.0%) | 0 (0.0%) |
| Total | 39 (53.4%) | 6 (7.7%) |
Employment Occupations by Sex in Grenada
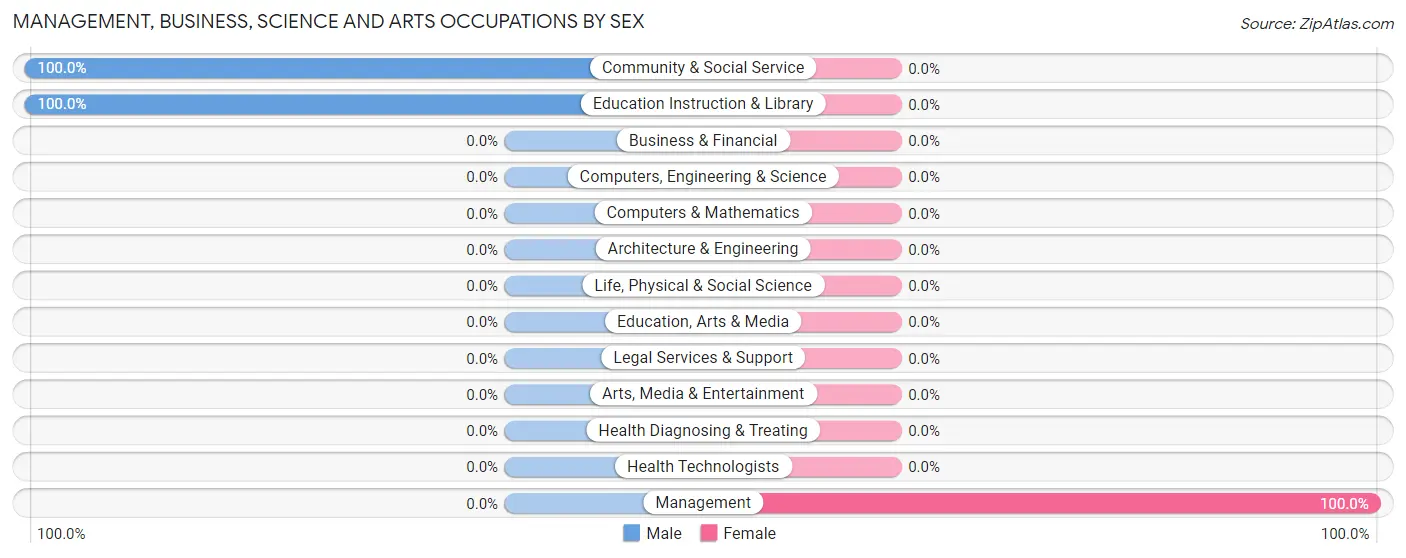
Management, Business, Science and Arts Occupations
The most common Management, Business, Science and Arts occupations in Grenada are Management (8 | 8.7%), Community & Social Service (6 | 6.5%), and Education Instruction & Library (6 | 6.5%).
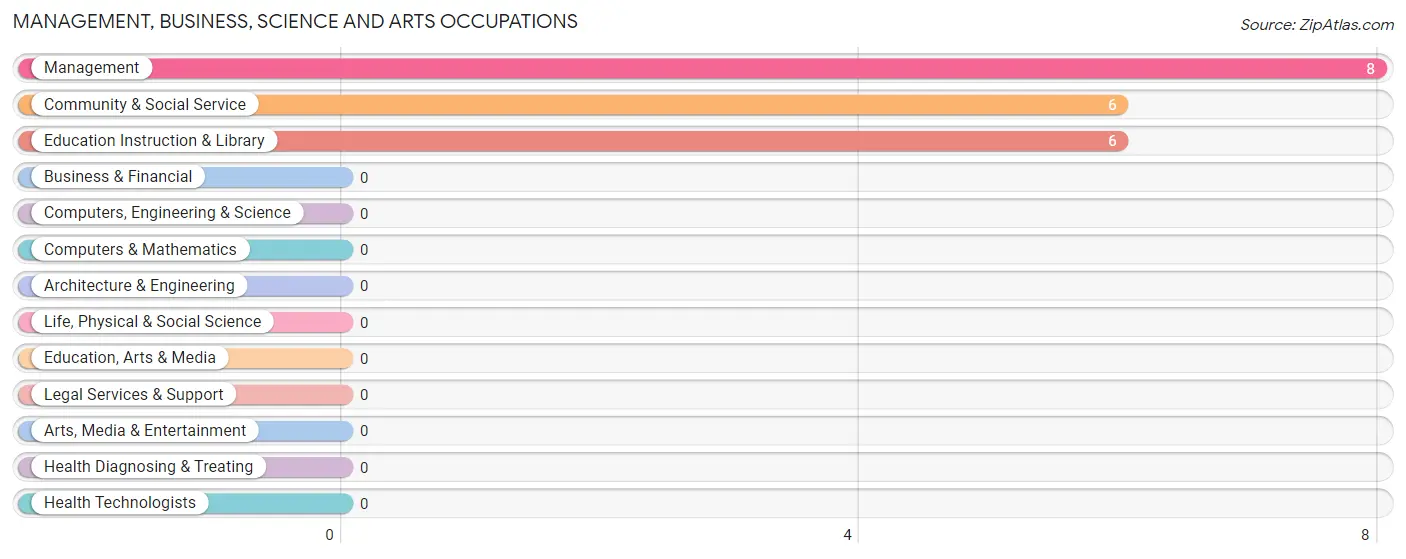
Management, Business, Science and Arts Occupations by Sex
| Occupation | Male | Female |
| Management | 0 (0.0%) | 8 (100.0%) |
| Business & Financial | 0 (0.0%) | 0 (0.0%) |
| Computers, Engineering & Science | 0 (0.0%) | 0 (0.0%) |
| Computers & Mathematics | 0 (0.0%) | 0 (0.0%) |
| Architecture & Engineering | 0 (0.0%) | 0 (0.0%) |
| Life, Physical & Social Science | 0 (0.0%) | 0 (0.0%) |
| Community & Social Service | 6 (100.0%) | 0 (0.0%) |
| Education, Arts & Media | 0 (0.0%) | 0 (0.0%) |
| Legal Services & Support | 0 (0.0%) | 0 (0.0%) |
| Education Instruction & Library | 6 (100.0%) | 0 (0.0%) |
| Arts, Media & Entertainment | 0 (0.0%) | 0 (0.0%) |
| Health Diagnosing & Treating | 0 (0.0%) | 0 (0.0%) |
| Health Technologists | 0 (0.0%) | 0 (0.0%) |
| Total (Category) | 6 (42.9%) | 8 (57.1%) |
| Total (Overall) | 75 (81.5%) | 17 (18.5%) |
Services Occupations
The most common Services occupations in Grenada are Food Preparation & Serving (20 | 21.7%), Security & Protection (19 | 20.6%), and Firefighting & Prevention (19 | 20.6%).
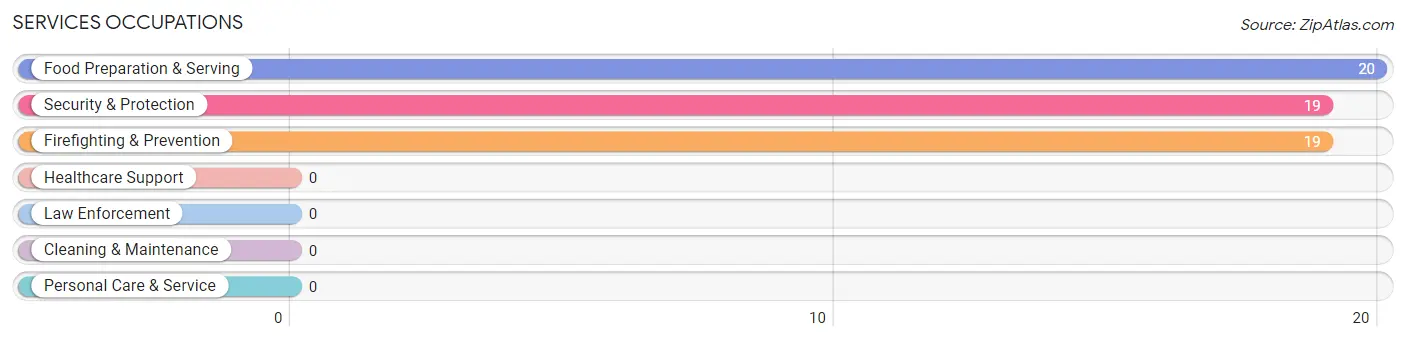
Services Occupations by Sex
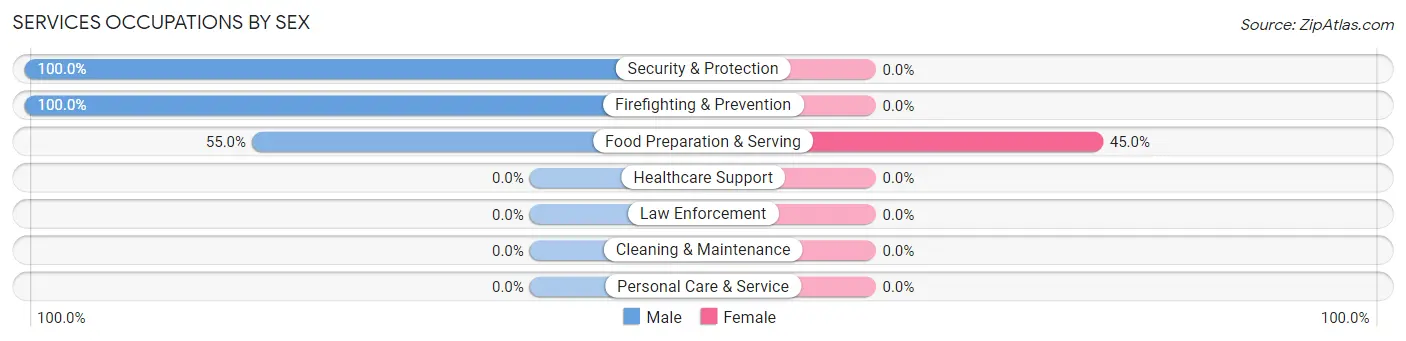
| Occupation | Male | Female |
| Healthcare Support | 0 (0.0%) | 0 (0.0%) |
| Security & Protection | 19 (100.0%) | 0 (0.0%) |
| Firefighting & Prevention | 19 (100.0%) | 0 (0.0%) |
| Law Enforcement | 0 (0.0%) | 0 (0.0%) |
| Food Preparation & Serving | 11 (55.0%) | 9 (45.0%) |
| Cleaning & Maintenance | 0 (0.0%) | 0 (0.0%) |
| Personal Care & Service | 0 (0.0%) | 0 (0.0%) |
| Total (Category) | 30 (76.9%) | 9 (23.1%) |
| Total (Overall) | 75 (81.5%) | 17 (18.5%) |
Sales and Office Occupations
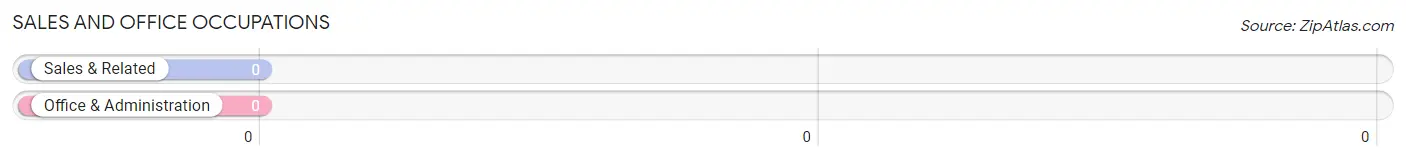
Sales and Office Occupations by Sex
| Occupation | Male | Female |
| Sales & Related | 0 (0.0%) | 0 (0.0%) |
| Office & Administration | 0 (0.0%) | 0 (0.0%) |
| Total (Category) | 0 (0.0%) | 0 (0.0%) |
| Total (Overall) | 75 (81.5%) | 17 (18.5%) |
Natural Resources, Construction and Maintenance Occupations
The most common Natural Resources, Construction and Maintenance occupations in Grenada are , and Construction & Extraction (11 | 12.0%).
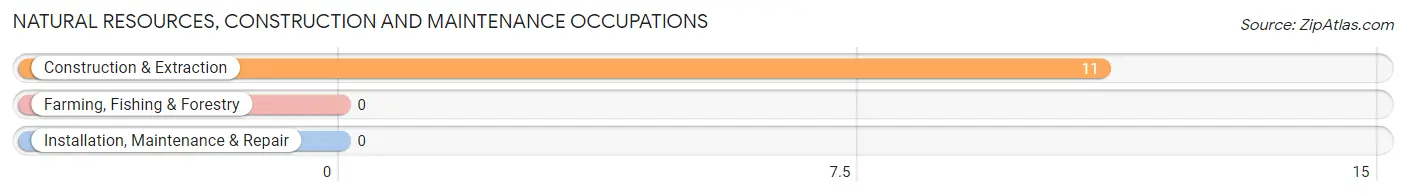
Natural Resources, Construction and Maintenance Occupations by Sex
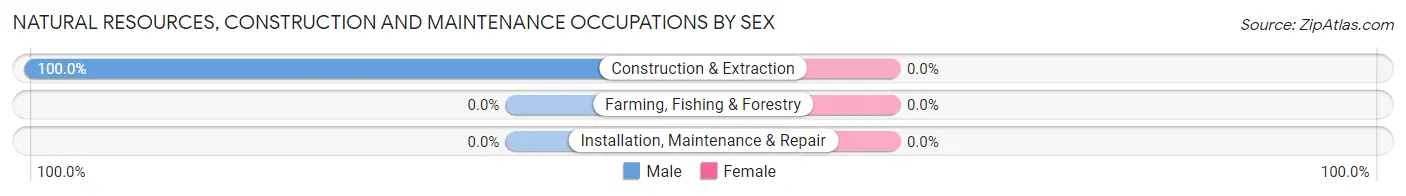
| Occupation | Male | Female |
| Farming, Fishing & Forestry | 0 (0.0%) | 0 (0.0%) |
| Construction & Extraction | 11 (100.0%) | 0 (0.0%) |
| Installation, Maintenance & Repair | 0 (0.0%) | 0 (0.0%) |
| Total (Category) | 11 (100.0%) | 0 (0.0%) |
| Total (Overall) | 75 (81.5%) | 17 (18.5%) |
Production, Transportation and Moving Occupations
The most common Production, Transportation and Moving occupations in Grenada are , and Transportation (28 | 30.4%).
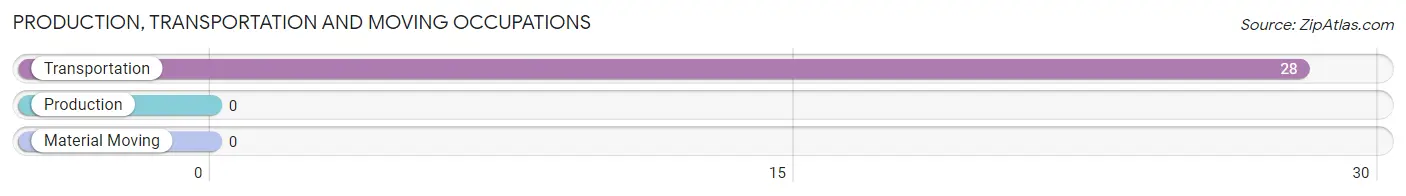
Production, Transportation and Moving Occupations by Sex
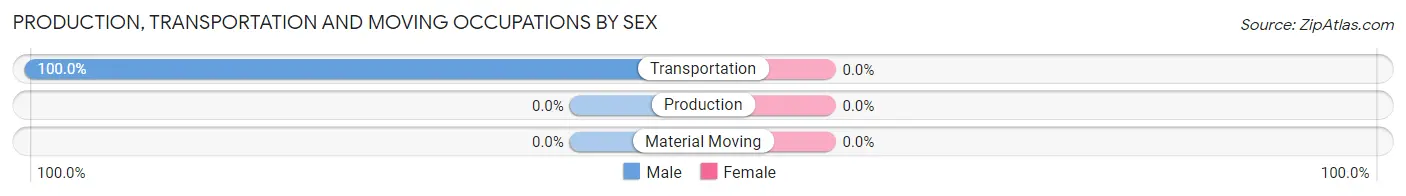
| Occupation | Male | Female |
| Production | 0 (0.0%) | 0 (0.0%) |
| Transportation | 28 (100.0%) | 0 (0.0%) |
| Material Moving | 0 (0.0%) | 0 (0.0%) |
| Total (Category) | 28 (100.0%) | 0 (0.0%) |
| Total (Overall) | 75 (81.5%) | 17 (18.5%) |
Employment Industries by Sex in Grenada
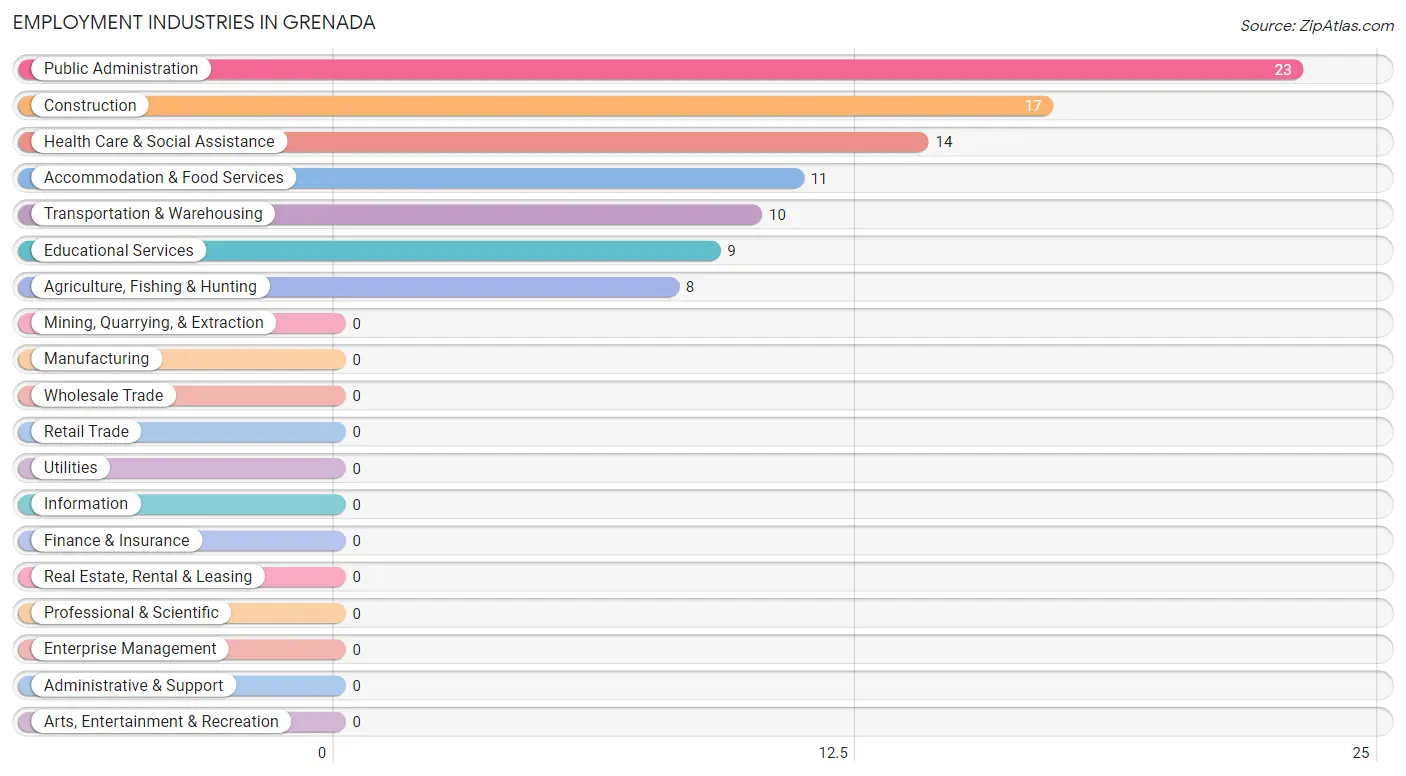
Employment Industries in Grenada
The major employment industries in Grenada include Public Administration (23 | 25.0%), Construction (17 | 18.5%), Health Care & Social Assistance (14 | 15.2%), Accommodation & Food Services (11 | 12.0%), and Transportation & Warehousing (10 | 10.9%).
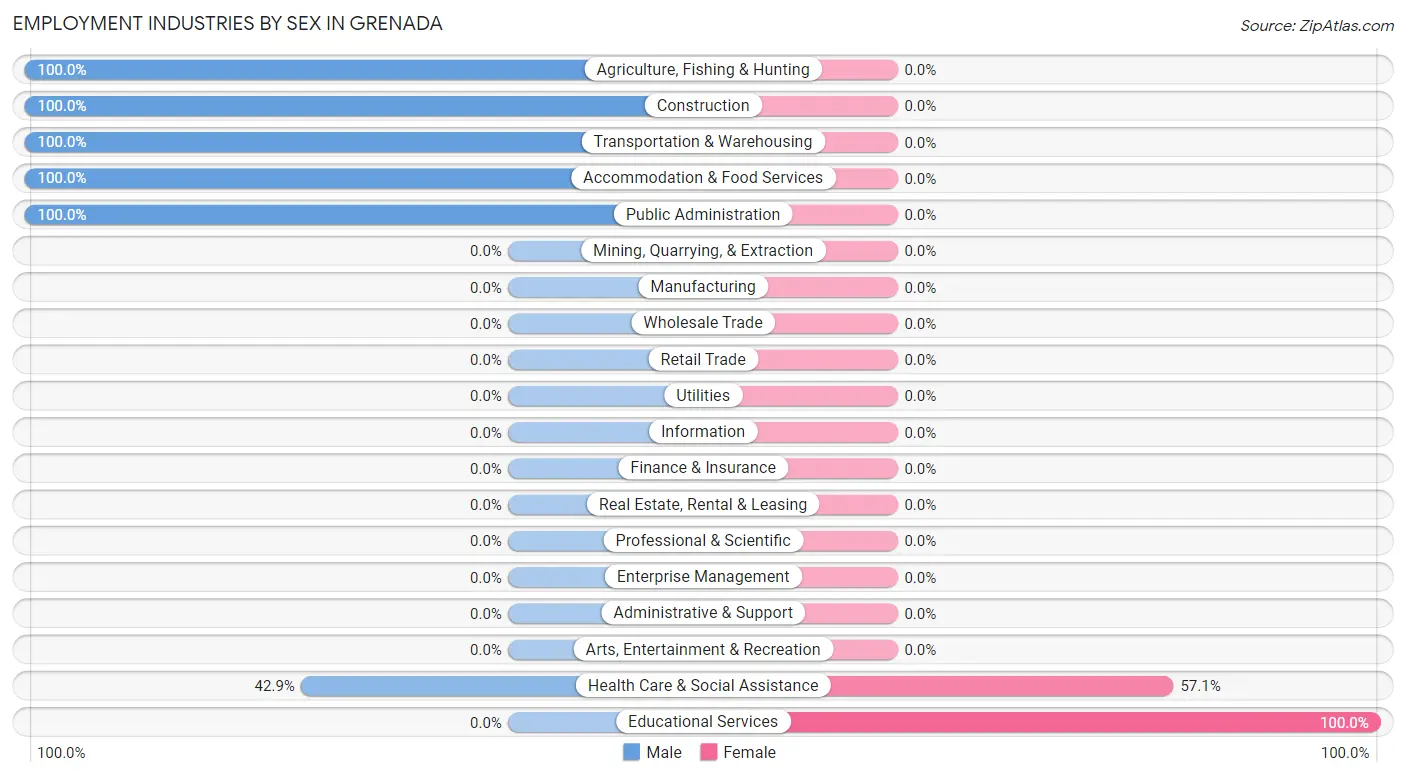
Employment Industries by Sex in Grenada
The Grenada industries that see more men than women are Agriculture, Fishing & Hunting (100.0%), Construction (100.0%), and Transportation & Warehousing (100.0%), whereas the industries that tend to have a higher number of women are Educational Services (100.0%), and Health Care & Social Assistance (57.1%).
| Industry | Male | Female |
| Agriculture, Fishing & Hunting | 8 (100.0%) | 0 (0.0%) |
| Mining, Quarrying, & Extraction | 0 (0.0%) | 0 (0.0%) |
| Construction | 17 (100.0%) | 0 (0.0%) |
| Manufacturing | 0 (0.0%) | 0 (0.0%) |
| Wholesale Trade | 0 (0.0%) | 0 (0.0%) |
| Retail Trade | 0 (0.0%) | 0 (0.0%) |
| Transportation & Warehousing | 10 (100.0%) | 0 (0.0%) |
| Utilities | 0 (0.0%) | 0 (0.0%) |
| Information | 0 (0.0%) | 0 (0.0%) |
| Finance & Insurance | 0 (0.0%) | 0 (0.0%) |
| Real Estate, Rental & Leasing | 0 (0.0%) | 0 (0.0%) |
| Professional & Scientific | 0 (0.0%) | 0 (0.0%) |
| Enterprise Management | 0 (0.0%) | 0 (0.0%) |
| Administrative & Support | 0 (0.0%) | 0 (0.0%) |
| Educational Services | 0 (0.0%) | 9 (100.0%) |
| Health Care & Social Assistance | 6 (42.9%) | 8 (57.1%) |
| Arts, Entertainment & Recreation | 0 (0.0%) | 0 (0.0%) |
| Accommodation & Food Services | 11 (100.0%) | 0 (0.0%) |
| Public Administration | 23 (100.0%) | 0 (0.0%) |
| Total | 75 (81.5%) | 17 (18.5%) |
Education in Grenada
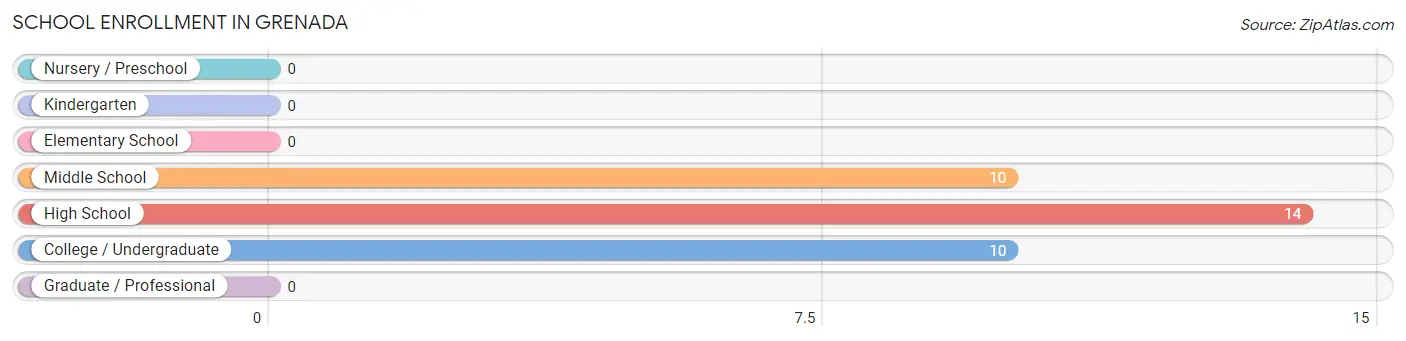
School Enrollment in Grenada
The most common levels of schooling among the 34 students in Grenada are high school (14 | 41.2%), middle school (10 | 29.4%), and college / undergraduate (10 | 29.4%).
| School Level | # Students | % Students |
| Nursery / Preschool | 0 | 0.0% |
| Kindergarten | 0 | 0.0% |
| Elementary School | 0 | 0.0% |
| Middle School | 10 | 29.4% |
| High School | 14 | 41.2% |
| College / Undergraduate | 10 | 29.4% |
| Graduate / Professional | 0 | 0.0% |
| Total | 34 | 100.0% |
School Enrollment by Age by Funding Source in Grenada
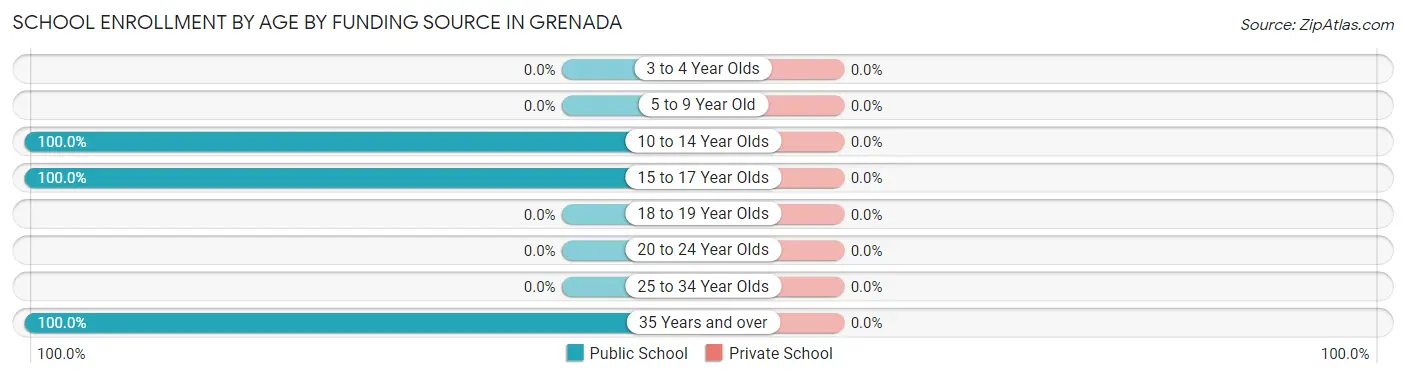
| Age Bracket | Public School | Private School |
| 3 to 4 Year Olds | 0 (0.0%) | 0 (0.0%) |
| 5 to 9 Year Old | 0 (0.0%) | 0 (0.0%) |
| 10 to 14 Year Olds | 10 (100.0%) | 0 (0.0%) |
| 15 to 17 Year Olds | 14 (100.0%) | 0 (0.0%) |
| 18 to 19 Year Olds | 0 (0.0%) | 0 (0.0%) |
| 20 to 24 Year Olds | 0 (0.0%) | 0 (0.0%) |
| 25 to 34 Year Olds | 0 (0.0%) | 0 (0.0%) |
| 35 Years and over | 10 (100.0%) | 0 (0.0%) |
| Total | 34 (100.0%) | 0 (0.0%) |
Educational Attainment by Field of Study in Grenada
Education (20 | 48.8%), bio, nature & agricultural (13 | 31.7%), and arts & humanities (8 | 19.5%) are the most common fields of study among 41 individuals in Grenada who have obtained a bachelor's degree or higher.
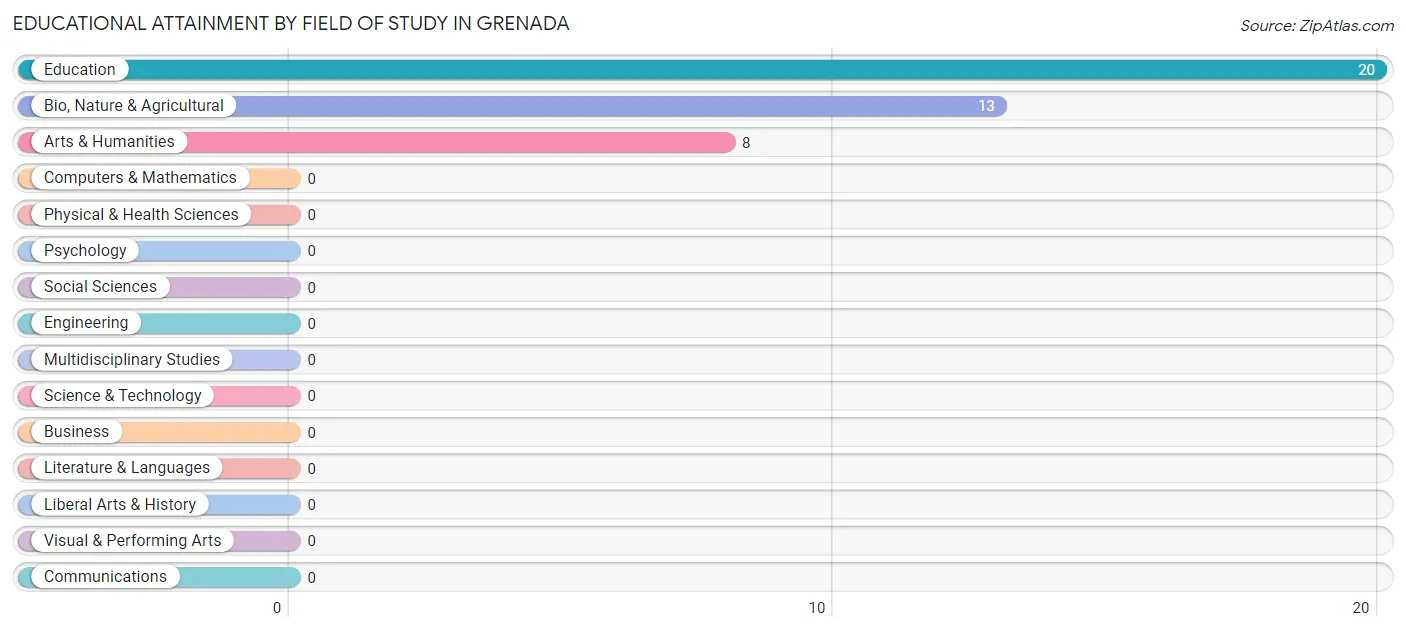
| Field of Study | # Graduates | % Graduates |
| Computers & Mathematics | 0 | 0.0% |
| Bio, Nature & Agricultural | 13 | 31.7% |
| Physical & Health Sciences | 0 | 0.0% |
| Psychology | 0 | 0.0% |
| Social Sciences | 0 | 0.0% |
| Engineering | 0 | 0.0% |
| Multidisciplinary Studies | 0 | 0.0% |
| Science & Technology | 0 | 0.0% |
| Business | 0 | 0.0% |
| Education | 20 | 48.8% |
| Literature & Languages | 0 | 0.0% |
| Liberal Arts & History | 0 | 0.0% |
| Visual & Performing Arts | 0 | 0.0% |
| Communications | 0 | 0.0% |
| Arts & Humanities | 8 | 19.5% |
| Total | 41 | 100.0% |
Transportation & Commute in Grenada
Vehicle Availability by Sex in Grenada
The most prevalent vehicle ownership categories in Grenada are males with 2 vehicles (63, accounting for 84.0%) and females with 2 vehicles (17, making up 370.6%).
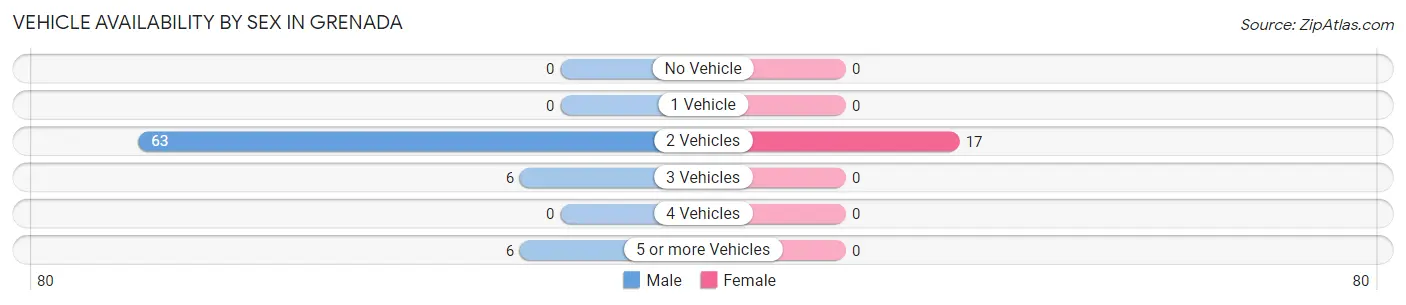
| Vehicles Available | Male | Female |
| No Vehicle | 0 (0.0%) | 0 (0.0%) |
| 1 Vehicle | 0 (0.0%) | 0 (0.0%) |
| 2 Vehicles | 63 (84.0%) | 17 (100.0%) |
| 3 Vehicles | 6 (8.0%) | 0 (0.0%) |
| 4 Vehicles | 0 (0.0%) | 0 (0.0%) |
| 5 or more Vehicles | 6 (8.0%) | 0 (0.0%) |
| Total | 75 (100.0%) | 17 (100.0%) |
Commute Time in Grenada
The most frequently occuring commute durations in Grenada are 15 to 19 minutes (30 commuters, 32.6%), 20 to 24 minutes (21 commuters, 22.8%), and 10 to 14 minutes (14 commuters, 15.2%).
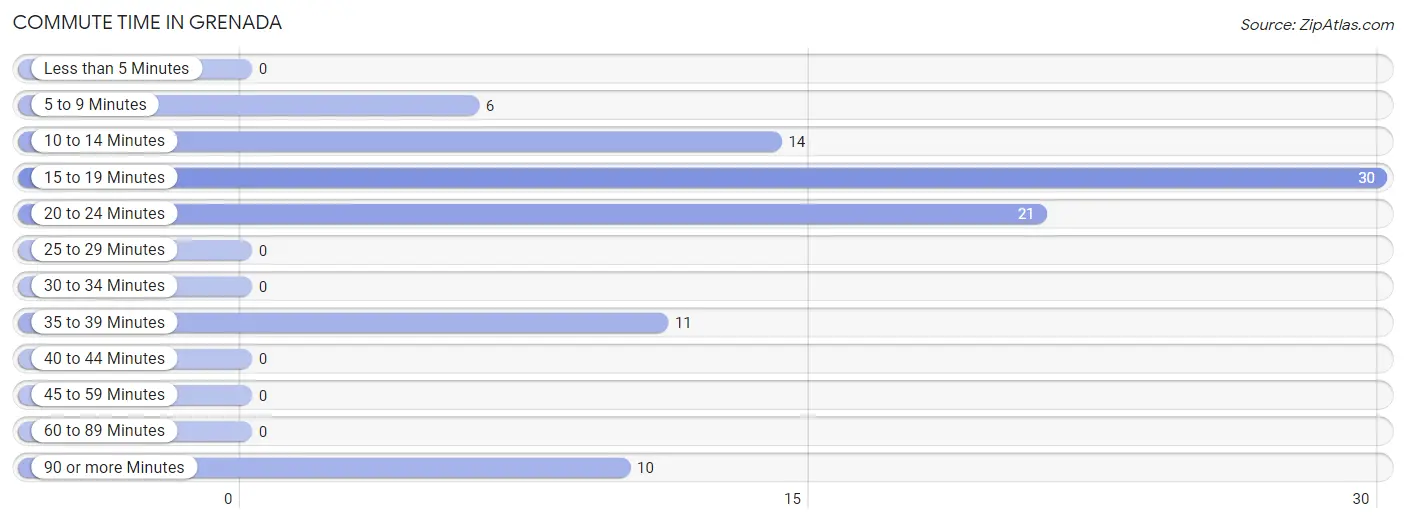
| Commute Time | # Commuters | % Commuters |
| Less than 5 Minutes | 0 | 0.0% |
| 5 to 9 Minutes | 6 | 6.5% |
| 10 to 14 Minutes | 14 | 15.2% |
| 15 to 19 Minutes | 30 | 32.6% |
| 20 to 24 Minutes | 21 | 22.8% |
| 25 to 29 Minutes | 0 | 0.0% |
| 30 to 34 Minutes | 0 | 0.0% |
| 35 to 39 Minutes | 11 | 12.0% |
| 40 to 44 Minutes | 0 | 0.0% |
| 45 to 59 Minutes | 0 | 0.0% |
| 60 to 89 Minutes | 0 | 0.0% |
| 90 or more Minutes | 10 | 10.9% |
Commute Time by Sex in Grenada
The most common commute times in Grenada are 15 to 19 minutes (21 commuters, 28.0%) for males and 15 to 19 minutes (9 commuters, 52.9%) for females.
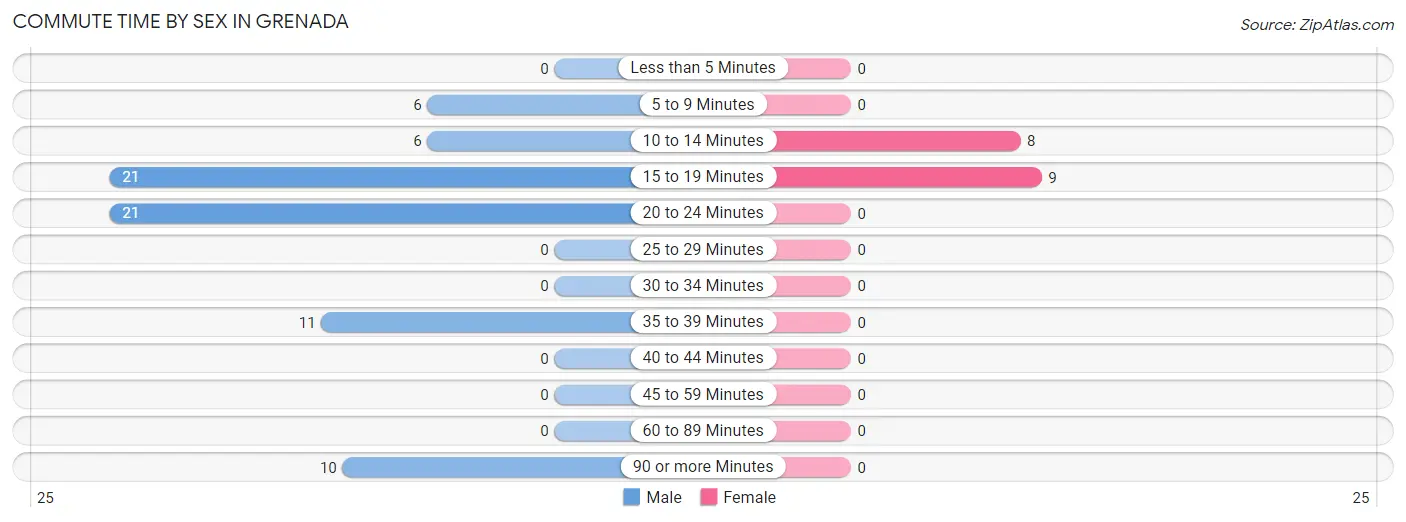
| Commute Time | Male | Female |
| Less than 5 Minutes | 0 (0.0%) | 0 (0.0%) |
| 5 to 9 Minutes | 6 (8.0%) | 0 (0.0%) |
| 10 to 14 Minutes | 6 (8.0%) | 8 (47.1%) |
| 15 to 19 Minutes | 21 (28.0%) | 9 (52.9%) |
| 20 to 24 Minutes | 21 (28.0%) | 0 (0.0%) |
| 25 to 29 Minutes | 0 (0.0%) | 0 (0.0%) |
| 30 to 34 Minutes | 0 (0.0%) | 0 (0.0%) |
| 35 to 39 Minutes | 11 (14.7%) | 0 (0.0%) |
| 40 to 44 Minutes | 0 (0.0%) | 0 (0.0%) |
| 45 to 59 Minutes | 0 (0.0%) | 0 (0.0%) |
| 60 to 89 Minutes | 0 (0.0%) | 0 (0.0%) |
| 90 or more Minutes | 10 (13.3%) | 0 (0.0%) |
Time of Departure to Work by Sex in Grenada
The most frequent times of departure to work in Grenada are 7:30 AM to 7:59 AM (23, 30.7%) for males and 4:00 PM to 11:59 PM (9, 52.9%) for females.
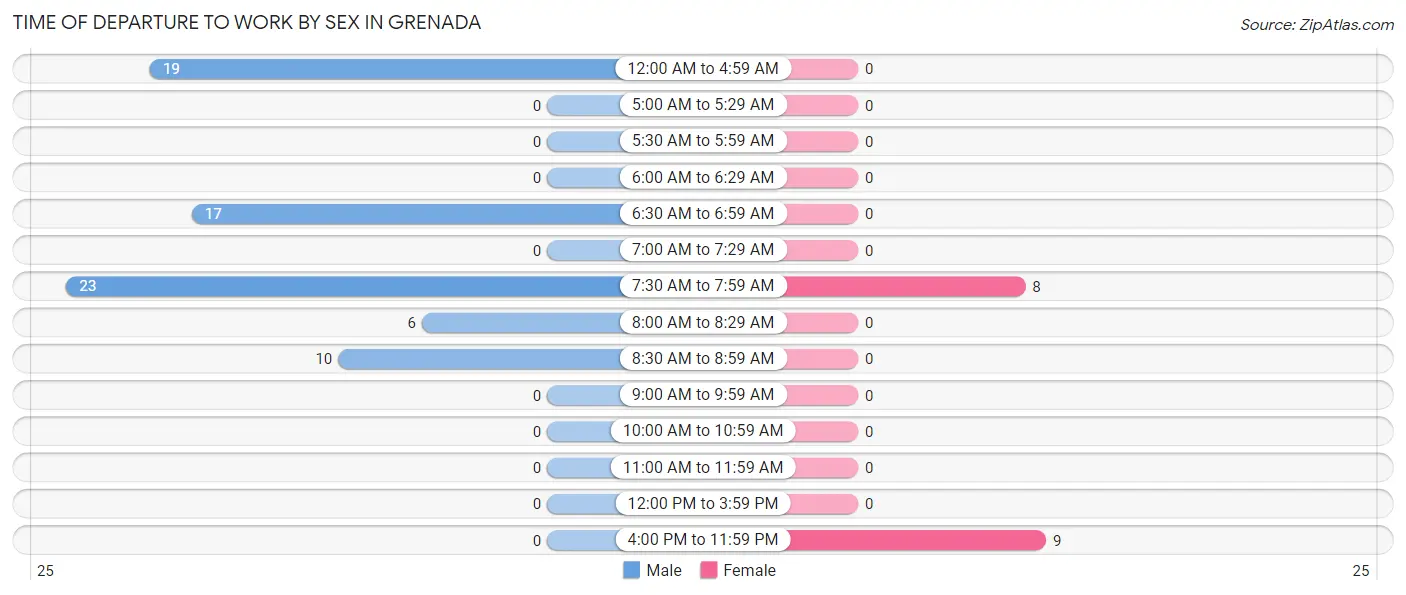
| Time of Departure | Male | Female |
| 12:00 AM to 4:59 AM | 19 (25.3%) | 0 (0.0%) |
| 5:00 AM to 5:29 AM | 0 (0.0%) | 0 (0.0%) |
| 5:30 AM to 5:59 AM | 0 (0.0%) | 0 (0.0%) |
| 6:00 AM to 6:29 AM | 0 (0.0%) | 0 (0.0%) |
| 6:30 AM to 6:59 AM | 17 (22.7%) | 0 (0.0%) |
| 7:00 AM to 7:29 AM | 0 (0.0%) | 0 (0.0%) |
| 7:30 AM to 7:59 AM | 23 (30.7%) | 8 (47.1%) |
| 8:00 AM to 8:29 AM | 6 (8.0%) | 0 (0.0%) |
| 8:30 AM to 8:59 AM | 10 (13.3%) | 0 (0.0%) |
| 9:00 AM to 9:59 AM | 0 (0.0%) | 0 (0.0%) |
| 10:00 AM to 10:59 AM | 0 (0.0%) | 0 (0.0%) |
| 11:00 AM to 11:59 AM | 0 (0.0%) | 0 (0.0%) |
| 12:00 PM to 3:59 PM | 0 (0.0%) | 0 (0.0%) |
| 4:00 PM to 11:59 PM | 0 (0.0%) | 9 (52.9%) |
| Total | 75 (100.0%) | 17 (100.0%) |
Housing Occupancy in Grenada
Occupancy by Ownership in Grenada
Of the total 121 dwellings in Grenada, owner-occupied units account for 70 (57.9%), while renter-occupied units make up 51 (42.1%).
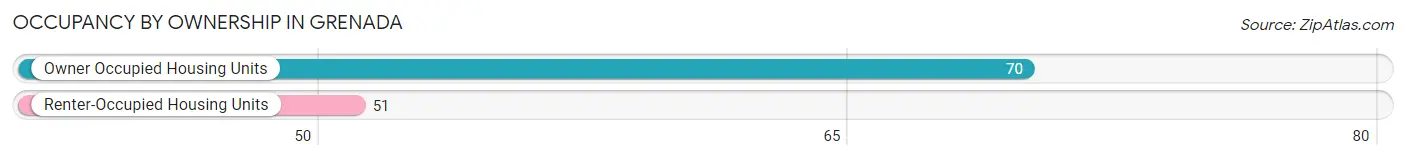
| Occupancy | # Housing Units | % Housing Units |
| Owner Occupied Housing Units | 70 | 57.9% |
| Renter-Occupied Housing Units | 51 | 42.1% |
| Total Occupied Housing Units | 121 | 100.0% |
Occupancy by Household Size in Grenada
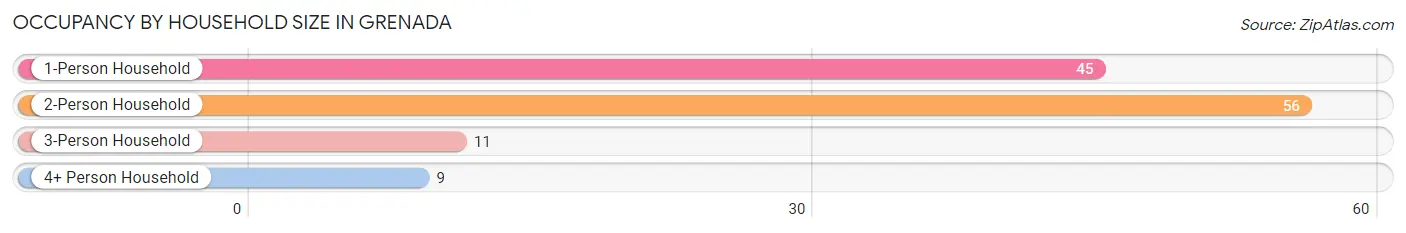
| Household Size | # Housing Units | % Housing Units |
| 1-Person Household | 45 | 37.2% |
| 2-Person Household | 56 | 46.3% |
| 3-Person Household | 11 | 9.1% |
| 4+ Person Household | 9 | 7.4% |
| Total Housing Units | 121 | 100.0% |
Occupancy by Ownership by Household Size in Grenada
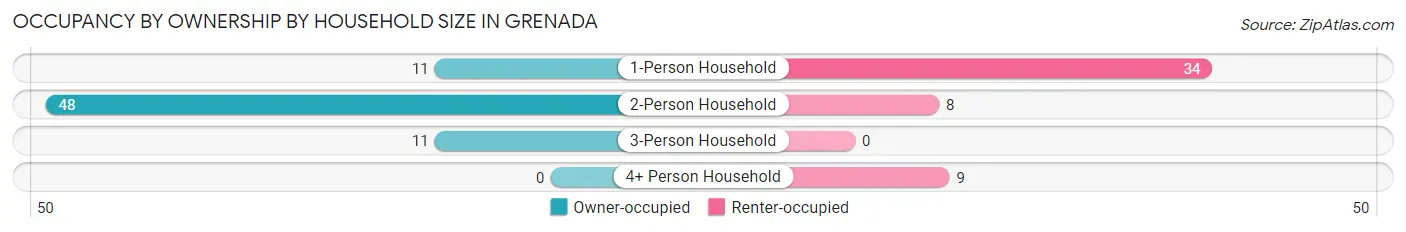
| Household Size | Owner-occupied | Renter-occupied |
| 1-Person Household | 11 (24.4%) | 34 (75.6%) |
| 2-Person Household | 48 (85.7%) | 8 (14.3%) |
| 3-Person Household | 11 (100.0%) | 0 (0.0%) |
| 4+ Person Household | 0 (0.0%) | 9 (100.0%) |
| Total Housing Units | 70 (57.9%) | 51 (42.1%) |
Occupancy by Educational Attainment in Grenada
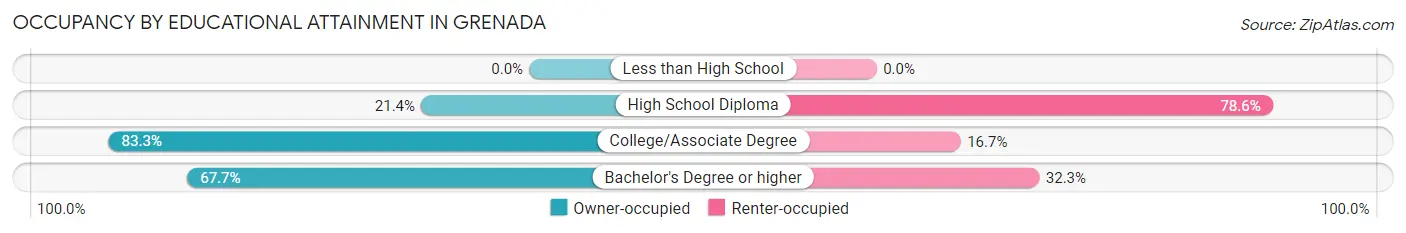
| Household Size | Owner-occupied | Renter-occupied |
| Less than High School | 0 (0.0%) | 0 (0.0%) |
| High School Diploma | 9 (21.4%) | 33 (78.6%) |
| College/Associate Degree | 40 (83.3%) | 8 (16.7%) |
| Bachelor's Degree or higher | 21 (67.7%) | 10 (32.3%) |
Occupancy by Age of Householder in Grenada
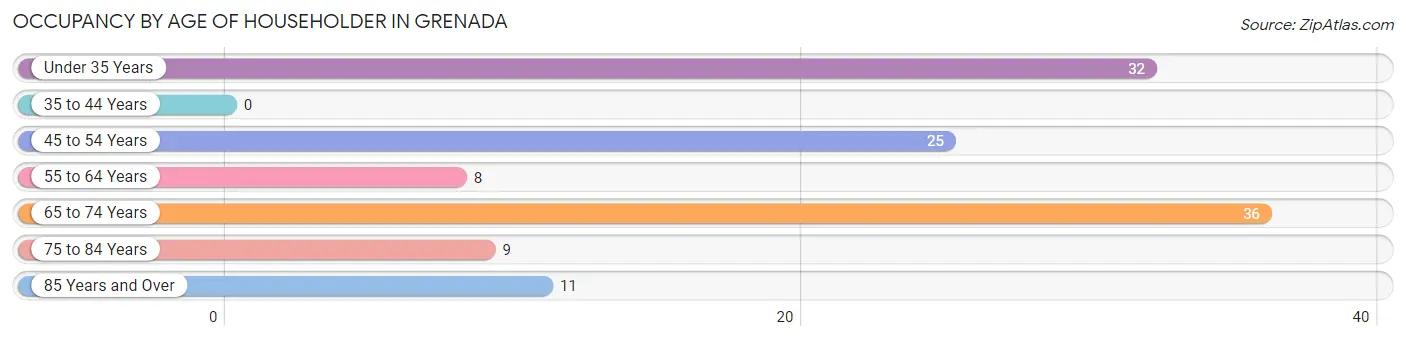
| Age Bracket | # Households | % Households |
| Under 35 Years | 32 | 26.5% |
| 35 to 44 Years | 0 | 0.0% |
| 45 to 54 Years | 25 | 20.7% |
| 55 to 64 Years | 8 | 6.6% |
| 65 to 74 Years | 36 | 29.7% |
| 75 to 84 Years | 9 | 7.4% |
| 85 Years and Over | 11 | 9.1% |
| Total | 121 | 100.0% |
Housing Finances in Grenada
Median Income by Occupancy in Grenada
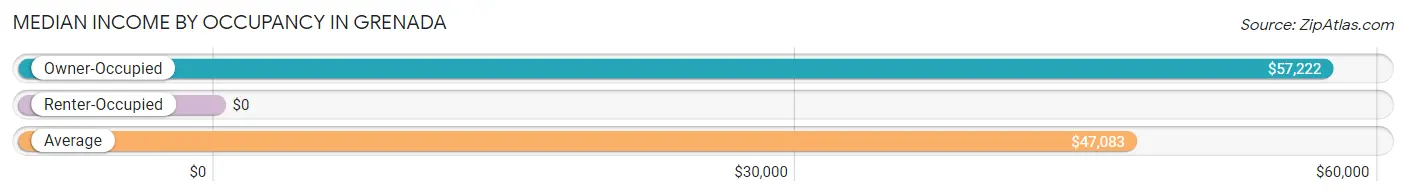
| Occupancy Type | # Households | Median Income |
| Owner-Occupied | 70 (57.9%) | $57,222 |
| Renter-Occupied | 51 (42.1%) | $0 |
| Average | 121 (100.0%) | $47,083 |
Occupancy by Householder Income Bracket in Grenada
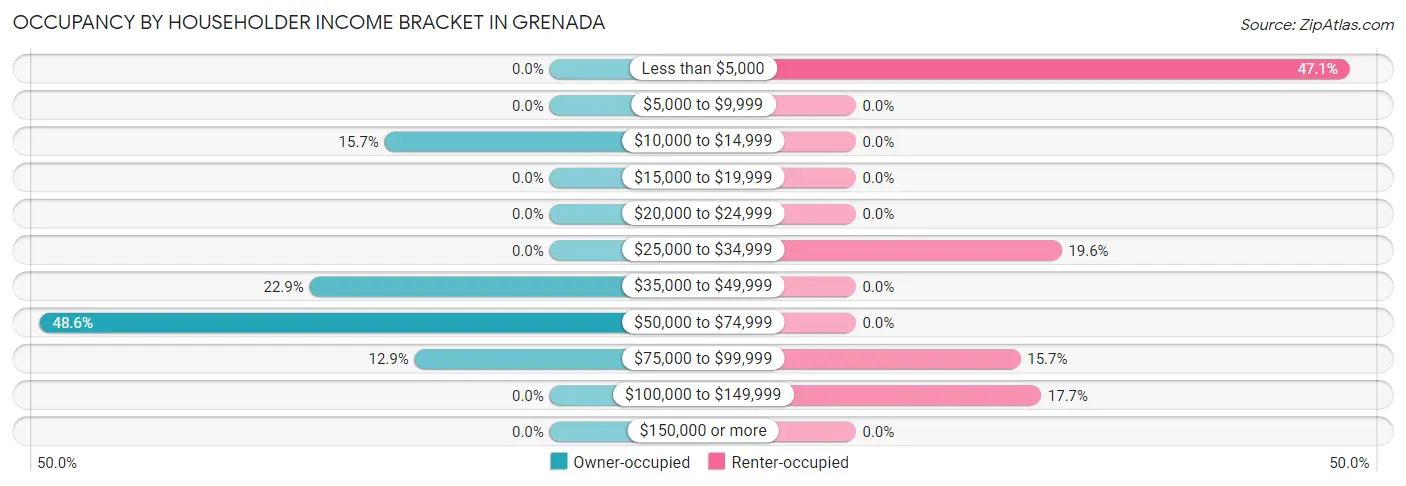
| Income Bracket | Owner-occupied | Renter-occupied |
| Less than $5,000 | 0 (0.0%) | 24 (47.1%) |
| $5,000 to $9,999 | 0 (0.0%) | 0 (0.0%) |
| $10,000 to $14,999 | 11 (15.7%) | 0 (0.0%) |
| $15,000 to $19,999 | 0 (0.0%) | 0 (0.0%) |
| $20,000 to $24,999 | 0 (0.0%) | 0 (0.0%) |
| $25,000 to $34,999 | 0 (0.0%) | 10 (19.6%) |
| $35,000 to $49,999 | 16 (22.9%) | 0 (0.0%) |
| $50,000 to $74,999 | 34 (48.6%) | 0 (0.0%) |
| $75,000 to $99,999 | 9 (12.9%) | 8 (15.7%) |
| $100,000 to $149,999 | 0 (0.0%) | 9 (17.6%) |
| $150,000 or more | 0 (0.0%) | 0 (0.0%) |
| Total | 70 (100.0%) | 51 (100.0%) |
Monthly Housing Cost Tiers in Grenada
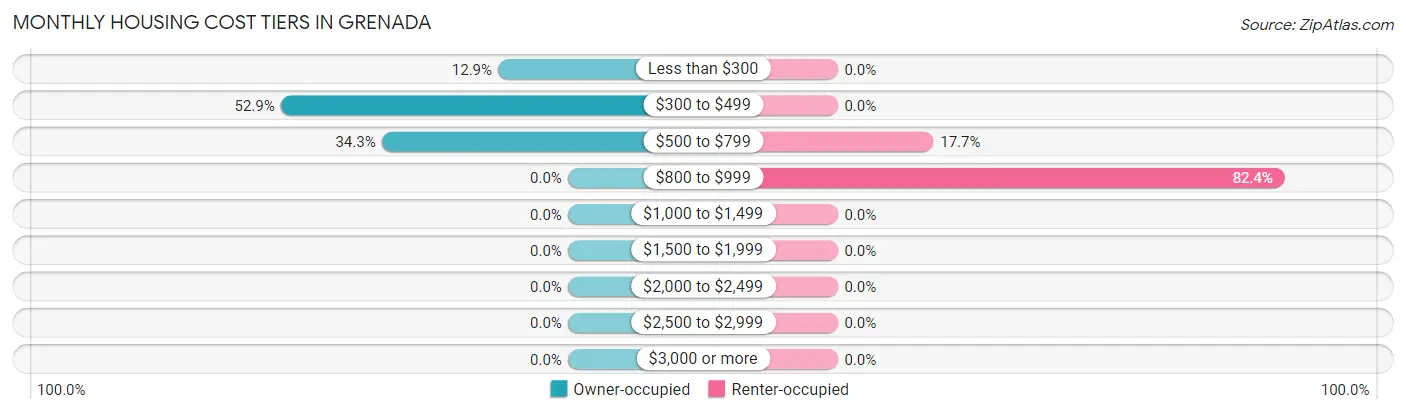
| Monthly Cost | Owner-occupied | Renter-occupied |
| Less than $300 | 9 (12.9%) | 0 (0.0%) |
| $300 to $499 | 37 (52.9%) | 0 (0.0%) |
| $500 to $799 | 24 (34.3%) | 9 (17.6%) |
| $800 to $999 | 0 (0.0%) | 42 (82.4%) |
| $1,000 to $1,499 | 0 (0.0%) | 0 (0.0%) |
| $1,500 to $1,999 | 0 (0.0%) | 0 (0.0%) |
| $2,000 to $2,499 | 0 (0.0%) | 0 (0.0%) |
| $2,500 to $2,999 | 0 (0.0%) | 0 (0.0%) |
| $3,000 or more | 0 (0.0%) | 0 (0.0%) |
| Total | 70 (100.0%) | 51 (100.0%) |
Physical Housing Characteristics in Grenada
Housing Structures in Grenada
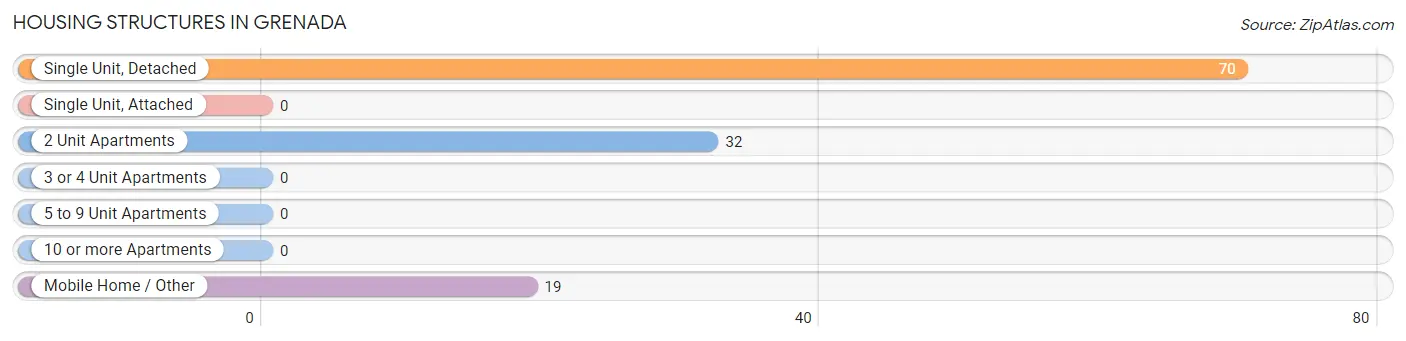
| Structure Type | # Housing Units | % Housing Units |
| Single Unit, Detached | 70 | 57.9% |
| Single Unit, Attached | 0 | 0.0% |
| 2 Unit Apartments | 32 | 26.5% |
| 3 or 4 Unit Apartments | 0 | 0.0% |
| 5 to 9 Unit Apartments | 0 | 0.0% |
| 10 or more Apartments | 0 | 0.0% |
| Mobile Home / Other | 19 | 15.7% |
| Total | 121 | 100.0% |
Housing Structures by Occupancy in Grenada
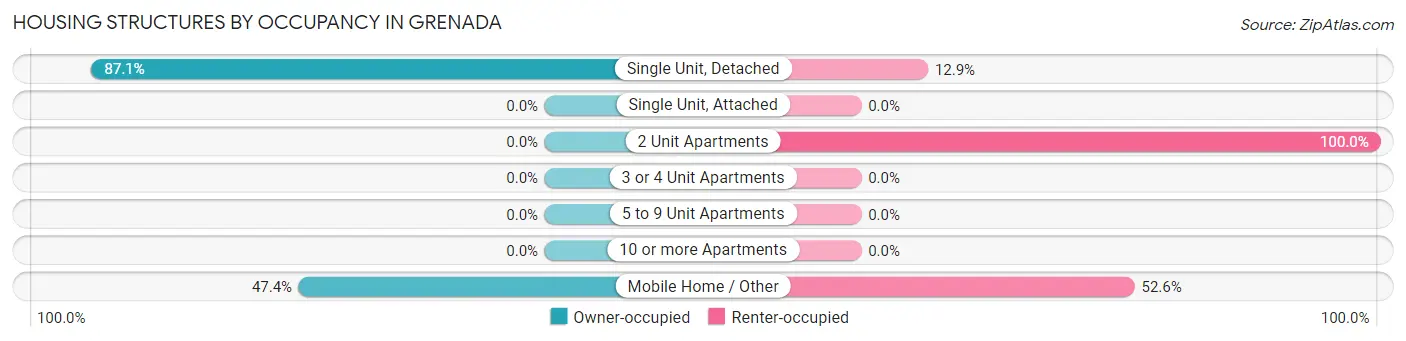
| Structure Type | Owner-occupied | Renter-occupied |
| Single Unit, Detached | 61 (87.1%) | 9 (12.9%) |
| Single Unit, Attached | 0 (0.0%) | 0 (0.0%) |
| 2 Unit Apartments | 0 (0.0%) | 32 (100.0%) |
| 3 or 4 Unit Apartments | 0 (0.0%) | 0 (0.0%) |
| 5 to 9 Unit Apartments | 0 (0.0%) | 0 (0.0%) |
| 10 or more Apartments | 0 (0.0%) | 0 (0.0%) |
| Mobile Home / Other | 9 (47.4%) | 10 (52.6%) |
| Total | 70 (57.9%) | 51 (42.1%) |
Housing Structures by Number of Rooms in Grenada
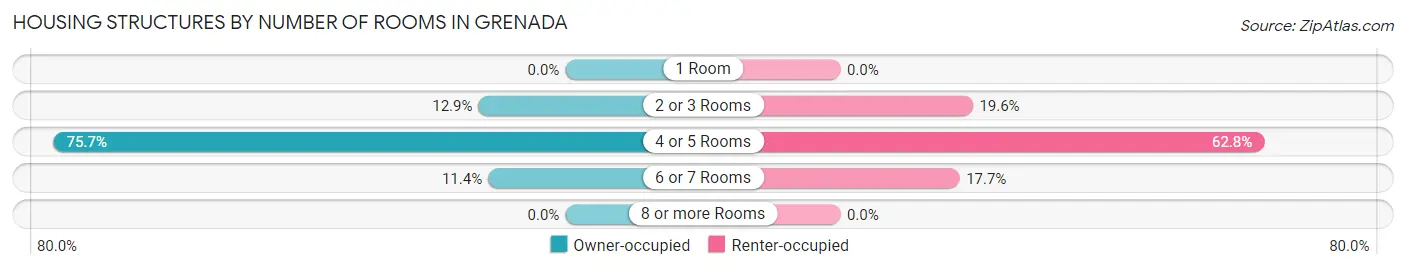
| Number of Rooms | Owner-occupied | Renter-occupied |
| 1 Room | 0 (0.0%) | 0 (0.0%) |
| 2 or 3 Rooms | 9 (12.9%) | 10 (19.6%) |
| 4 or 5 Rooms | 53 (75.7%) | 32 (62.7%) |
| 6 or 7 Rooms | 8 (11.4%) | 9 (17.6%) |
| 8 or more Rooms | 0 (0.0%) | 0 (0.0%) |
| Total | 70 (100.0%) | 51 (100.0%) |
Housing Structure by Heating Type in Grenada
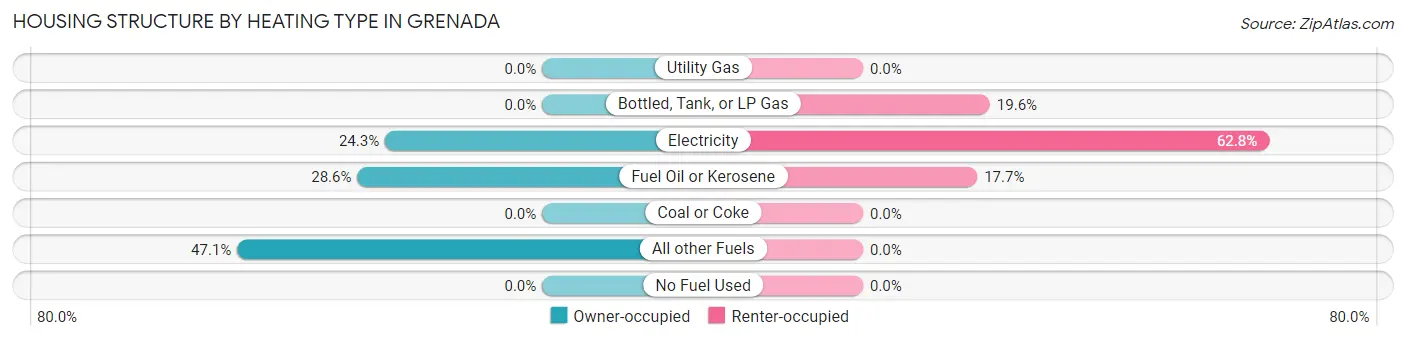
| Heating Type | Owner-occupied | Renter-occupied |
| Utility Gas | 0 (0.0%) | 0 (0.0%) |
| Bottled, Tank, or LP Gas | 0 (0.0%) | 10 (19.6%) |
| Electricity | 17 (24.3%) | 32 (62.7%) |
| Fuel Oil or Kerosene | 20 (28.6%) | 9 (17.6%) |
| Coal or Coke | 0 (0.0%) | 0 (0.0%) |
| All other Fuels | 33 (47.1%) | 0 (0.0%) |
| No Fuel Used | 0 (0.0%) | 0 (0.0%) |
| Total | 70 (100.0%) | 51 (100.0%) |
Household Vehicle Usage in Grenada
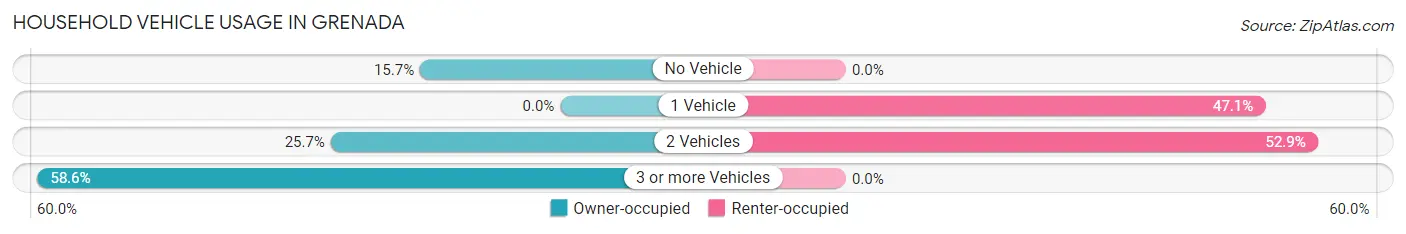
| Vehicles per Household | Owner-occupied | Renter-occupied |
| No Vehicle | 11 (15.7%) | 0 (0.0%) |
| 1 Vehicle | 0 (0.0%) | 24 (47.1%) |
| 2 Vehicles | 18 (25.7%) | 27 (52.9%) |
| 3 or more Vehicles | 41 (58.6%) | 0 (0.0%) |
| Total | 70 (100.0%) | 51 (100.0%) |
Real Estate & Mortgages in Grenada
Real Estate and Mortgage Overview in Grenada
| Characteristic | Without Mortgage | With Mortgage |
| Housing Units | 70 | 0 |
| Median Property Value | $193,800 | $0 |
| Median Household Income | $57,222 | $0 |
| Monthly Housing Costs | $435 | $0 |
| Real Estate Taxes | - | - |
Property Value by Mortgage Status in Grenada
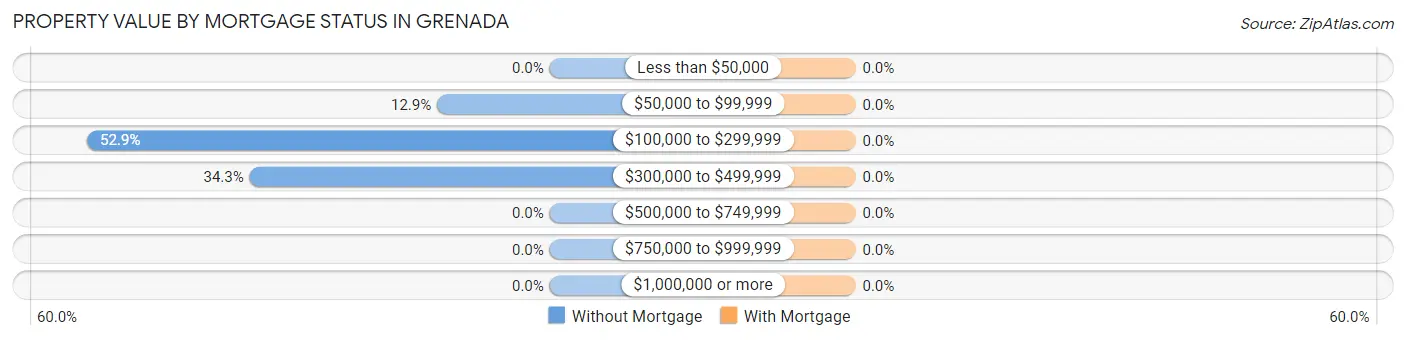
| Property Value | Without Mortgage | With Mortgage |
| Less than $50,000 | 0 (0.0%) | 0 (0.0%) |
| $50,000 to $99,999 | 9 (12.9%) | 0 (0.0%) |
| $100,000 to $299,999 | 37 (52.9%) | 0 (0.0%) |
| $300,000 to $499,999 | 24 (34.3%) | 0 (0.0%) |
| $500,000 to $749,999 | 0 (0.0%) | 0 (0.0%) |
| $750,000 to $999,999 | 0 (0.0%) | 0 (0.0%) |
| $1,000,000 or more | 0 (0.0%) | 0 (0.0%) |
| Total | 70 (100.0%) | 0 (0.0%) |
Household Income by Mortgage Status in Grenada
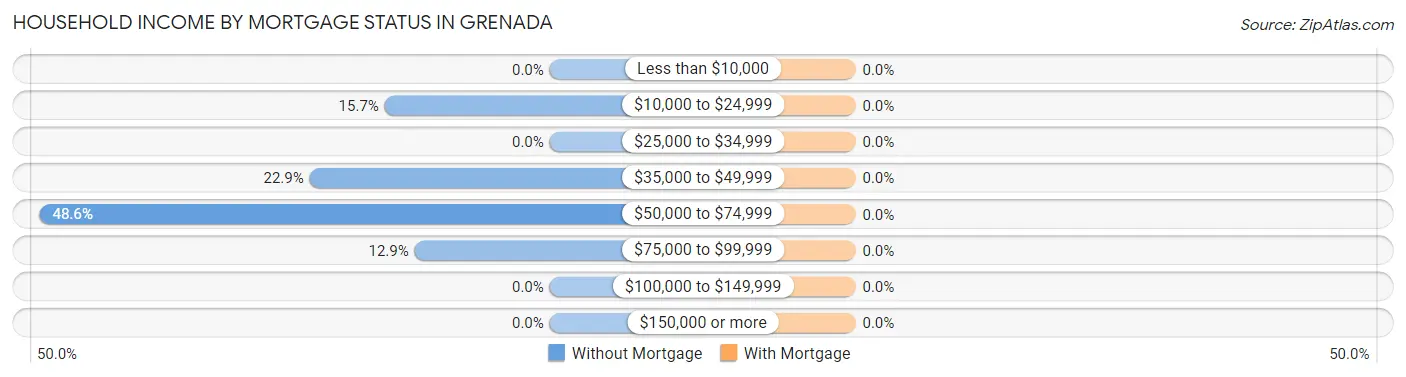
| Household Income | Without Mortgage | With Mortgage |
| Less than $10,000 | 0 (0.0%) | 0 (0.0%) |
| $10,000 to $24,999 | 11 (15.7%) | 0 (0.0%) |
| $25,000 to $34,999 | 0 (0.0%) | 0 (0.0%) |
| $35,000 to $49,999 | 16 (22.9%) | 0 (0.0%) |
| $50,000 to $74,999 | 34 (48.6%) | 0 (0.0%) |
| $75,000 to $99,999 | 9 (12.9%) | 0 (0.0%) |
| $100,000 to $149,999 | 0 (0.0%) | 0 (0.0%) |
| $150,000 or more | 0 (0.0%) | 0 (0.0%) |
| Total | 70 (100.0%) | 0 (0.0%) |
Property Value to Household Income Ratio in Grenada
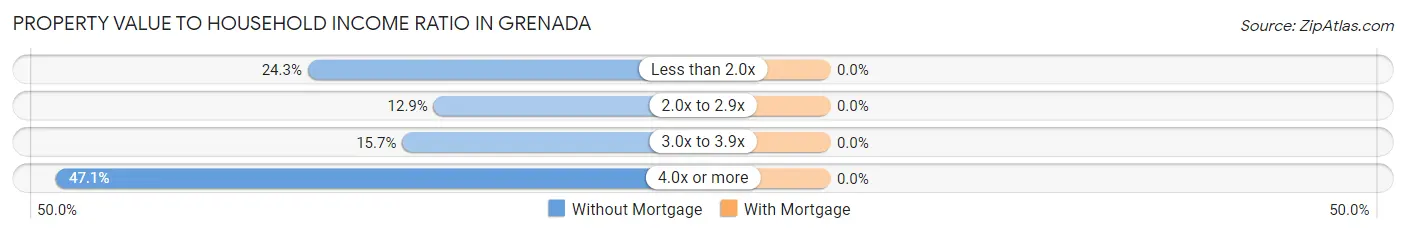
| Value-to-Income Ratio | Without Mortgage | With Mortgage |
| Less than 2.0x | 17 (24.3%) | 0 (0.0%) |
| 2.0x to 2.9x | 9 (12.9%) | 0 (0.0%) |
| 3.0x to 3.9x | 11 (15.7%) | 0 (0.0%) |
| 4.0x or more | 33 (47.1%) | 0 (0.0%) |
| Total | 70 (100.0%) | 0 (0.0%) |
Real Estate Taxes by Mortgage Status in Grenada
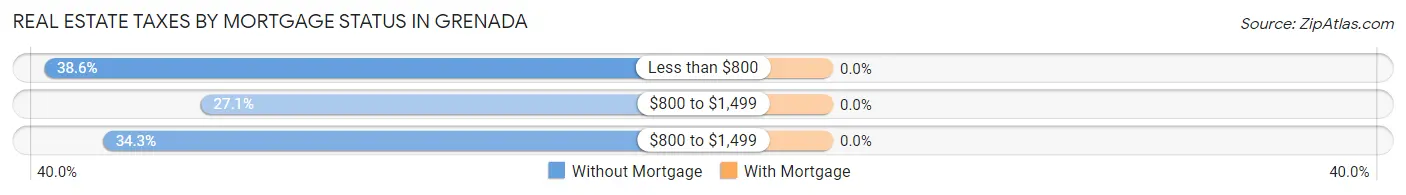
| Property Taxes | Without Mortgage | With Mortgage |
| Less than $800 | 27 (38.6%) | 0 (0.0%) |
| $800 to $1,499 | 19 (27.1%) | 0 (0.0%) |
| $800 to $1,499 | 24 (34.3%) | 0 (0.0%) |
| Total | 70 (100.0%) | 0 (0.0%) |
Health & Disability in Grenada
Health Insurance Coverage by Age in Grenada
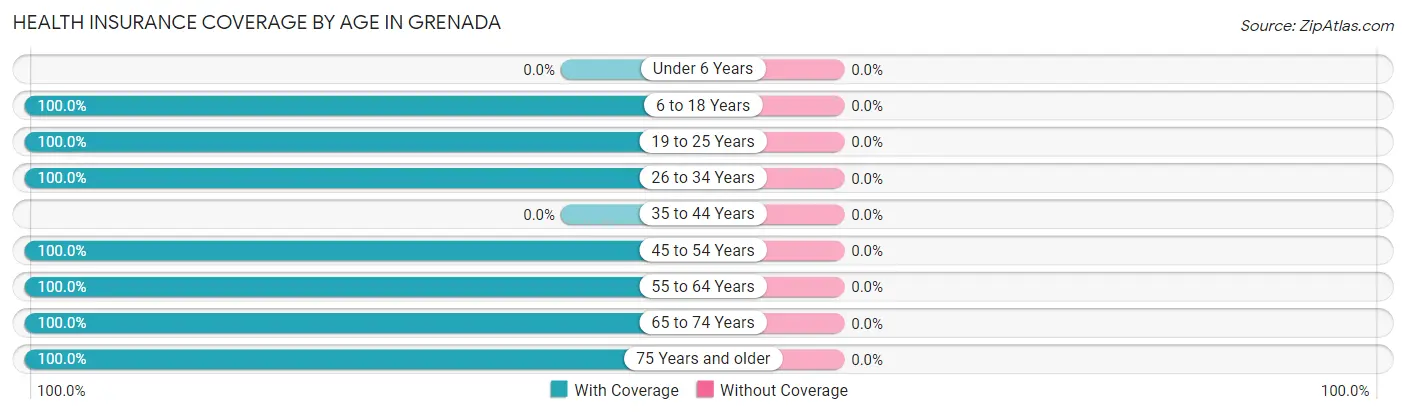
| Age Bracket | With Coverage | Without Coverage |
| Under 6 Years | 0 (0.0%) | 0 (0.0%) |
| 6 to 18 Years | 24 (100.0%) | 0 (0.0%) |
| 19 to 25 Years | 45 (100.0%) | 0 (0.0%) |
| 26 to 34 Years | 6 (100.0%) | 0 (0.0%) |
| 35 to 44 Years | 0 (0.0%) | 0 (0.0%) |
| 45 to 54 Years | 39 (100.0%) | 0 (0.0%) |
| 55 to 64 Years | 28 (100.0%) | 0 (0.0%) |
| 65 to 74 Years | 64 (100.0%) | 0 (0.0%) |
| 75 Years and older | 20 (100.0%) | 0 (0.0%) |
| Total | 226 (100.0%) | 0 (0.0%) |
Health Insurance Coverage by Citizenship Status in Grenada
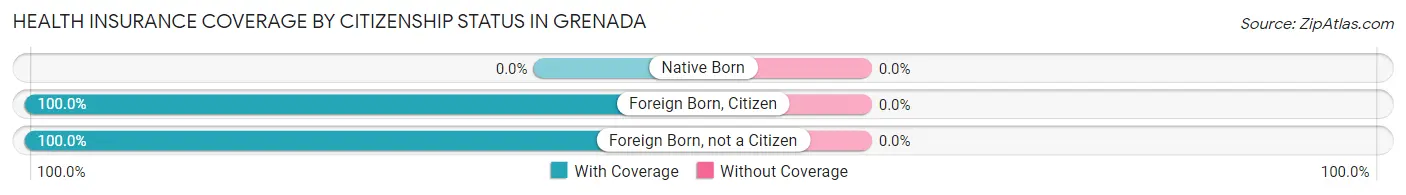
| Citizenship Status | With Coverage | Without Coverage |
| Native Born | 0 (0.0%) | 0 (0.0%) |
| Foreign Born, Citizen | 24 (100.0%) | 0 (0.0%) |
| Foreign Born, not a Citizen | 45 (100.0%) | 0 (0.0%) |
Health Insurance Coverage by Household Income in Grenada
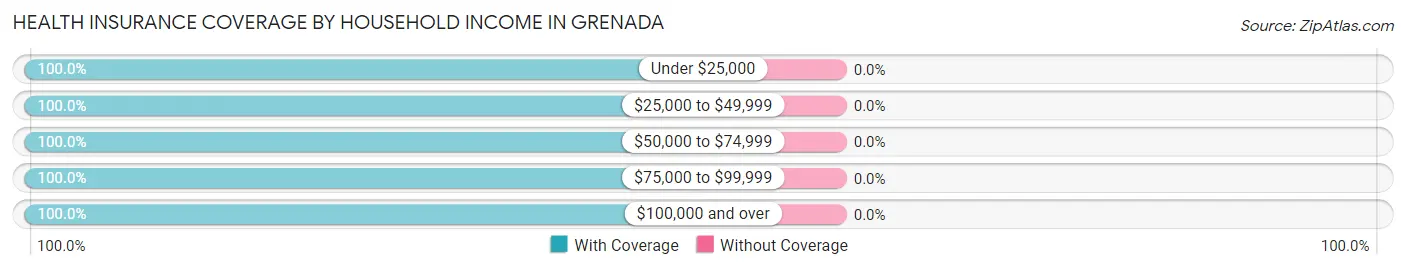
| Household Income | With Coverage | Without Coverage |
| Under $25,000 | 35 (100.0%) | 0 (0.0%) |
| $25,000 to $49,999 | 38 (100.0%) | 0 (0.0%) |
| $50,000 to $74,999 | 72 (100.0%) | 0 (0.0%) |
| $75,000 to $99,999 | 40 (100.0%) | 0 (0.0%) |
| $100,000 and over | 41 (100.0%) | 0 (0.0%) |
Public vs Private Health Insurance Coverage by Age in Grenada
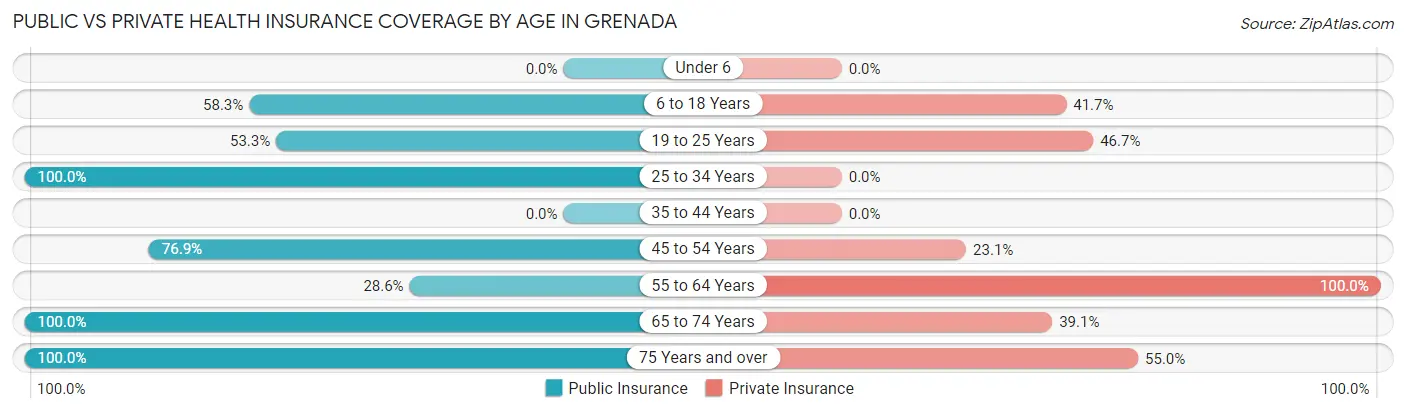
| Age Bracket | Public Insurance | Private Insurance |
| Under 6 | 0 (0.0%) | 0 (0.0%) |
| 6 to 18 Years | 14 (58.3%) | 10 (41.7%) |
| 19 to 25 Years | 24 (53.3%) | 21 (46.7%) |
| 25 to 34 Years | 6 (100.0%) | 0 (0.0%) |
| 35 to 44 Years | 0 (0.0%) | 0 (0.0%) |
| 45 to 54 Years | 30 (76.9%) | 9 (23.1%) |
| 55 to 64 Years | 8 (28.6%) | 28 (100.0%) |
| 65 to 74 Years | 64 (100.0%) | 25 (39.1%) |
| 75 Years and over | 20 (100.0%) | 11 (55.0%) |
| Total | 166 (73.5%) | 104 (46.0%) |
Disability Status by Sex by Age in Grenada
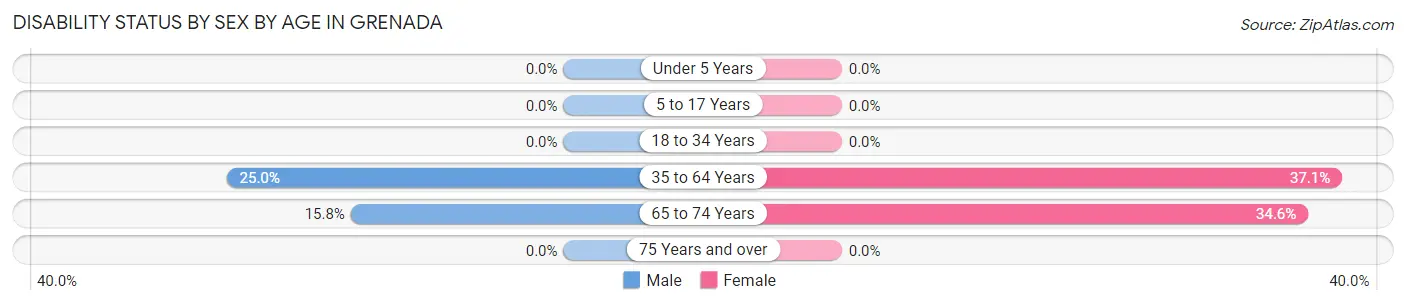
| Age Bracket | Male | Female |
| Under 5 Years | 0 (0.0%) | 0 (0.0%) |
| 5 to 17 Years | 0 (0.0%) | 0 (0.0%) |
| 18 to 34 Years | 0 (0.0%) | 0 (0.0%) |
| 35 to 64 Years | 8 (25.0%) | 13 (37.1%) |
| 65 to 74 Years | 6 (15.8%) | 9 (34.6%) |
| 75 Years and over | 0 (0.0%) | 0 (0.0%) |
Disability Class by Sex by Age in Grenada
Disability Class: Hearing Difficulty
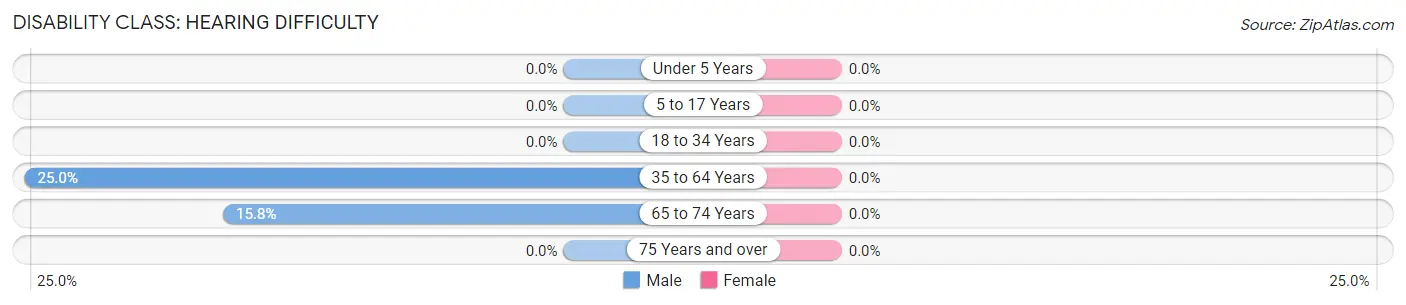
| Age Bracket | Male | Female |
| Under 5 Years | 0 (0.0%) | 0 (0.0%) |
| 5 to 17 Years | 0 (0.0%) | 0 (0.0%) |
| 18 to 34 Years | 0 (0.0%) | 0 (0.0%) |
| 35 to 64 Years | 8 (25.0%) | 0 (0.0%) |
| 65 to 74 Years | 6 (15.8%) | 0 (0.0%) |
| 75 Years and over | 0 (0.0%) | 0 (0.0%) |
Disability Class: Vision Difficulty
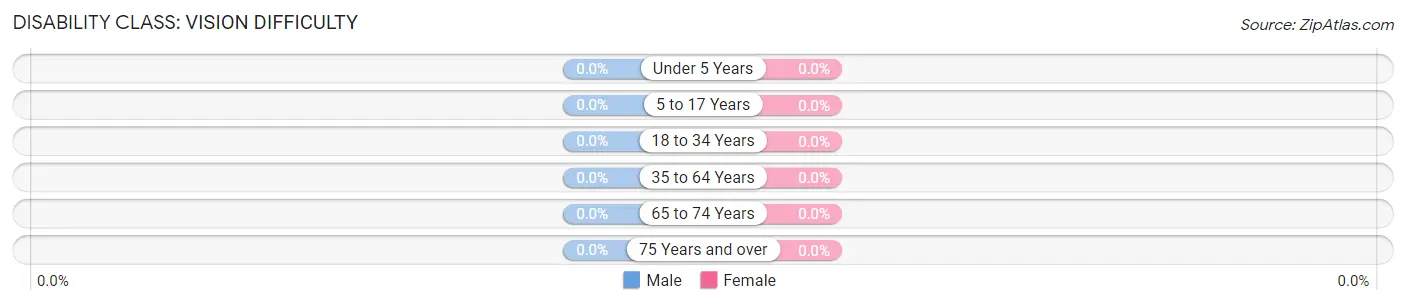
| Age Bracket | Male | Female |
| Under 5 Years | 0 (0.0%) | 0 (0.0%) |
| 5 to 17 Years | 0 (0.0%) | 0 (0.0%) |
| 18 to 34 Years | 0 (0.0%) | 0 (0.0%) |
| 35 to 64 Years | 0 (0.0%) | 0 (0.0%) |
| 65 to 74 Years | 0 (0.0%) | 0 (0.0%) |
| 75 Years and over | 0 (0.0%) | 0 (0.0%) |
Disability Class: Cognitive Difficulty
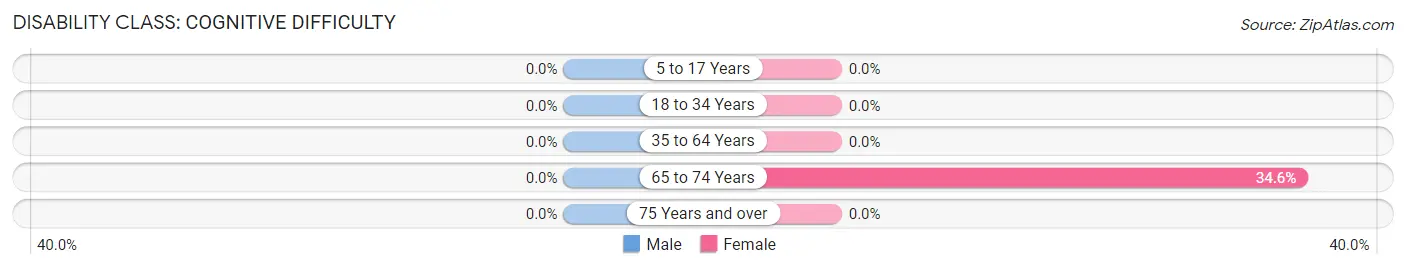
| Age Bracket | Male | Female |
| 5 to 17 Years | 0 (0.0%) | 0 (0.0%) |
| 18 to 34 Years | 0 (0.0%) | 0 (0.0%) |
| 35 to 64 Years | 0 (0.0%) | 0 (0.0%) |
| 65 to 74 Years | 0 (0.0%) | 9 (34.6%) |
| 75 Years and over | 0 (0.0%) | 0 (0.0%) |
Disability Class: Ambulatory Difficulty
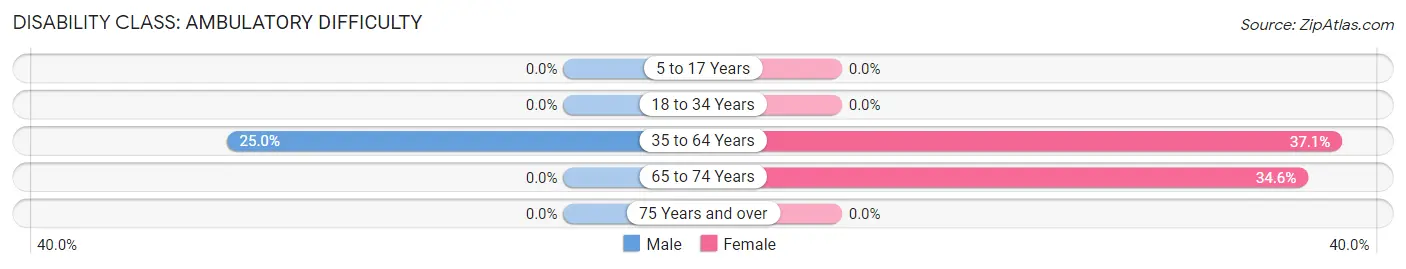
| Age Bracket | Male | Female |
| 5 to 17 Years | 0 (0.0%) | 0 (0.0%) |
| 18 to 34 Years | 0 (0.0%) | 0 (0.0%) |
| 35 to 64 Years | 8 (25.0%) | 13 (37.1%) |
| 65 to 74 Years | 0 (0.0%) | 9 (34.6%) |
| 75 Years and over | 0 (0.0%) | 0 (0.0%) |
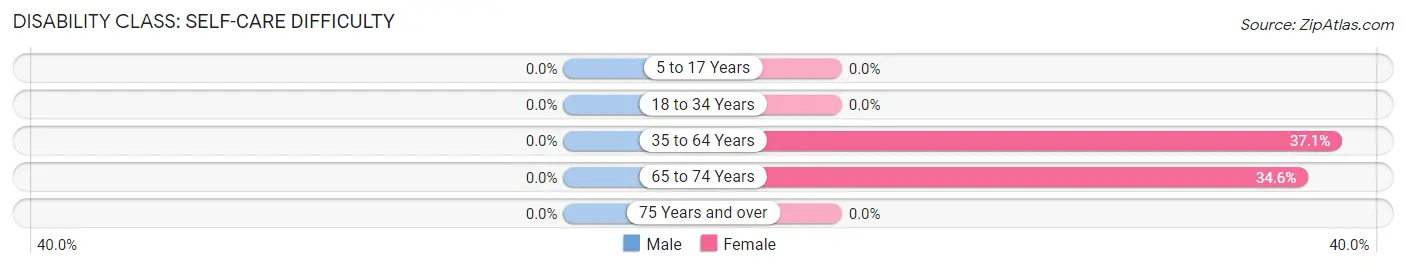
Disability Class: Self-Care Difficulty
| Age Bracket | Male | Female |
| 5 to 17 Years | 0 (0.0%) | 0 (0.0%) |
| 18 to 34 Years | 0 (0.0%) | 0 (0.0%) |
| 35 to 64 Years | 0 (0.0%) | 13 (37.1%) |
| 65 to 74 Years | 0 (0.0%) | 9 (34.6%) |
| 75 Years and over | 0 (0.0%) | 0 (0.0%) |
Technology Access in Grenada
Computing Device Access in Grenada
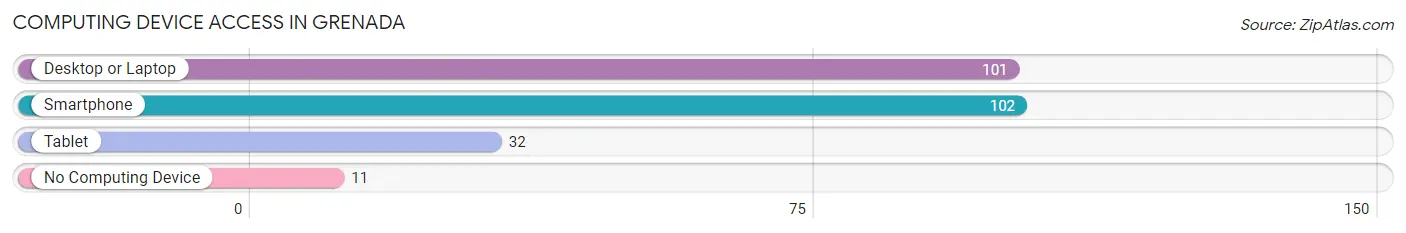
| Device Type | # Households | % Households |
| Desktop or Laptop | 101 | 83.5% |
| Smartphone | 102 | 84.3% |
| Tablet | 32 | 26.5% |
| No Computing Device | 11 | 9.1% |
| Total | 121 | 100.0% |
Internet Access in Grenada
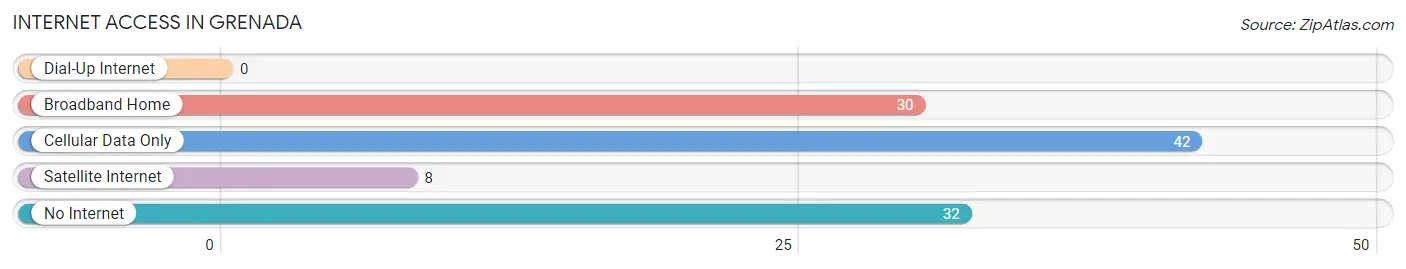
| Internet Type | # Households | % Households |
| Dial-Up Internet | 0 | 0.0% |
| Broadband Home | 30 | 24.8% |
| Cellular Data Only | 42 | 34.7% |
| Satellite Internet | 8 | 6.6% |
| No Internet | 32 | 26.5% |
| Total | 121 | 100.0% |
Grenada Summary
Grenada is a small Caribbean island nation located in the southeastern Caribbean Sea. It is the southernmost of the Windward Islands, located between the islands of Trinidad and Tobago and Barbados. The island is known for its lush tropical rainforest, white sand beaches, and vibrant culture.
History
Grenada was first inhabited by the indigenous Arawak and Carib peoples. The island was first sighted by Christopher Columbus in 1498, and was later colonized by the French in 1650. The French named the island “Grenada” after the Spanish city of Granada. The island was ceded to the British in 1783, and it remained a British colony until 1974, when it gained independence.
Geography
Grenada is located in the southeastern Caribbean Sea, between the islands of Trinidad and Tobago and Barbados. The island is approximately 133 square miles in size, and is made up of three main islands: Grenada, Carriacou, and Petite Martinique. The island is known for its lush tropical rainforest, white sand beaches, and vibrant culture.
Economy
Grenada’s economy is largely based on agriculture, tourism, and manufacturing. The island’s main agricultural products include bananas, nutmeg, cocoa, and sugarcane. Tourism is a major source of income for the island, with visitors drawn to its white sand beaches and vibrant culture. Manufacturing is also an important part of the economy, with the island’s main exports being electronic equipment, clothing, and processed foods.
Demographics
Grenada has a population of approximately 110,000 people. The majority of the population is of African descent, with a small minority of East Indian and European descent. The official language of Grenada is English, although French and Spanish are also spoken. The majority of the population is Christian, with the largest denominations being Roman Catholic and Anglican.
Grenada is a vibrant and diverse island nation with a rich history and culture. Its lush tropical rainforest, white sand beaches, and vibrant culture make it a popular destination for tourists. The island’s economy is largely based on agriculture, tourism, and manufacturing, and its population is largely of African descent. Grenada is a beautiful and unique island nation with much to offer.
Common Questions
What is Per Capita Income in Grenada?
Per Capita income in Grenada is $26,687.
What is the Median Family Income in Grenada?
Median Family Income in Grenada is $57,500.
What is the Median Household income in Grenada?
Median Household Income in Grenada is $47,083.
What is Inequality or Gini Index in Grenada?
Inequality or Gini Index in Grenada is 0.40.
What is the Total Population of Grenada?
Total Population of Grenada is 230.
What is the Total Male Population of Grenada?
Total Male Population of Grenada is 124.
What is the Total Female Population of Grenada?
Total Female Population of Grenada is 106.
What is the Ratio of Males per 100 Females in Grenada?
There are 116.98 Males per 100 Females in Grenada.
What is the Ratio of Females per 100 Males in Grenada?
There are 85.48 Females per 100 Males in Grenada.
What is the Median Population Age in Grenada?
Median Population Age in Grenada is 61.1 Years.
What is the Average Family Size in Grenada
Average Family Size in Grenada is 2.1 People.
What is the Average Household Size in Grenada
Average Household Size in Grenada is 1.9 People.
How Large is the Labor Force in Grenada?
There are 119 People in the Labor Forcein in Grenada.
What is the Percentage of People in the Labor Force in Grenada?
54.1% of People are in the Labor Force in Grenada.
What is the Unemployment Rate in Grenada?
Unemployment Rate in Grenada is 22.7%.