Yreka, CA Map & Demographics
Yreka Map
Yreka Overview
$29,497
PER CAPITA INCOME
$67,685
AVG FAMILY INCOME
$46,387
AVG HOUSEHOLD INCOME
29.0%
WAGE / INCOME GAP [ % ]
71.0¢/ $1
WAGE / INCOME GAP [ $ ]
$10,858
FAMILY INCOME DEFICIT
0.48
INEQUALITY / GINI INDEX
7,833
TOTAL POPULATION
3,845
MALE POPULATION
3,988
FEMALE POPULATION
96.41
MALES / 100 FEMALES
103.72
FEMALES / 100 MALES
36.3
MEDIAN AGE
3.4
AVG FAMILY SIZE
2.4
AVG HOUSEHOLD SIZE
3,230
LABOR FORCE [ PEOPLE ]
53.9%
PERCENT IN LABOR FORCE
4.0%
UNEMPLOYMENT RATE
Yreka Zip Codes
Yreka Area Codes
Income in Yreka
Income Overview in Yreka
Per Capita Income in Yreka is $29,497, while median incomes of families and households are $67,685 and $46,387 respectively.
| Characteristic | Number | Measure |
| Per Capita Income | 7,833 | $29,497 |
| Median Family Income | 1,598 | $67,685 |
| Mean Family Income | 1,598 | $88,407 |
| Median Household Income | 3,230 | $46,387 |
| Mean Household Income | 3,230 | $68,888 |
| Income Deficit | 1,598 | $10,858 |
| Wage / Income Gap (%) | 7,833 | 29.05% |
| Wage / Income Gap ($) | 7,833 | 70.95¢ per $1 |
| Gini / Inequality Index | 7,833 | 0.48 |
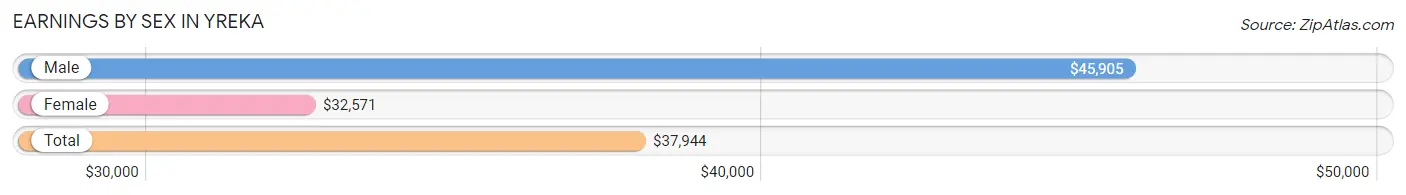
Earnings by Sex in Yreka
Average Earnings in Yreka are $37,944, $45,905 for men and $32,571 for women, a difference of 29.0%.
| Sex | Number | Average Earnings |
| Male | 1,559 (46.9%) | $45,905 |
| Female | 1,764 (53.1%) | $32,571 |
| Total | 3,323 (100.0%) | $37,944 |
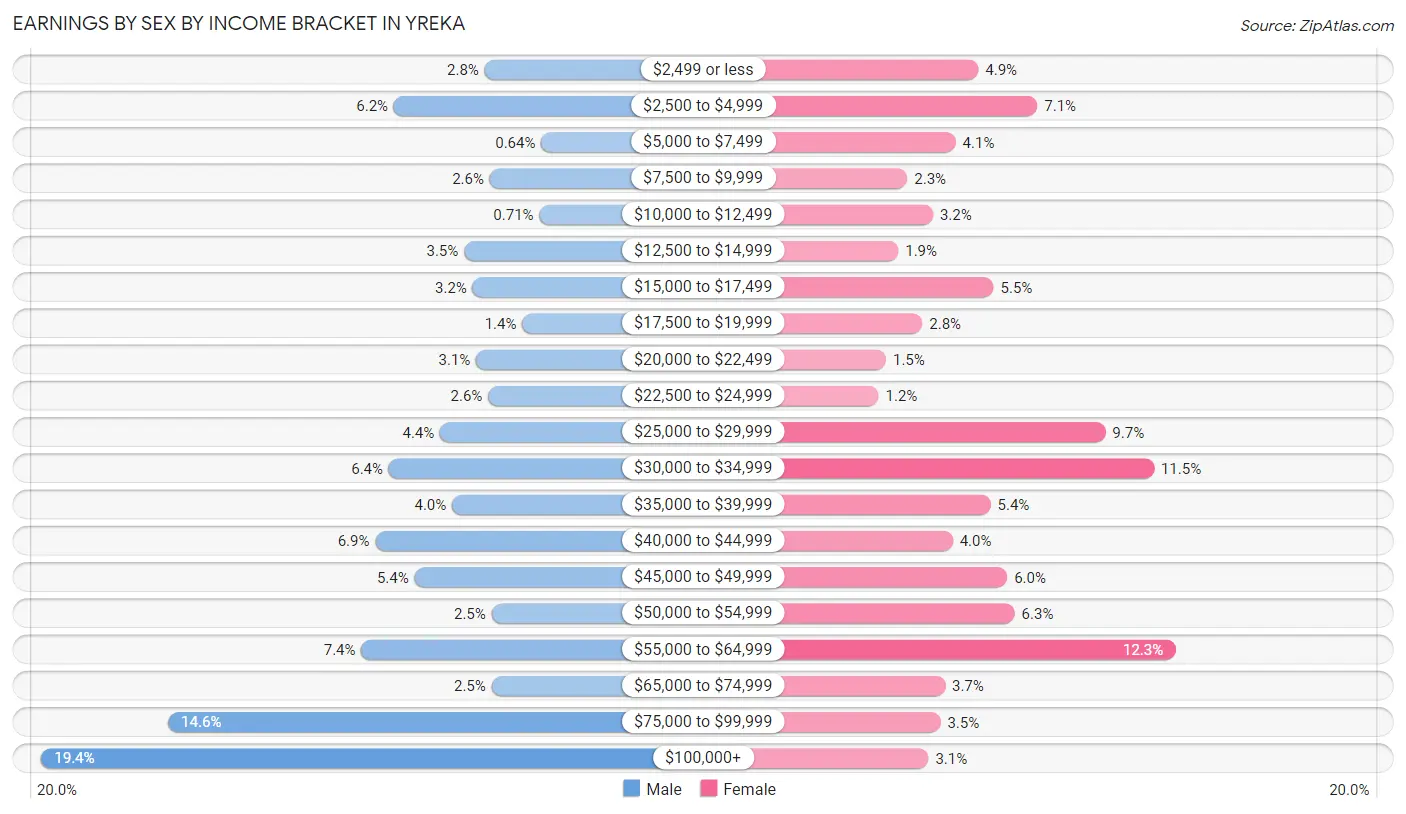
Earnings by Sex by Income Bracket in Yreka
The most common earnings brackets in Yreka are $100,000+ for men (302 | 19.4%) and $55,000 to $64,999 for women (217 | 12.3%).
| Income | Male | Female |
| $2,499 or less | 43 (2.8%) | 87 (4.9%) |
| $2,500 to $4,999 | 96 (6.2%) | 126 (7.1%) |
| $5,000 to $7,499 | 10 (0.6%) | 72 (4.1%) |
| $7,500 to $9,999 | 40 (2.6%) | 40 (2.3%) |
| $10,000 to $12,499 | 11 (0.7%) | 57 (3.2%) |
| $12,500 to $14,999 | 55 (3.5%) | 34 (1.9%) |
| $15,000 to $17,499 | 50 (3.2%) | 97 (5.5%) |
| $17,500 to $19,999 | 21 (1.3%) | 50 (2.8%) |
| $20,000 to $22,499 | 48 (3.1%) | 26 (1.5%) |
| $22,500 to $24,999 | 41 (2.6%) | 21 (1.2%) |
| $25,000 to $29,999 | 69 (4.4%) | 171 (9.7%) |
| $30,000 to $34,999 | 99 (6.4%) | 203 (11.5%) |
| $35,000 to $39,999 | 62 (4.0%) | 95 (5.4%) |
| $40,000 to $44,999 | 107 (6.9%) | 70 (4.0%) |
| $45,000 to $49,999 | 84 (5.4%) | 106 (6.0%) |
| $50,000 to $54,999 | 39 (2.5%) | 111 (6.3%) |
| $55,000 to $64,999 | 115 (7.4%) | 217 (12.3%) |
| $65,000 to $74,999 | 39 (2.5%) | 65 (3.7%) |
| $75,000 to $99,999 | 228 (14.6%) | 62 (3.5%) |
| $100,000+ | 302 (19.4%) | 54 (3.1%) |
| Total | 1,559 (100.0%) | 1,764 (100.0%) |
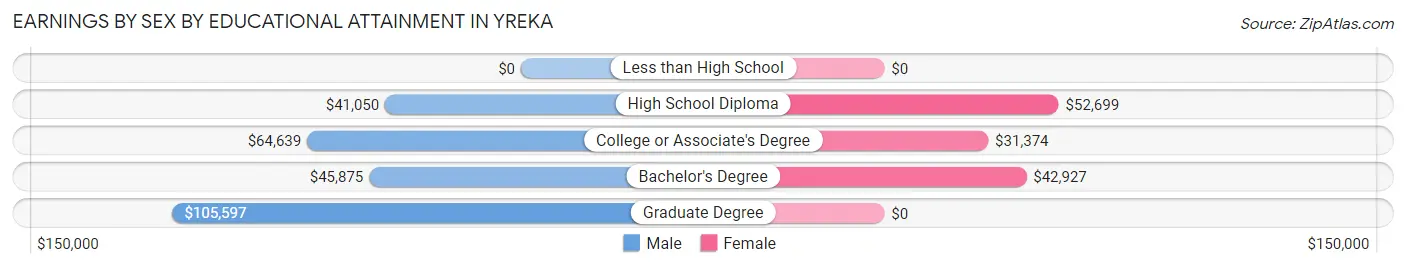
Earnings by Sex by Educational Attainment in Yreka
Average earnings in Yreka are $49,844 for men and $34,527 for women, a difference of 30.7%. Men with an educational attainment of graduate degree enjoy the highest average annual earnings of $105,597, while those with high school diploma education earn the least with $41,050. Women with an educational attainment of high school diploma earn the most with the average annual earnings of $52,699, while those with college or associate's degree education have the smallest earnings of $31,374.
| Educational Attainment | Male Income | Female Income |
| Less than High School | - | - |
| High School Diploma | $41,050 | $52,699 |
| College or Associate's Degree | $64,639 | $31,374 |
| Bachelor's Degree | $45,875 | $42,927 |
| Graduate Degree | $105,597 | $0 |
| Total | $49,844 | $34,527 |
Family Income in Yreka
Family Income Brackets in Yreka
According to the Yreka family income data, there are 356 families falling into the $50,000 to $74,999 income range, which is the most common income bracket and makes up 22.3% of all families. Conversely, the less than $10,000 income bracket is the least frequent group with only 42 families (2.6%) belonging to this category.
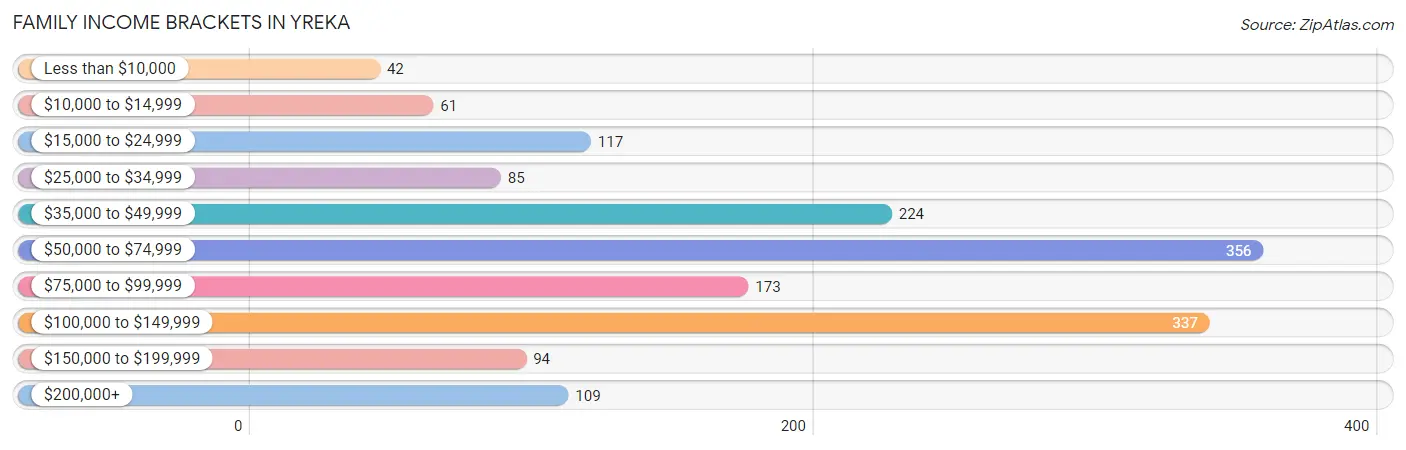
| Income Bracket | # Families | % Families |
| Less than $10,000 | 42 | 2.6% |
| $10,000 to $14,999 | 61 | 3.8% |
| $15,000 to $24,999 | 117 | 7.3% |
| $25,000 to $34,999 | 85 | 5.3% |
| $35,000 to $49,999 | 224 | 14.0% |
| $50,000 to $74,999 | 356 | 22.3% |
| $75,000 to $99,999 | 173 | 10.8% |
| $100,000 to $149,999 | 337 | 21.1% |
| $150,000 to $199,999 | 94 | 5.9% |
| $200,000+ | 109 | 6.8% |
Family Income by Famaliy Size in Yreka
5-person families (158 | 9.9%) account for the highest median family income in Yreka with $94,412 per family, while 2-person families (724 | 45.3%) have the highest median income of $35,000 per family member.
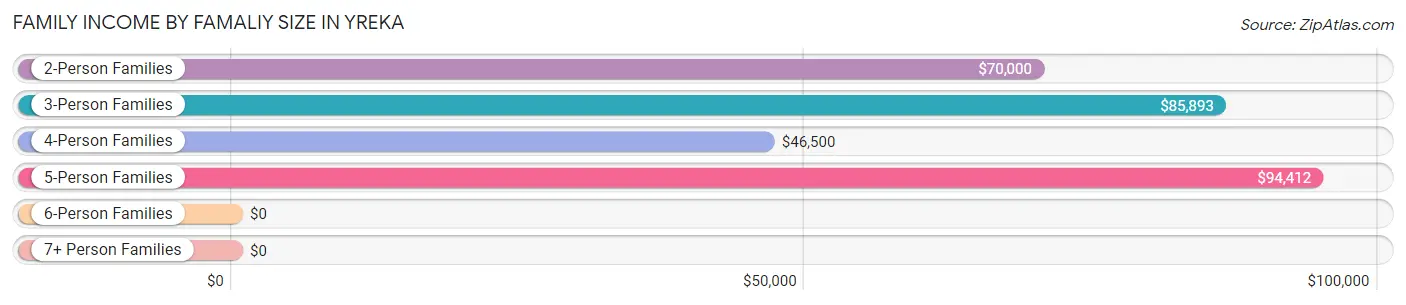
| Income Bracket | # Families | Median Income |
| 2-Person Families | 724 (45.3%) | $70,000 |
| 3-Person Families | 339 (21.2%) | $85,893 |
| 4-Person Families | 272 (17.0%) | $46,500 |
| 5-Person Families | 158 (9.9%) | $94,412 |
| 6-Person Families | 101 (6.3%) | $0 |
| 7+ Person Families | 4 (0.3%) | $0 |
| Total | 1,598 (100.0%) | $67,685 |
Family Income by Number of Earners in Yreka
The median family income in Yreka is $67,685, with families comprising 3+ earners (48) having the highest median family income of $168,889, while families with 1 earner (625) have the lowest median family income of $47,188, accounting for 3.0% and 39.1% of families, respectively.
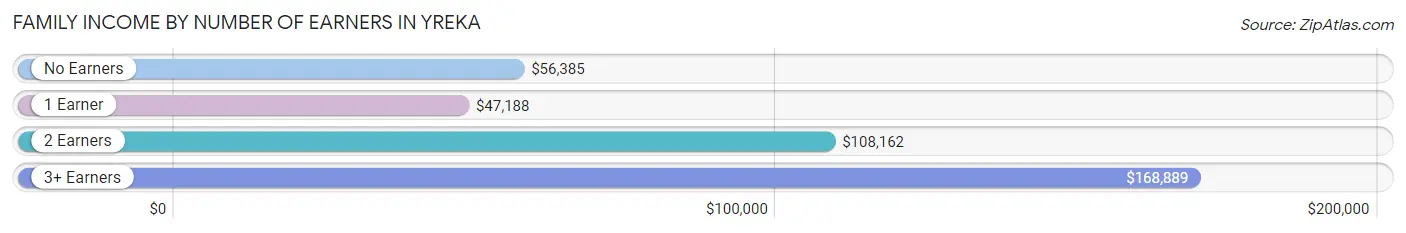
| Number of Earners | # Families | Median Income |
| No Earners | 288 (18.0%) | $56,385 |
| 1 Earner | 625 (39.1%) | $47,188 |
| 2 Earners | 637 (39.9%) | $108,162 |
| 3+ Earners | 48 (3.0%) | $168,889 |
| Total | 1,598 (100.0%) | $67,685 |
Household Income in Yreka
Household Income Brackets in Yreka
With 565 households falling in the category, the $15,000 to $24,999 income range is the most frequent in Yreka, accounting for 17.5% of all households. In contrast, only 129 households (4.0%) fall into the $200,000+ income bracket, making it the least populous group.
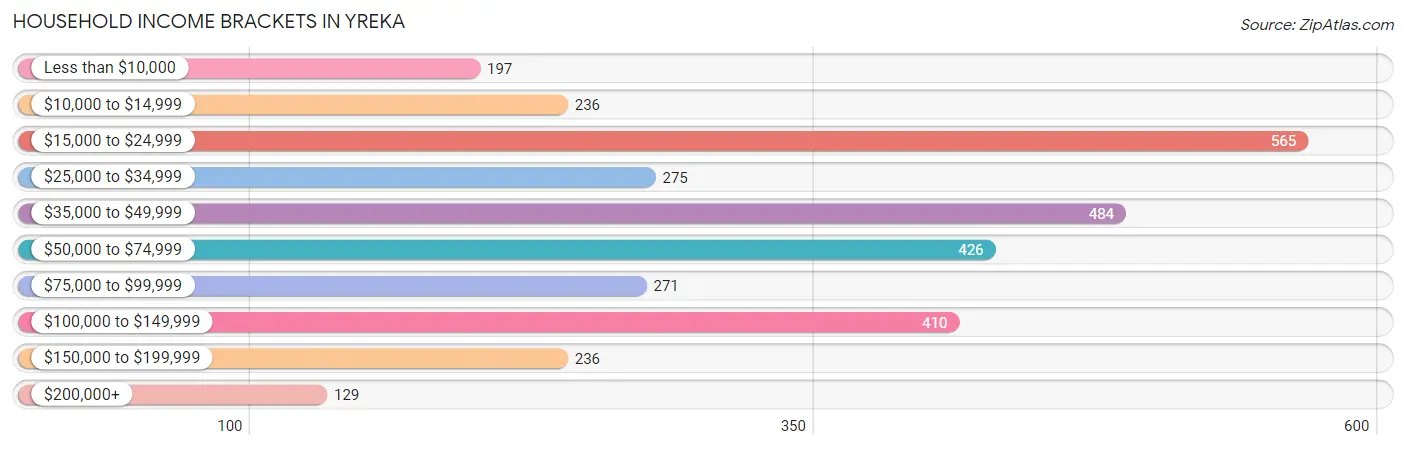
| Income Bracket | # Households | % Households |
| Less than $10,000 | 197 | 6.1% |
| $10,000 to $14,999 | 236 | 7.3% |
| $15,000 to $24,999 | 565 | 17.5% |
| $25,000 to $34,999 | 275 | 8.5% |
| $35,000 to $49,999 | 484 | 15.0% |
| $50,000 to $74,999 | 426 | 13.2% |
| $75,000 to $99,999 | 271 | 8.4% |
| $100,000 to $149,999 | 410 | 12.7% |
| $150,000 to $199,999 | 236 | 7.3% |
| $200,000+ | 129 | 4.0% |
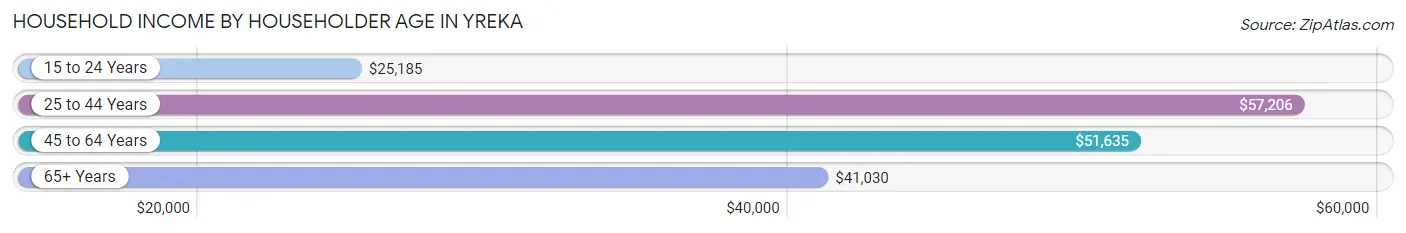
Household Income by Householder Age in Yreka
The median household income in Yreka is $46,387, with the highest median household income of $57,206 found in the 25 to 44 years age bracket for the primary householder. A total of 1,104 households (34.2%) fall into this category. Meanwhile, the 15 to 24 years age bracket for the primary householder has the lowest median household income of $25,185, with 124 households (3.8%) in this group.
| Income Bracket | # Households | Median Income |
| 15 to 24 Years | 124 (3.8%) | $25,185 |
| 25 to 44 Years | 1,104 (34.2%) | $57,206 |
| 45 to 64 Years | 851 (26.4%) | $51,635 |
| 65+ Years | 1,151 (35.6%) | $41,030 |
| Total | 3,230 (100.0%) | $46,387 |
Poverty in Yreka
Income Below Poverty by Sex and Age in Yreka
With 18.9% poverty level for males and 23.1% for females among the residents of Yreka, 16 and 17 year old males and 5 year old females are the most vulnerable to poverty, with 160 males (90.4%) and 148 females (98.0%) in their respective age groups living below the poverty level.
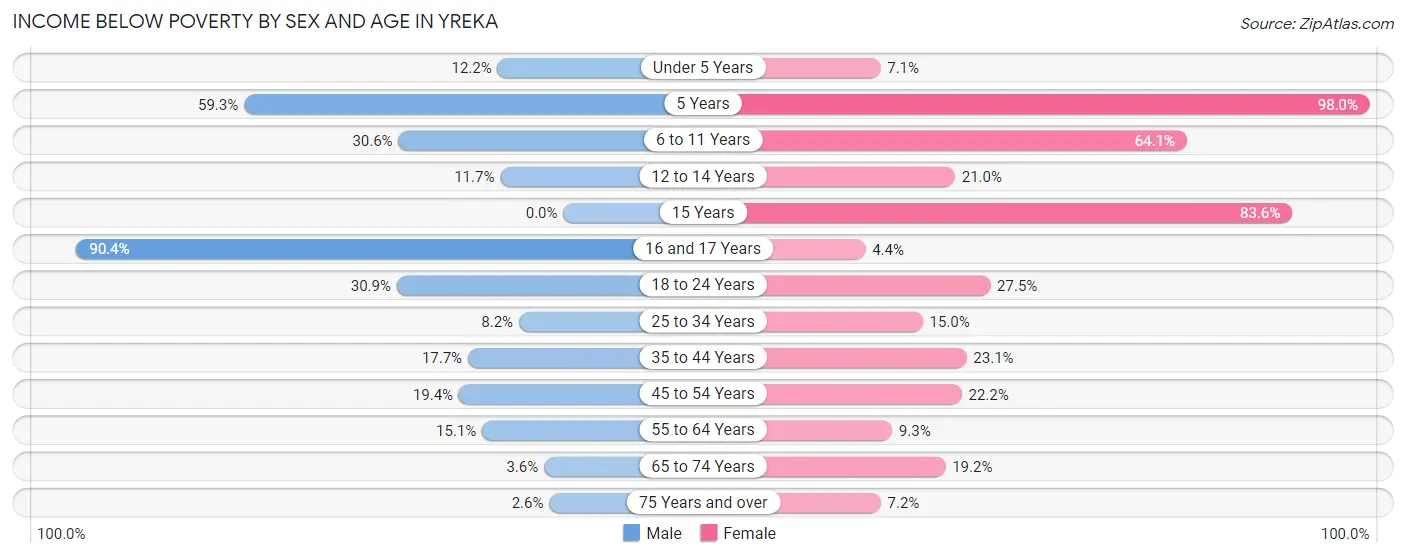
| Age Bracket | Male | Female |
| Under 5 Years | 22 (12.2%) | 15 (7.1%) |
| 5 Years | 16 (59.3%) | 148 (98.0%) |
| 6 to 11 Years | 131 (30.6%) | 98 (64.0%) |
| 12 to 14 Years | 52 (11.7%) | 30 (21.0%) |
| 15 Years | 0 (0.0%) | 56 (83.6%) |
| 16 and 17 Years | 160 (90.4%) | 4 (4.3%) |
| 18 to 24 Years | 68 (30.9%) | 114 (27.5%) |
| 25 to 34 Years | 35 (8.2%) | 100 (15.0%) |
| 35 to 44 Years | 85 (17.7%) | 96 (23.1%) |
| 45 to 54 Years | 75 (19.4%) | 72 (22.2%) |
| 55 to 64 Years | 55 (15.1%) | 28 (9.3%) |
| 65 to 74 Years | 15 (3.6%) | 130 (19.2%) |
| 75 Years and over | 6 (2.6%) | 25 (7.2%) |
| Total | 720 (18.9%) | 916 (23.1%) |
Income Above Poverty by Sex and Age in Yreka
According to the poverty statistics in Yreka, males aged 15 years and females aged 16 and 17 years are the age groups that are most secure financially, with 100.0% of males and 95.7% of females in these age groups living above the poverty line.
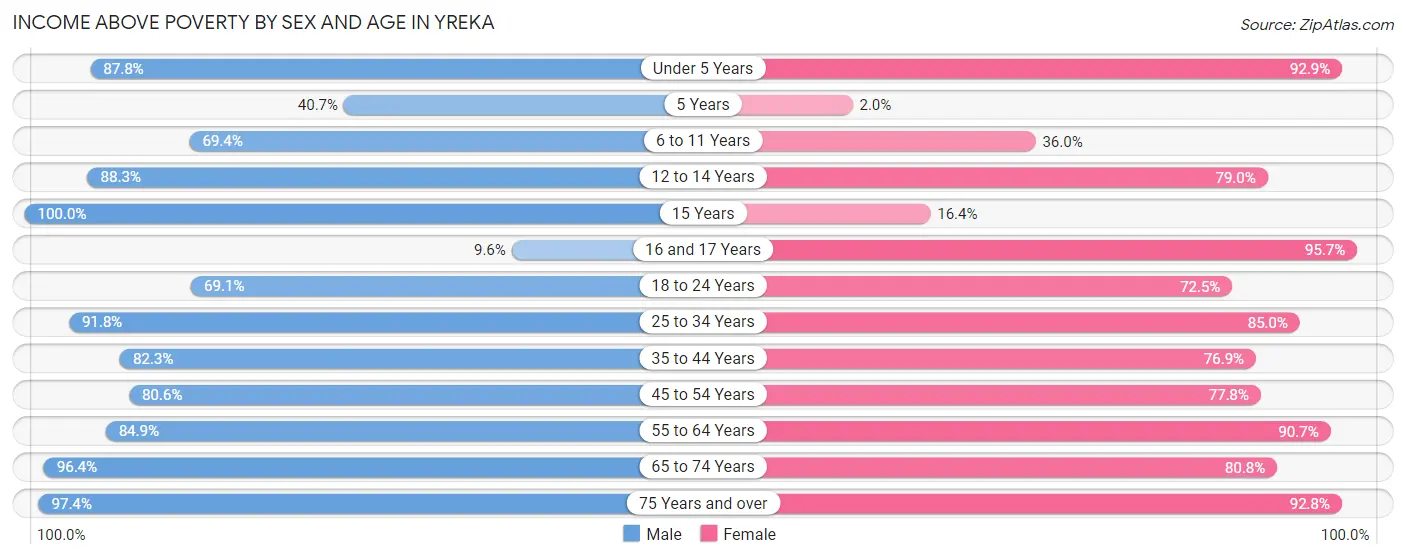
| Age Bracket | Male | Female |
| Under 5 Years | 158 (87.8%) | 195 (92.9%) |
| 5 Years | 11 (40.7%) | 3 (2.0%) |
| 6 to 11 Years | 297 (69.4%) | 55 (35.9%) |
| 12 to 14 Years | 392 (88.3%) | 113 (79.0%) |
| 15 Years | 34 (100.0%) | 11 (16.4%) |
| 16 and 17 Years | 17 (9.6%) | 88 (95.7%) |
| 18 to 24 Years | 152 (69.1%) | 300 (72.5%) |
| 25 to 34 Years | 390 (91.8%) | 567 (85.0%) |
| 35 to 44 Years | 395 (82.3%) | 319 (76.9%) |
| 45 to 54 Years | 312 (80.6%) | 252 (77.8%) |
| 55 to 64 Years | 310 (84.9%) | 273 (90.7%) |
| 65 to 74 Years | 404 (96.4%) | 547 (80.8%) |
| 75 Years and over | 224 (97.4%) | 322 (92.8%) |
| Total | 3,096 (81.1%) | 3,045 (76.9%) |
Income Below Poverty Among Married-Couple Families in Yreka
The poverty statistics for married-couple families in Yreka show that 4.3% or 44 of the total 1,036 families live below the poverty line. Families with 5 or more children have the highest poverty rate of 50.0%, comprising of 2 families. On the other hand, families with no children have the lowest poverty rate of 0.0%, which includes 0 families.
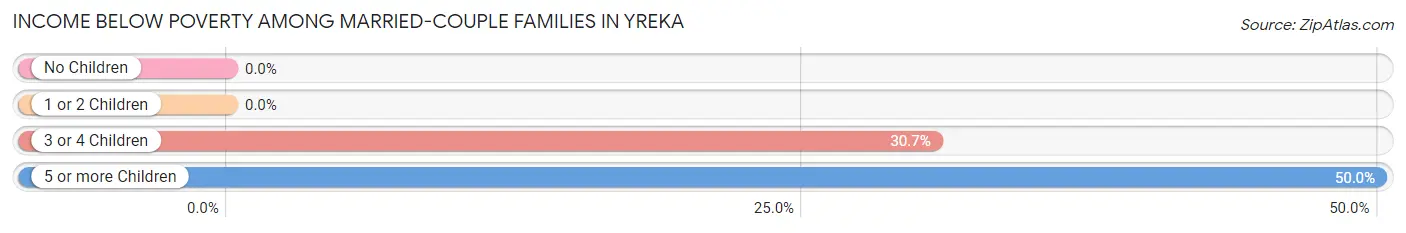
| Children | Above Poverty | Below Poverty |
| No Children | 556 (100.0%) | 0 (0.0%) |
| 1 or 2 Children | 339 (100.0%) | 0 (0.0%) |
| 3 or 4 Children | 95 (69.3%) | 42 (30.7%) |
| 5 or more Children | 2 (50.0%) | 2 (50.0%) |
| Total | 992 (95.8%) | 44 (4.3%) |
Income Below Poverty Among Single-Parent Households in Yreka
According to the poverty data in Yreka, 5.9% or 5 single-father households and 39.3% or 188 single-mother households are living below the poverty line. Among single-father households, those with no children have the highest poverty rate, with 4 households (28.6%) experiencing poverty. Likewise, among single-mother households, those with 3 or 4 children have the highest poverty rate, with 110 households (54.2%) falling below the poverty line.
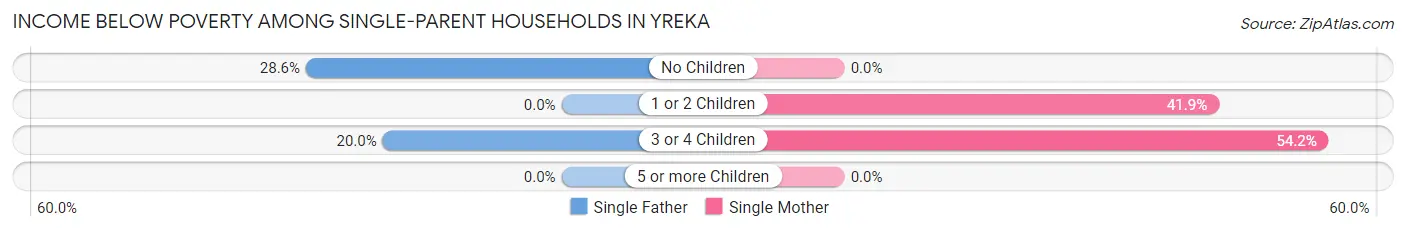
| Children | Single Father | Single Mother |
| No Children | 4 (28.6%) | 0 (0.0%) |
| 1 or 2 Children | 0 (0.0%) | 78 (41.9%) |
| 3 or 4 Children | 1 (20.0%) | 110 (54.2%) |
| 5 or more Children | 0 (0.0%) | 0 (0.0%) |
| Total | 5 (5.9%) | 188 (39.3%) |
Income Below Poverty Among Married-Couple vs Single-Parent Households in Yreka
The poverty data for Yreka shows that 44 of the married-couple family households (4.3%) and 193 of the single-parent households (34.3%) are living below the poverty level. Within the married-couple family households, those with 5 or more children have the highest poverty rate, with 2 households (50.0%) falling below the poverty line. Among the single-parent households, those with 3 or 4 children have the highest poverty rate, with 111 household (53.4%) living below poverty.
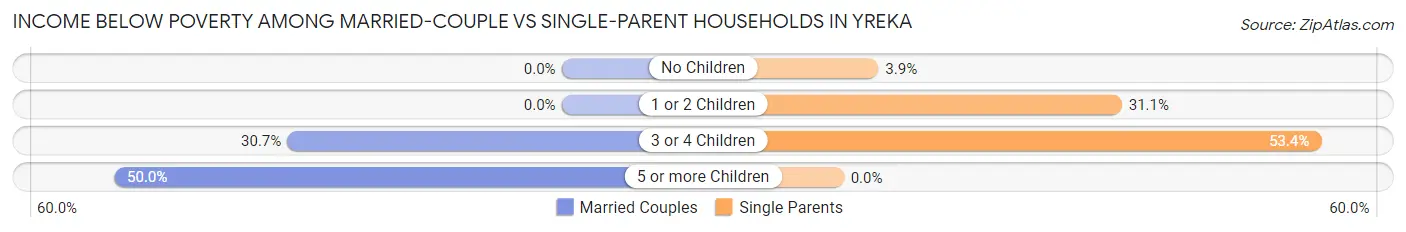
| Children | Married-Couple Families | Single-Parent Households |
| No Children | 0 (0.0%) | 4 (3.9%) |
| 1 or 2 Children | 0 (0.0%) | 78 (31.1%) |
| 3 or 4 Children | 42 (30.7%) | 111 (53.4%) |
| 5 or more Children | 2 (50.0%) | 0 (0.0%) |
| Total | 44 (4.3%) | 193 (34.3%) |
Race in Yreka
The most populous races in Yreka are White / Caucasian (6,125 | 78.2%), Hispanic or Latino (1,326 | 16.9%), and Two or more Races (1,068 | 13.6%).
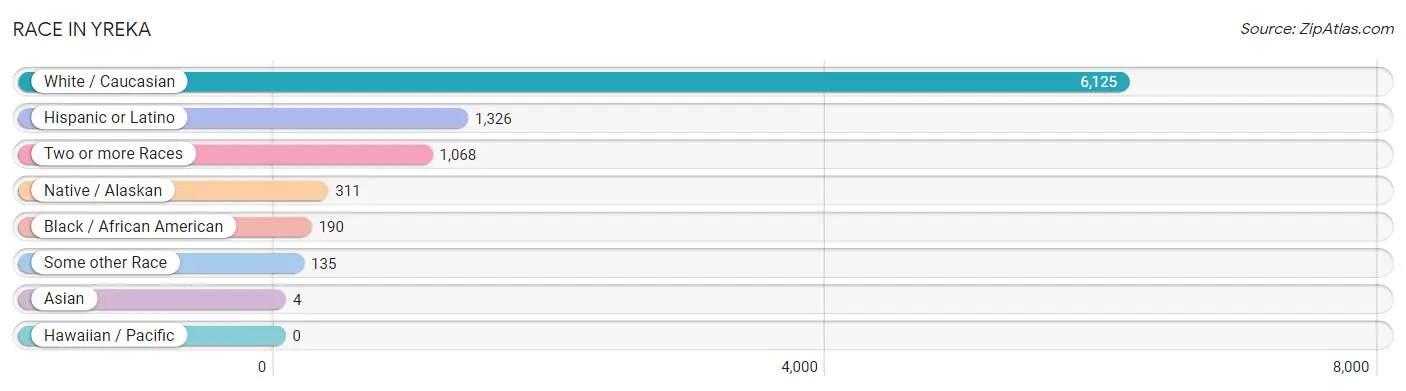
| Race | # Population | % Population |
| Asian | 4 | 0.1% |
| Black / African American | 190 | 2.4% |
| Hawaiian / Pacific | 0 | 0.0% |
| Hispanic or Latino | 1,326 | 16.9% |
| Native / Alaskan | 311 | 4.0% |
| White / Caucasian | 6,125 | 78.2% |
| Two or more Races | 1,068 | 13.6% |
| Some other Race | 135 | 1.7% |
| Total | 7,833 | 100.0% |
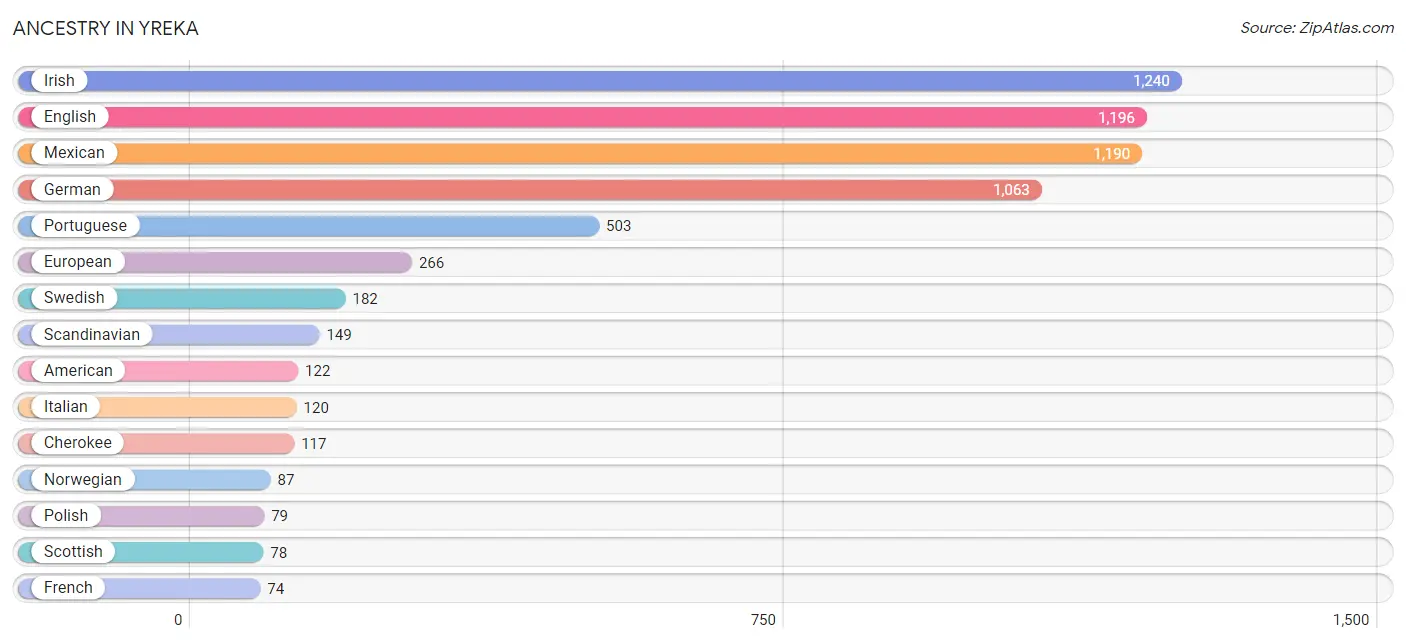
Ancestry in Yreka
The most populous ancestries reported in Yreka are Irish (1,240 | 15.8%), English (1,196 | 15.3%), Mexican (1,190 | 15.2%), German (1,063 | 13.6%), and Portuguese (503 | 6.4%), together accounting for 66.3% of all Yreka residents.
| Ancestry | # Population | % Population |
| African | 6 | 0.1% |
| American | 122 | 1.6% |
| Apache | 1 | 0.0% |
| Arab | 12 | 0.2% |
| Blackfeet | 1 | 0.0% |
| British | 22 | 0.3% |
| Bulgarian | 2 | 0.0% |
| Burmese | 1 | 0.0% |
| Central American | 7 | 0.1% |
| Cherokee | 117 | 1.5% |
| Chinese | 22 | 0.3% |
| Choctaw | 24 | 0.3% |
| Comanche | 31 | 0.4% |
| Creek | 9 | 0.1% |
| Czech | 2 | 0.0% |
| Danish | 7 | 0.1% |
| Dutch | 73 | 0.9% |
| Eastern European | 7 | 0.1% |
| English | 1,196 | 15.3% |
| European | 266 | 3.4% |
| Finnish | 71 | 0.9% |
| French | 74 | 0.9% |
| French Canadian | 60 | 0.8% |
| German | 1,063 | 13.6% |
| Greek | 45 | 0.6% |
| Guatemalan | 6 | 0.1% |
| Icelander | 8 | 0.1% |
| Indian (Asian) | 2 | 0.0% |
| Irish | 1,240 | 15.8% |
| Italian | 120 | 1.5% |
| Korean | 5 | 0.1% |
| Lebanese | 12 | 0.2% |
| Lumbee | 9 | 0.1% |
| Malaysian | 2 | 0.0% |
| Maltese | 4 | 0.1% |
| Mexican | 1,190 | 15.2% |
| Mexican American Indian | 37 | 0.5% |
| Nicaraguan | 1 | 0.0% |
| Northern European | 21 | 0.3% |
| Norwegian | 87 | 1.1% |
| Polish | 79 | 1.0% |
| Portuguese | 503 | 6.4% |
| Puerto Rican | 68 | 0.9% |
| Scandinavian | 149 | 1.9% |
| Scotch-Irish | 58 | 0.7% |
| Scottish | 78 | 1.0% |
| Shoshone | 1 | 0.0% |
| Sioux | 1 | 0.0% |
| Slovak | 9 | 0.1% |
| South American | 7 | 0.1% |
| Spaniard | 43 | 0.5% |
| Spanish | 8 | 0.1% |
| Subsaharan African | 6 | 0.1% |
| Swedish | 182 | 2.3% |
| Swiss | 20 | 0.3% |
| Ukrainian | 39 | 0.5% |
| Uruguayan | 7 | 0.1% |
| Welsh | 69 | 0.9% |
| Yugoslavian | 11 | 0.1% | View All 59 Rows |
Immigrants in Yreka
The most numerous immigrant groups reported in Yreka came from Central America (93 | 1.2%), Latin America (93 | 1.2%), Mexico (93 | 1.2%), Europe (16 | 0.2%), and Northern Europe (8 | 0.1%), together accounting for 3.9% of all Yreka residents.
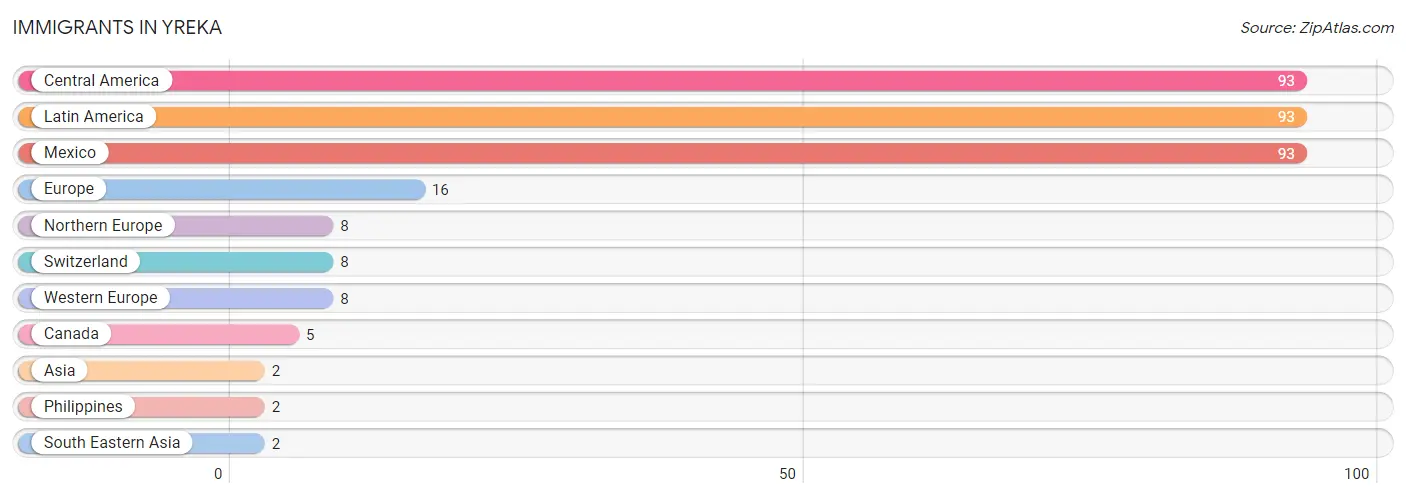
| Immigration Origin | # Population | % Population |
| Asia | 2 | 0.0% |
| Canada | 5 | 0.1% |
| Central America | 93 | 1.2% |
| Europe | 16 | 0.2% |
| Latin America | 93 | 1.2% |
| Mexico | 93 | 1.2% |
| Northern Europe | 8 | 0.1% |
| Philippines | 2 | 0.0% |
| South Eastern Asia | 2 | 0.0% |
| Switzerland | 8 | 0.1% |
| Western Europe | 8 | 0.1% | View All 11 Rows |
Sex and Age in Yreka
Sex and Age in Yreka
The most populous age groups in Yreka are 10 to 14 Years (600 | 15.6%) for men and 30 to 34 Years (355 | 8.9%) for women.
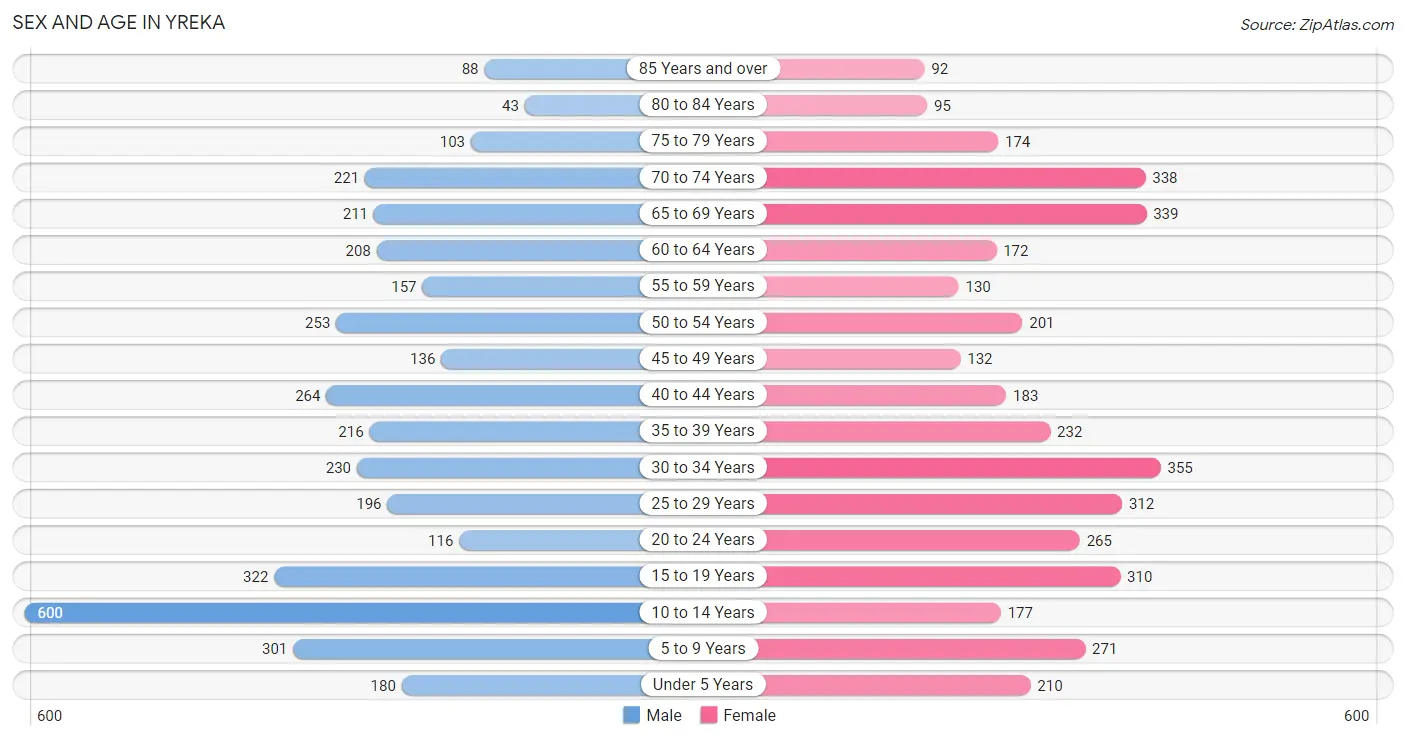
| Age Bracket | Male | Female |
| Under 5 Years | 180 (4.7%) | 210 (5.3%) |
| 5 to 9 Years | 301 (7.8%) | 271 (6.8%) |
| 10 to 14 Years | 600 (15.6%) | 177 (4.4%) |
| 15 to 19 Years | 322 (8.4%) | 310 (7.8%) |
| 20 to 24 Years | 116 (3.0%) | 265 (6.6%) |
| 25 to 29 Years | 196 (5.1%) | 312 (7.8%) |
| 30 to 34 Years | 230 (6.0%) | 355 (8.9%) |
| 35 to 39 Years | 216 (5.6%) | 232 (5.8%) |
| 40 to 44 Years | 264 (6.9%) | 183 (4.6%) |
| 45 to 49 Years | 136 (3.5%) | 132 (3.3%) |
| 50 to 54 Years | 253 (6.6%) | 201 (5.0%) |
| 55 to 59 Years | 157 (4.1%) | 130 (3.3%) |
| 60 to 64 Years | 208 (5.4%) | 172 (4.3%) |
| 65 to 69 Years | 211 (5.5%) | 339 (8.5%) |
| 70 to 74 Years | 221 (5.8%) | 338 (8.5%) |
| 75 to 79 Years | 103 (2.7%) | 174 (4.4%) |
| 80 to 84 Years | 43 (1.1%) | 95 (2.4%) |
| 85 Years and over | 88 (2.3%) | 92 (2.3%) |
| Total | 3,845 (100.0%) | 3,988 (100.0%) |
Families and Households in Yreka
Median Family Size in Yreka
The median family size in Yreka is 3.41 persons per family, with single female/mother families (478 | 29.9%) accounting for the largest median family size of 4.09 persons per family. On the other hand, single male/father families (84 | 5.3%) represent the smallest median family size with 2.75 persons per family.
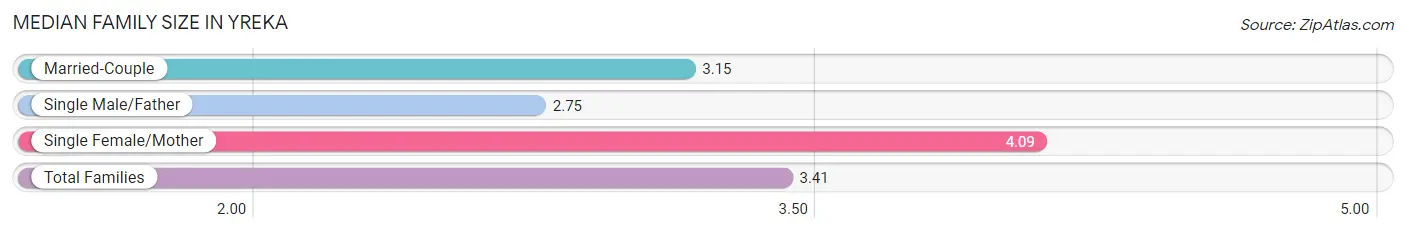
| Family Type | # Families | Family Size |
| Married-Couple | 1,036 (64.8%) | 3.15 |
| Single Male/Father | 84 (5.3%) | 2.75 |
| Single Female/Mother | 478 (29.9%) | 4.09 |
| Total Families | 1,598 (100.0%) | 3.41 |
Median Household Size in Yreka
The median household size in Yreka is 2.40 persons per household, with single female/mother households (478 | 14.8%) accounting for the largest median household size of 4.56 persons per household. non-family households (1,632 | 50.5%) represent the smallest median household size with 1.21 persons per household.
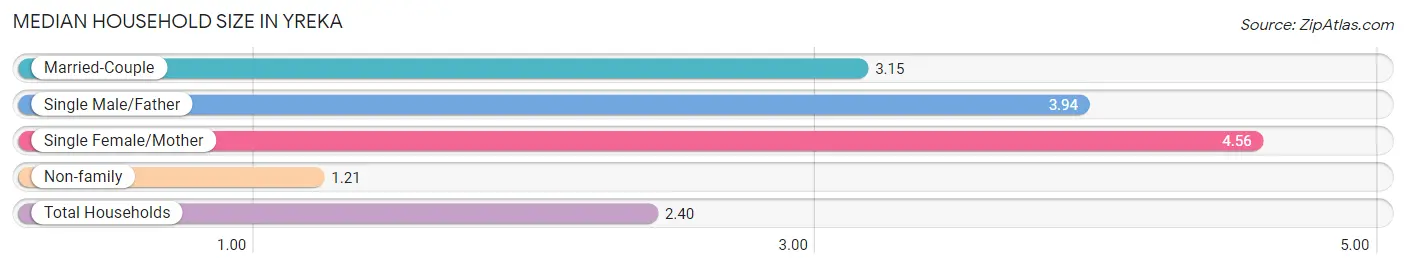
| Household Type | # Households | Household Size |
| Married-Couple | 1,036 (32.1%) | 3.15 |
| Single Male/Father | 84 (2.6%) | 3.94 |
| Single Female/Mother | 478 (14.8%) | 4.56 |
| Non-family | 1,632 (50.5%) | 1.21 |
| Total Households | 3,230 (100.0%) | 2.40 |
Household Size by Marriage Status in Yreka
Out of a total of 3,230 households in Yreka, 1,598 (49.5%) are family households, while 1,632 (50.5%) are nonfamily households. The most numerous type of family households are 2-person households, comprising 661, and the most common type of nonfamily households are 1-person households, comprising 1,372.
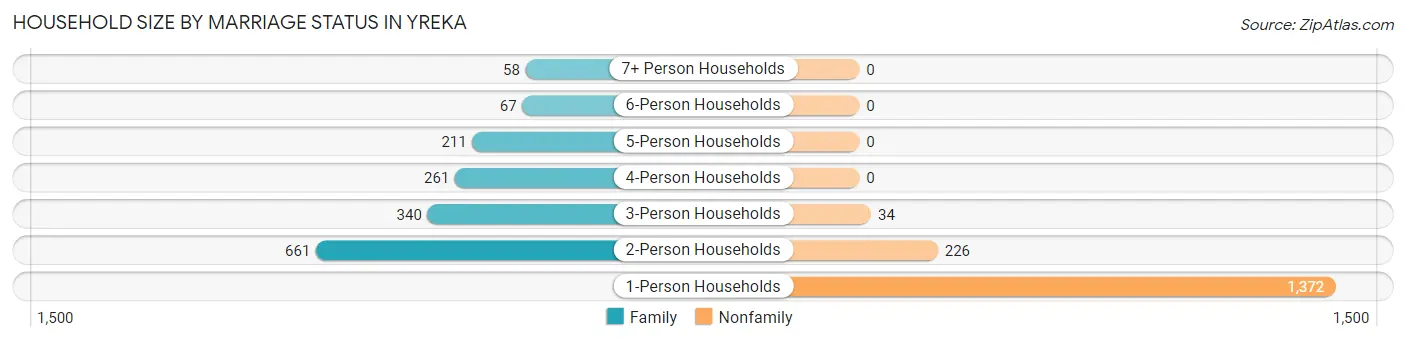
| Household Size | Family Households | Nonfamily Households |
| 1-Person Households | - | 1,372 (42.5%) |
| 2-Person Households | 661 (20.5%) | 226 (7.0%) |
| 3-Person Households | 340 (10.5%) | 34 (1.1%) |
| 4-Person Households | 261 (8.1%) | 0 (0.0%) |
| 5-Person Households | 211 (6.5%) | 0 (0.0%) |
| 6-Person Households | 67 (2.1%) | 0 (0.0%) |
| 7+ Person Households | 58 (1.8%) | 0 (0.0%) |
| Total | 1,598 (49.5%) | 1,632 (50.5%) |
Female Fertility in Yreka
Fertility by Age in Yreka
Average fertility rate in Yreka is 39.0 births per 1,000 women. Women in the age bracket of 20 to 34 years have the highest fertility rate with 57.0 births per 1,000 women. Women in the age bracket of 20 to 34 years acount for 74.7% of all women with births.
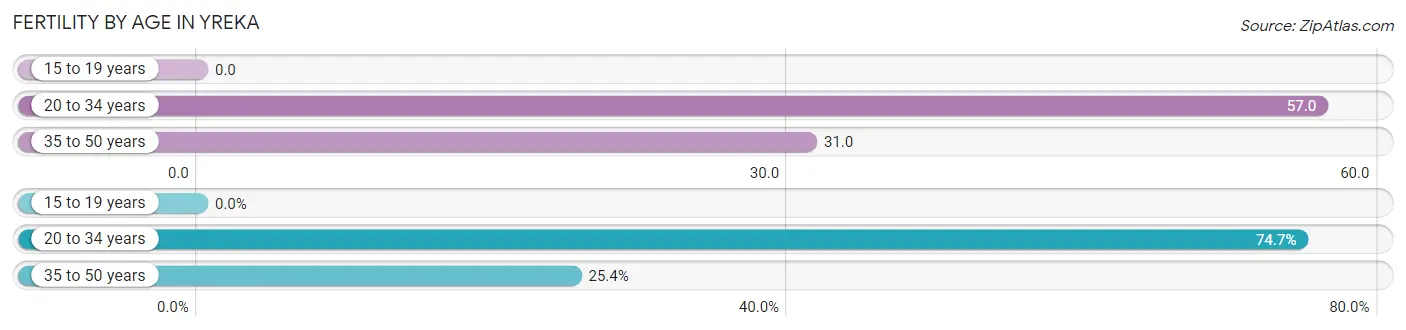
| Age Bracket | Women with Births | Births / 1,000 Women |
| 15 to 19 years | 0 (0.0%) | 0.0 |
| 20 to 34 years | 53 (74.7%) | 57.0 |
| 35 to 50 years | 18 (25.4%) | 31.0 |
| Total | 71 (100.0%) | 39.0 |
Fertility by Age by Marriage Status in Yreka
85.9% of women with births (71) in Yreka are married. The highest percentage of unmarried women with births falls into 20 to 34 years age bracket with 18.9% of them unmarried at the time of birth, while the lowest percentage of unmarried women with births belong to 35 to 50 years age bracket with 0.0% of them unmarried.
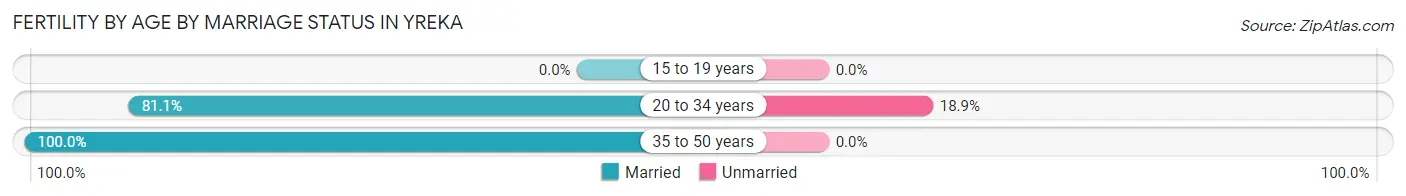
| Age Bracket | Married | Unmarried |
| 15 to 19 years | 0 (0.0%) | 0 (0.0%) |
| 20 to 34 years | 43 (81.1%) | 10 (18.9%) |
| 35 to 50 years | 18 (100.0%) | 0 (0.0%) |
| Total | 61 (85.9%) | 10 (14.1%) |
Fertility by Education in Yreka
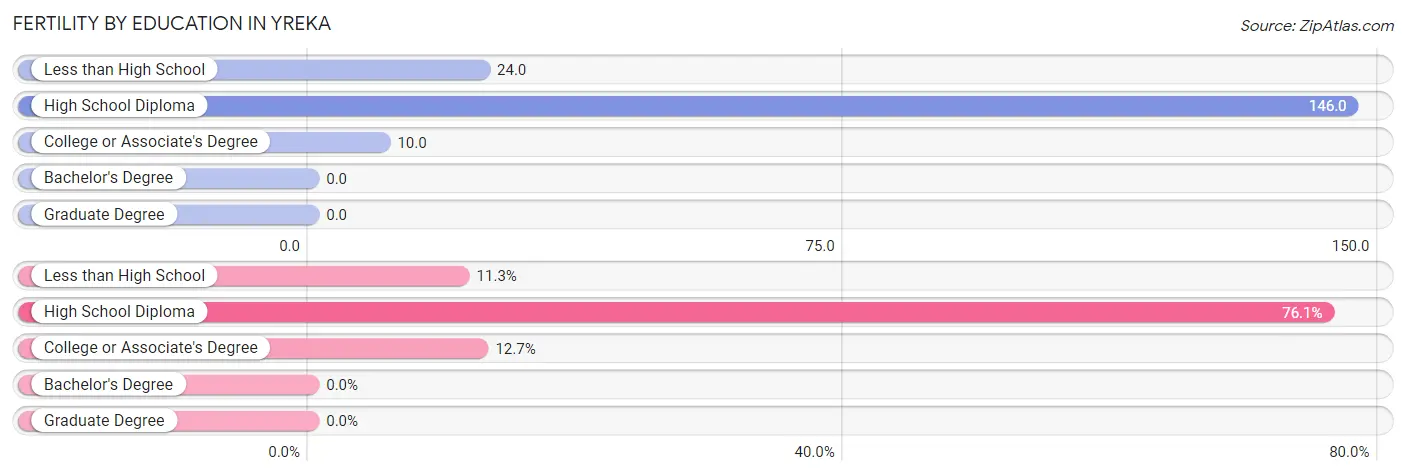
| Educational Attainment | Women with Births | Births / 1,000 Women |
| Less than High School | 8 (11.3%) | 24.0 |
| High School Diploma | 54 (76.1%) | 146.0 |
| College or Associate's Degree | 9 (12.7%) | 10.0 |
| Bachelor's Degree | 0 (0.0%) | 0.0 |
| Graduate Degree | 0 (0.0%) | 0.0 |
| Total | 71 (100.0%) | 39.0 |
Fertility by Education by Marriage Status in Yreka
14.1% of women with births in Yreka are unmarried. Women with the educational attainment of college or associate's degree are most likely to be married with 100.0% of them married at childbirth, while women with the educational attainment of less than high school are least likely to be married with 100.0% of them unmarried at childbirth.
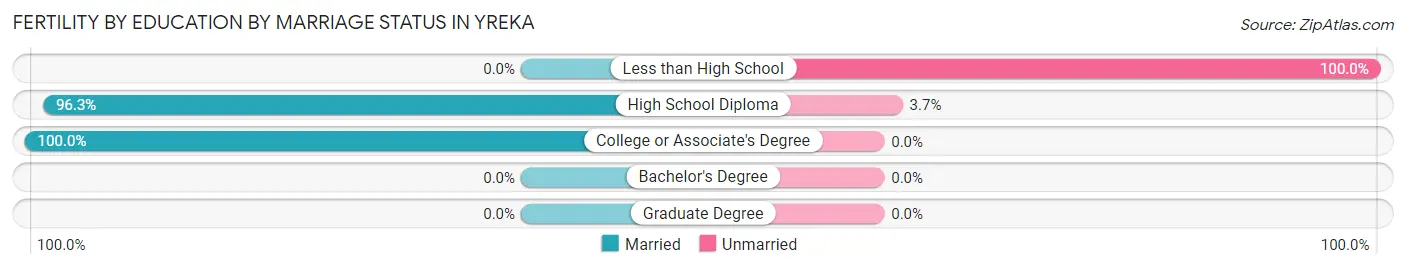
| Educational Attainment | Married | Unmarried |
| Less than High School | 0 (0.0%) | 8 (100.0%) |
| High School Diploma | 52 (96.3%) | 2 (3.7%) |
| College or Associate's Degree | 9 (100.0%) | 0 (0.0%) |
| Bachelor's Degree | 0 (0.0%) | 0 (0.0%) |
| Graduate Degree | 0 (0.0%) | 0 (0.0%) |
| Total | 61 (85.9%) | 10 (14.1%) |
Employment Characteristics in Yreka
Employment by Class of Employer in Yreka
Among the 3,025 employed individuals in Yreka, private company employees (1,713 | 56.6%), local government employees (369 | 12.2%), and state government employees (317 | 10.5%) make up the most common classes of employment.
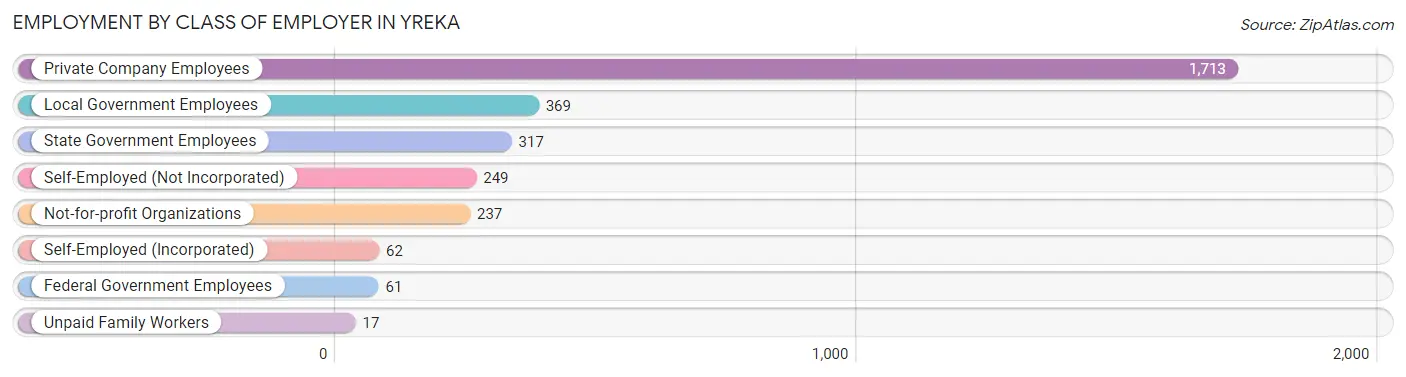
| Employer Class | # Employees | % Employees |
| Private Company Employees | 1,713 | 56.6% |
| Self-Employed (Incorporated) | 62 | 2.1% |
| Self-Employed (Not Incorporated) | 249 | 8.2% |
| Not-for-profit Organizations | 237 | 7.8% |
| Local Government Employees | 369 | 12.2% |
| State Government Employees | 317 | 10.5% |
| Federal Government Employees | 61 | 2.0% |
| Unpaid Family Workers | 17 | 0.6% |
| Total | 3,025 | 100.0% |
Employment Status by Age in Yreka
According to the labor force statistics for Yreka, out of the total population over 16 years of age (5,992), 53.9% or 3,230 individuals are in the labor force, with 4.0% or 129 of them unemployed. The age group with the highest labor force participation rate is 25 to 29 years, with 97.2% or 494 individuals in the labor force. Within the labor force, the 16 to 19 years age range has the highest percentage of unemployed individuals, with 39.2% or 47 of them being unemployed.
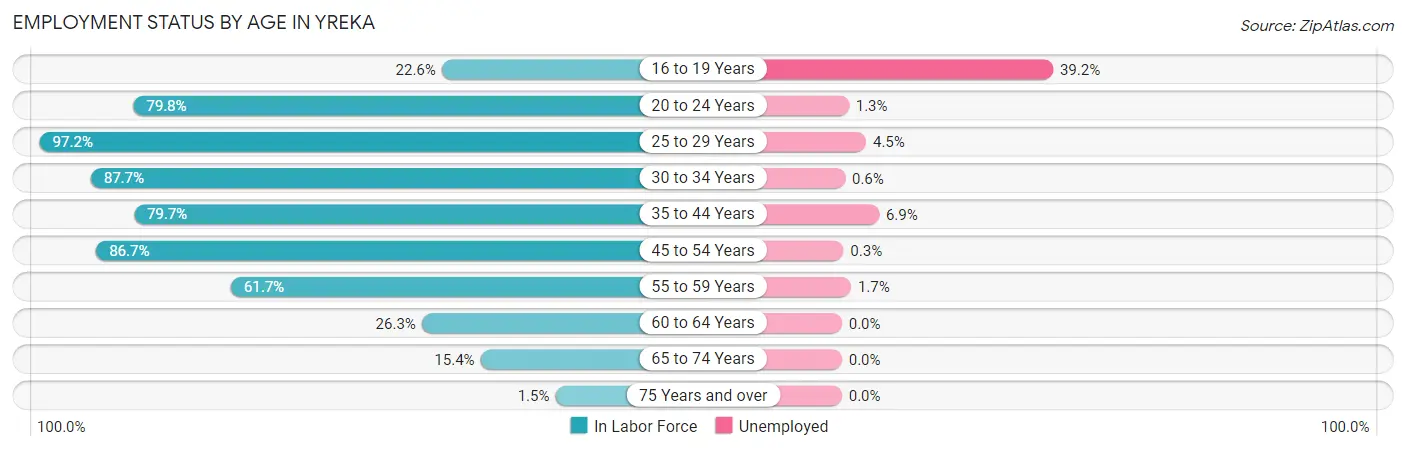
| Age Bracket | In Labor Force | Unemployed |
| 16 to 19 Years | 120 (22.6%) | 47 (39.2%) |
| 20 to 24 Years | 304 (79.8%) | 4 (1.3%) |
| 25 to 29 Years | 494 (97.2%) | 22 (4.5%) |
| 30 to 34 Years | 513 (87.7%) | 3 (0.6%) |
| 35 to 44 Years | 713 (79.7%) | 49 (6.9%) |
| 45 to 54 Years | 626 (86.7%) | 2 (0.3%) |
| 55 to 59 Years | 177 (61.7%) | 3 (1.7%) |
| 60 to 64 Years | 100 (26.3%) | 0 (0.0%) |
| 65 to 74 Years | 171 (15.4%) | 0 (0.0%) |
| 75 Years and over | 9 (1.5%) | 0 (0.0%) |
| Total | 3,230 (53.9%) | 129 (4.0%) |
Employment Status by Educational Attainment in Yreka
According to labor force statistics for Yreka, 77.7% of individuals (2,624) out of the total population between 25 and 64 years of age (3,377) are in the labor force, with 3.0% or 79 of them being unemployed. The group with the highest labor force participation rate are those with the educational attainment of bachelor's degree or higher, with 88.9% or 497 individuals in the labor force. Within the labor force, individuals with college / associate degree education have the highest percentage of unemployment, with 6.0% or 73 of them being unemployed.
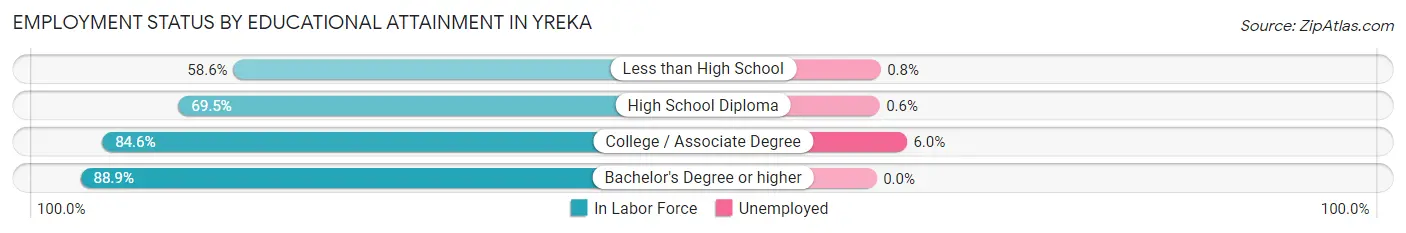
| Educational Attainment | In Labor Force | Unemployed |
| Less than High School | 262 (58.6%) | 4 (0.8%) |
| High School Diploma | 649 (69.5%) | 6 (0.6%) |
| College / Associate Degree | 1,216 (84.6%) | 86 (6.0%) |
| Bachelor's Degree or higher | 497 (88.9%) | 0 (0.0%) |
| Total | 2,624 (77.7%) | 101 (3.0%) |
Employment Occupations by Sex in Yreka
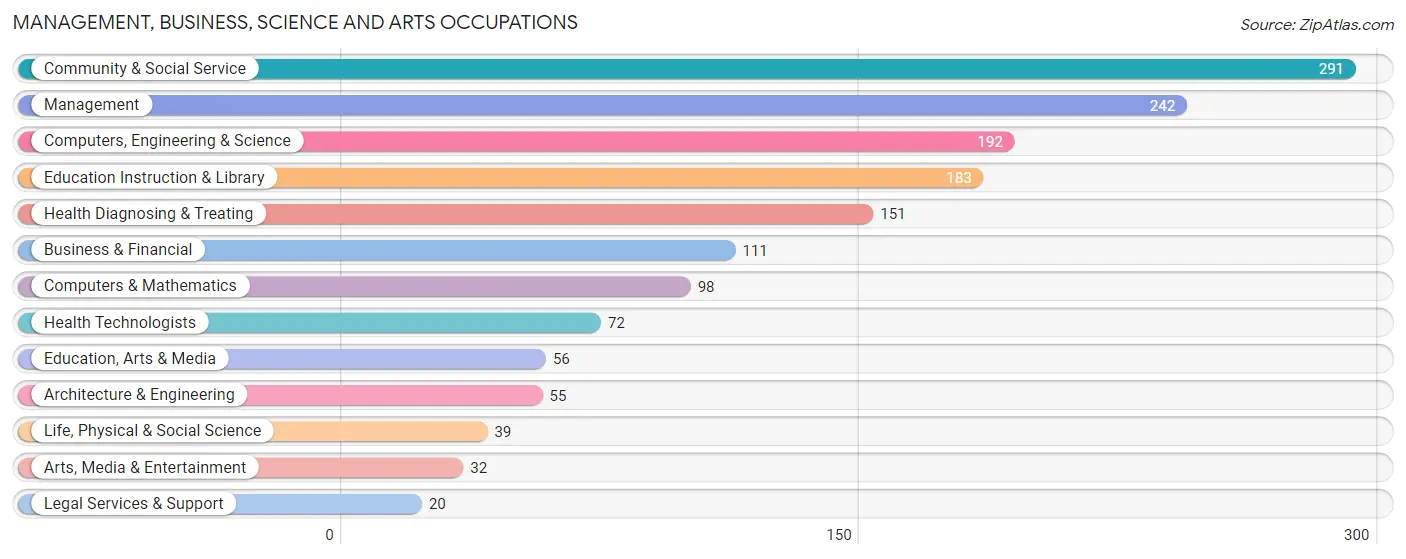
Management, Business, Science and Arts Occupations
The most common Management, Business, Science and Arts occupations in Yreka are Community & Social Service (291 | 9.4%), Management (242 | 7.8%), Computers, Engineering & Science (192 | 6.2%), Education Instruction & Library (183 | 5.9%), and Health Diagnosing & Treating (151 | 4.9%).
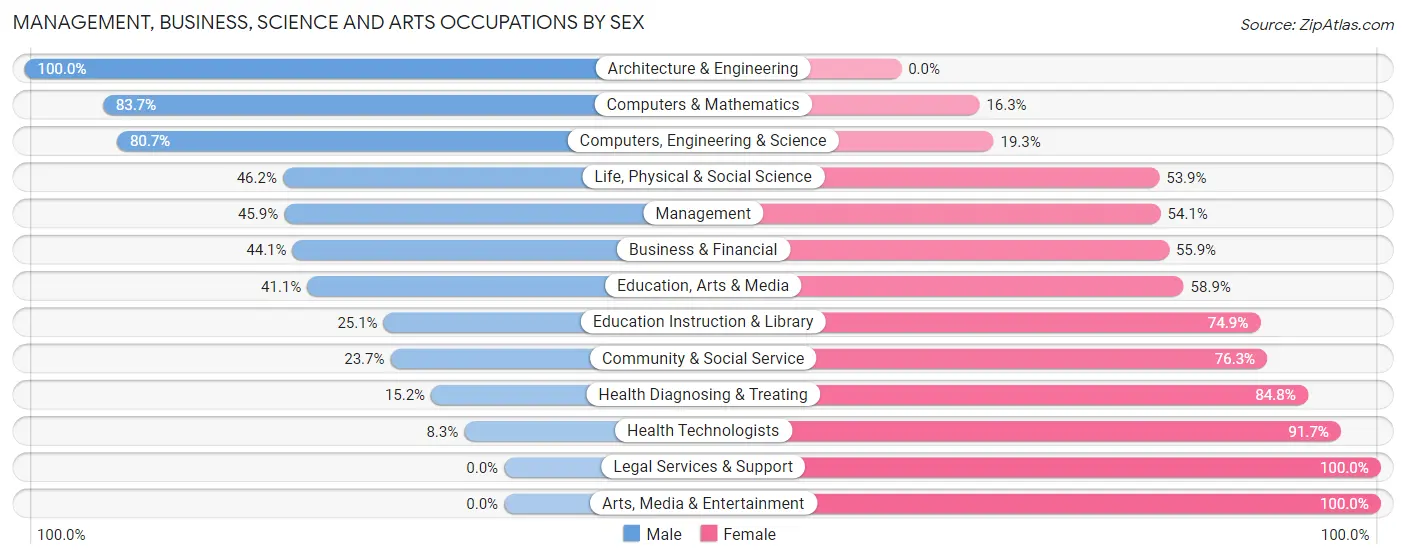
Management, Business, Science and Arts Occupations by Sex
Within the Management, Business, Science and Arts occupations in Yreka, the most male-oriented occupations are Architecture & Engineering (100.0%), Computers & Mathematics (83.7%), and Computers, Engineering & Science (80.7%), while the most female-oriented occupations are Legal Services & Support (100.0%), Arts, Media & Entertainment (100.0%), and Health Technologists (91.7%).
| Occupation | Male | Female |
| Management | 111 (45.9%) | 131 (54.1%) |
| Business & Financial | 49 (44.1%) | 62 (55.9%) |
| Computers, Engineering & Science | 155 (80.7%) | 37 (19.3%) |
| Computers & Mathematics | 82 (83.7%) | 16 (16.3%) |
| Architecture & Engineering | 55 (100.0%) | 0 (0.0%) |
| Life, Physical & Social Science | 18 (46.2%) | 21 (53.8%) |
| Community & Social Service | 69 (23.7%) | 222 (76.3%) |
| Education, Arts & Media | 23 (41.1%) | 33 (58.9%) |
| Legal Services & Support | 0 (0.0%) | 20 (100.0%) |
| Education Instruction & Library | 46 (25.1%) | 137 (74.9%) |
| Arts, Media & Entertainment | 0 (0.0%) | 32 (100.0%) |
| Health Diagnosing & Treating | 23 (15.2%) | 128 (84.8%) |
| Health Technologists | 6 (8.3%) | 66 (91.7%) |
| Total (Category) | 407 (41.2%) | 580 (58.8%) |
| Total (Overall) | 1,472 (47.5%) | 1,624 (52.4%) |
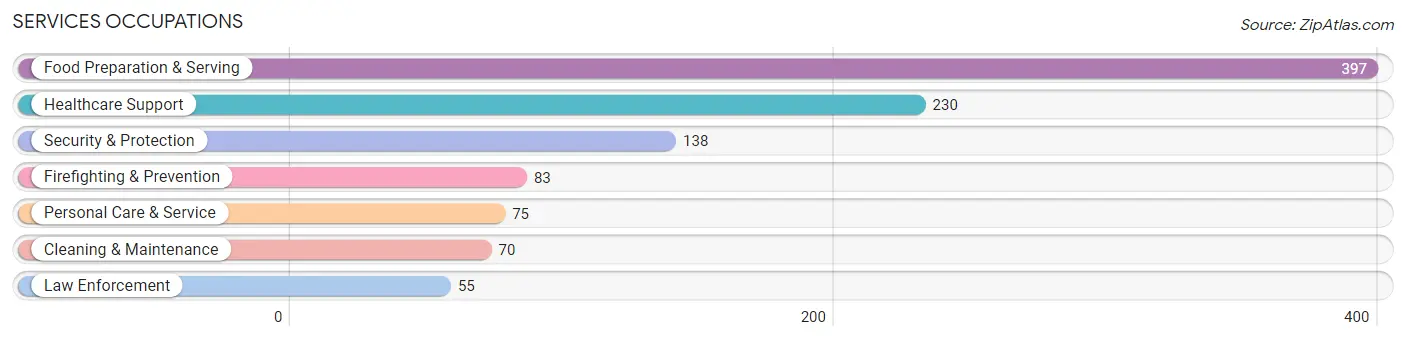
Services Occupations
The most common Services occupations in Yreka are Food Preparation & Serving (397 | 12.8%), Healthcare Support (230 | 7.4%), Security & Protection (138 | 4.5%), Firefighting & Prevention (83 | 2.7%), and Personal Care & Service (75 | 2.4%).
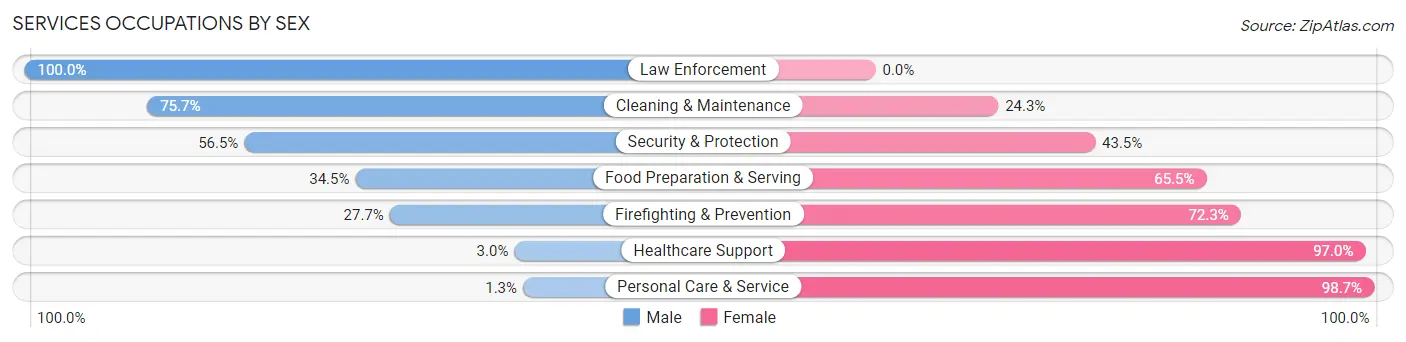
Services Occupations by Sex
Within the Services occupations in Yreka, the most male-oriented occupations are Law Enforcement (100.0%), Cleaning & Maintenance (75.7%), and Security & Protection (56.5%), while the most female-oriented occupations are Personal Care & Service (98.7%), Healthcare Support (97.0%), and Firefighting & Prevention (72.3%).
| Occupation | Male | Female |
| Healthcare Support | 7 (3.0%) | 223 (97.0%) |
| Security & Protection | 78 (56.5%) | 60 (43.5%) |
| Firefighting & Prevention | 23 (27.7%) | 60 (72.3%) |
| Law Enforcement | 55 (100.0%) | 0 (0.0%) |
| Food Preparation & Serving | 137 (34.5%) | 260 (65.5%) |
| Cleaning & Maintenance | 53 (75.7%) | 17 (24.3%) |
| Personal Care & Service | 1 (1.3%) | 74 (98.7%) |
| Total (Category) | 276 (30.3%) | 634 (69.7%) |
| Total (Overall) | 1,472 (47.5%) | 1,624 (52.4%) |
Sales and Office Occupations
The most common Sales and Office occupations in Yreka are Office & Administration (271 | 8.7%), and Sales & Related (204 | 6.6%).
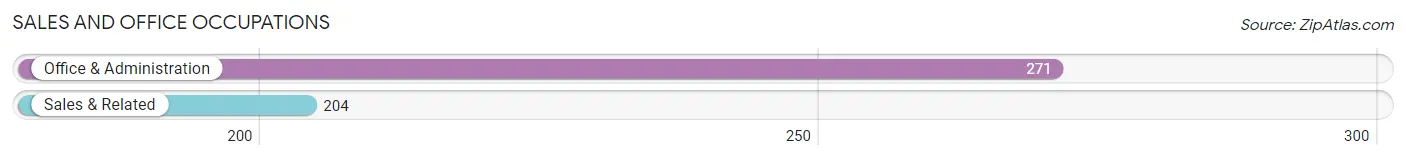
Sales and Office Occupations by Sex
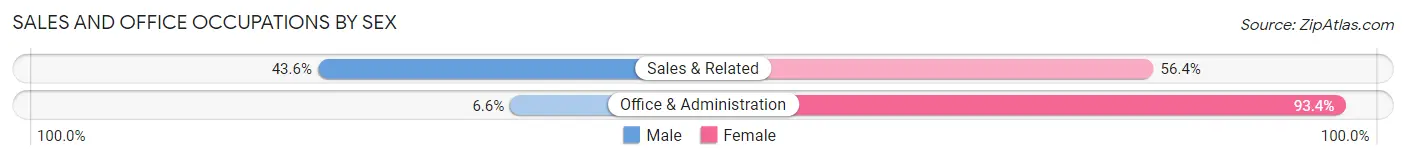
| Occupation | Male | Female |
| Sales & Related | 89 (43.6%) | 115 (56.4%) |
| Office & Administration | 18 (6.6%) | 253 (93.4%) |
| Total (Category) | 107 (22.5%) | 368 (77.5%) |
| Total (Overall) | 1,472 (47.5%) | 1,624 (52.4%) |
Natural Resources, Construction and Maintenance Occupations
The most common Natural Resources, Construction and Maintenance occupations in Yreka are Construction & Extraction (146 | 4.7%), Installation, Maintenance & Repair (107 | 3.5%), and Farming, Fishing & Forestry (37 | 1.2%).
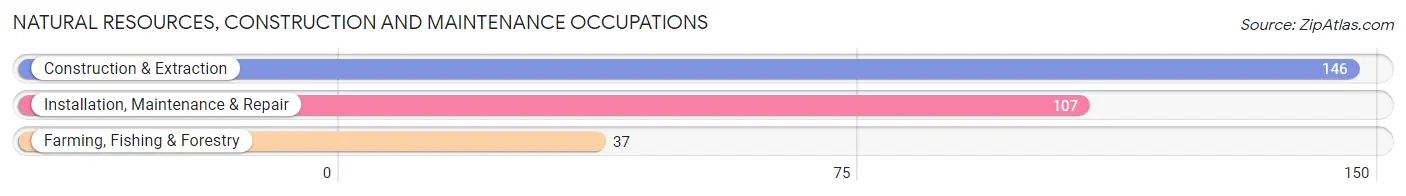
Natural Resources, Construction and Maintenance Occupations by Sex
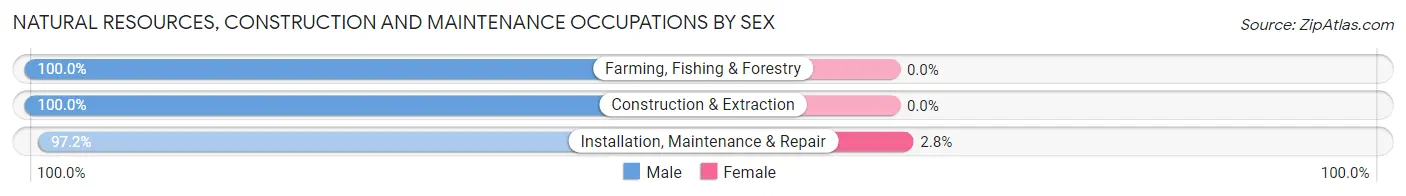
| Occupation | Male | Female |
| Farming, Fishing & Forestry | 37 (100.0%) | 0 (0.0%) |
| Construction & Extraction | 146 (100.0%) | 0 (0.0%) |
| Installation, Maintenance & Repair | 104 (97.2%) | 3 (2.8%) |
| Total (Category) | 287 (99.0%) | 3 (1.0%) |
| Total (Overall) | 1,472 (47.5%) | 1,624 (52.4%) |
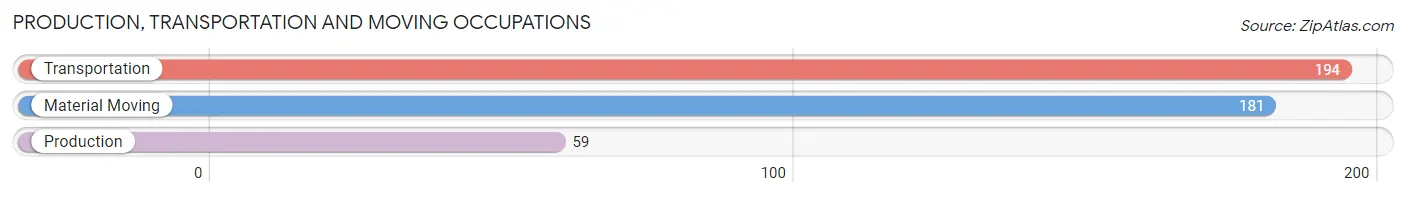
Production, Transportation and Moving Occupations
The most common Production, Transportation and Moving occupations in Yreka are Transportation (194 | 6.3%), Material Moving (181 | 5.9%), and Production (59 | 1.9%).
Production, Transportation and Moving Occupations by Sex
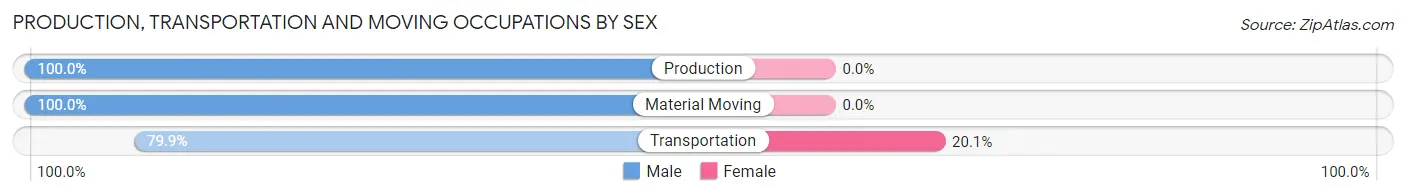
| Occupation | Male | Female |
| Production | 59 (100.0%) | 0 (0.0%) |
| Transportation | 155 (79.9%) | 39 (20.1%) |
| Material Moving | 181 (100.0%) | 0 (0.0%) |
| Total (Category) | 395 (91.0%) | 39 (9.0%) |
| Total (Overall) | 1,472 (47.5%) | 1,624 (52.4%) |
Employment Industries by Sex in Yreka
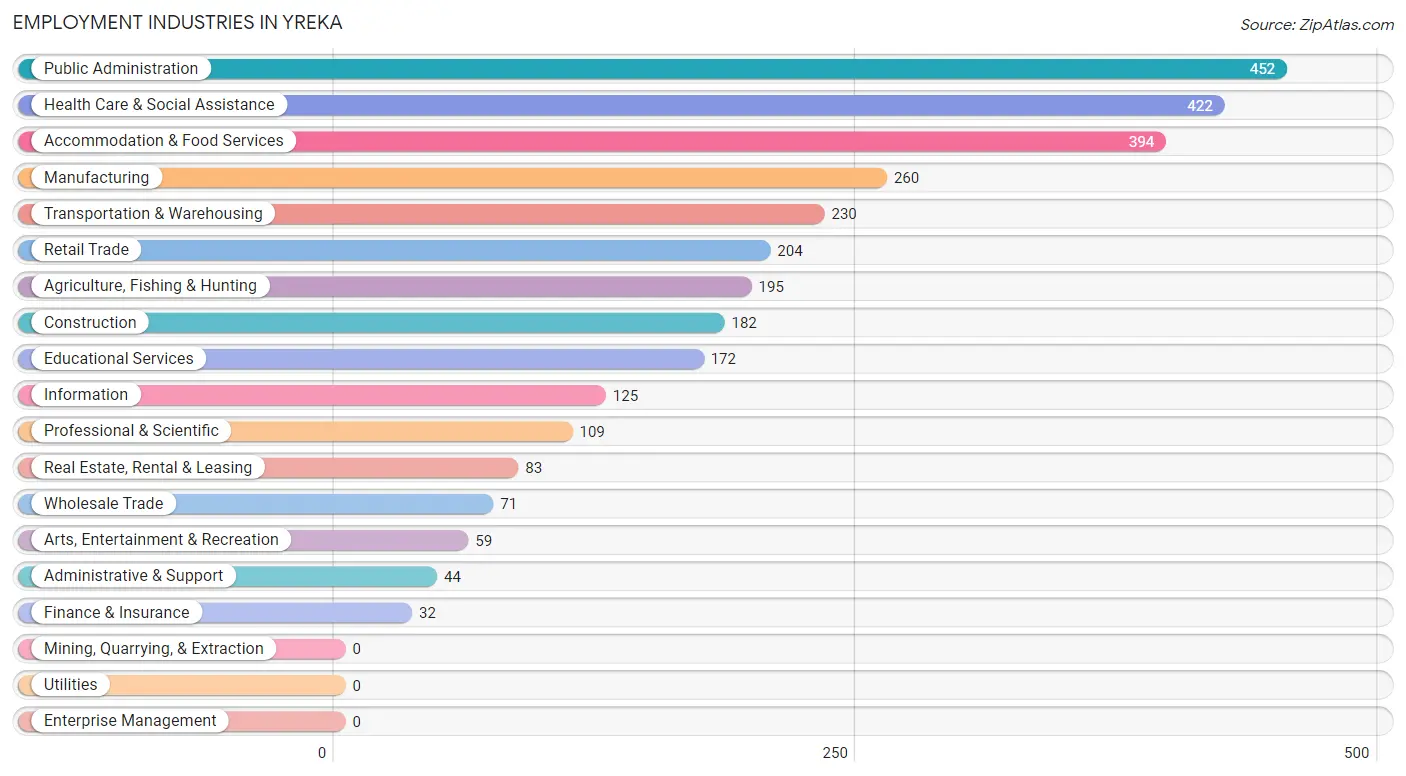
Employment Industries in Yreka
The major employment industries in Yreka include Public Administration (452 | 14.6%), Health Care & Social Assistance (422 | 13.6%), Accommodation & Food Services (394 | 12.7%), Manufacturing (260 | 8.4%), and Transportation & Warehousing (230 | 7.4%).
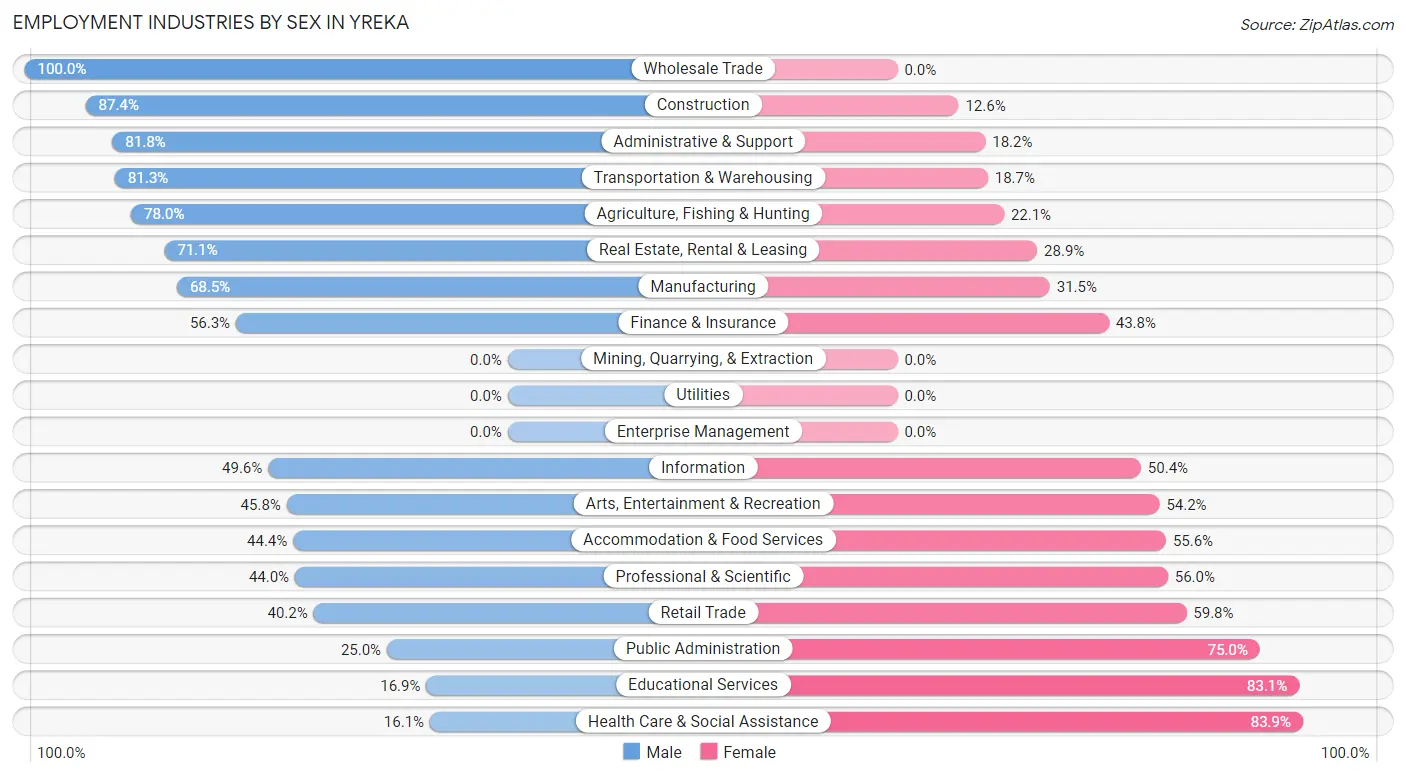
Employment Industries by Sex in Yreka
The Yreka industries that see more men than women are Wholesale Trade (100.0%), Construction (87.4%), and Administrative & Support (81.8%), whereas the industries that tend to have a higher number of women are Health Care & Social Assistance (83.9%), Educational Services (83.1%), and Public Administration (75.0%).
| Industry | Male | Female |
| Agriculture, Fishing & Hunting | 152 (77.9%) | 43 (22.1%) |
| Mining, Quarrying, & Extraction | 0 (0.0%) | 0 (0.0%) |
| Construction | 159 (87.4%) | 23 (12.6%) |
| Manufacturing | 178 (68.5%) | 82 (31.5%) |
| Wholesale Trade | 71 (100.0%) | 0 (0.0%) |
| Retail Trade | 82 (40.2%) | 122 (59.8%) |
| Transportation & Warehousing | 187 (81.3%) | 43 (18.7%) |
| Utilities | 0 (0.0%) | 0 (0.0%) |
| Information | 62 (49.6%) | 63 (50.4%) |
| Finance & Insurance | 18 (56.2%) | 14 (43.8%) |
| Real Estate, Rental & Leasing | 59 (71.1%) | 24 (28.9%) |
| Professional & Scientific | 48 (44.0%) | 61 (56.0%) |
| Enterprise Management | 0 (0.0%) | 0 (0.0%) |
| Administrative & Support | 36 (81.8%) | 8 (18.2%) |
| Educational Services | 29 (16.9%) | 143 (83.1%) |
| Health Care & Social Assistance | 68 (16.1%) | 354 (83.9%) |
| Arts, Entertainment & Recreation | 27 (45.8%) | 32 (54.2%) |
| Accommodation & Food Services | 175 (44.4%) | 219 (55.6%) |
| Public Administration | 113 (25.0%) | 339 (75.0%) |
| Total | 1,472 (47.5%) | 1,624 (52.4%) |
Education in Yreka
School Enrollment in Yreka
The most common levels of schooling among the 2,356 students in Yreka are middle school (630 | 26.7%), high school (533 | 22.6%), and elementary school (401 | 17.0%).
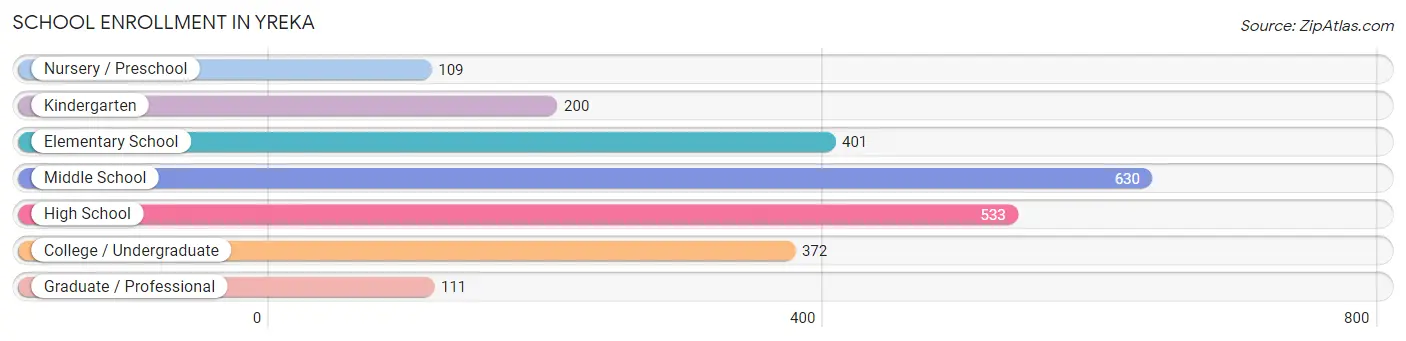
| School Level | # Students | % Students |
| Nursery / Preschool | 109 | 4.6% |
| Kindergarten | 200 | 8.5% |
| Elementary School | 401 | 17.0% |
| Middle School | 630 | 26.7% |
| High School | 533 | 22.6% |
| College / Undergraduate | 372 | 15.8% |
| Graduate / Professional | 111 | 4.7% |
| Total | 2,356 | 100.0% |
School Enrollment by Age by Funding Source in Yreka
Out of a total of 2,356 students who are enrolled in schools in Yreka, 294 (12.5%) attend a private institution, while the remaining 2,062 (87.5%) are enrolled in public schools. The age group of 25 to 34 year olds has the highest likelihood of being enrolled in private schools, with 48 (31.6% in the age bracket) enrolled. Conversely, the age group of 15 to 17 year olds has the lowest likelihood of being enrolled in a private school, with 378 (100.0% in the age bracket) attending a public institution.
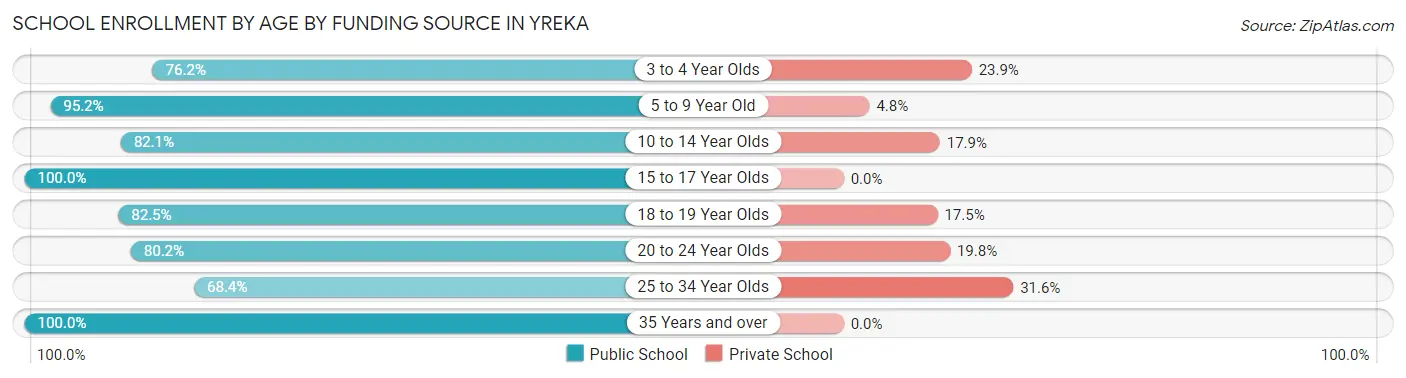
| Age Bracket | Public School | Private School |
| 3 to 4 Year Olds | 83 (76.1%) | 26 (23.8%) |
| 5 to 9 Year Old | 516 (95.2%) | 26 (4.8%) |
| 10 to 14 Year Olds | 614 (82.1%) | 134 (17.9%) |
| 15 to 17 Year Olds | 378 (100.0%) | 0 (0.0%) |
| 18 to 19 Year Olds | 189 (82.5%) | 40 (17.5%) |
| 20 to 24 Year Olds | 81 (80.2%) | 20 (19.8%) |
| 25 to 34 Year Olds | 104 (68.4%) | 48 (31.6%) |
| 35 Years and over | 97 (100.0%) | 0 (0.0%) |
| Total | 2,062 (87.5%) | 294 (12.5%) |
Educational Attainment by Field of Study in Yreka
Business (256 | 22.9%), social sciences (207 | 18.5%), bio, nature & agricultural (160 | 14.3%), psychology (109 | 9.8%), and literature & languages (77 | 6.9%) are the most common fields of study among 1,116 individuals in Yreka who have obtained a bachelor's degree or higher.
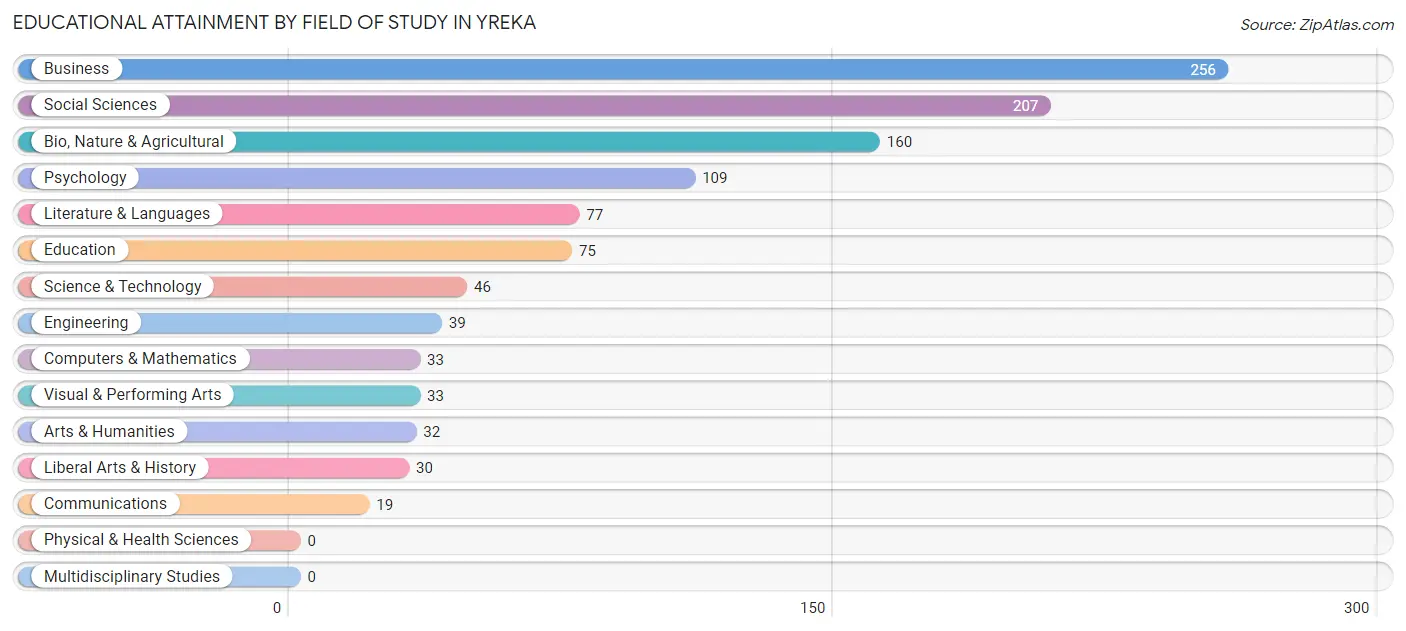
| Field of Study | # Graduates | % Graduates |
| Computers & Mathematics | 33 | 3.0% |
| Bio, Nature & Agricultural | 160 | 14.3% |
| Physical & Health Sciences | 0 | 0.0% |
| Psychology | 109 | 9.8% |
| Social Sciences | 207 | 18.5% |
| Engineering | 39 | 3.5% |
| Multidisciplinary Studies | 0 | 0.0% |
| Science & Technology | 46 | 4.1% |
| Business | 256 | 22.9% |
| Education | 75 | 6.7% |
| Literature & Languages | 77 | 6.9% |
| Liberal Arts & History | 30 | 2.7% |
| Visual & Performing Arts | 33 | 3.0% |
| Communications | 19 | 1.7% |
| Arts & Humanities | 32 | 2.9% |
| Total | 1,116 | 100.0% |
Transportation & Commute in Yreka
Vehicle Availability by Sex in Yreka
The most prevalent vehicle ownership categories in Yreka are males with 2 vehicles (707, accounting for 49.3%) and females with 2 vehicles (623, making up 44.6%).
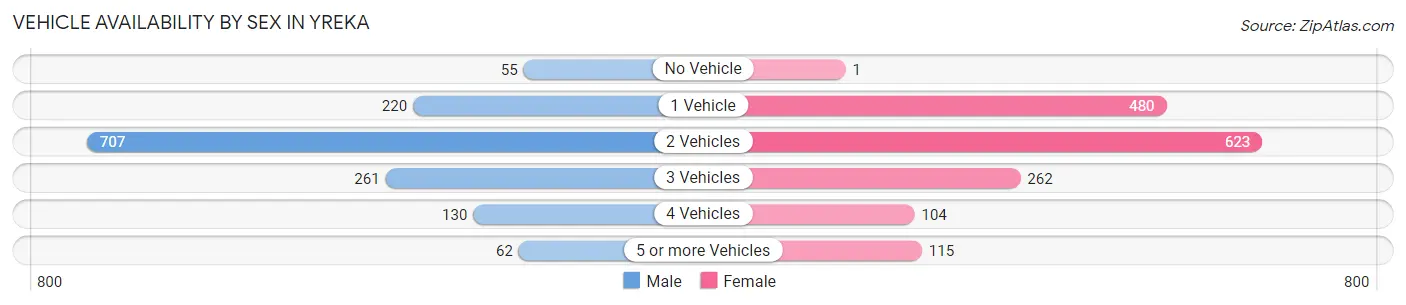
| Vehicles Available | Male | Female |
| No Vehicle | 55 (3.8%) | 1 (0.1%) |
| 1 Vehicle | 220 (15.3%) | 480 (30.3%) |
| 2 Vehicles | 707 (49.3%) | 623 (39.3%) |
| 3 Vehicles | 261 (18.2%) | 262 (16.5%) |
| 4 Vehicles | 130 (9.1%) | 104 (6.6%) |
| 5 or more Vehicles | 62 (4.3%) | 115 (7.3%) |
| Total | 1,435 (100.0%) | 1,585 (100.0%) |
Commute Time in Yreka
The most frequently occuring commute durations in Yreka are 5 to 9 minutes (1,258 commuters, 44.3%), 10 to 14 minutes (411 commuters, 14.5%), and less than 5 minutes (355 commuters, 12.5%).
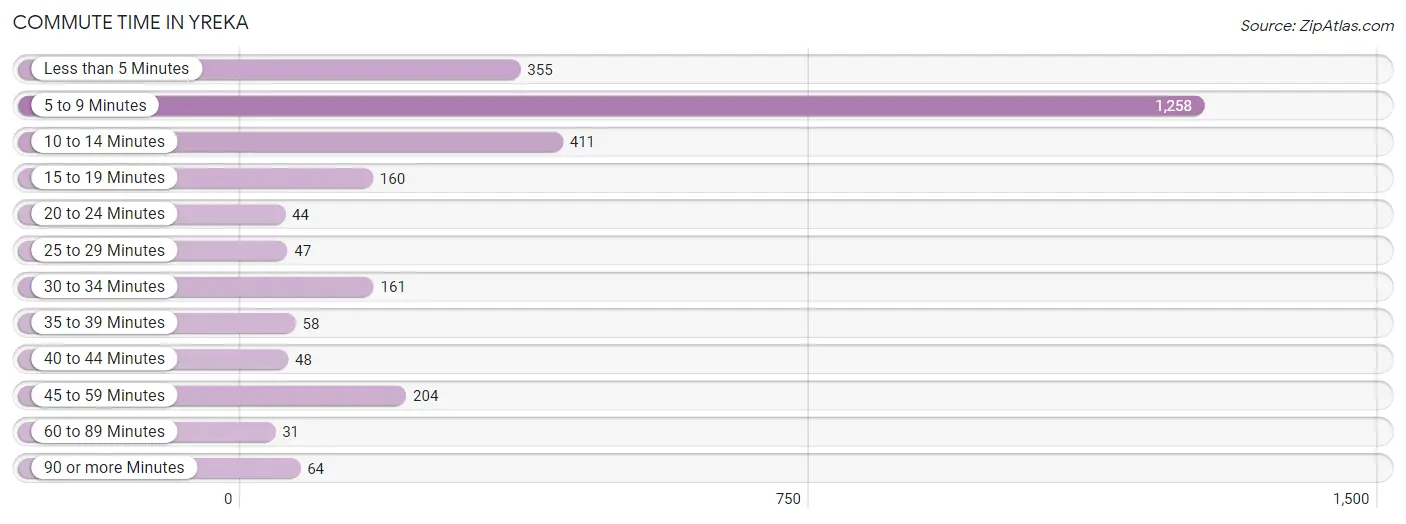
| Commute Time | # Commuters | % Commuters |
| Less than 5 Minutes | 355 | 12.5% |
| 5 to 9 Minutes | 1,258 | 44.3% |
| 10 to 14 Minutes | 411 | 14.5% |
| 15 to 19 Minutes | 160 | 5.6% |
| 20 to 24 Minutes | 44 | 1.5% |
| 25 to 29 Minutes | 47 | 1.7% |
| 30 to 34 Minutes | 161 | 5.7% |
| 35 to 39 Minutes | 58 | 2.0% |
| 40 to 44 Minutes | 48 | 1.7% |
| 45 to 59 Minutes | 204 | 7.2% |
| 60 to 89 Minutes | 31 | 1.1% |
| 90 or more Minutes | 64 | 2.2% |
Commute Time by Sex in Yreka
The most common commute times in Yreka are 5 to 9 minutes (430 commuters, 31.7%) for males and 5 to 9 minutes (828 commuters, 55.8%) for females.
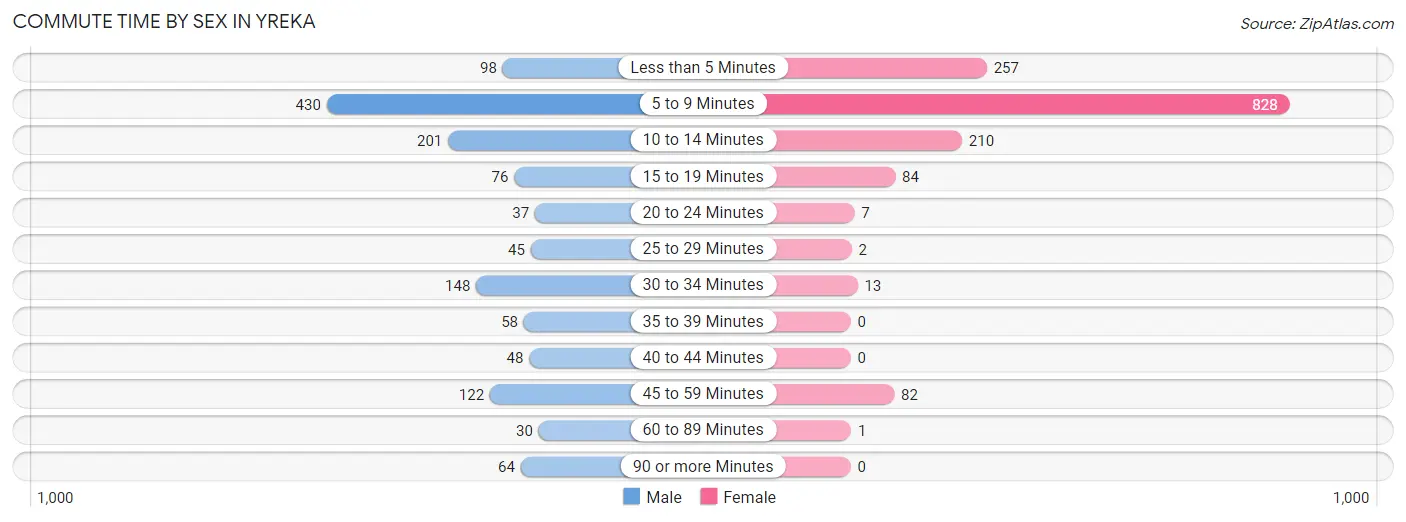
| Commute Time | Male | Female |
| Less than 5 Minutes | 98 (7.2%) | 257 (17.3%) |
| 5 to 9 Minutes | 430 (31.7%) | 828 (55.8%) |
| 10 to 14 Minutes | 201 (14.8%) | 210 (14.1%) |
| 15 to 19 Minutes | 76 (5.6%) | 84 (5.7%) |
| 20 to 24 Minutes | 37 (2.7%) | 7 (0.5%) |
| 25 to 29 Minutes | 45 (3.3%) | 2 (0.1%) |
| 30 to 34 Minutes | 148 (10.9%) | 13 (0.9%) |
| 35 to 39 Minutes | 58 (4.3%) | 0 (0.0%) |
| 40 to 44 Minutes | 48 (3.5%) | 0 (0.0%) |
| 45 to 59 Minutes | 122 (9.0%) | 82 (5.5%) |
| 60 to 89 Minutes | 30 (2.2%) | 1 (0.1%) |
| 90 or more Minutes | 64 (4.7%) | 0 (0.0%) |
Time of Departure to Work by Sex in Yreka
The most frequent times of departure to work in Yreka are 7:00 AM to 7:29 AM (283, 20.8%) for males and 7:30 AM to 7:59 AM (527, 35.5%) for females.
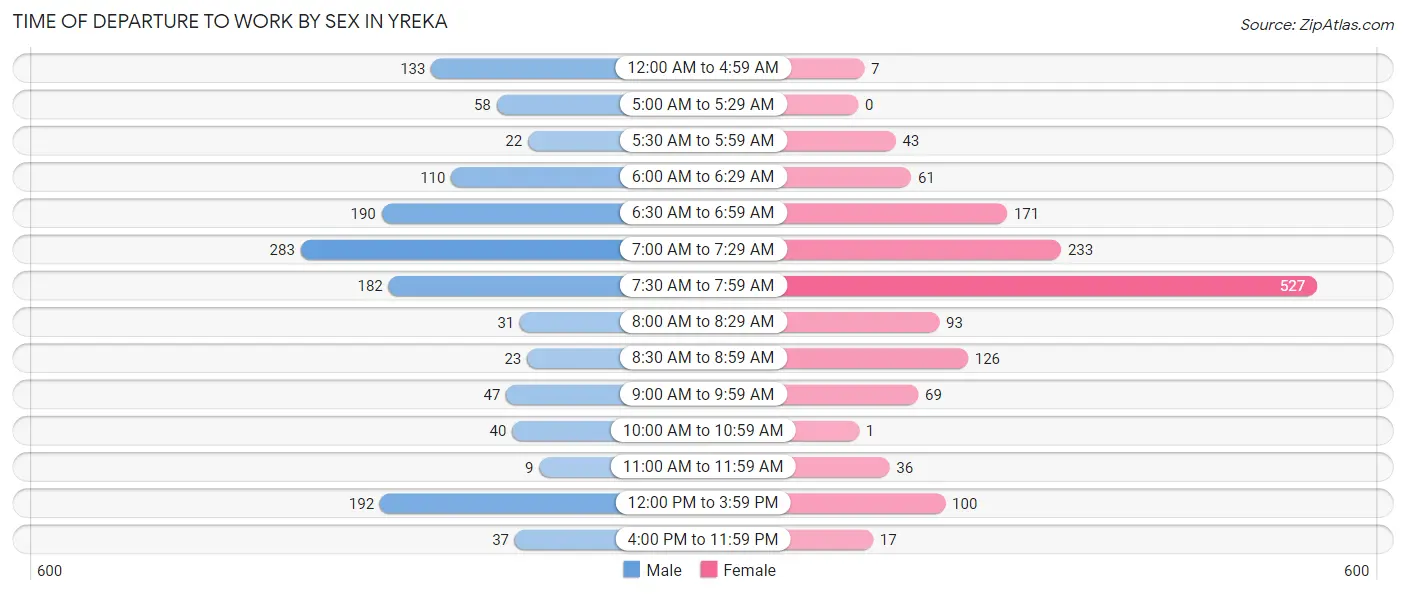
| Time of Departure | Male | Female |
| 12:00 AM to 4:59 AM | 133 (9.8%) | 7 (0.5%) |
| 5:00 AM to 5:29 AM | 58 (4.3%) | 0 (0.0%) |
| 5:30 AM to 5:59 AM | 22 (1.6%) | 43 (2.9%) |
| 6:00 AM to 6:29 AM | 110 (8.1%) | 61 (4.1%) |
| 6:30 AM to 6:59 AM | 190 (14.0%) | 171 (11.5%) |
| 7:00 AM to 7:29 AM | 283 (20.8%) | 233 (15.7%) |
| 7:30 AM to 7:59 AM | 182 (13.4%) | 527 (35.5%) |
| 8:00 AM to 8:29 AM | 31 (2.3%) | 93 (6.3%) |
| 8:30 AM to 8:59 AM | 23 (1.7%) | 126 (8.5%) |
| 9:00 AM to 9:59 AM | 47 (3.5%) | 69 (4.6%) |
| 10:00 AM to 10:59 AM | 40 (2.9%) | 1 (0.1%) |
| 11:00 AM to 11:59 AM | 9 (0.7%) | 36 (2.4%) |
| 12:00 PM to 3:59 PM | 192 (14.1%) | 100 (6.7%) |
| 4:00 PM to 11:59 PM | 37 (2.7%) | 17 (1.1%) |
| Total | 1,357 (100.0%) | 1,484 (100.0%) |
Housing Occupancy in Yreka
Occupancy by Ownership in Yreka
Of the total 3,230 dwellings in Yreka, owner-occupied units account for 1,976 (61.2%), while renter-occupied units make up 1,254 (38.8%).
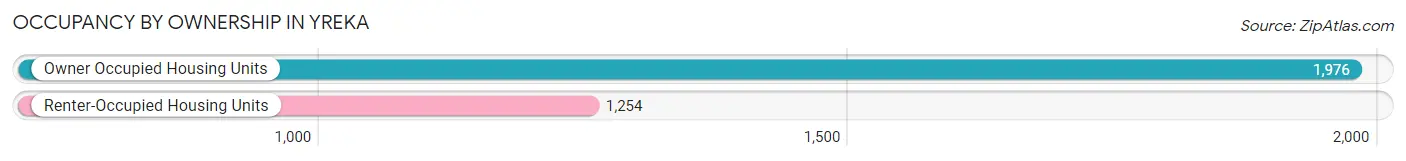
| Occupancy | # Housing Units | % Housing Units |
| Owner Occupied Housing Units | 1,976 | 61.2% |
| Renter-Occupied Housing Units | 1,254 | 38.8% |
| Total Occupied Housing Units | 3,230 | 100.0% |
Occupancy by Household Size in Yreka
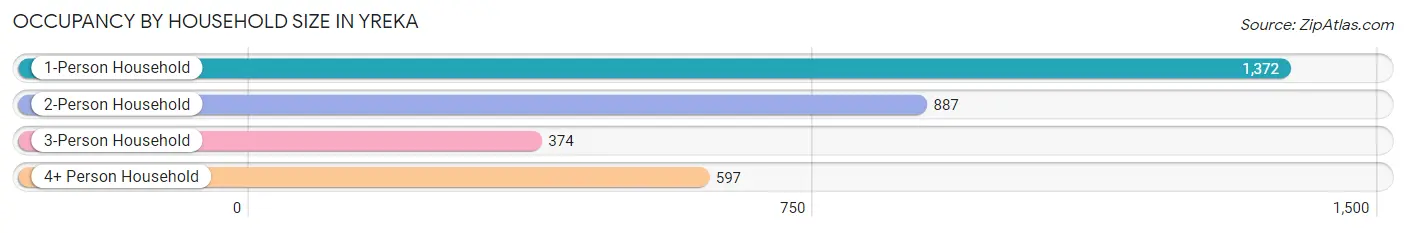
| Household Size | # Housing Units | % Housing Units |
| 1-Person Household | 1,372 | 42.5% |
| 2-Person Household | 887 | 27.5% |
| 3-Person Household | 374 | 11.6% |
| 4+ Person Household | 597 | 18.5% |
| Total Housing Units | 3,230 | 100.0% |
Occupancy by Ownership by Household Size in Yreka
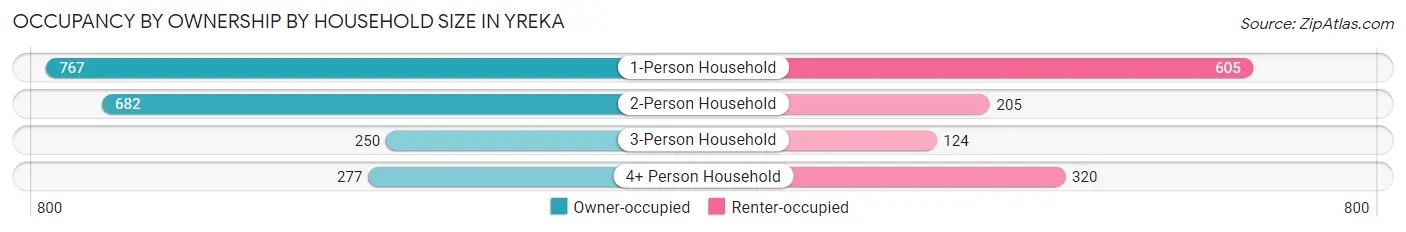
| Household Size | Owner-occupied | Renter-occupied |
| 1-Person Household | 767 (55.9%) | 605 (44.1%) |
| 2-Person Household | 682 (76.9%) | 205 (23.1%) |
| 3-Person Household | 250 (66.8%) | 124 (33.2%) |
| 4+ Person Household | 277 (46.4%) | 320 (53.6%) |
| Total Housing Units | 1,976 (61.2%) | 1,254 (38.8%) |
Occupancy by Educational Attainment in Yreka
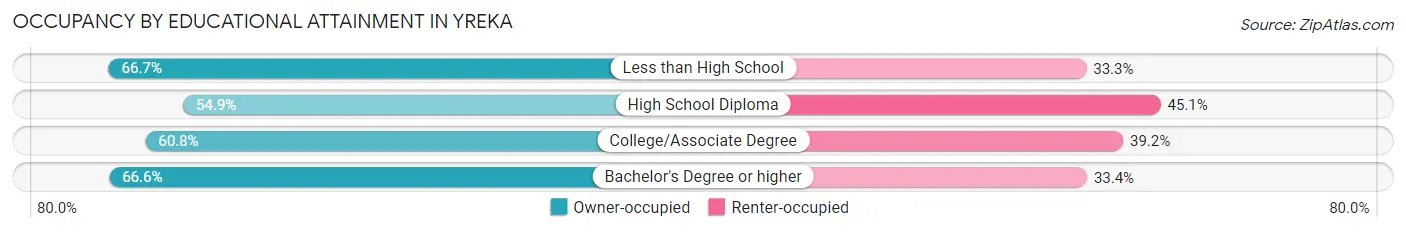
| Household Size | Owner-occupied | Renter-occupied |
| Less than High School | 180 (66.7%) | 90 (33.3%) |
| High School Diploma | 405 (54.9%) | 333 (45.1%) |
| College/Associate Degree | 937 (60.8%) | 603 (39.2%) |
| Bachelor's Degree or higher | 454 (66.6%) | 228 (33.4%) |
Occupancy by Age of Householder in Yreka
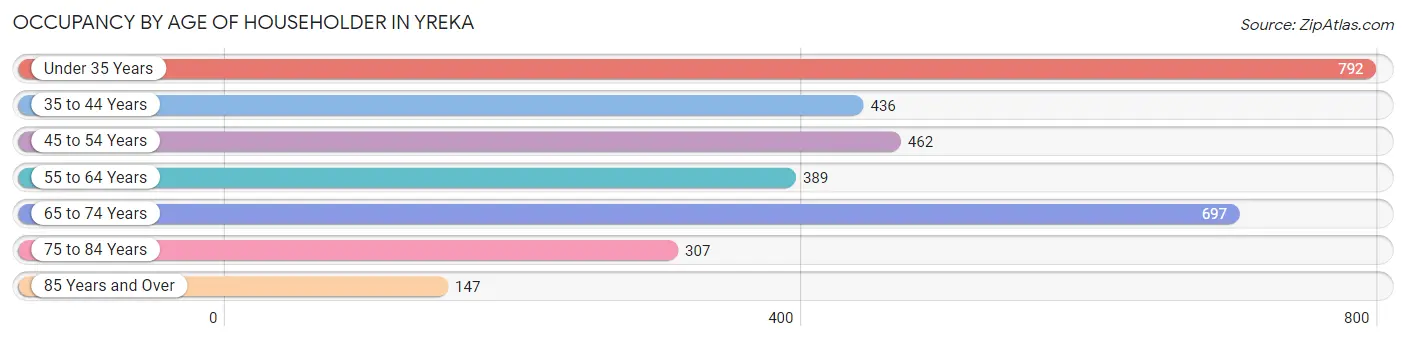
| Age Bracket | # Households | % Households |
| Under 35 Years | 792 | 24.5% |
| 35 to 44 Years | 436 | 13.5% |
| 45 to 54 Years | 462 | 14.3% |
| 55 to 64 Years | 389 | 12.0% |
| 65 to 74 Years | 697 | 21.6% |
| 75 to 84 Years | 307 | 9.5% |
| 85 Years and Over | 147 | 4.5% |
| Total | 3,230 | 100.0% |
Housing Finances in Yreka
Median Income by Occupancy in Yreka
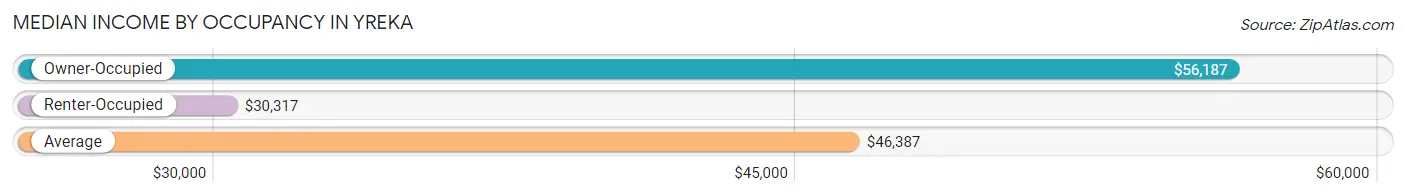
| Occupancy Type | # Households | Median Income |
| Owner-Occupied | 1,976 (61.2%) | $56,187 |
| Renter-Occupied | 1,254 (38.8%) | $30,317 |
| Average | 3,230 (100.0%) | $46,387 |
Occupancy by Householder Income Bracket in Yreka
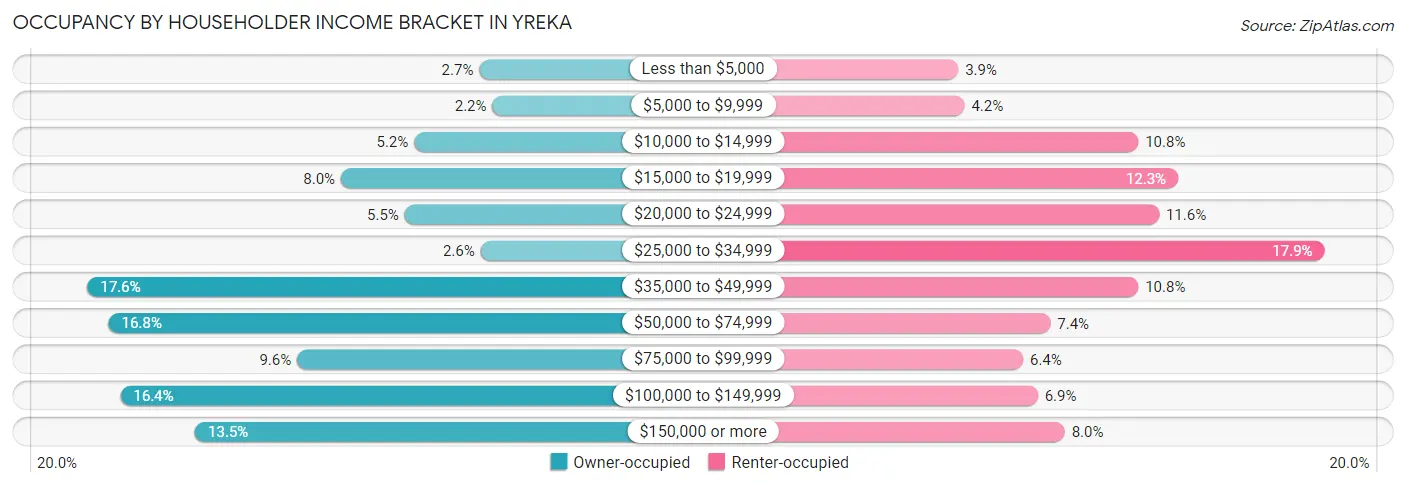
| Income Bracket | Owner-occupied | Renter-occupied |
| Less than $5,000 | 53 (2.7%) | 49 (3.9%) |
| $5,000 to $9,999 | 43 (2.2%) | 52 (4.2%) |
| $10,000 to $14,999 | 102 (5.2%) | 135 (10.8%) |
| $15,000 to $19,999 | 157 (8.0%) | 154 (12.3%) |
| $20,000 to $24,999 | 109 (5.5%) | 145 (11.6%) |
| $25,000 to $34,999 | 52 (2.6%) | 224 (17.9%) |
| $35,000 to $49,999 | 348 (17.6%) | 135 (10.8%) |
| $50,000 to $74,999 | 332 (16.8%) | 93 (7.4%) |
| $75,000 to $99,999 | 190 (9.6%) | 80 (6.4%) |
| $100,000 to $149,999 | 323 (16.4%) | 87 (6.9%) |
| $150,000 or more | 267 (13.5%) | 100 (8.0%) |
| Total | 1,976 (100.0%) | 1,254 (100.0%) |
Monthly Housing Cost Tiers in Yreka
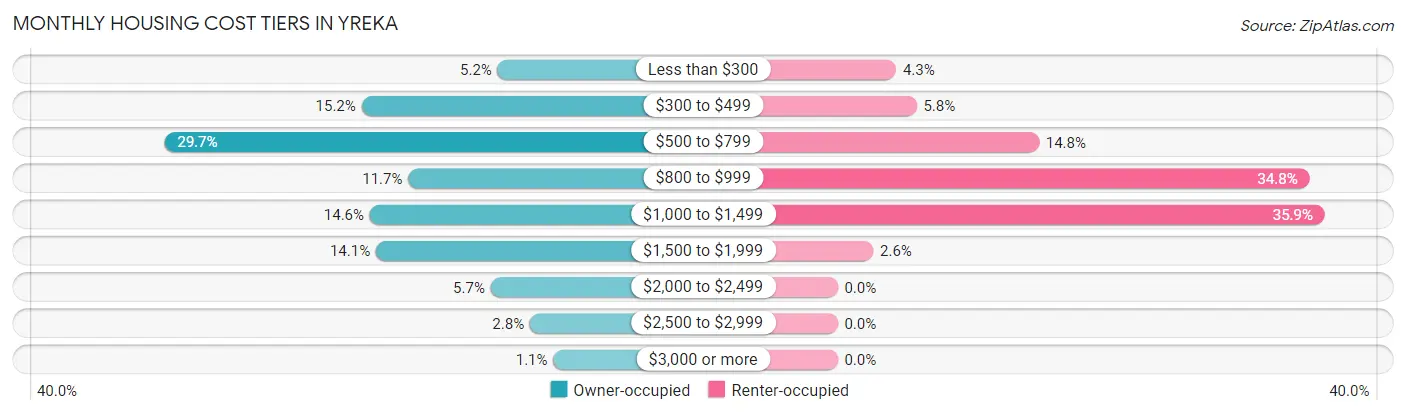
| Monthly Cost | Owner-occupied | Renter-occupied |
| Less than $300 | 102 (5.2%) | 54 (4.3%) |
| $300 to $499 | 300 (15.2%) | 73 (5.8%) |
| $500 to $799 | 587 (29.7%) | 186 (14.8%) |
| $800 to $999 | 232 (11.7%) | 436 (34.8%) |
| $1,000 to $1,499 | 288 (14.6%) | 450 (35.9%) |
| $1,500 to $1,999 | 279 (14.1%) | 33 (2.6%) |
| $2,000 to $2,499 | 112 (5.7%) | 0 (0.0%) |
| $2,500 to $2,999 | 55 (2.8%) | 0 (0.0%) |
| $3,000 or more | 21 (1.1%) | 0 (0.0%) |
| Total | 1,976 (100.0%) | 1,254 (100.0%) |
Physical Housing Characteristics in Yreka
Housing Structures in Yreka
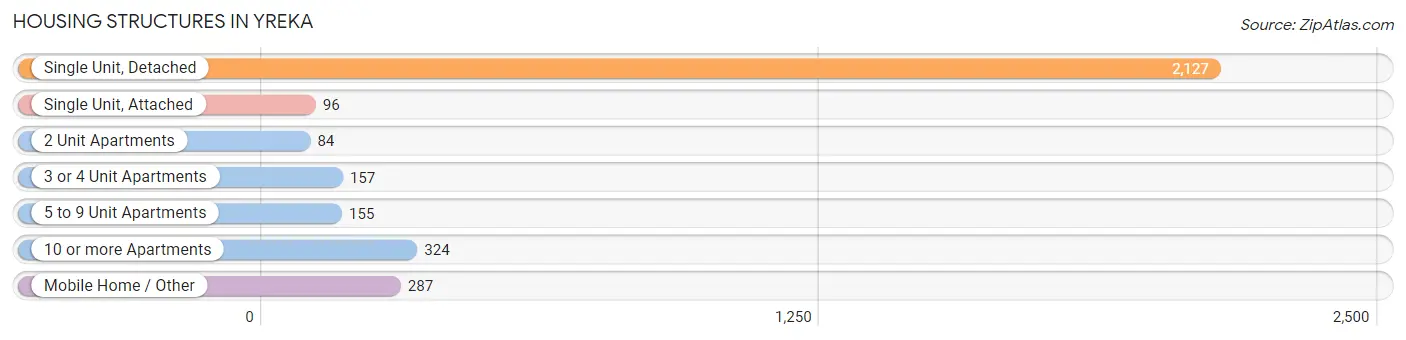
| Structure Type | # Housing Units | % Housing Units |
| Single Unit, Detached | 2,127 | 65.8% |
| Single Unit, Attached | 96 | 3.0% |
| 2 Unit Apartments | 84 | 2.6% |
| 3 or 4 Unit Apartments | 157 | 4.9% |
| 5 to 9 Unit Apartments | 155 | 4.8% |
| 10 or more Apartments | 324 | 10.0% |
| Mobile Home / Other | 287 | 8.9% |
| Total | 3,230 | 100.0% |
Housing Structures by Occupancy in Yreka
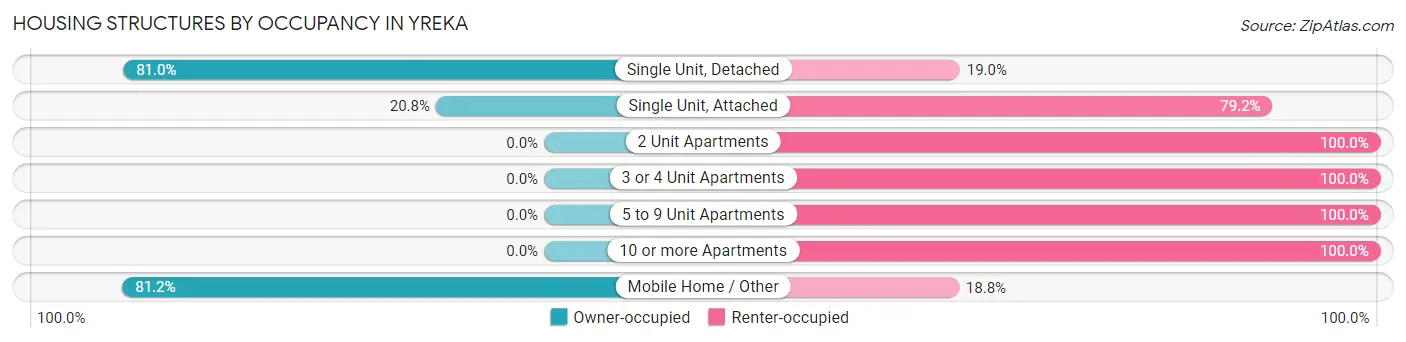
| Structure Type | Owner-occupied | Renter-occupied |
| Single Unit, Detached | 1,723 (81.0%) | 404 (19.0%) |
| Single Unit, Attached | 20 (20.8%) | 76 (79.2%) |
| 2 Unit Apartments | 0 (0.0%) | 84 (100.0%) |
| 3 or 4 Unit Apartments | 0 (0.0%) | 157 (100.0%) |
| 5 to 9 Unit Apartments | 0 (0.0%) | 155 (100.0%) |
| 10 or more Apartments | 0 (0.0%) | 324 (100.0%) |
| Mobile Home / Other | 233 (81.2%) | 54 (18.8%) |
| Total | 1,976 (61.2%) | 1,254 (38.8%) |
Housing Structures by Number of Rooms in Yreka
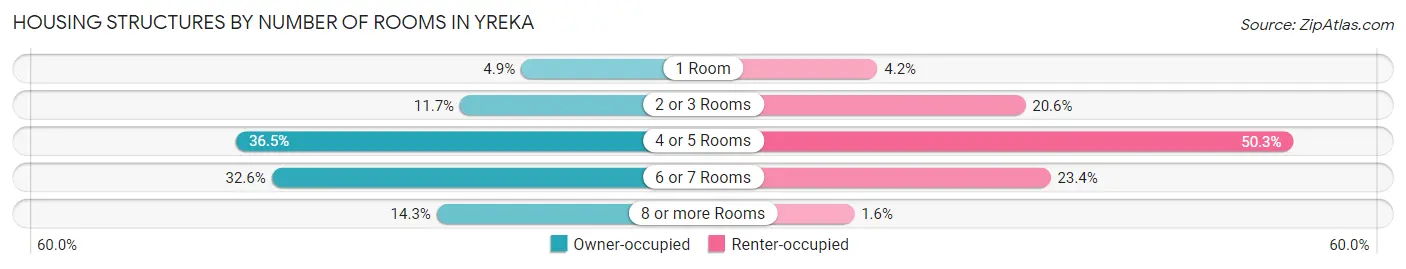
| Number of Rooms | Owner-occupied | Renter-occupied |
| 1 Room | 97 (4.9%) | 52 (4.2%) |
| 2 or 3 Rooms | 231 (11.7%) | 258 (20.6%) |
| 4 or 5 Rooms | 722 (36.5%) | 631 (50.3%) |
| 6 or 7 Rooms | 644 (32.6%) | 293 (23.4%) |
| 8 or more Rooms | 282 (14.3%) | 20 (1.6%) |
| Total | 1,976 (100.0%) | 1,254 (100.0%) |
Housing Structure by Heating Type in Yreka
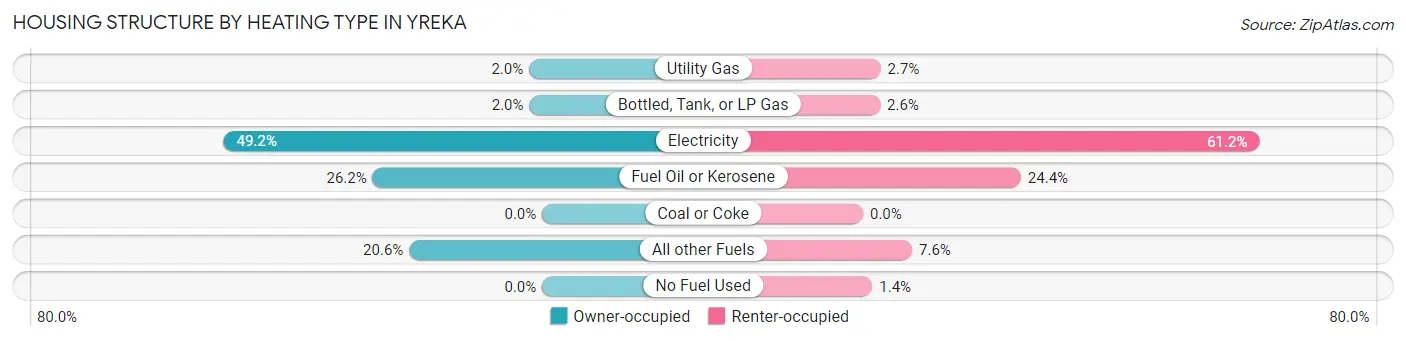
| Heating Type | Owner-occupied | Renter-occupied |
| Utility Gas | 40 (2.0%) | 34 (2.7%) |
| Bottled, Tank, or LP Gas | 39 (2.0%) | 33 (2.6%) |
| Electricity | 973 (49.2%) | 768 (61.2%) |
| Fuel Oil or Kerosene | 518 (26.2%) | 306 (24.4%) |
| Coal or Coke | 0 (0.0%) | 0 (0.0%) |
| All other Fuels | 406 (20.5%) | 95 (7.6%) |
| No Fuel Used | 0 (0.0%) | 18 (1.4%) |
| Total | 1,976 (100.0%) | 1,254 (100.0%) |
Household Vehicle Usage in Yreka
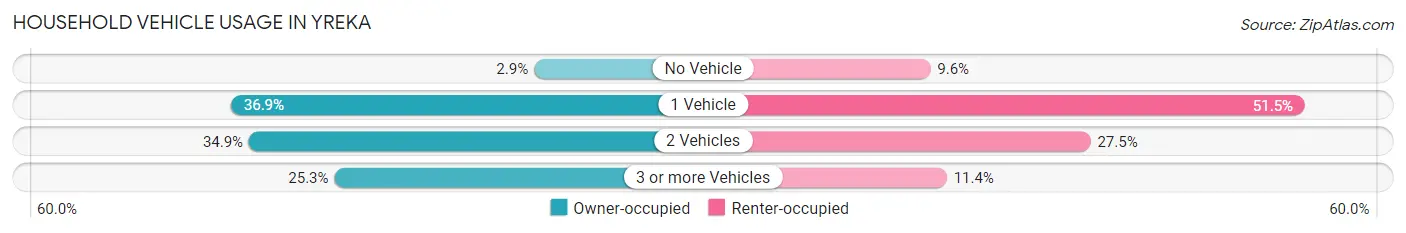
| Vehicles per Household | Owner-occupied | Renter-occupied |
| No Vehicle | 58 (2.9%) | 120 (9.6%) |
| 1 Vehicle | 729 (36.9%) | 646 (51.5%) |
| 2 Vehicles | 689 (34.9%) | 345 (27.5%) |
| 3 or more Vehicles | 500 (25.3%) | 143 (11.4%) |
| Total | 1,976 (100.0%) | 1,254 (100.0%) |
Real Estate & Mortgages in Yreka
Real Estate and Mortgage Overview in Yreka
| Characteristic | Without Mortgage | With Mortgage |
| Housing Units | 956 | 1,020 |
| Median Property Value | $185,900 | $231,700 |
| Median Household Income | $46,632 | $180 |
| Monthly Housing Costs | $532 | $21 |
| Real Estate Taxes | $1,136 | $18 |
Property Value by Mortgage Status in Yreka
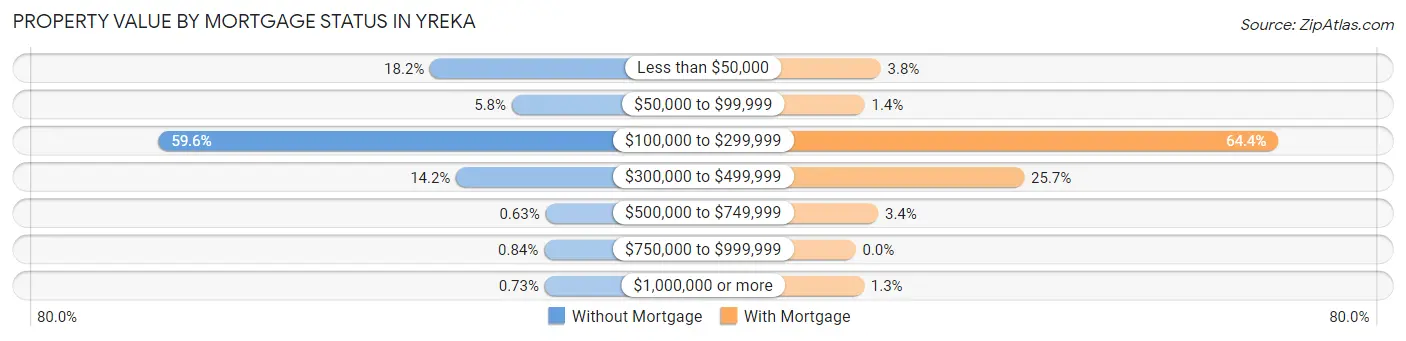
| Property Value | Without Mortgage | With Mortgage |
| Less than $50,000 | 174 (18.2%) | 39 (3.8%) |
| $50,000 to $99,999 | 55 (5.8%) | 14 (1.4%) |
| $100,000 to $299,999 | 570 (59.6%) | 657 (64.4%) |
| $300,000 to $499,999 | 136 (14.2%) | 262 (25.7%) |
| $500,000 to $749,999 | 6 (0.6%) | 35 (3.4%) |
| $750,000 to $999,999 | 8 (0.8%) | 0 (0.0%) |
| $1,000,000 or more | 7 (0.7%) | 13 (1.3%) |
| Total | 956 (100.0%) | 1,020 (100.0%) |
Household Income by Mortgage Status in Yreka
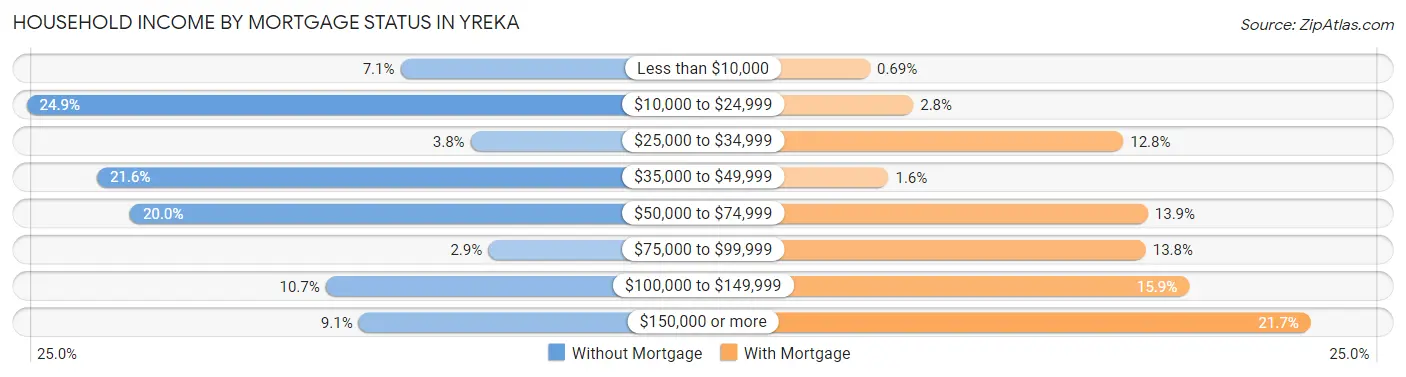
| Household Income | Without Mortgage | With Mortgage |
| Less than $10,000 | 68 (7.1%) | 7 (0.7%) |
| $10,000 to $24,999 | 238 (24.9%) | 28 (2.8%) |
| $25,000 to $34,999 | 36 (3.8%) | 130 (12.8%) |
| $35,000 to $49,999 | 206 (21.5%) | 16 (1.6%) |
| $50,000 to $74,999 | 191 (20.0%) | 142 (13.9%) |
| $75,000 to $99,999 | 28 (2.9%) | 141 (13.8%) |
| $100,000 to $149,999 | 102 (10.7%) | 162 (15.9%) |
| $150,000 or more | 87 (9.1%) | 221 (21.7%) |
| Total | 956 (100.0%) | 1,020 (100.0%) |
Property Value to Household Income Ratio in Yreka
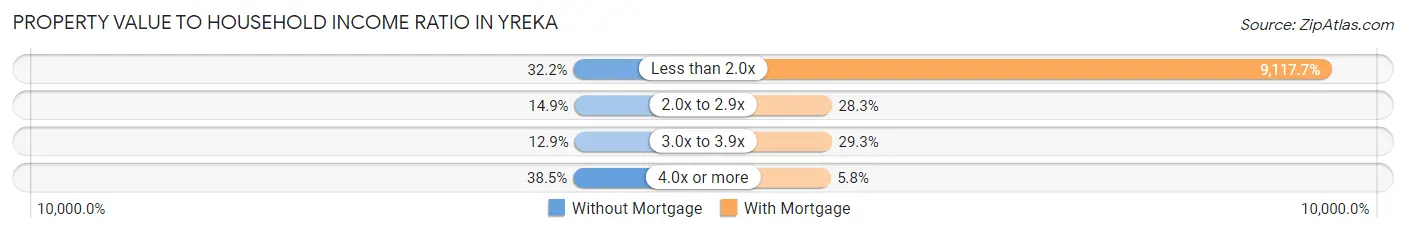
| Value-to-Income Ratio | Without Mortgage | With Mortgage |
| Less than 2.0x | 308 (32.2%) | 93,000 (9,117.7%) |
| 2.0x to 2.9x | 142 (14.8%) | 289 (28.3%) |
| 3.0x to 3.9x | 123 (12.9%) | 299 (29.3%) |
| 4.0x or more | 368 (38.5%) | 59 (5.8%) |
| Total | 956 (100.0%) | 1,020 (100.0%) |
Real Estate Taxes by Mortgage Status in Yreka
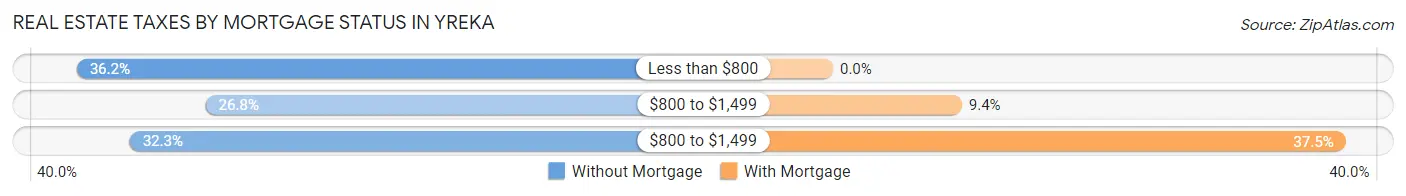
| Property Taxes | Without Mortgage | With Mortgage |
| Less than $800 | 346 (36.2%) | 0 (0.0%) |
| $800 to $1,499 | 256 (26.8%) | 96 (9.4%) |
| $800 to $1,499 | 309 (32.3%) | 382 (37.4%) |
| Total | 956 (100.0%) | 1,020 (100.0%) |
Health & Disability in Yreka
Health Insurance Coverage by Age in Yreka
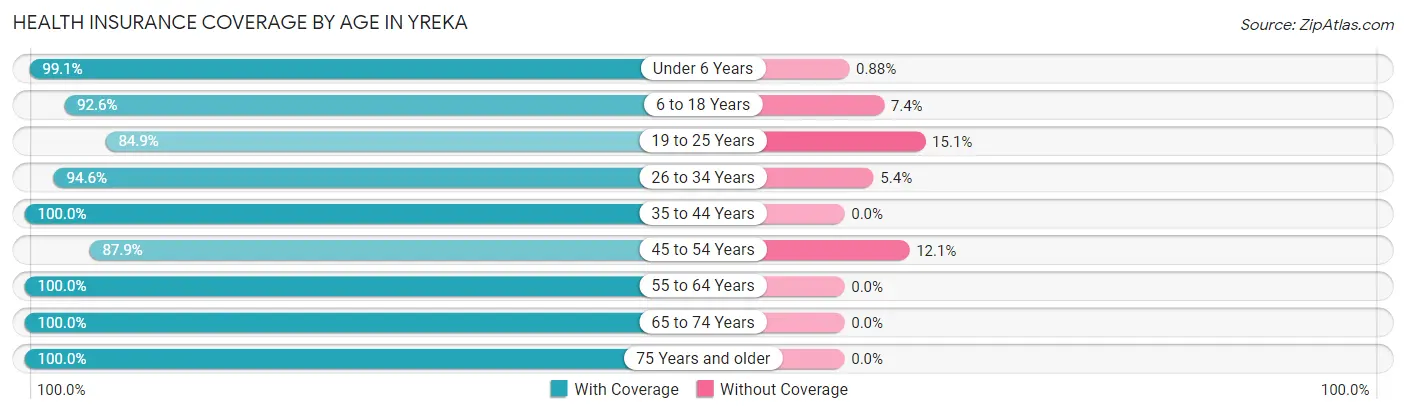
| Age Bracket | With Coverage | Without Coverage |
| Under 6 Years | 563 (99.1%) | 5 (0.9%) |
| 6 to 18 Years | 1,618 (92.6%) | 129 (7.4%) |
| 19 to 25 Years | 383 (84.9%) | 68 (15.1%) |
| 26 to 34 Years | 1,010 (94.6%) | 58 (5.4%) |
| 35 to 44 Years | 895 (100.0%) | 0 (0.0%) |
| 45 to 54 Years | 625 (87.9%) | 86 (12.1%) |
| 55 to 64 Years | 666 (100.0%) | 0 (0.0%) |
| 65 to 74 Years | 1,096 (100.0%) | 0 (0.0%) |
| 75 Years and older | 577 (100.0%) | 0 (0.0%) |
| Total | 7,433 (95.6%) | 346 (4.4%) |
Health Insurance Coverage by Citizenship Status in Yreka
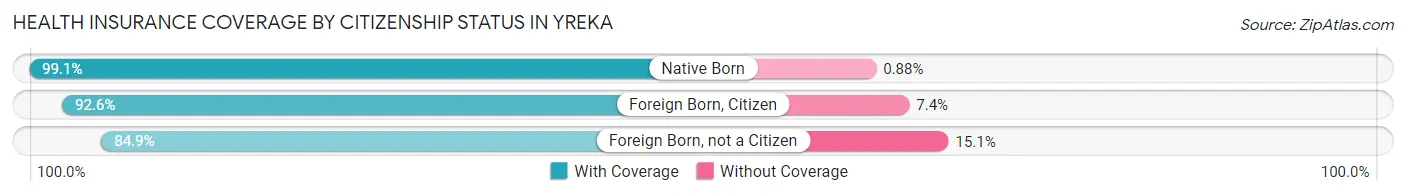
| Citizenship Status | With Coverage | Without Coverage |
| Native Born | 563 (99.1%) | 5 (0.9%) |
| Foreign Born, Citizen | 1,618 (92.6%) | 129 (7.4%) |
| Foreign Born, not a Citizen | 383 (84.9%) | 68 (15.1%) |
Health Insurance Coverage by Household Income in Yreka
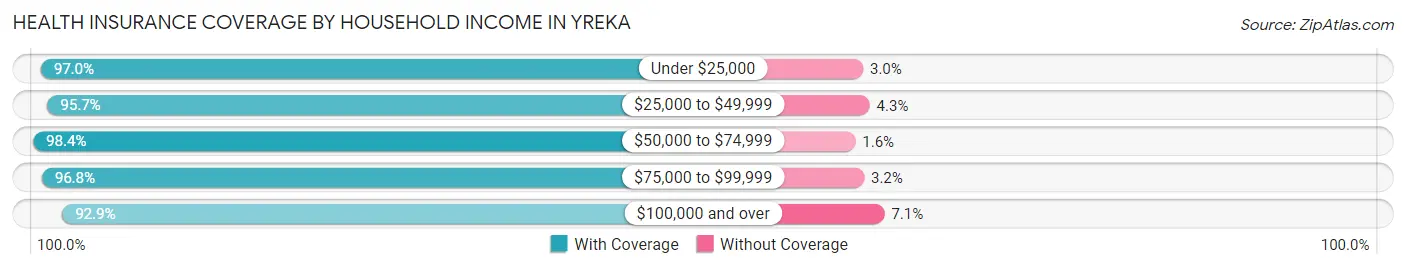
| Household Income | With Coverage | Without Coverage |
| Under $25,000 | 1,688 (97.0%) | 53 (3.0%) |
| $25,000 to $49,999 | 1,542 (95.7%) | 69 (4.3%) |
| $50,000 to $74,999 | 1,101 (98.4%) | 18 (1.6%) |
| $75,000 to $99,999 | 749 (96.8%) | 25 (3.2%) |
| $100,000 and over | 2,318 (92.9%) | 176 (7.1%) |
Public vs Private Health Insurance Coverage by Age in Yreka
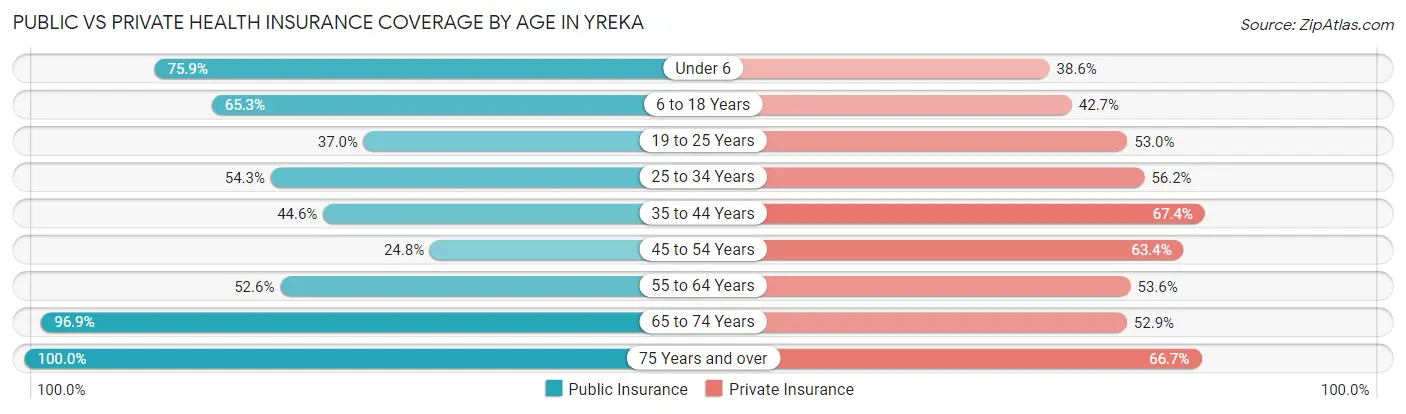
| Age Bracket | Public Insurance | Private Insurance |
| Under 6 | 431 (75.9%) | 219 (38.6%) |
| 6 to 18 Years | 1,140 (65.2%) | 746 (42.7%) |
| 19 to 25 Years | 167 (37.0%) | 239 (53.0%) |
| 25 to 34 Years | 580 (54.3%) | 600 (56.2%) |
| 35 to 44 Years | 399 (44.6%) | 603 (67.4%) |
| 45 to 54 Years | 176 (24.7%) | 451 (63.4%) |
| 55 to 64 Years | 350 (52.5%) | 357 (53.6%) |
| 65 to 74 Years | 1,062 (96.9%) | 580 (52.9%) |
| 75 Years and over | 577 (100.0%) | 385 (66.7%) |
| Total | 4,882 (62.8%) | 4,180 (53.7%) |
Disability Status by Sex by Age in Yreka
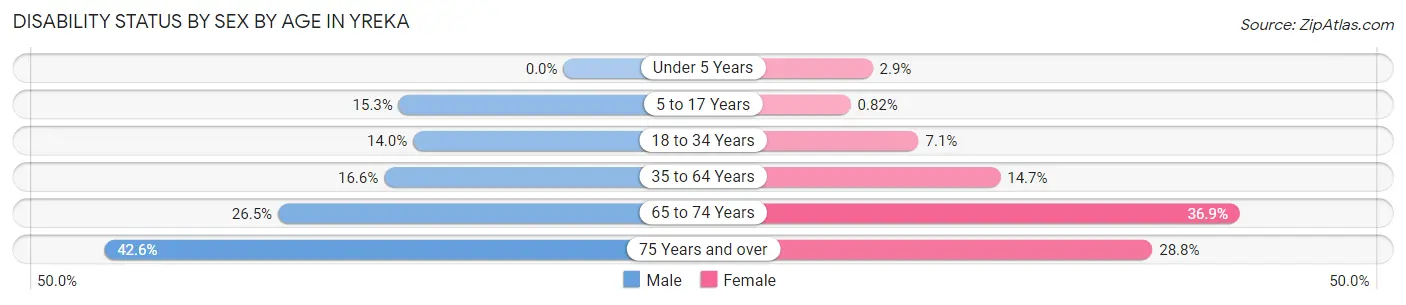
| Age Bracket | Male | Female |
| Under 5 Years | 0 (0.0%) | 6 (2.9%) |
| 5 to 17 Years | 170 (15.3%) | 5 (0.8%) |
| 18 to 34 Years | 90 (14.0%) | 77 (7.1%) |
| 35 to 64 Years | 205 (16.6%) | 153 (14.7%) |
| 65 to 74 Years | 111 (26.5%) | 250 (36.9%) |
| 75 Years and over | 98 (42.6%) | 100 (28.8%) |
Disability Class by Sex by Age in Yreka
Disability Class: Hearing Difficulty
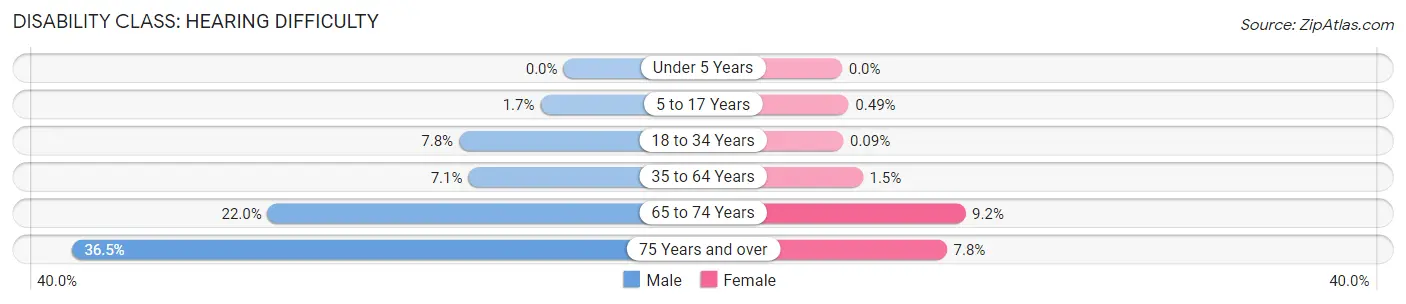
| Age Bracket | Male | Female |
| Under 5 Years | 0 (0.0%) | 0 (0.0%) |
| 5 to 17 Years | 19 (1.7%) | 3 (0.5%) |
| 18 to 34 Years | 50 (7.7%) | 1 (0.1%) |
| 35 to 64 Years | 87 (7.1%) | 16 (1.5%) |
| 65 to 74 Years | 92 (22.0%) | 62 (9.2%) |
| 75 Years and over | 84 (36.5%) | 27 (7.8%) |
Disability Class: Vision Difficulty
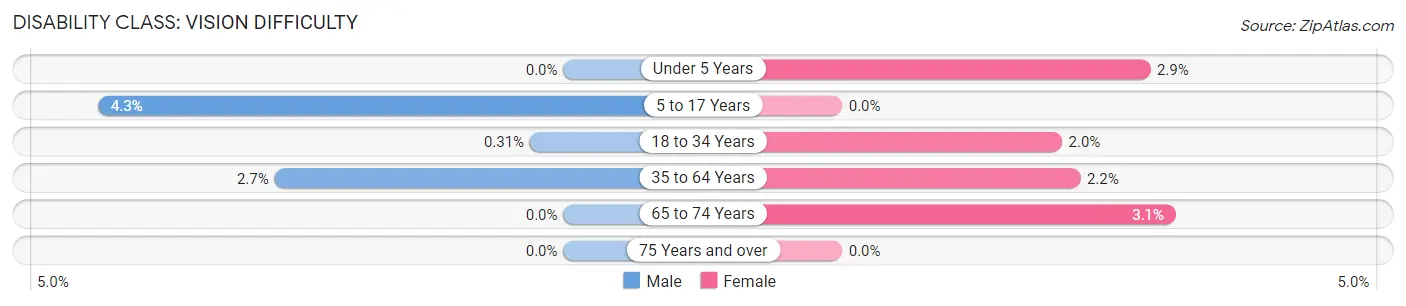
| Age Bracket | Male | Female |
| Under 5 Years | 0 (0.0%) | 6 (2.9%) |
| 5 to 17 Years | 48 (4.3%) | 0 (0.0%) |
| 18 to 34 Years | 2 (0.3%) | 22 (2.0%) |
| 35 to 64 Years | 33 (2.7%) | 23 (2.2%) |
| 65 to 74 Years | 0 (0.0%) | 21 (3.1%) |
| 75 Years and over | 0 (0.0%) | 0 (0.0%) |
Disability Class: Cognitive Difficulty
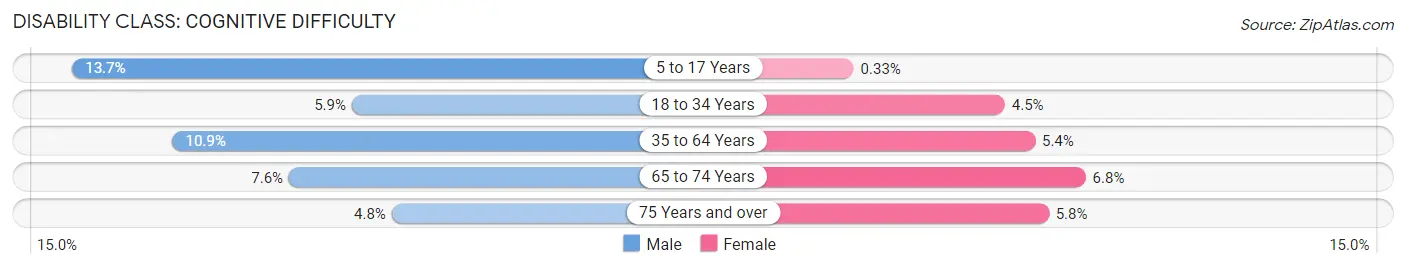
| Age Bracket | Male | Female |
| 5 to 17 Years | 152 (13.7%) | 2 (0.3%) |
| 18 to 34 Years | 38 (5.9%) | 49 (4.5%) |
| 35 to 64 Years | 134 (10.9%) | 56 (5.4%) |
| 65 to 74 Years | 32 (7.6%) | 46 (6.8%) |
| 75 Years and over | 11 (4.8%) | 20 (5.8%) |
Disability Class: Ambulatory Difficulty
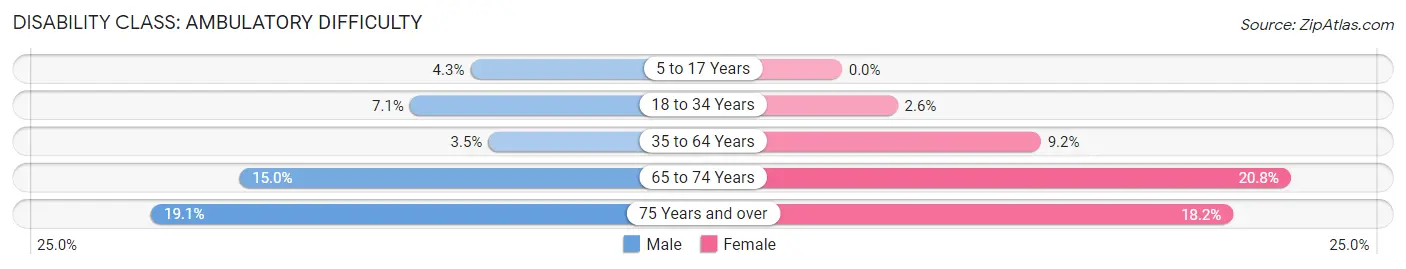
| Age Bracket | Male | Female |
| 5 to 17 Years | 48 (4.3%) | 0 (0.0%) |
| 18 to 34 Years | 46 (7.1%) | 28 (2.6%) |
| 35 to 64 Years | 43 (3.5%) | 96 (9.2%) |
| 65 to 74 Years | 63 (15.0%) | 141 (20.8%) |
| 75 Years and over | 44 (19.1%) | 63 (18.2%) |
Disability Class: Self-Care Difficulty
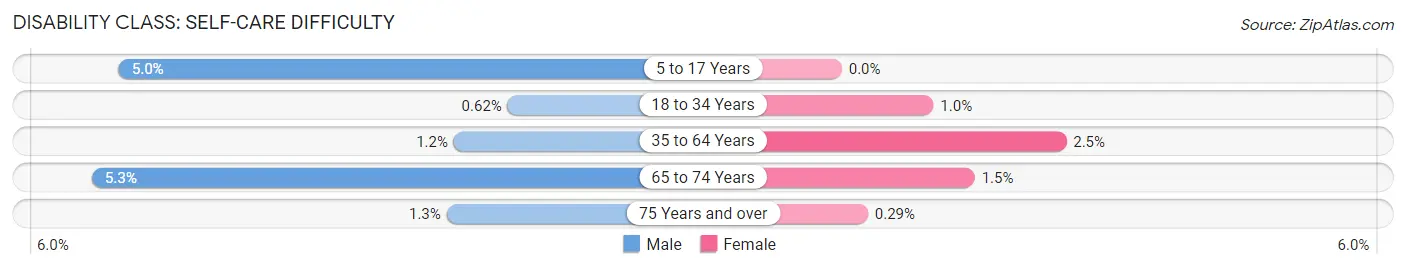
| Age Bracket | Male | Female |
| 5 to 17 Years | 55 (5.0%) | 0 (0.0%) |
| 18 to 34 Years | 4 (0.6%) | 11 (1.0%) |
| 35 to 64 Years | 15 (1.2%) | 26 (2.5%) |
| 65 to 74 Years | 22 (5.2%) | 10 (1.5%) |
| 75 Years and over | 3 (1.3%) | 1 (0.3%) |
Technology Access in Yreka
Computing Device Access in Yreka
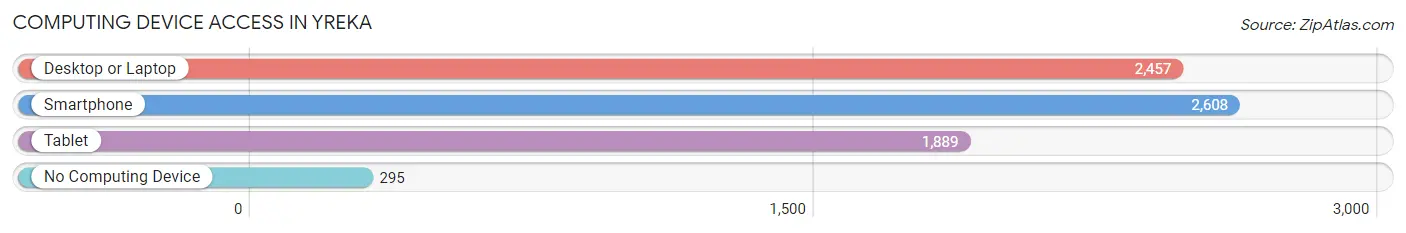
| Device Type | # Households | % Households |
| Desktop or Laptop | 2,457 | 76.1% |
| Smartphone | 2,608 | 80.7% |
| Tablet | 1,889 | 58.5% |
| No Computing Device | 295 | 9.1% |
| Total | 3,230 | 100.0% |
Internet Access in Yreka
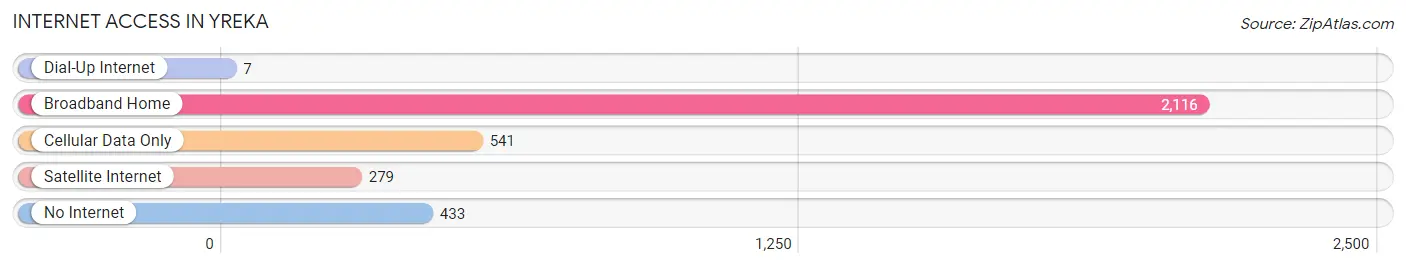
| Internet Type | # Households | % Households |
| Dial-Up Internet | 7 | 0.2% |
| Broadband Home | 2,116 | 65.5% |
| Cellular Data Only | 541 | 16.8% |
| Satellite Internet | 279 | 8.6% |
| No Internet | 433 | 13.4% |
| Total | 3,230 | 100.0% |
Yreka Summary
Yreka is a city located in the northern part of California, in Siskiyou County. It is situated at the base of the Siskiyou Mountains, near the Oregon border. The city is the county seat of Siskiyou County and is the largest city in the county. The population of Yreka was 7,765 at the 2000 census.
History
Yreka was founded in 1851 by settlers from the nearby town of Shasta. The name Yreka is derived from the Shasta Indian word for “mountain” or “place of the mountains.” The city was incorporated in 1857 and was the first city in California to be incorporated after the Gold Rush.
Yreka was an important stop on the stagecoach route between California and Oregon. It was also a major supply center for miners during the California Gold Rush. The city was the site of the first California State Fair in 1858.
Geography
Yreka is located at the base of the Siskiyou Mountains, near the Oregon border. The city is situated at an elevation of 1,890 feet (576 m). The city is located in the Shasta Valley, which is part of the Klamath Mountains. The city is surrounded by mountains and forests, and is located near the headwaters of the Klamath River.
The climate in Yreka is semi-arid, with hot summers and cold winters. The average annual precipitation is 18.5 inches (470 mm).
Economy
Yreka’s economy is largely based on agriculture, forestry, and tourism. The city is home to several large lumber mills, and is a major producer of lumber and wood products. The city is also home to several wineries and vineyards, and is a popular destination for wine tasting.
The city is also a popular tourist destination, with several attractions including the Siskiyou County Museum, the Yreka Historic District, and the Yreka Railroad Museum.
Demographics
As of the 2000 census, the population of Yreka was 7,765. The racial makeup of the city was 87.3% White, 0.7% African American, 2.2% Native American, 0.7% Asian, 0.1% Pacific Islander, 5.3% from other races, and 3.9% from two or more races. Hispanic or Latino of any race were 11.2% of the population.
The median income for a household in Yreka was $30,938, and the median income for a family was $36,944. The per capita income for the city was $17,845. About 16.2% of families and 19.7% of the population were below the poverty line, including 28.2% of those under age 18 and 8.2% of those age 65 or over.
Common Questions
What is Per Capita Income in Yreka?
Per Capita income in Yreka is $29,497.
What is the Median Family Income in Yreka?
Median Family Income in Yreka is $67,685.
What is the Median Household income in Yreka?
Median Household Income in Yreka is $46,387.
What is Income or Wage Gap in Yreka?
Income or Wage Gap in Yreka is 29.0%.
Women in Yreka earn 71.0 cents for every dollar earned by a man.
What is Family Income Deficit in Yreka?
Family Income Deficit in Yreka is $10,858.
Families that are below poverty line in Yreka earn $10,858 less on average than the poverty threshold level.
What is Inequality or Gini Index in Yreka?
Inequality or Gini Index in Yreka is 0.48.
What is the Total Population of Yreka?
Total Population of Yreka is 7,833.
What is the Total Male Population of Yreka?
Total Male Population of Yreka is 3,845.
What is the Total Female Population of Yreka?
Total Female Population of Yreka is 3,988.
What is the Ratio of Males per 100 Females in Yreka?
There are 96.41 Males per 100 Females in Yreka.
What is the Ratio of Females per 100 Males in Yreka?
There are 103.72 Females per 100 Males in Yreka.
What is the Median Population Age in Yreka?
Median Population Age in Yreka is 36.3 Years.
What is the Average Family Size in Yreka
Average Family Size in Yreka is 3.4 People.
What is the Average Household Size in Yreka
Average Household Size in Yreka is 2.4 People.
How Large is the Labor Force in Yreka?
There are 3,230 People in the Labor Forcein in Yreka.
What is the Percentage of People in the Labor Force in Yreka?
53.9% of People are in the Labor Force in Yreka.
What is the Unemployment Rate in Yreka?
Unemployment Rate in Yreka is 4.0%.