Cities with the Highest Percentage of Population Employed in Food Preparation & Serving in Mississippi
RELATED REPORTS & OPTIONS
Food Preparation & Serving
Mississippi
Compare Cities
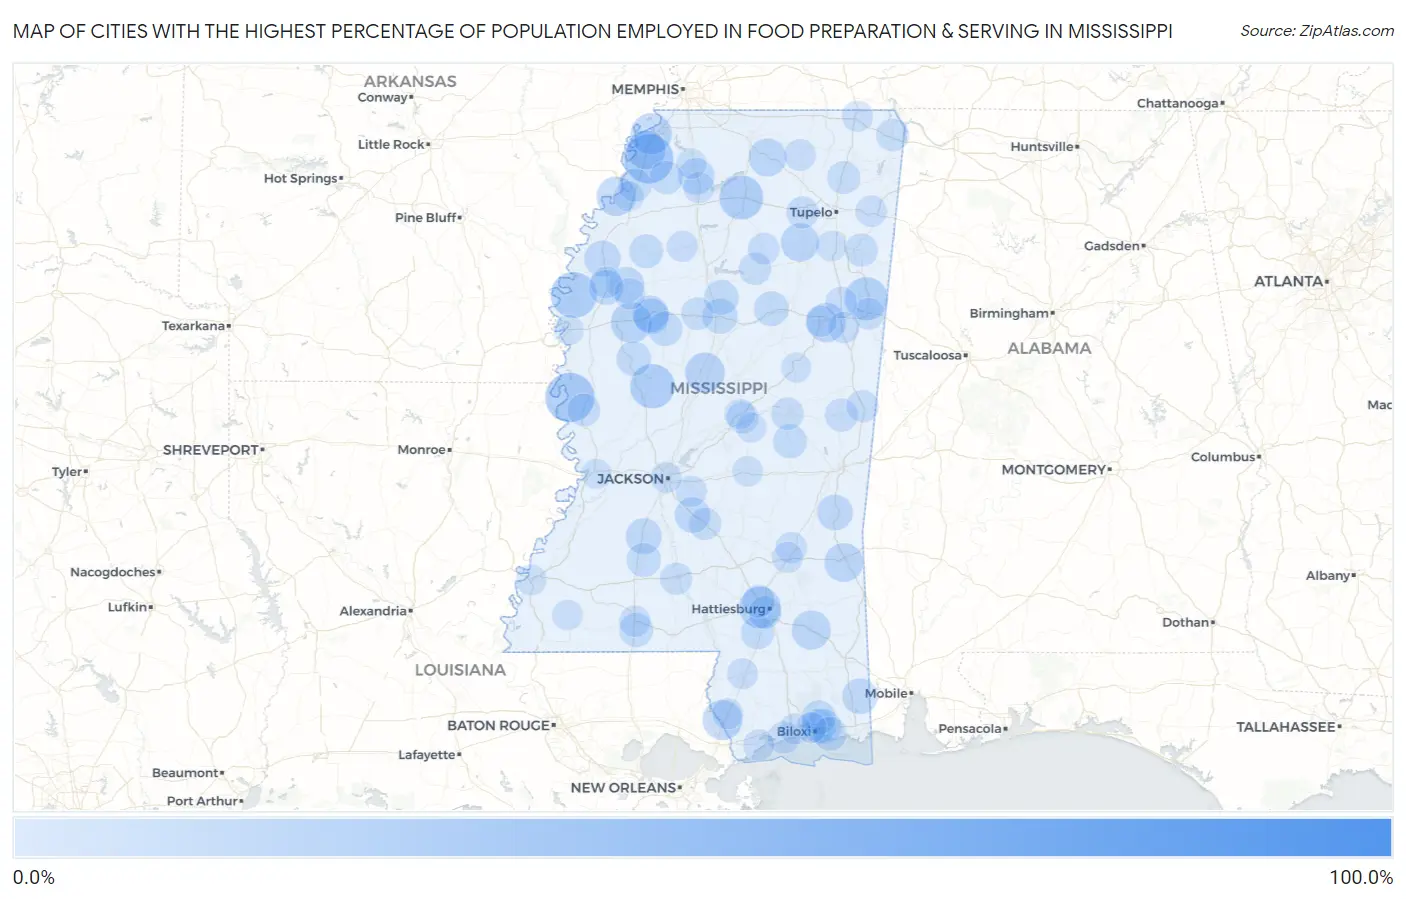
Map of Cities with the Highest Percentage of Population Employed in Food Preparation & Serving in Mississippi
0.0%
100.0%
Cities with the Highest Percentage of Population Employed in Food Preparation & Serving in Mississippi
| City | % Employed | vs State | vs National | |
| 1. | Eagle Bend | 84.2% | 5.6%(+78.6)#1 | 5.3%(+78.9)#38 |
| 2. | White Oak | 28.6% | 5.6%(+23.0)#2 | 5.3%(+23.3)#378 |
| 3. | Mayersville | 28.6% | 5.6%(+23.0)#3 | 5.3%(+23.3)#381 |
| 4. | Winterville | 27.8% | 5.6%(+22.2)#4 | 5.3%(+22.5)#406 |
| 5. | Benoit | 25.0% | 5.6%(+19.4)#5 | 5.3%(+19.7)#498 |
| 6. | Eden | 23.2% | 5.6%(+17.6)#6 | 5.3%(+17.9)#602 |
| 7. | University | 22.7% | 5.6%(+17.1)#7 | 5.3%(+17.4)#636 |
| 8. | Lakeview | 21.8% | 5.6%(+16.2)#8 | 5.3%(+16.5)#689 |
| 9. | Columbus Afb | 21.7% | 5.6%(+16.1)#9 | 5.3%(+16.5)#692 |
| 10. | Arnold Line | 20.5% | 5.6%(+14.9)#10 | 5.3%(+15.2)#790 |
| 11. | Hermanville | 20.2% | 5.6%(+14.6)#11 | 5.3%(+14.9)#819 |
| 12. | Tunica Resorts | 19.7% | 5.6%(+14.1)#12 | 5.3%(+14.5)#870 |
| 13. | Moorhead | 19.4% | 5.6%(+13.8)#13 | 5.3%(+14.1)#904 |
| 14. | Nicholson | 18.3% | 5.6%(+12.7)#14 | 5.3%(+13.0)#1,028 |
| 15. | Durant | 18.3% | 5.6%(+12.7)#15 | 5.3%(+13.0)#1,034 |
| 16. | Friars Point | 17.7% | 5.6%(+12.1)#16 | 5.3%(+12.4)#1,100 |
| 17. | North Tunica | 17.6% | 5.6%(+12.0)#17 | 5.3%(+12.3)#1,117 |
| 18. | Mississippi State | 17.5% | 5.6%(+11.9)#18 | 5.3%(+12.2)#1,128 |
| 19. | Beaumont | 17.4% | 5.6%(+11.8)#19 | 5.3%(+12.1)#1,161 |
| 20. | Waynesboro | 17.2% | 5.6%(+11.6)#20 | 5.3%(+11.9)#1,184 |
| 21. | New Houlka | 16.5% | 5.6%(+10.9)#21 | 5.3%(+11.2)#1,293 |
| 22. | Potts Camp | 16.2% | 5.6%(+10.6)#22 | 5.3%(+10.9)#1,351 |
| 23. | Bobo | 15.6% | 5.6%(+10.0)#23 | 5.3%(+10.3)#1,489 |
| 24. | Mississippi Valley State University | 14.6% | 5.6%(+9.03)#24 | 5.3%(+9.33)#1,730 |
| 25. | Winstonville | 14.6% | 5.6%(+8.99)#25 | 5.3%(+9.30)#1,745 |
| 26. | Como | 14.6% | 5.6%(+8.97)#26 | 5.3%(+9.27)#1,752 |
| 27. | Hazlehurst | 14.2% | 5.6%(+8.64)#27 | 5.3%(+8.94)#1,848 |
| 28. | Ruleville | 14.0% | 5.6%(+8.44)#28 | 5.3%(+8.75)#1,909 |
| 29. | Itta Bena | 13.9% | 5.6%(+8.29)#29 | 5.3%(+8.60)#1,947 |
| 30. | Hurley | 13.9% | 5.6%(+8.26)#30 | 5.3%(+8.57)#1,954 |
| 31. | Quitman | 13.7% | 5.6%(+8.12)#31 | 5.3%(+8.43)#1,998 |
| 32. | Braxton | 13.7% | 5.6%(+8.11)#32 | 5.3%(+8.41)#2,005 |
| 33. | Winona | 13.4% | 5.6%(+7.80)#33 | 5.3%(+8.11)#2,107 |
| 34. | Boyle | 13.2% | 5.6%(+7.57)#34 | 5.3%(+7.87)#2,198 |
| 35. | Gulf Hills | 13.1% | 5.6%(+7.49)#35 | 5.3%(+7.80)#2,218 |
| 36. | Duck Hill | 13.0% | 5.6%(+7.44)#36 | 5.3%(+7.74)#2,250 |
| 37. | Eupora | 13.0% | 5.6%(+7.42)#37 | 5.3%(+7.73)#2,255 |
| 38. | Sidon | 12.8% | 5.6%(+7.17)#38 | 5.3%(+7.48)#2,364 |
| 39. | Belzoni | 12.6% | 5.6%(+7.04)#39 | 5.3%(+7.35)#2,428 |
| 40. | St Martin | 12.4% | 5.6%(+6.85)#40 | 5.3%(+7.16)#2,544 |
| 41. | Wesson | 12.3% | 5.6%(+6.71)#41 | 5.3%(+7.02)#2,600 |
| 42. | Latimer | 12.3% | 5.6%(+6.69)#42 | 5.3%(+6.99)#2,608 |
| 43. | Magnolia | 12.2% | 5.6%(+6.61)#43 | 5.3%(+6.92)#2,645 |
| 44. | Union | 12.1% | 5.6%(+6.51)#44 | 5.3%(+6.82)#2,702 |
| 45. | Gulf Park Estates | 12.0% | 5.6%(+6.41)#45 | 5.3%(+6.72)#2,755 |
| 46. | Sumner | 12.0% | 5.6%(+6.41)#46 | 5.3%(+6.71)#2,759 |
| 47. | Purvis | 11.5% | 5.6%(+5.87)#47 | 5.3%(+6.17)#3,090 |
| 48. | Skene | 11.4% | 5.6%(+5.84)#48 | 5.3%(+6.14)#3,105 |
| 49. | Crenshaw | 11.3% | 5.6%(+5.75)#49 | 5.3%(+6.05)#3,172 |
| 50. | Lula | 11.2% | 5.6%(+5.63)#50 | 5.3%(+5.94)#3,249 |
| 51. | De Kalb | 11.1% | 5.6%(+5.52)#51 | 5.3%(+5.83)#3,308 |
| 52. | Amory | 11.1% | 5.6%(+5.48)#52 | 5.3%(+5.79)#3,347 |
| 53. | Baldwyn | 11.1% | 5.6%(+5.48)#53 | 5.3%(+5.79)#3,348 |
| 54. | Iuka | 10.8% | 5.6%(+5.17)#54 | 5.3%(+5.47)#3,542 |
| 55. | Hattiesburg | 10.8% | 5.6%(+5.16)#55 | 5.3%(+5.47)#3,545 |
| 56. | Cary | 10.8% | 5.6%(+5.16)#56 | 5.3%(+5.47)#3,547 |
| 57. | North Carrollton | 10.7% | 5.6%(+5.09)#57 | 5.3%(+5.40)#3,590 |
| 58. | Philadelphia | 10.6% | 5.6%(+4.98)#58 | 5.3%(+5.29)#3,673 |
| 59. | Rawls Springs | 10.6% | 5.6%(+4.97)#59 | 5.3%(+5.28)#3,675 |
| 60. | Big Creek | 10.4% | 5.6%(+4.86)#60 | 5.3%(+5.16)#3,767 |
| 61. | Scooba | 10.4% | 5.6%(+4.82)#61 | 5.3%(+5.13)#3,781 |
| 62. | Mendenhall | 10.4% | 5.6%(+4.79)#62 | 5.3%(+5.10)#3,805 |
| 63. | Monticello | 10.1% | 5.6%(+4.54)#63 | 5.3%(+4.85)#3,992 |
| 64. | Long Beach | 10.1% | 5.6%(+4.53)#64 | 5.3%(+4.84)#3,998 |
| 65. | Pontotoc | 10.0% | 5.6%(+4.46)#65 | 5.3%(+4.76)#4,061 |
| 66. | Carthage | 9.9% | 5.6%(+4.28)#66 | 5.3%(+4.59)#4,207 |
| 67. | Bruce | 9.8% | 5.6%(+4.19)#67 | 5.3%(+4.49)#4,279 |
| 68. | Blue Mountain | 9.8% | 5.6%(+4.19)#68 | 5.3%(+4.49)#4,282 |
| 69. | Bogue Chitto Cdp Kemper And Neshoba Counties | 9.7% | 5.6%(+4.14)#69 | 5.3%(+4.45)#4,330 |
| 70. | Columbus | 9.7% | 5.6%(+4.06)#70 | 5.3%(+4.36)#4,392 |
| 71. | West Point | 9.6% | 5.6%(+3.96)#71 | 5.3%(+4.27)#4,491 |
| 72. | Cleveland | 9.5% | 5.6%(+3.91)#72 | 5.3%(+4.22)#4,534 |
| 73. | Fulton | 9.5% | 5.6%(+3.88)#73 | 5.3%(+4.18)#4,569 |
| 74. | Artesia | 9.4% | 5.6%(+3.78)#74 | 5.3%(+4.09)#4,662 |
| 75. | Sharon | 9.3% | 5.6%(+3.70)#75 | 5.3%(+4.01)#4,752 |
| 76. | Mccomb | 9.3% | 5.6%(+3.70)#76 | 5.3%(+4.01)#4,755 |
| 77. | Robinhood | 9.2% | 5.6%(+3.63)#77 | 5.3%(+3.94)#4,820 |
| 78. | Waveland | 9.1% | 5.6%(+3.51)#78 | 5.3%(+3.82)#4,932 |
| 79. | Doddsville | 9.1% | 5.6%(+3.50)#79 | 5.3%(+3.80)#4,958 |
| 80. | Corinth | 9.0% | 5.6%(+3.41)#80 | 5.3%(+3.71)#5,055 |
| 81. | Starkville | 9.0% | 5.6%(+3.36)#81 | 5.3%(+3.67)#5,120 |
| 82. | Laurel | 9.0% | 5.6%(+3.36)#82 | 5.3%(+3.67)#5,133 |
| 83. | Sardis | 8.9% | 5.6%(+3.34)#83 | 5.3%(+3.65)#5,159 |
| 84. | Charleston | 8.9% | 5.6%(+3.33)#84 | 5.3%(+3.64)#5,165 |
| 85. | Jackson | 8.8% | 5.6%(+3.25)#85 | 5.3%(+3.56)#5,261 |
| 86. | Picayune | 8.8% | 5.6%(+3.21)#86 | 5.3%(+3.52)#5,305 |
| 87. | Gulfport | 8.7% | 5.6%(+3.15)#87 | 5.3%(+3.46)#5,378 |
| 88. | Poplarville | 8.7% | 5.6%(+3.12)#88 | 5.3%(+3.42)#5,417 |
| 89. | Biloxi | 8.6% | 5.6%(+3.04)#89 | 5.3%(+3.34)#5,506 |
| 90. | Natchez | 8.6% | 5.6%(+3.00)#90 | 5.3%(+3.31)#5,550 |
| 91. | Forest | 8.5% | 5.6%(+2.91)#91 | 5.3%(+3.22)#5,651 |
| 92. | Crosby | 8.5% | 5.6%(+2.88)#92 | 5.3%(+3.19)#5,692 |
| 93. | Okolona | 8.5% | 5.6%(+2.87)#93 | 5.3%(+3.18)#5,707 |
| 94. | Senatobia | 8.4% | 5.6%(+2.85)#94 | 5.3%(+3.16)#5,731 |
| 95. | Redwater | 8.3% | 5.6%(+2.70)#95 | 5.3%(+3.00)#5,953 |
| 96. | Louisville | 8.1% | 5.6%(+2.49)#96 | 5.3%(+2.79)#6,226 |
| 97. | Standing Pine | 8.1% | 5.6%(+2.49)#97 | 5.3%(+2.79)#6,228 |
| 98. | Coahoma | 8.1% | 5.6%(+2.47)#98 | 5.3%(+2.78)#6,249 |
| 99. | Beechwood | 8.1% | 5.6%(+2.47)#99 | 5.3%(+2.77)#6,257 |
| 100. | Greenville | 8.0% | 5.6%(+2.38)#100 | 5.3%(+2.69)#6,373 |
Common Questions
What are the Top 10 Cities with the Highest Percentage of Population Employed in Food Preparation & Serving in Mississippi?
Top 10 Cities with the Highest Percentage of Population Employed in Food Preparation & Serving in Mississippi are:
#1
28.6%
#2
28.6%
#3
25.0%
#4
23.2%
#5
22.7%
#6
21.7%
#7
20.5%
#8
19.7%
#9
19.4%
#10
18.3%
What city has the Highest Percentage of Population Employed in Food Preparation & Serving in Mississippi?
White Oak has the Highest Percentage of Population Employed in Food Preparation & Serving in Mississippi with 28.6%.
What is the Percentage of Population Employed in Food Preparation & Serving in the State of Mississippi?
Percentage of Population Employed in Food Preparation & Serving in Mississippi is 5.6%.
What is the Percentage of Population Employed in Food Preparation & Serving in the United States?
Percentage of Population Employed in Food Preparation & Serving in the United States is 5.3%.