Greeley Hill, CA Map & Demographics
Greeley Hill Map
Greeley Hill Overview
$22,184
PER CAPITA INCOME
$66,346
AVG FAMILY INCOME
0.42
INEQUALITY / GINI INDEX
960
TOTAL POPULATION
440
MALE POPULATION
520
FEMALE POPULATION
84.62
MALES / 100 FEMALES
118.18
FEMALES / 100 MALES
58.5
MEDIAN AGE
2.5
AVG FAMILY SIZE
2.0
AVG HOUSEHOLD SIZE
387
LABOR FORCE [ PEOPLE ]
45.0%
PERCENT IN LABOR FORCE
4.9%
UNEMPLOYMENT RATE
Income in Greeley Hill
Income Overview in Greeley Hill
| Characteristic | Number | Measure |
| Per Capita Income | 960 | $22,184 |
| Median Family Income | 212 | $66,346 |
| Mean Family Income | 212 | $68,361 |
| Median Household Income | 487 | $0 |
| Mean Household Income | 487 | $47,874 |
| Income Deficit | 212 | $0 |
| Wage / Income Gap (%) | 960 | 0.00% |
| Wage / Income Gap ($) | 960 | 100.00¢ per $1 |
| Gini / Inequality Index | 960 | 0.42 |
Earnings by Sex in Greeley Hill
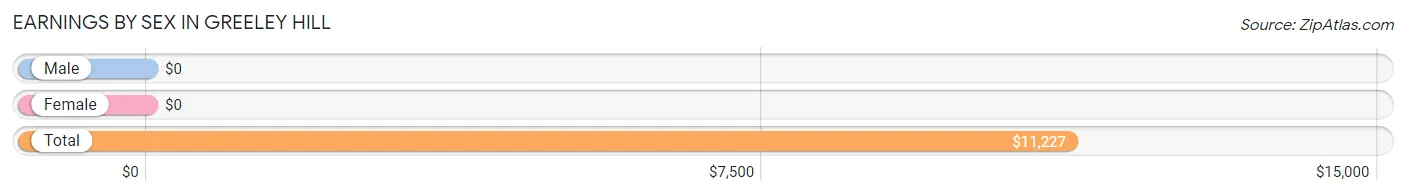
| Sex | Number | Average Earnings |
| Male | 166 (36.6%) | $0 |
| Female | 287 (63.4%) | $0 |
| Total | 453 (100.0%) | $11,227 |
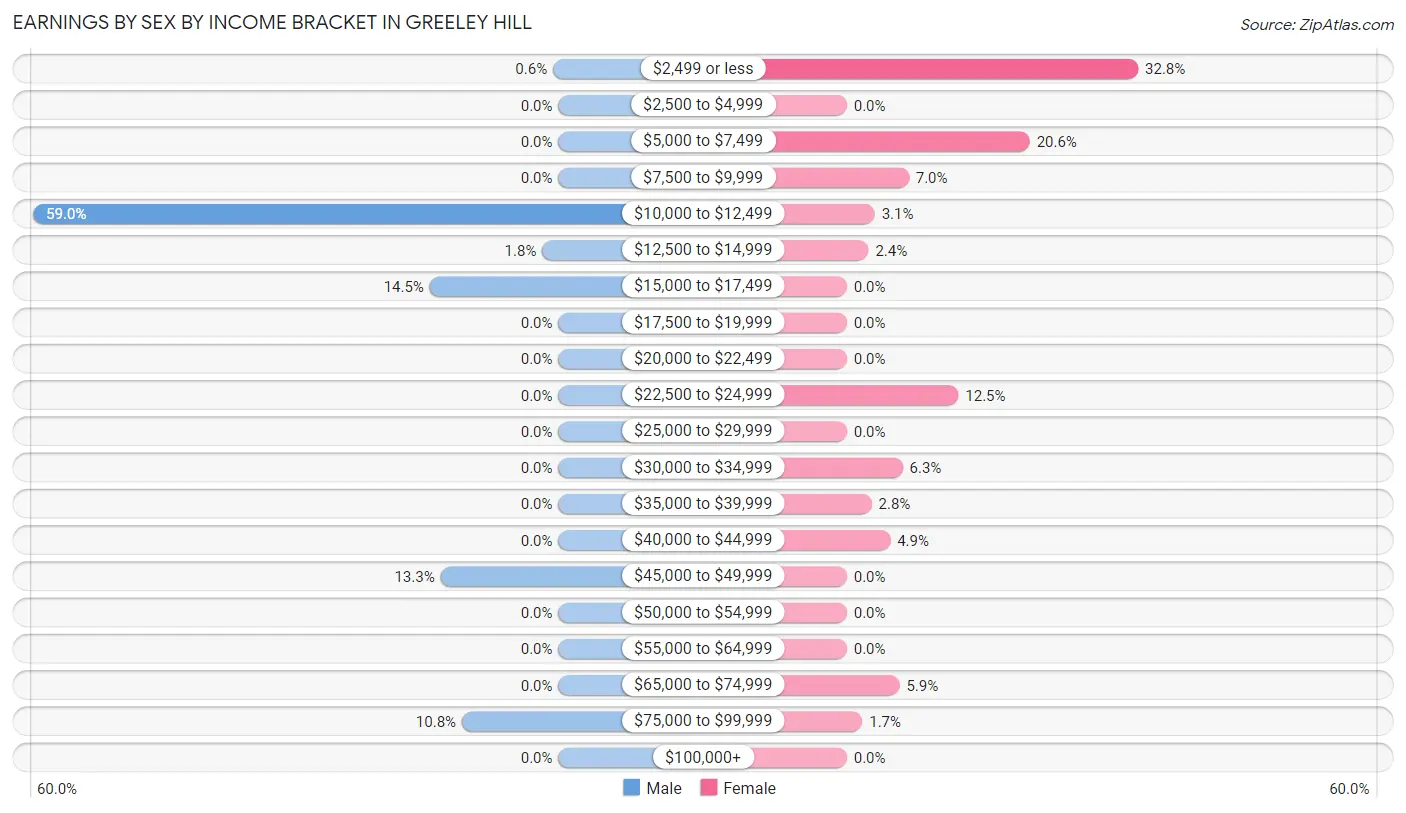
Earnings by Sex by Income Bracket in Greeley Hill
The most common earnings brackets in Greeley Hill are $10,000 to $12,499 for men (98 | 59.0%) and $2,499 or less for women (94 | 32.8%).
| Income | Male | Female |
| $2,499 or less | 1 (0.6%) | 94 (32.8%) |
| $2,500 to $4,999 | 0 (0.0%) | 0 (0.0%) |
| $5,000 to $7,499 | 0 (0.0%) | 59 (20.6%) |
| $7,500 to $9,999 | 0 (0.0%) | 20 (7.0%) |
| $10,000 to $12,499 | 98 (59.0%) | 9 (3.1%) |
| $12,500 to $14,999 | 3 (1.8%) | 7 (2.4%) |
| $15,000 to $17,499 | 24 (14.5%) | 0 (0.0%) |
| $17,500 to $19,999 | 0 (0.0%) | 0 (0.0%) |
| $20,000 to $22,499 | 0 (0.0%) | 0 (0.0%) |
| $22,500 to $24,999 | 0 (0.0%) | 36 (12.5%) |
| $25,000 to $29,999 | 0 (0.0%) | 0 (0.0%) |
| $30,000 to $34,999 | 0 (0.0%) | 18 (6.3%) |
| $35,000 to $39,999 | 0 (0.0%) | 8 (2.8%) |
| $40,000 to $44,999 | 0 (0.0%) | 14 (4.9%) |
| $45,000 to $49,999 | 22 (13.3%) | 0 (0.0%) |
| $50,000 to $54,999 | 0 (0.0%) | 0 (0.0%) |
| $55,000 to $64,999 | 0 (0.0%) | 0 (0.0%) |
| $65,000 to $74,999 | 0 (0.0%) | 17 (5.9%) |
| $75,000 to $99,999 | 18 (10.8%) | 5 (1.7%) |
| $100,000+ | 0 (0.0%) | 0 (0.0%) |
| Total | 166 (100.0%) | 287 (100.0%) |
Earnings by Sex by Educational Attainment in Greeley Hill
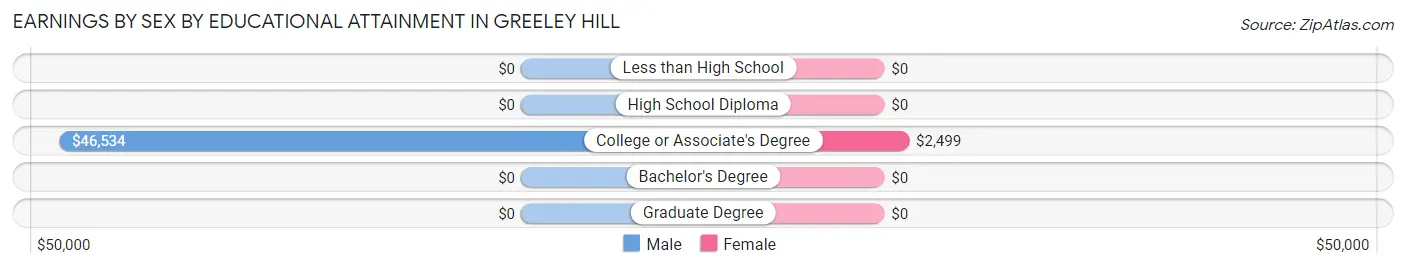
| Educational Attainment | Male Income | Female Income |
| Less than High School | - | - |
| High School Diploma | - | - |
| College or Associate's Degree | $46,534 | $2,499 |
| Bachelor's Degree | - | - |
| Graduate Degree | - | - |
| Total | - | - |
Family Income in Greeley Hill
Family Income Brackets in Greeley Hill
According to the Greeley Hill family income data, there are 62 families falling into the $50,000 to $74,999 income range, which is the most common income bracket and makes up 29.2% of all families.
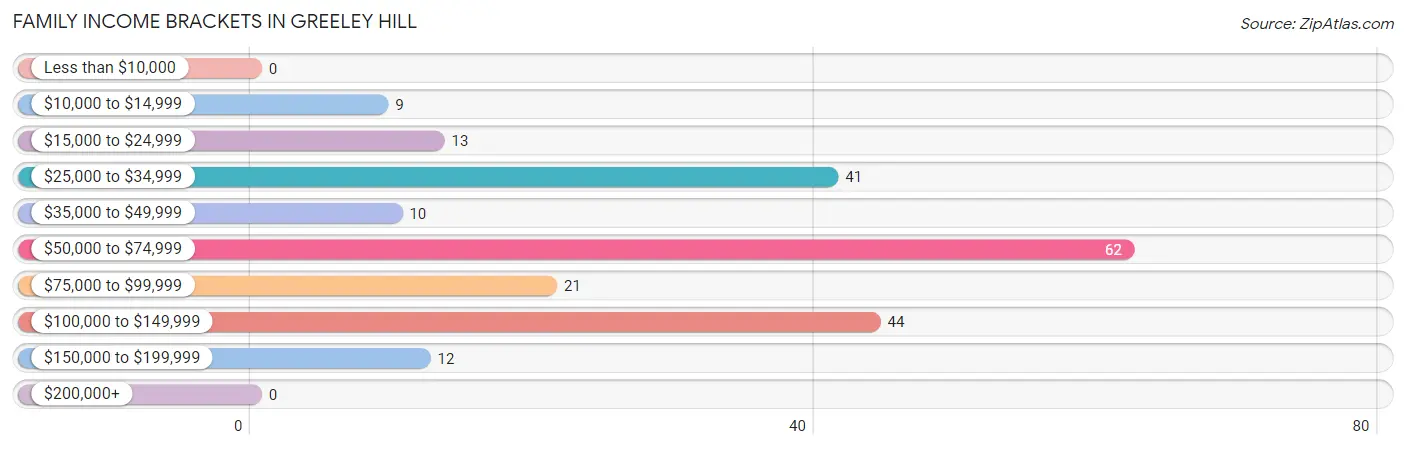
| Income Bracket | # Families | % Families |
| Less than $10,000 | 0 | 0.0% |
| $10,000 to $14,999 | 9 | 4.2% |
| $15,000 to $24,999 | 13 | 6.1% |
| $25,000 to $34,999 | 41 | 19.3% |
| $35,000 to $49,999 | 10 | 4.7% |
| $50,000 to $74,999 | 62 | 29.2% |
| $75,000 to $99,999 | 21 | 9.9% |
| $100,000 to $149,999 | 44 | 20.8% |
| $150,000 to $199,999 | 12 | 5.7% |
| $200,000+ | 0 | 0.0% |
Family Income by Famaliy Size in Greeley Hill
3-person families (55 | 25.9%) account for the highest median family income in Greeley Hill with $67,356 per family, while 3-person families (55 | 25.9%) have the highest median income of $22,452 per family member.
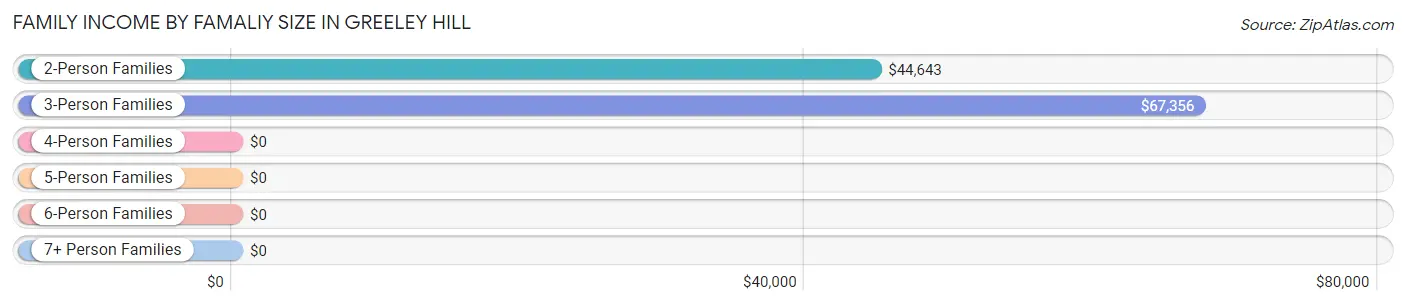
| Income Bracket | # Families | Median Income |
| 2-Person Families | 138 (65.1%) | $44,643 |
| 3-Person Families | 55 (25.9%) | $67,356 |
| 4-Person Families | 8 (3.8%) | $0 |
| 5-Person Families | 11 (5.2%) | $0 |
| 6-Person Families | 0 (0.0%) | $0 |
| 7+ Person Families | 0 (0.0%) | $0 |
| Total | 212 (100.0%) | $66,346 |
Family Income by Number of Earners in Greeley Hill
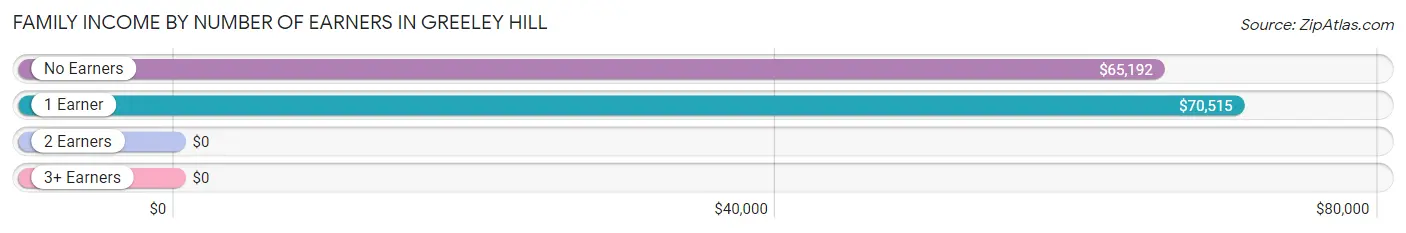
| Number of Earners | # Families | Median Income |
| No Earners | 106 (50.0%) | $65,192 |
| 1 Earner | 83 (39.2%) | $70,515 |
| 2 Earners | 20 (9.4%) | $0 |
| 3+ Earners | 3 (1.4%) | $0 |
| Total | 212 (100.0%) | $66,346 |
Household Income in Greeley Hill
Household Income Brackets in Greeley Hill
With 129 households falling in the category, the $25,000 to $34,999 income range is the most frequent in Greeley Hill, accounting for 26.5% of all households.
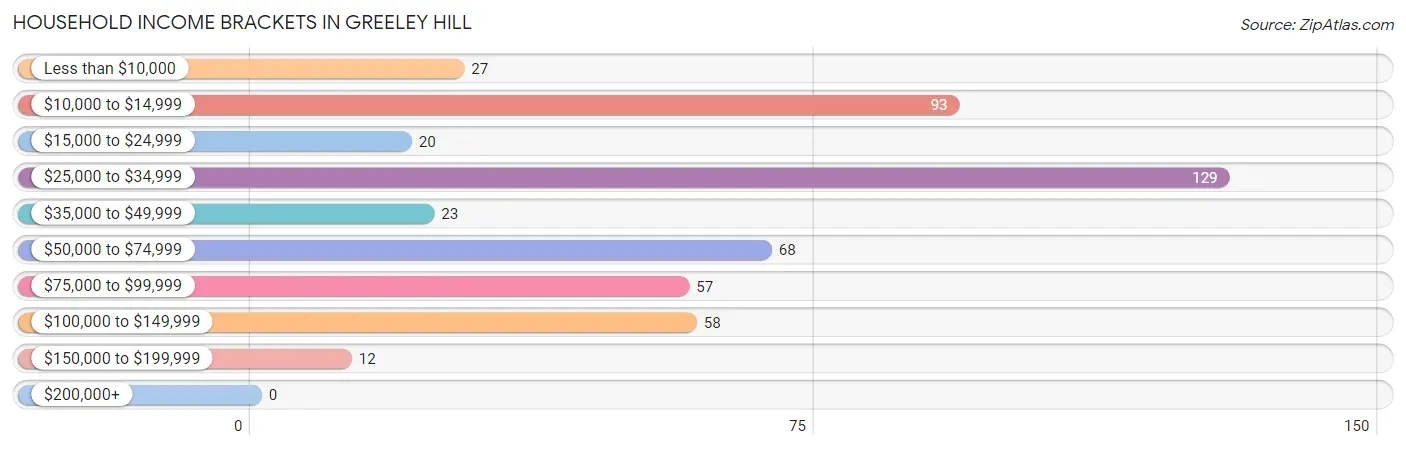
| Income Bracket | # Households | % Households |
| Less than $10,000 | 27 | 5.5% |
| $10,000 to $14,999 | 93 | 19.1% |
| $15,000 to $24,999 | 20 | 4.1% |
| $25,000 to $34,999 | 129 | 26.5% |
| $35,000 to $49,999 | 23 | 4.7% |
| $50,000 to $74,999 | 68 | 14.0% |
| $75,000 to $99,999 | 57 | 11.7% |
| $100,000 to $149,999 | 58 | 11.9% |
| $150,000 to $199,999 | 12 | 2.5% |
| $200,000+ | 0 | 0.0% |
Household Income by Householder Age in Greeley Hill
The median household income in Greeley Hill is $0, with the highest median household income of $46,667 found in the 45 to 64 years age bracket for the primary householder. A total of 58 households (11.9%) fall into this category.
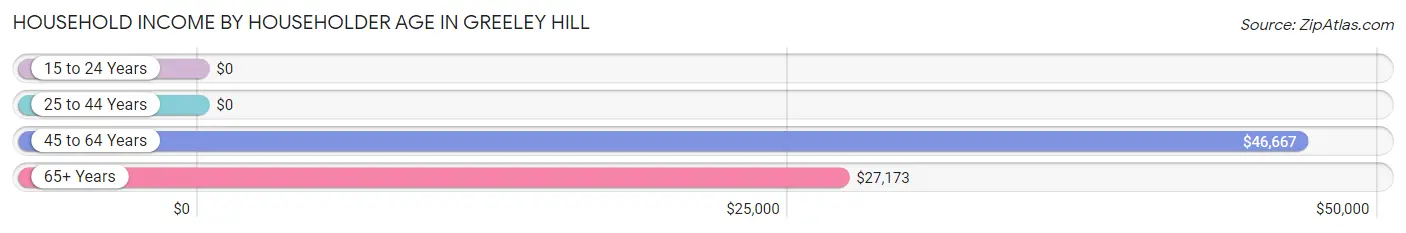
| Income Bracket | # Households | Median Income |
| 15 to 24 Years | 0 (0.0%) | $0 |
| 25 to 44 Years | 164 (33.7%) | $0 |
| 45 to 64 Years | 58 (11.9%) | $46,667 |
| 65+ Years | 265 (54.4%) | $27,173 |
| Total | 487 (100.0%) | $0 |
Poverty in Greeley Hill
Income Below Poverty by Sex and Age in Greeley Hill
With 27.5% poverty level for males and 23.1% for females among the residents of Greeley Hill, 18 to 24 year old males and 25 to 34 year old females are the most vulnerable to poverty, with 87 males (100.0%) and 84 females (73.0%) in their respective age groups living below the poverty level.
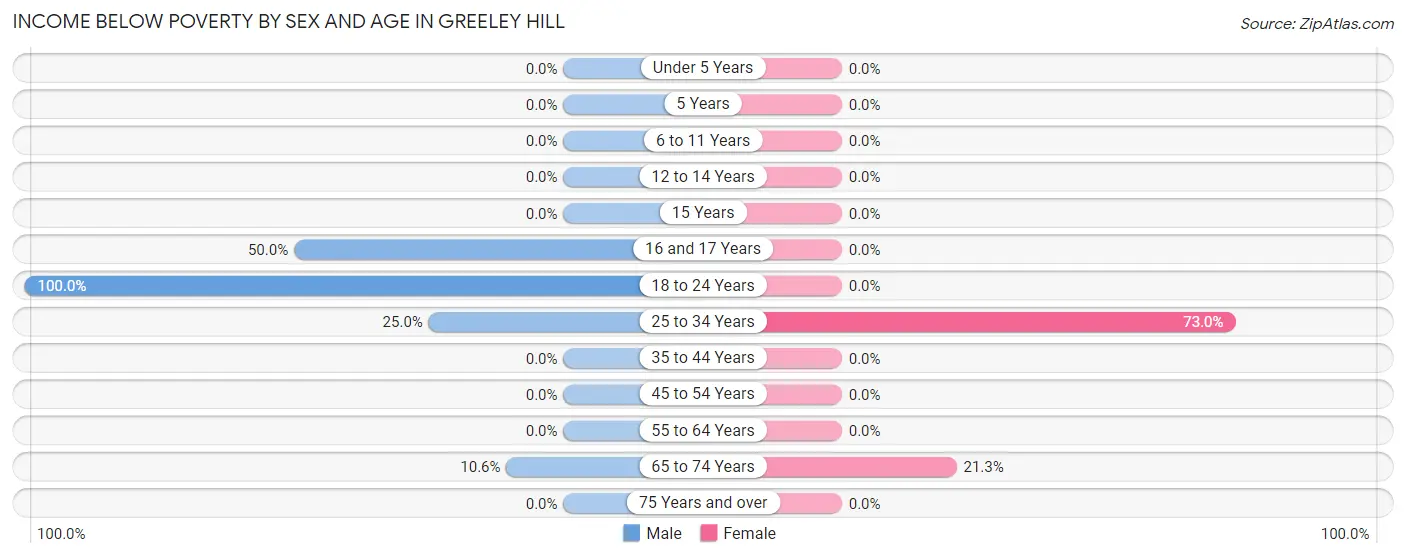
| Age Bracket | Male | Female |
| Under 5 Years | 0 (0.0%) | 0 (0.0%) |
| 5 Years | 0 (0.0%) | 0 (0.0%) |
| 6 to 11 Years | 0 (0.0%) | 0 (0.0%) |
| 12 to 14 Years | 0 (0.0%) | 0 (0.0%) |
| 15 Years | 0 (0.0%) | 0 (0.0%) |
| 16 and 17 Years | 10 (50.0%) | 0 (0.0%) |
| 18 to 24 Years | 87 (100.0%) | 0 (0.0%) |
| 25 to 34 Years | 13 (25.0%) | 84 (73.0%) |
| 35 to 44 Years | 0 (0.0%) | 0 (0.0%) |
| 45 to 54 Years | 0 (0.0%) | 0 (0.0%) |
| 55 to 64 Years | 0 (0.0%) | 0 (0.0%) |
| 65 to 74 Years | 11 (10.6%) | 36 (21.3%) |
| 75 Years and over | 0 (0.0%) | 0 (0.0%) |
| Total | 121 (27.5%) | 120 (23.1%) |
Income Above Poverty by Sex and Age in Greeley Hill
According to the poverty statistics in Greeley Hill, males aged 6 to 11 years and females aged 6 to 11 years are the age groups that are most secure financially, with 100.0% of males and 100.0% of females in these age groups living above the poverty line.
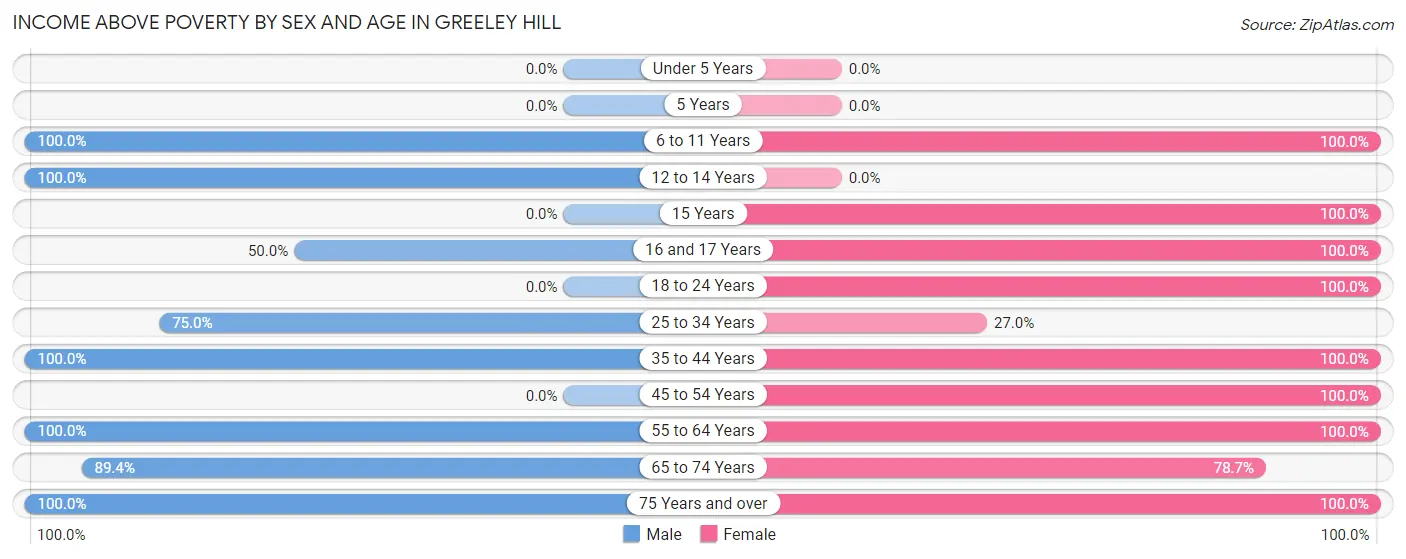
| Age Bracket | Male | Female |
| Under 5 Years | 0 (0.0%) | 0 (0.0%) |
| 5 Years | 0 (0.0%) | 0 (0.0%) |
| 6 to 11 Years | 36 (100.0%) | 17 (100.0%) |
| 12 to 14 Years | 32 (100.0%) | 0 (0.0%) |
| 15 Years | 0 (0.0%) | 15 (100.0%) |
| 16 and 17 Years | 10 (50.0%) | 10 (100.0%) |
| 18 to 24 Years | 0 (0.0%) | 4 (100.0%) |
| 25 to 34 Years | 39 (75.0%) | 31 (27.0%) |
| 35 to 44 Years | 13 (100.0%) | 53 (100.0%) |
| 45 to 54 Years | 0 (0.0%) | 8 (100.0%) |
| 55 to 64 Years | 41 (100.0%) | 57 (100.0%) |
| 65 to 74 Years | 93 (89.4%) | 133 (78.7%) |
| 75 Years and over | 55 (100.0%) | 72 (100.0%) |
| Total | 319 (72.5%) | 400 (76.9%) |
Income Below Poverty Among Married-Couple Families in Greeley Hill
The poverty statistics for married-couple families in Greeley Hill show that 6.0% or 9 of the total 149 families live below the poverty line. Families with no children have the highest poverty rate of 7.0%, comprising of 9 families. On the other hand, families with 1 or 2 children have the lowest poverty rate of 0.0%, which includes 0 families.
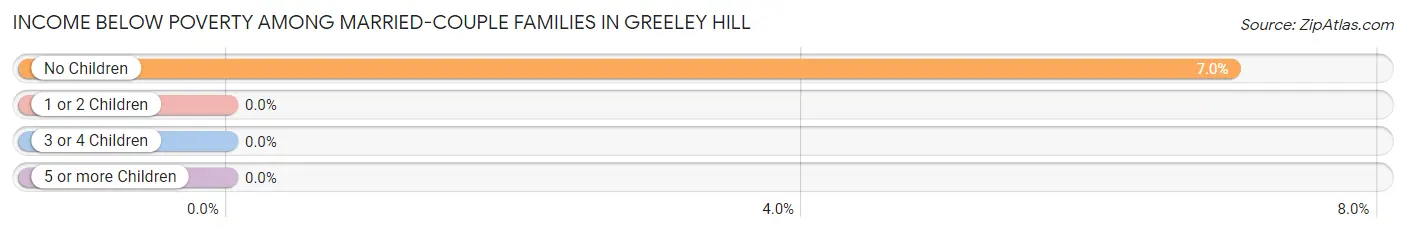
| Children | Above Poverty | Below Poverty |
| No Children | 120 (93.0%) | 9 (7.0%) |
| 1 or 2 Children | 20 (100.0%) | 0 (0.0%) |
| 3 or 4 Children | 0 (0.0%) | 0 (0.0%) |
| 5 or more Children | 0 (0.0%) | 0 (0.0%) |
| Total | 140 (94.0%) | 9 (6.0%) |
Income Below Poverty Among Single-Parent Households in Greeley Hill
| Children | Single Father | Single Mother |
| No Children | 0 (0.0%) | 0 (0.0%) |
| 1 or 2 Children | 0 (0.0%) | 0 (0.0%) |
| 3 or 4 Children | 0 (0.0%) | 0 (0.0%) |
| 5 or more Children | 0 (0.0%) | 0 (0.0%) |
| Total | 0 (0.0%) | 0 (0.0%) |
Income Below Poverty Among Married-Couple vs Single-Parent Households in Greeley Hill
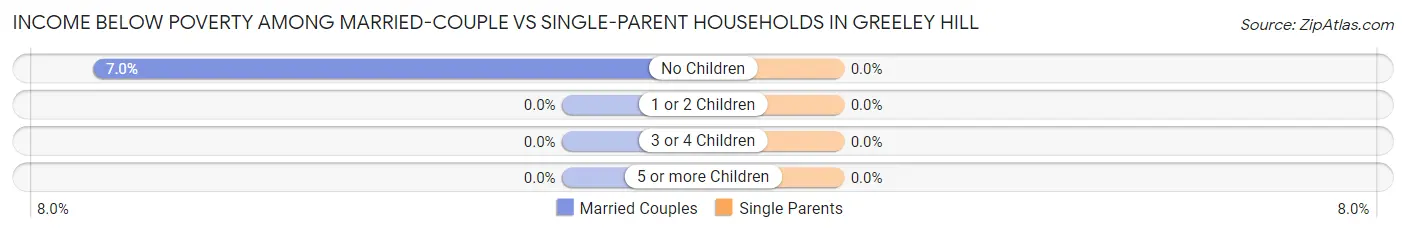
| Children | Married-Couple Families | Single-Parent Households |
| No Children | 9 (7.0%) | 0 (0.0%) |
| 1 or 2 Children | 0 (0.0%) | 0 (0.0%) |
| 3 or 4 Children | 0 (0.0%) | 0 (0.0%) |
| 5 or more Children | 0 (0.0%) | 0 (0.0%) |
| Total | 9 (6.0%) | 0 (0.0%) |
Race in Greeley Hill
The most populous races in Greeley Hill are White / Caucasian (949 | 98.9%), Two or more Races (11 | 1.1%), and Hispanic or Latino (10 | 1.0%).
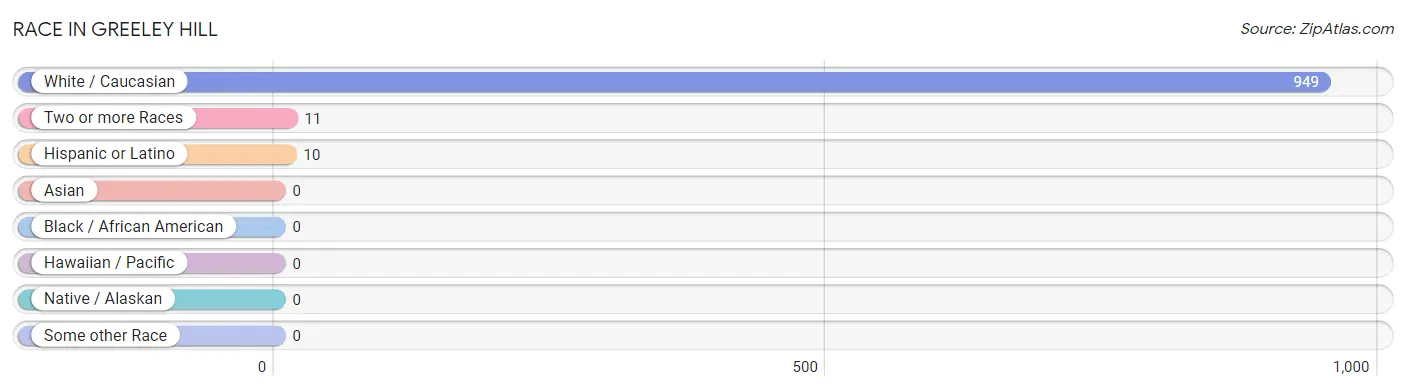
| Race | # Population | % Population |
| Asian | 0 | 0.0% |
| Black / African American | 0 | 0.0% |
| Hawaiian / Pacific | 0 | 0.0% |
| Hispanic or Latino | 10 | 1.0% |
| Native / Alaskan | 0 | 0.0% |
| White / Caucasian | 949 | 98.9% |
| Two or more Races | 11 | 1.1% |
| Some other Race | 0 | 0.0% |
| Total | 960 | 100.0% |
Ancestry in Greeley Hill
The most populous ancestries reported in Greeley Hill are Irish (340 | 35.4%), English (197 | 20.5%), Italian (113 | 11.8%), German (71 | 7.4%), and Portuguese (49 | 5.1%), together accounting for 80.2% of all Greeley Hill residents.
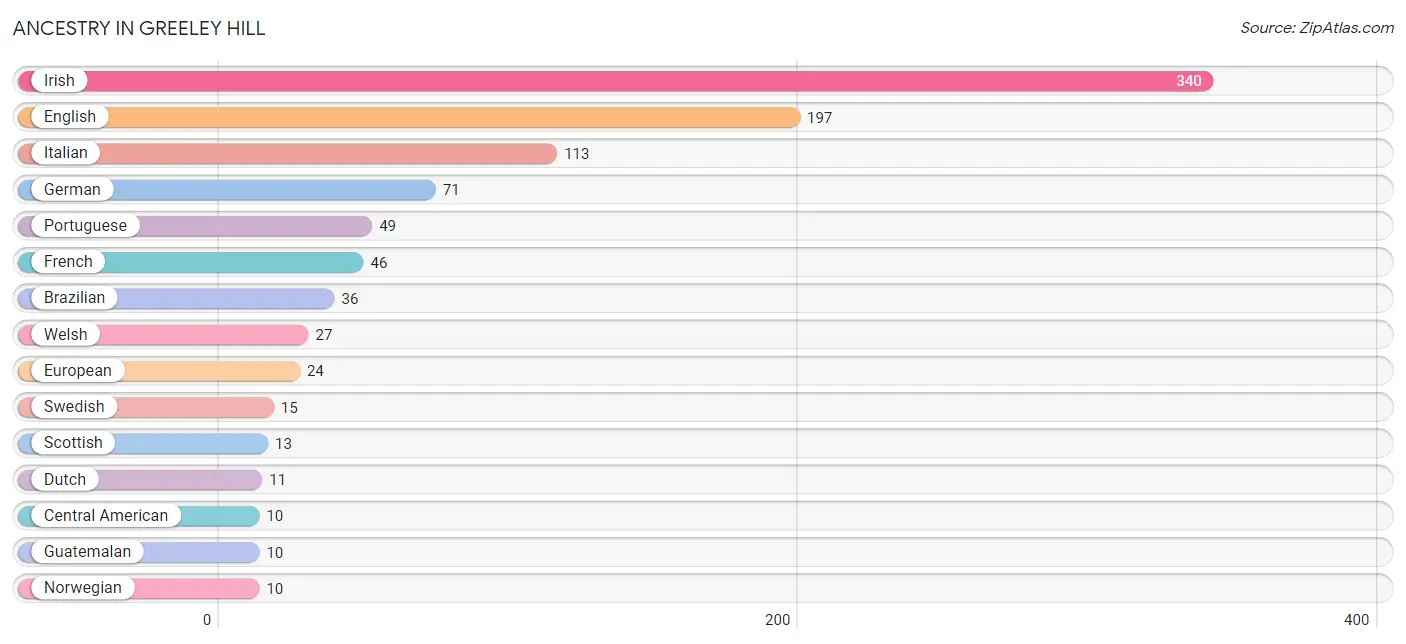
| Ancestry | # Population | % Population |
| Brazilian | 36 | 3.7% |
| Central American | 10 | 1.0% |
| Dutch | 11 | 1.1% |
| English | 197 | 20.5% |
| European | 24 | 2.5% |
| French | 46 | 4.8% |
| French Canadian | 9 | 0.9% |
| German | 71 | 7.4% |
| Guatemalan | 10 | 1.0% |
| Irish | 340 | 35.4% |
| Italian | 113 | 11.8% |
| Norwegian | 10 | 1.0% |
| Polish | 6 | 0.6% |
| Portuguese | 49 | 5.1% |
| Scottish | 13 | 1.3% |
| Swedish | 15 | 1.6% |
| Welsh | 27 | 2.8% | View All 17 Rows |
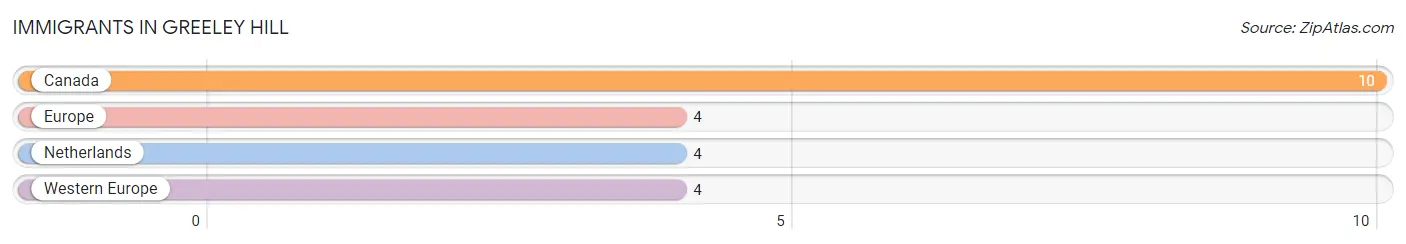
Immigrants in Greeley Hill
The most numerous immigrant groups reported in Greeley Hill came from Canada (10 | 1.0%), Europe (4 | 0.4%), Netherlands (4 | 0.4%), and Western Europe (4 | 0.4%), together accounting for 2.3% of all Greeley Hill residents.
| Immigration Origin | # Population | % Population |
| Canada | 10 | 1.0% |
| Europe | 4 | 0.4% |
| Netherlands | 4 | 0.4% |
| Western Europe | 4 | 0.4% | View All 4 Rows |
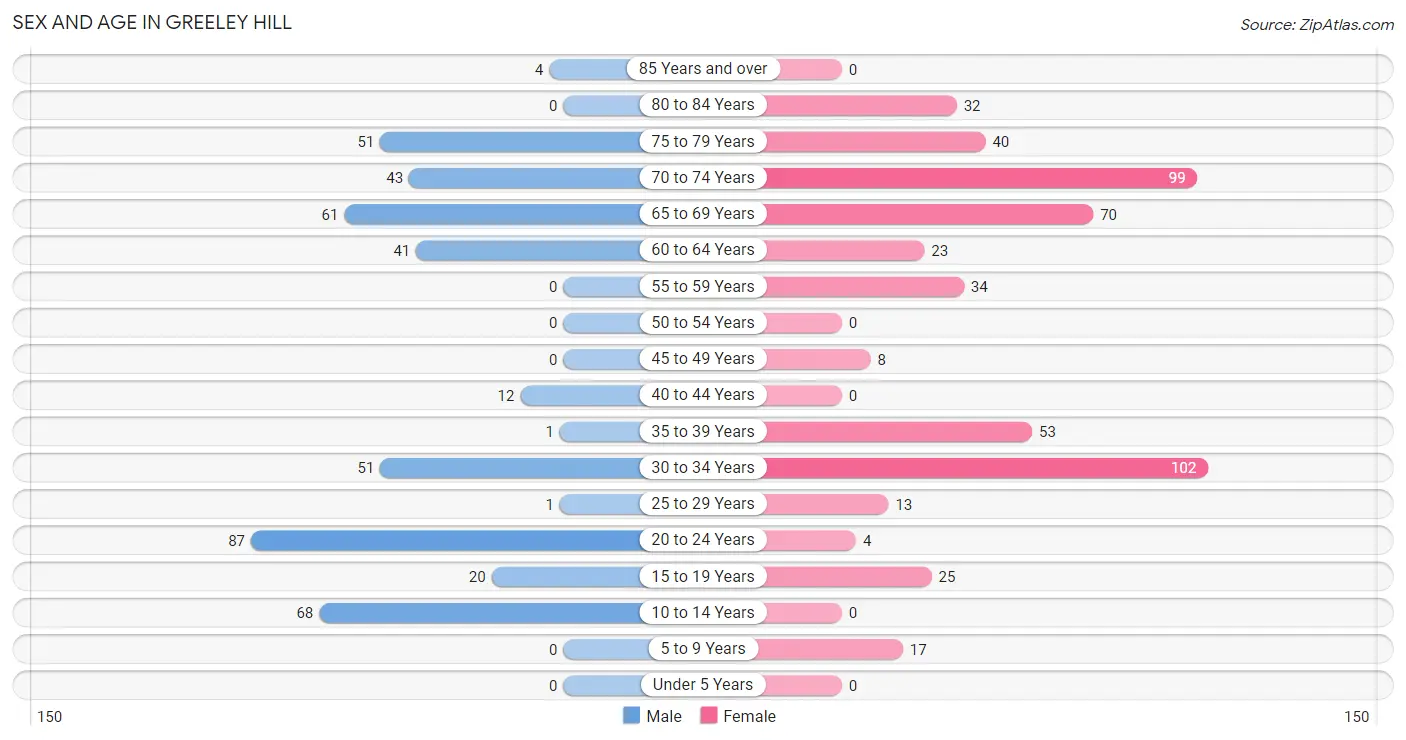
Sex and Age in Greeley Hill
Sex and Age in Greeley Hill
The most populous age groups in Greeley Hill are 20 to 24 Years (87 | 19.8%) for men and 30 to 34 Years (102 | 19.6%) for women.
| Age Bracket | Male | Female |
| Under 5 Years | 0 (0.0%) | 0 (0.0%) |
| 5 to 9 Years | 0 (0.0%) | 17 (3.3%) |
| 10 to 14 Years | 68 (15.4%) | 0 (0.0%) |
| 15 to 19 Years | 20 (4.5%) | 25 (4.8%) |
| 20 to 24 Years | 87 (19.8%) | 4 (0.8%) |
| 25 to 29 Years | 1 (0.2%) | 13 (2.5%) |
| 30 to 34 Years | 51 (11.6%) | 102 (19.6%) |
| 35 to 39 Years | 1 (0.2%) | 53 (10.2%) |
| 40 to 44 Years | 12 (2.7%) | 0 (0.0%) |
| 45 to 49 Years | 0 (0.0%) | 8 (1.5%) |
| 50 to 54 Years | 0 (0.0%) | 0 (0.0%) |
| 55 to 59 Years | 0 (0.0%) | 34 (6.5%) |
| 60 to 64 Years | 41 (9.3%) | 23 (4.4%) |
| 65 to 69 Years | 61 (13.9%) | 70 (13.5%) |
| 70 to 74 Years | 43 (9.8%) | 99 (19.0%) |
| 75 to 79 Years | 51 (11.6%) | 40 (7.7%) |
| 80 to 84 Years | 0 (0.0%) | 32 (6.1%) |
| 85 Years and over | 4 (0.9%) | 0 (0.0%) |
| Total | 440 (100.0%) | 520 (100.0%) |
Families and Households in Greeley Hill
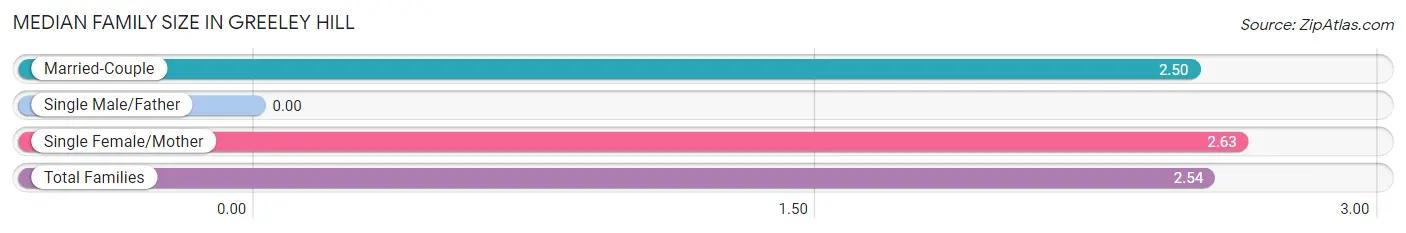
Median Family Size in Greeley Hill
| Family Type | # Families | Family Size |
| Married-Couple | 149 (70.3%) | 2.50 |
| Single Male/Father | 0 (0.0%) | - |
| Single Female/Mother | 63 (29.7%) | 2.63 |
| Total Families | 212 (100.0%) | 2.54 |
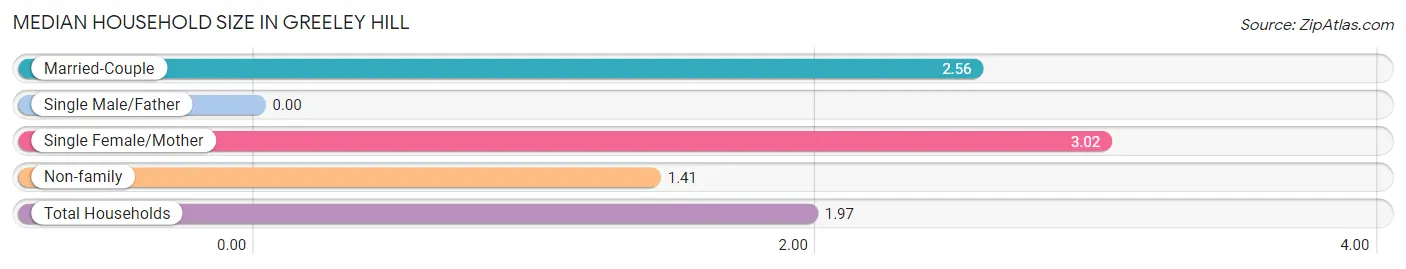
Median Household Size in Greeley Hill
| Household Type | # Households | Household Size |
| Married-Couple | 149 (30.6%) | 2.56 |
| Single Male/Father | 0 (0.0%) | - |
| Single Female/Mother | 63 (12.9%) | 3.02 |
| Non-family | 275 (56.5%) | 1.41 |
| Total Households | 487 (100.0%) | 1.97 |
Household Size by Marriage Status in Greeley Hill
Out of a total of 487 households in Greeley Hill, 212 (43.5%) are family households, while 275 (56.5%) are nonfamily households. The most numerous type of family households are 2-person households, comprising 125, and the most common type of nonfamily households are 1-person households, comprising 141.
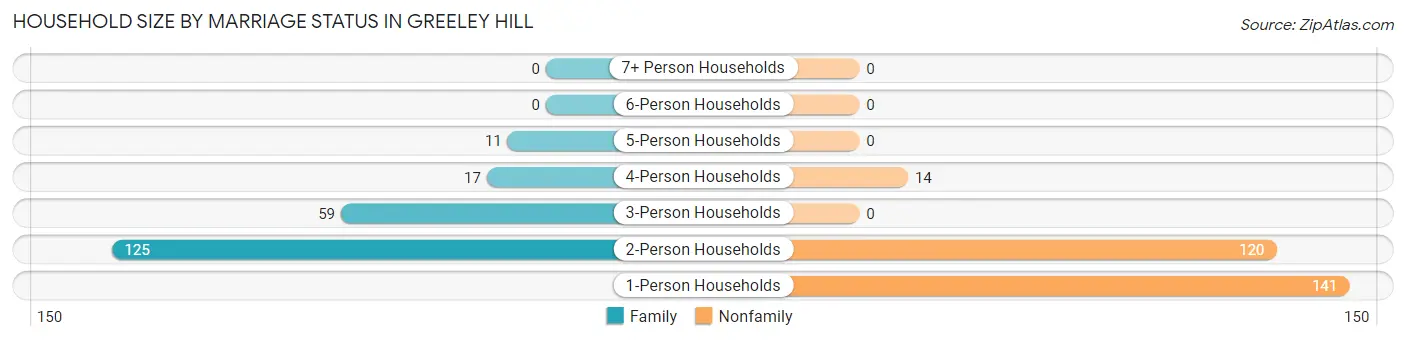
| Household Size | Family Households | Nonfamily Households |
| 1-Person Households | - | 141 (28.9%) |
| 2-Person Households | 125 (25.7%) | 120 (24.6%) |
| 3-Person Households | 59 (12.1%) | 0 (0.0%) |
| 4-Person Households | 17 (3.5%) | 14 (2.9%) |
| 5-Person Households | 11 (2.3%) | 0 (0.0%) |
| 6-Person Households | 0 (0.0%) | 0 (0.0%) |
| 7+ Person Households | 0 (0.0%) | 0 (0.0%) |
| Total | 212 (43.5%) | 275 (56.5%) |
Female Fertility in Greeley Hill
Fertility by Age in Greeley Hill
| Age Bracket | Women with Births | Births / 1,000 Women |
| 15 to 19 years | 0 (0.0%) | 0.0 |
| 20 to 34 years | 0 (0.0%) | 0.0 |
| 35 to 50 years | 0 (0.0%) | 0.0 |
| Total | 0 (0.0%) | 0.0 |
Fertility by Age by Marriage Status in Greeley Hill
| Age Bracket | Married | Unmarried |
| 15 to 19 years | 0 (0.0%) | 0 (0.0%) |
| 20 to 34 years | 0 (0.0%) | 0 (0.0%) |
| 35 to 50 years | 0 (0.0%) | 0 (0.0%) |
| Total | 0 (0.0%) | 0 (0.0%) |
Fertility by Education in Greeley Hill
| Educational Attainment | Women with Births | Births / 1,000 Women |
| Less than High School | 0 (0.0%) | 0.0 |
| High School Diploma | 0 (0.0%) | 0.0 |
| College or Associate's Degree | 0 (0.0%) | 0.0 |
| Bachelor's Degree | 0 (0.0%) | 0.0 |
| Graduate Degree | 0 (0.0%) | 0.0 |
| Total | 0 (0.0%) | 0.0 |
Fertility by Education by Marriage Status in Greeley Hill
| Educational Attainment | Married | Unmarried |
| Less than High School | 0 (0.0%) | 0 (0.0%) |
| High School Diploma | 0 (0.0%) | 0 (0.0%) |
| College or Associate's Degree | 0 (0.0%) | 0 (0.0%) |
| Bachelor's Degree | 0 (0.0%) | 0 (0.0%) |
| Graduate Degree | 0 (0.0%) | 0 (0.0%) |
| Total | 0 (0.0%) | 0 (0.0%) |
Employment Characteristics in Greeley Hill
Employment by Class of Employer in Greeley Hill
Among the 368 employed individuals in Greeley Hill, private company employees (246 | 66.8%), local government employees (75 | 20.4%), and federal government employees (36 | 9.8%) make up the most common classes of employment.
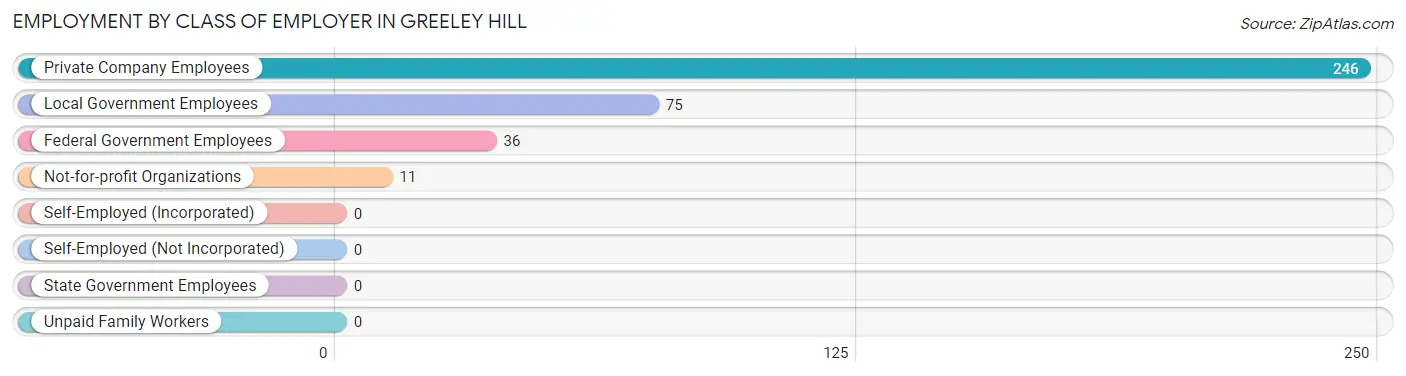
| Employer Class | # Employees | % Employees |
| Private Company Employees | 246 | 66.8% |
| Self-Employed (Incorporated) | 0 | 0.0% |
| Self-Employed (Not Incorporated) | 0 | 0.0% |
| Not-for-profit Organizations | 11 | 3.0% |
| Local Government Employees | 75 | 20.4% |
| State Government Employees | 0 | 0.0% |
| Federal Government Employees | 36 | 9.8% |
| Unpaid Family Workers | 0 | 0.0% |
| Total | 368 | 100.0% |
Employment Status by Age in Greeley Hill
According to the labor force statistics for Greeley Hill, out of the total population over 16 years of age (860), 45.0% or 387 individuals are in the labor force, with 4.9% or 19 of them unemployed. The age group with the highest labor force participation rate is 25 to 29 years, with 100.0% or 14 individuals in the labor force. Within the labor force, the 25 to 29 years age range has the highest percentage of unemployed individuals, with 92.9% or 13 of them being unemployed.
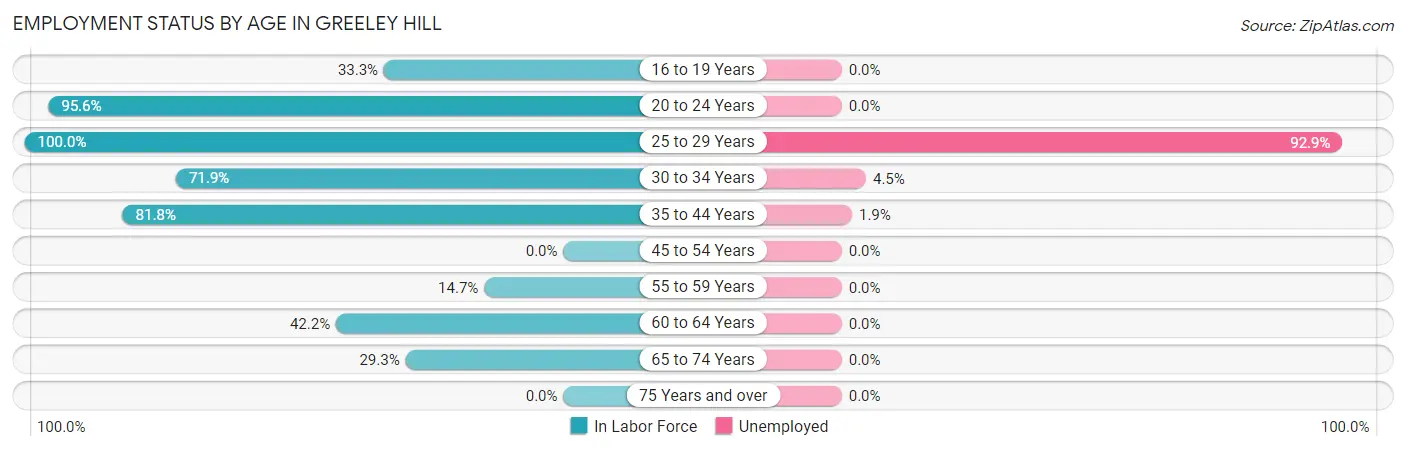
| Age Bracket | In Labor Force | Unemployed |
| 16 to 19 Years | 10 (33.3%) | 0 (0.0%) |
| 20 to 24 Years | 87 (95.6%) | 0 (0.0%) |
| 25 to 29 Years | 14 (100.0%) | 13 (92.9%) |
| 30 to 34 Years | 110 (71.9%) | 5 (4.5%) |
| 35 to 44 Years | 54 (81.8%) | 1 (1.9%) |
| 45 to 54 Years | 0 (0.0%) | 0 (0.0%) |
| 55 to 59 Years | 5 (14.7%) | 0 (0.0%) |
| 60 to 64 Years | 27 (42.2%) | 0 (0.0%) |
| 65 to 74 Years | 80 (29.3%) | 0 (0.0%) |
| 75 Years and over | 0 (0.0%) | 0 (0.0%) |
| Total | 387 (45.0%) | 19 (4.9%) |
Employment Status by Educational Attainment in Greeley Hill
According to labor force statistics for Greeley Hill, 61.9% of individuals (210) out of the total population between 25 and 64 years of age (339) are in the labor force, with 9.0% or 19 of them being unemployed. The group with the highest labor force participation rate are those with the educational attainment of college / associate degree, with 76.3% or 142 individuals in the labor force. Within the labor force, individuals with high school diploma education have the highest percentage of unemployment, with 36.8% or 14 of them being unemployed.
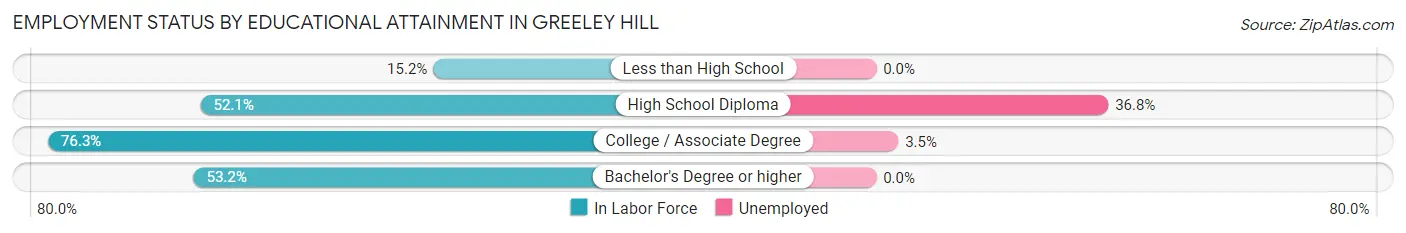
| Educational Attainment | In Labor Force | Unemployed |
| Less than High School | 5 (15.2%) | 0 (0.0%) |
| High School Diploma | 38 (52.1%) | 27 (36.8%) |
| College / Associate Degree | 142 (76.3%) | 7 (3.5%) |
| Bachelor's Degree or higher | 25 (53.2%) | 0 (0.0%) |
| Total | 210 (61.9%) | 31 (9.0%) |
Employment Occupations by Sex in Greeley Hill
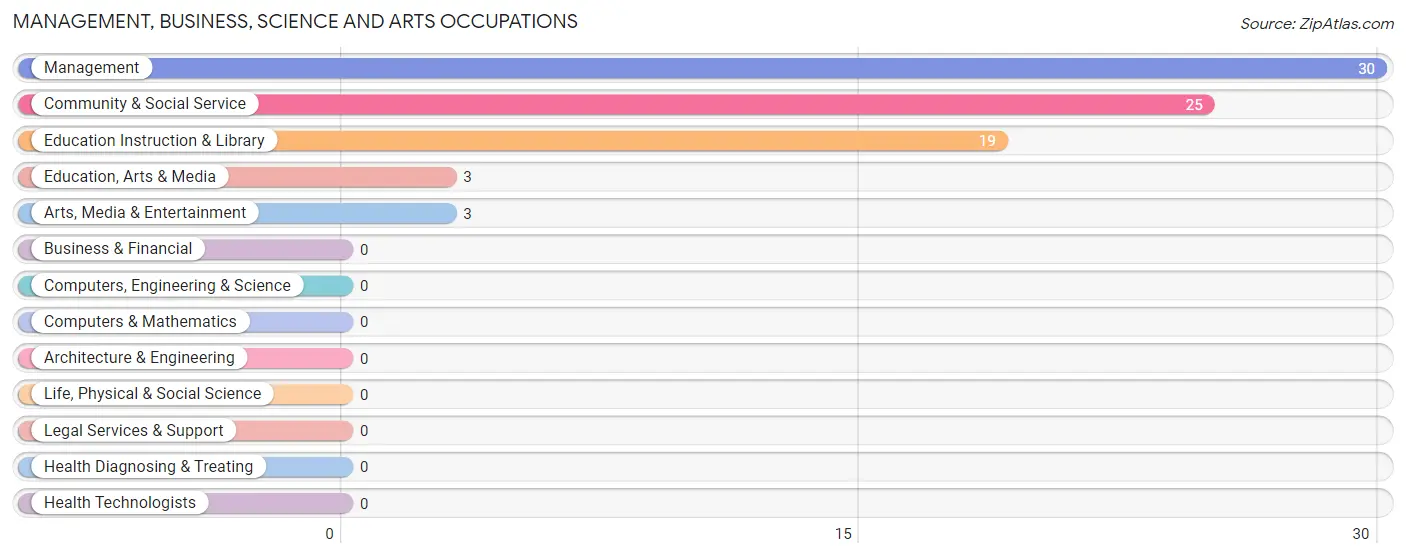
Management, Business, Science and Arts Occupations
The most common Management, Business, Science and Arts occupations in Greeley Hill are Management (30 | 8.2%), Community & Social Service (25 | 6.8%), Education Instruction & Library (19 | 5.2%), Education, Arts & Media (3 | 0.8%), and Arts, Media & Entertainment (3 | 0.8%).
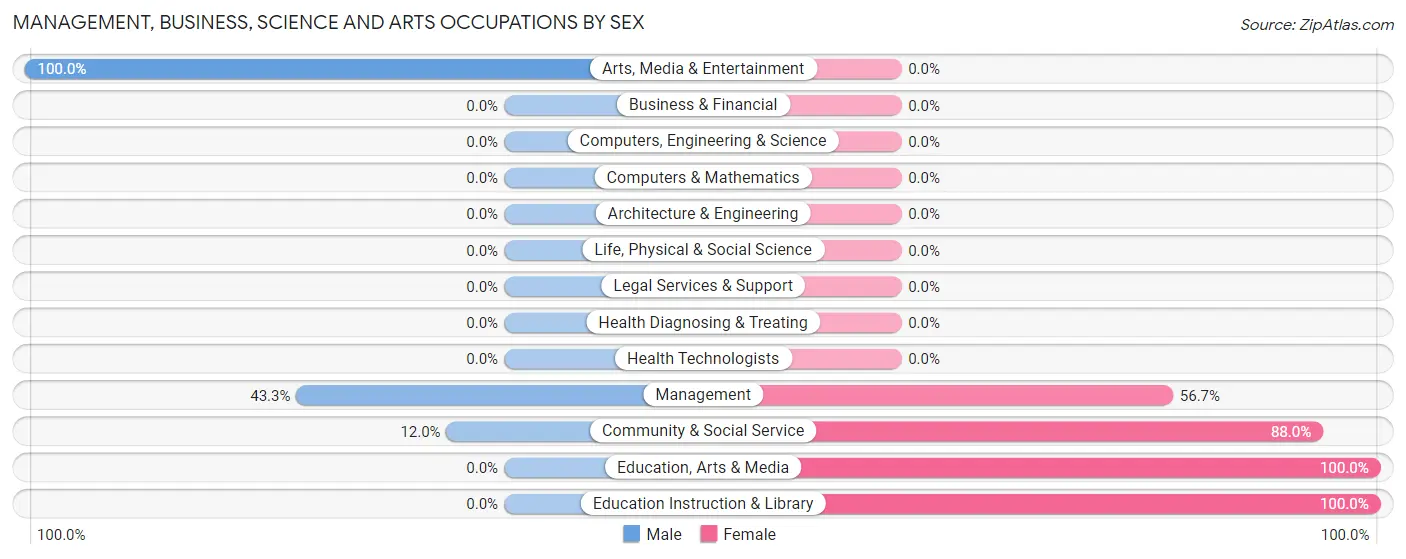
Management, Business, Science and Arts Occupations by Sex
Within the Management, Business, Science and Arts occupations in Greeley Hill, the most male-oriented occupations are Arts, Media & Entertainment (100.0%), Management (43.3%), and Community & Social Service (12.0%), while the most female-oriented occupations are Education, Arts & Media (100.0%), Education Instruction & Library (100.0%), and Community & Social Service (88.0%).
| Occupation | Male | Female |
| Management | 13 (43.3%) | 17 (56.7%) |
| Business & Financial | 0 (0.0%) | 0 (0.0%) |
| Computers, Engineering & Science | 0 (0.0%) | 0 (0.0%) |
| Computers & Mathematics | 0 (0.0%) | 0 (0.0%) |
| Architecture & Engineering | 0 (0.0%) | 0 (0.0%) |
| Life, Physical & Social Science | 0 (0.0%) | 0 (0.0%) |
| Community & Social Service | 3 (12.0%) | 22 (88.0%) |
| Education, Arts & Media | 0 (0.0%) | 3 (100.0%) |
| Legal Services & Support | 0 (0.0%) | 0 (0.0%) |
| Education Instruction & Library | 0 (0.0%) | 19 (100.0%) |
| Arts, Media & Entertainment | 3 (100.0%) | 0 (0.0%) |
| Health Diagnosing & Treating | 0 (0.0%) | 0 (0.0%) |
| Health Technologists | 0 (0.0%) | 0 (0.0%) |
| Total (Category) | 16 (29.1%) | 39 (70.9%) |
| Total (Overall) | 117 (31.8%) | 251 (68.2%) |
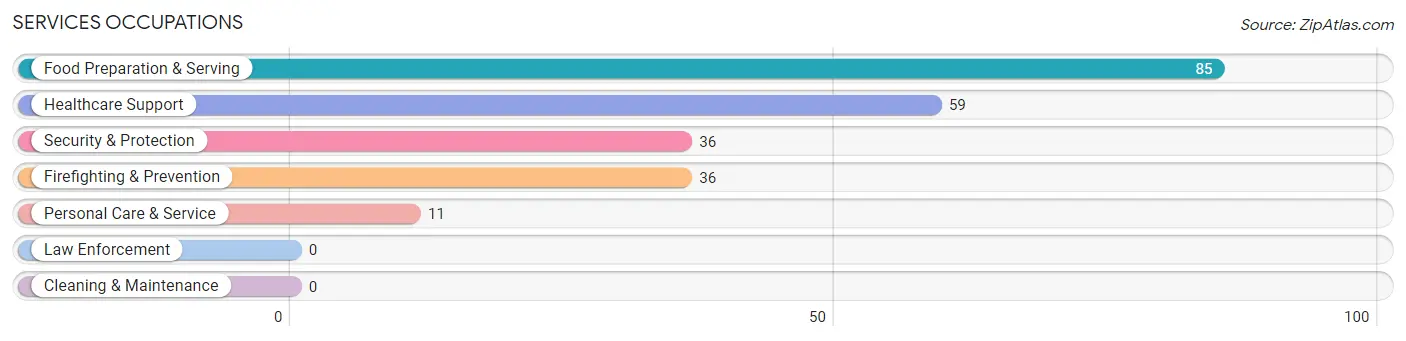
Services Occupations
The most common Services occupations in Greeley Hill are Food Preparation & Serving (85 | 23.1%), Healthcare Support (59 | 16.0%), Security & Protection (36 | 9.8%), Firefighting & Prevention (36 | 9.8%), and Personal Care & Service (11 | 3.0%).
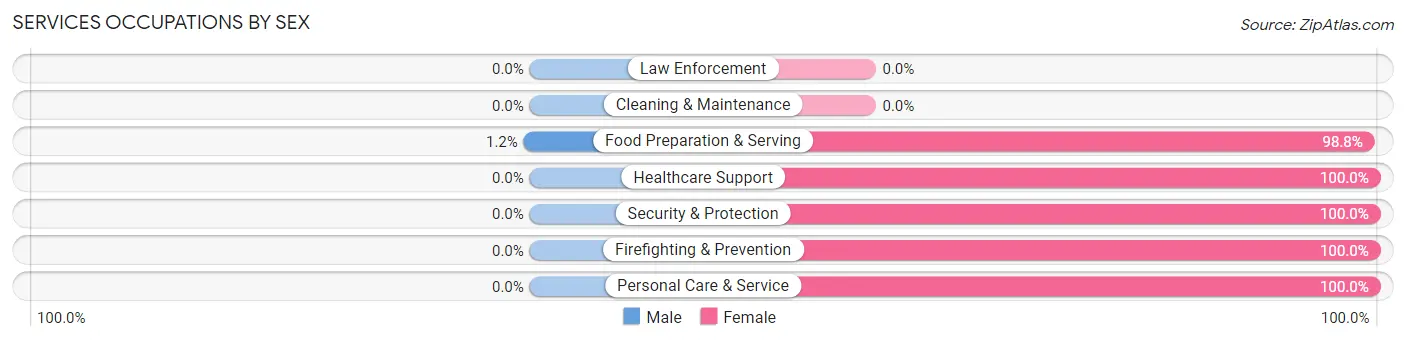
Services Occupations by Sex
| Occupation | Male | Female |
| Healthcare Support | 0 (0.0%) | 59 (100.0%) |
| Security & Protection | 0 (0.0%) | 36 (100.0%) |
| Firefighting & Prevention | 0 (0.0%) | 36 (100.0%) |
| Law Enforcement | 0 (0.0%) | 0 (0.0%) |
| Food Preparation & Serving | 1 (1.2%) | 84 (98.8%) |
| Cleaning & Maintenance | 0 (0.0%) | 0 (0.0%) |
| Personal Care & Service | 0 (0.0%) | 11 (100.0%) |
| Total (Category) | 1 (0.5%) | 190 (99.5%) |
| Total (Overall) | 117 (31.8%) | 251 (68.2%) |
Sales and Office Occupations
The most common Sales and Office occupations in Greeley Hill are Sales & Related (22 | 6.0%), and Office & Administration (13 | 3.5%).
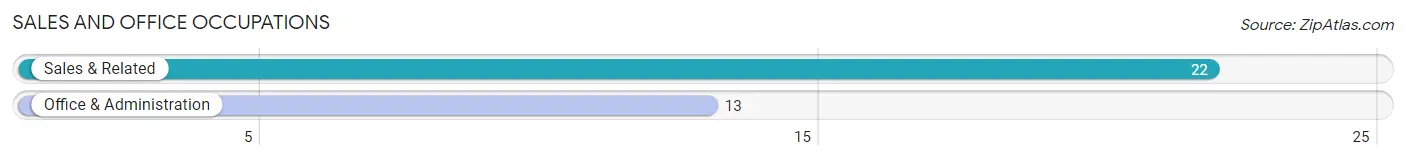
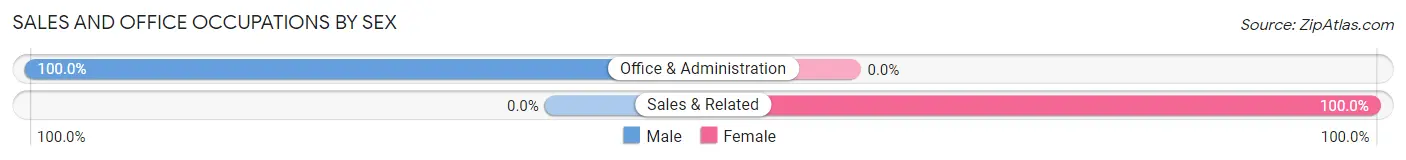
Sales and Office Occupations by Sex
| Occupation | Male | Female |
| Sales & Related | 0 (0.0%) | 22 (100.0%) |
| Office & Administration | 13 (100.0%) | 0 (0.0%) |
| Total (Category) | 13 (37.1%) | 22 (62.9%) |
| Total (Overall) | 117 (31.8%) | 251 (68.2%) |
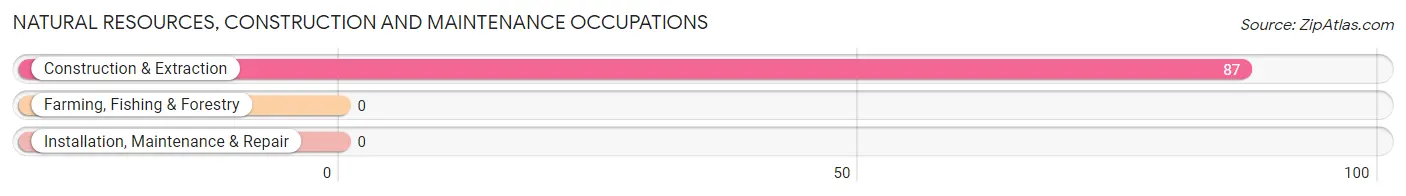
Natural Resources, Construction and Maintenance Occupations
The most common Natural Resources, Construction and Maintenance occupations in Greeley Hill are , and Construction & Extraction (87 | 23.6%).
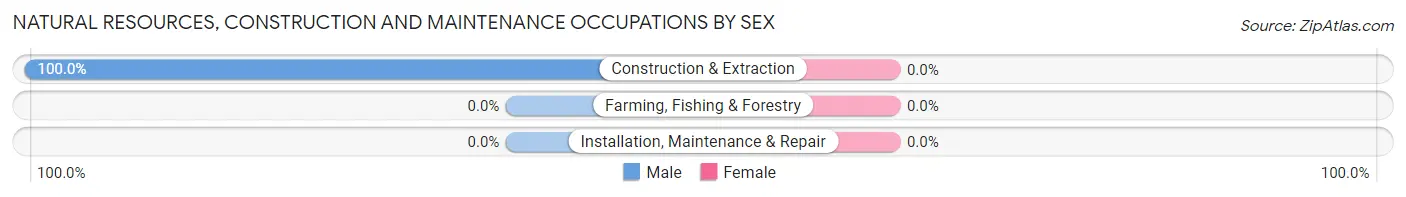
Natural Resources, Construction and Maintenance Occupations by Sex
| Occupation | Male | Female |
| Farming, Fishing & Forestry | 0 (0.0%) | 0 (0.0%) |
| Construction & Extraction | 87 (100.0%) | 0 (0.0%) |
| Installation, Maintenance & Repair | 0 (0.0%) | 0 (0.0%) |
| Total (Category) | 87 (100.0%) | 0 (0.0%) |
| Total (Overall) | 117 (31.8%) | 251 (68.2%) |
Production, Transportation and Moving Occupations
Production, Transportation and Moving Occupations by Sex
| Occupation | Male | Female |
| Production | 0 (0.0%) | 0 (0.0%) |
| Transportation | 0 (0.0%) | 0 (0.0%) |
| Material Moving | 0 (0.0%) | 0 (0.0%) |
| Total (Category) | 0 (0.0%) | 0 (0.0%) |
| Total (Overall) | 117 (31.8%) | 251 (68.2%) |
Employment Industries by Sex in Greeley Hill
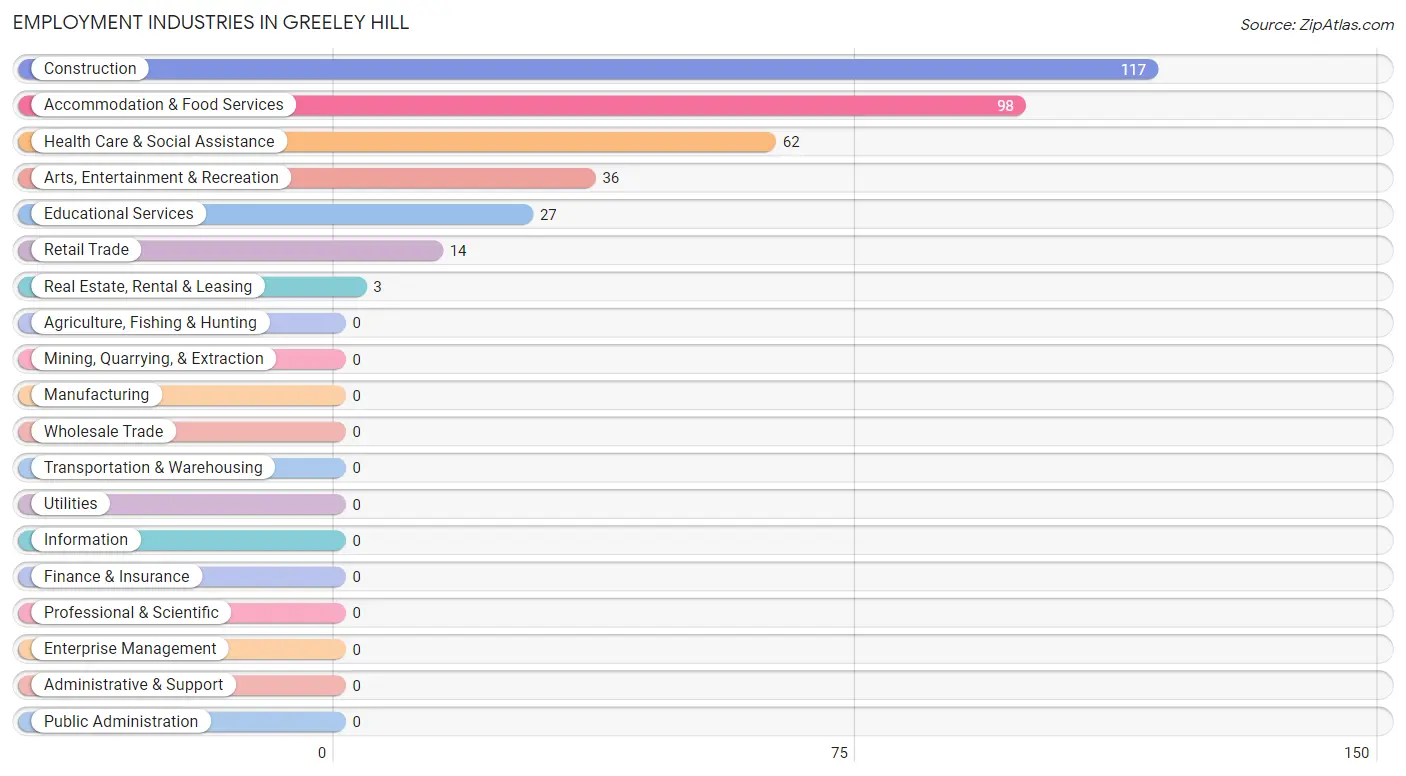
Employment Industries in Greeley Hill
The major employment industries in Greeley Hill include Construction (117 | 31.8%), Accommodation & Food Services (98 | 26.6%), Health Care & Social Assistance (62 | 16.9%), Arts, Entertainment & Recreation (36 | 9.8%), and Educational Services (27 | 7.3%).
Employment Industries by Sex in Greeley Hill
The Greeley Hill industries that see more men than women are Real Estate, Rental & Leasing (100.0%), Construction (85.5%), and Accommodation & Food Services (14.3%), whereas the industries that tend to have a higher number of women are Retail Trade (100.0%), Educational Services (100.0%), and Health Care & Social Assistance (100.0%).
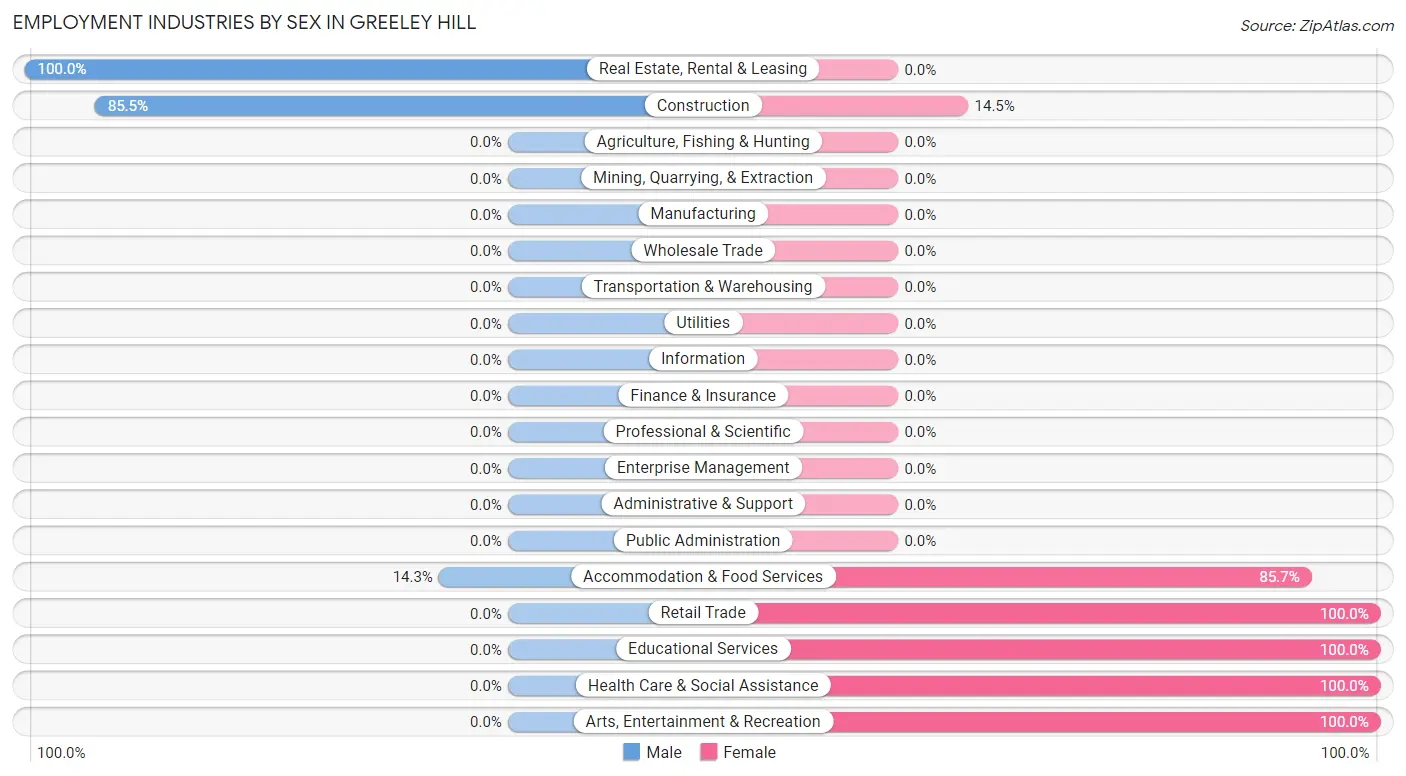
| Industry | Male | Female |
| Agriculture, Fishing & Hunting | 0 (0.0%) | 0 (0.0%) |
| Mining, Quarrying, & Extraction | 0 (0.0%) | 0 (0.0%) |
| Construction | 100 (85.5%) | 17 (14.5%) |
| Manufacturing | 0 (0.0%) | 0 (0.0%) |
| Wholesale Trade | 0 (0.0%) | 0 (0.0%) |
| Retail Trade | 0 (0.0%) | 14 (100.0%) |
| Transportation & Warehousing | 0 (0.0%) | 0 (0.0%) |
| Utilities | 0 (0.0%) | 0 (0.0%) |
| Information | 0 (0.0%) | 0 (0.0%) |
| Finance & Insurance | 0 (0.0%) | 0 (0.0%) |
| Real Estate, Rental & Leasing | 3 (100.0%) | 0 (0.0%) |
| Professional & Scientific | 0 (0.0%) | 0 (0.0%) |
| Enterprise Management | 0 (0.0%) | 0 (0.0%) |
| Administrative & Support | 0 (0.0%) | 0 (0.0%) |
| Educational Services | 0 (0.0%) | 27 (100.0%) |
| Health Care & Social Assistance | 0 (0.0%) | 62 (100.0%) |
| Arts, Entertainment & Recreation | 0 (0.0%) | 36 (100.0%) |
| Accommodation & Food Services | 14 (14.3%) | 84 (85.7%) |
| Public Administration | 0 (0.0%) | 0 (0.0%) |
| Total | 117 (31.8%) | 251 (68.2%) |
Education in Greeley Hill
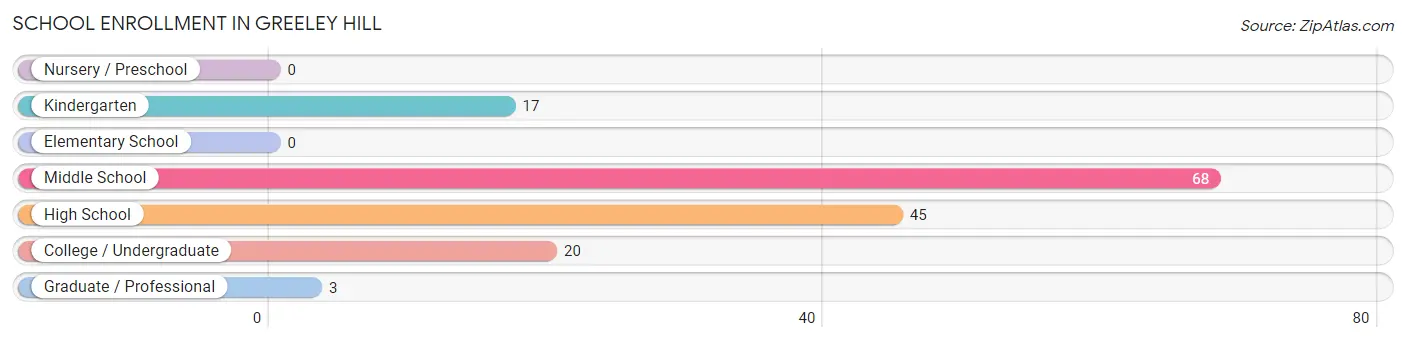
School Enrollment in Greeley Hill
The most common levels of schooling among the 153 students in Greeley Hill are middle school (68 | 44.4%), high school (45 | 29.4%), and college / undergraduate (20 | 13.1%).
| School Level | # Students | % Students |
| Nursery / Preschool | 0 | 0.0% |
| Kindergarten | 17 | 11.1% |
| Elementary School | 0 | 0.0% |
| Middle School | 68 | 44.4% |
| High School | 45 | 29.4% |
| College / Undergraduate | 20 | 13.1% |
| Graduate / Professional | 3 | 2.0% |
| Total | 153 | 100.0% |
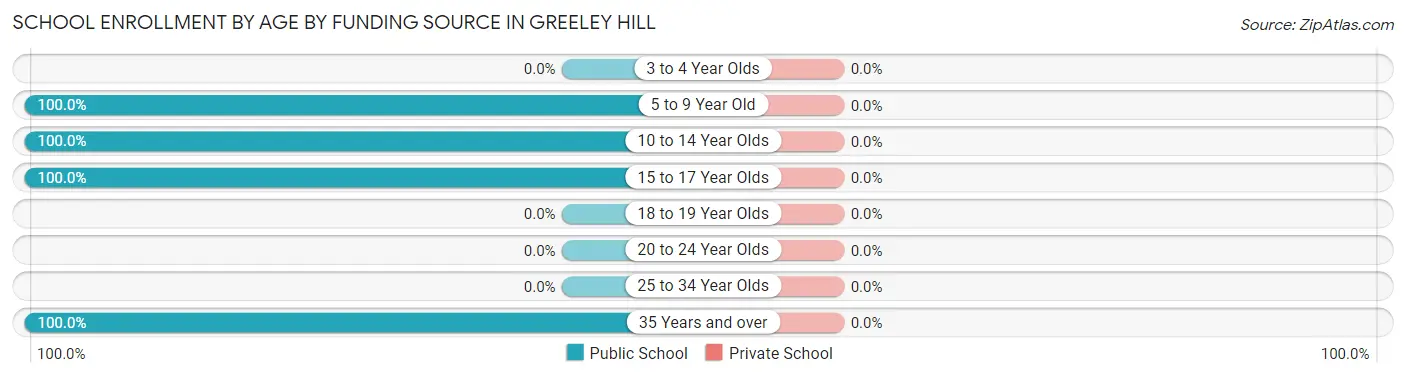
School Enrollment by Age by Funding Source in Greeley Hill
| Age Bracket | Public School | Private School |
| 3 to 4 Year Olds | 0 (0.0%) | 0 (0.0%) |
| 5 to 9 Year Old | 17 (100.0%) | 0 (0.0%) |
| 10 to 14 Year Olds | 68 (100.0%) | 0 (0.0%) |
| 15 to 17 Year Olds | 45 (100.0%) | 0 (0.0%) |
| 18 to 19 Year Olds | 0 (0.0%) | 0 (0.0%) |
| 20 to 24 Year Olds | 0 (0.0%) | 0 (0.0%) |
| 25 to 34 Year Olds | 0 (0.0%) | 0 (0.0%) |
| 35 Years and over | 23 (100.0%) | 0 (0.0%) |
| Total | 153 (100.0%) | 0 (0.0%) |
Educational Attainment by Field of Study in Greeley Hill
Science & technology (30 | 27.3%), liberal arts & history (21 | 19.1%), literature & languages (17 | 15.4%), physical & health sciences (14 | 12.7%), and bio, nature & agricultural (10 | 9.1%) are the most common fields of study among 110 individuals in Greeley Hill who have obtained a bachelor's degree or higher.
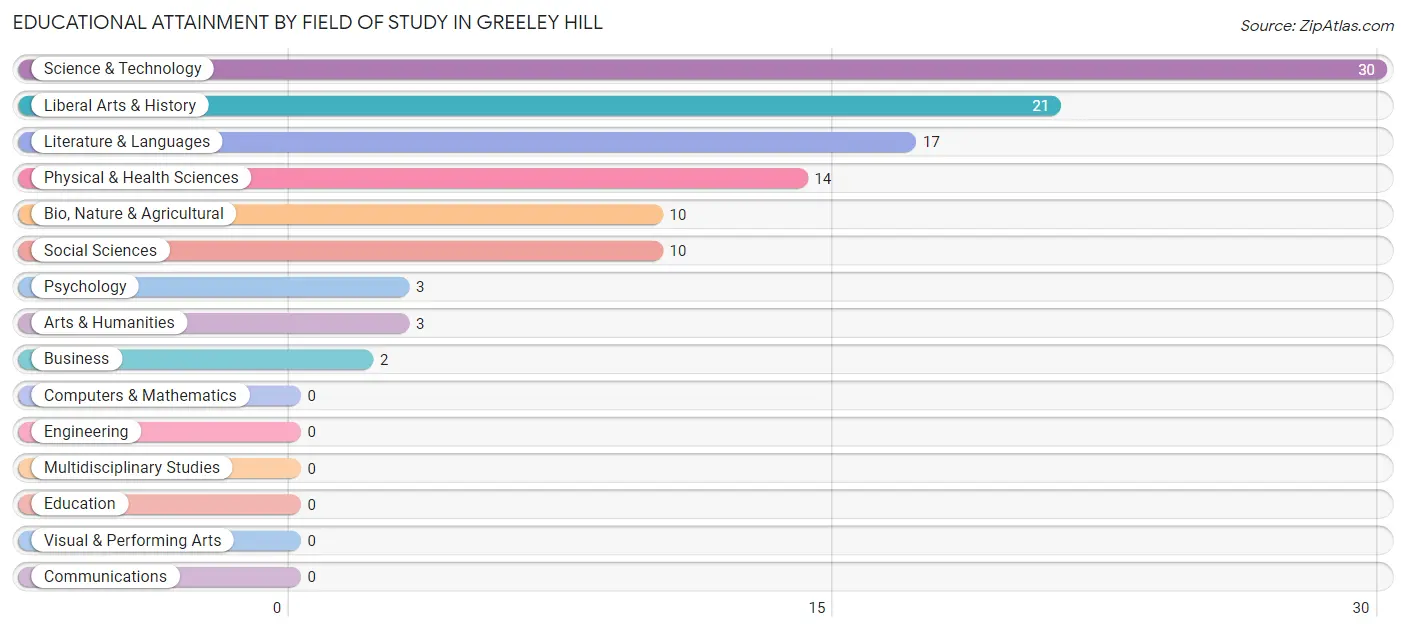
| Field of Study | # Graduates | % Graduates |
| Computers & Mathematics | 0 | 0.0% |
| Bio, Nature & Agricultural | 10 | 9.1% |
| Physical & Health Sciences | 14 | 12.7% |
| Psychology | 3 | 2.7% |
| Social Sciences | 10 | 9.1% |
| Engineering | 0 | 0.0% |
| Multidisciplinary Studies | 0 | 0.0% |
| Science & Technology | 30 | 27.3% |
| Business | 2 | 1.8% |
| Education | 0 | 0.0% |
| Literature & Languages | 17 | 15.4% |
| Liberal Arts & History | 21 | 19.1% |
| Visual & Performing Arts | 0 | 0.0% |
| Communications | 0 | 0.0% |
| Arts & Humanities | 3 | 2.7% |
| Total | 110 | 100.0% |
Transportation & Commute in Greeley Hill
Vehicle Availability by Sex in Greeley Hill
The most prevalent vehicle ownership categories in Greeley Hill are males with 2 vehicles (87, accounting for 74.4%) and females with 2 vehicles (151, making up 34.7%).
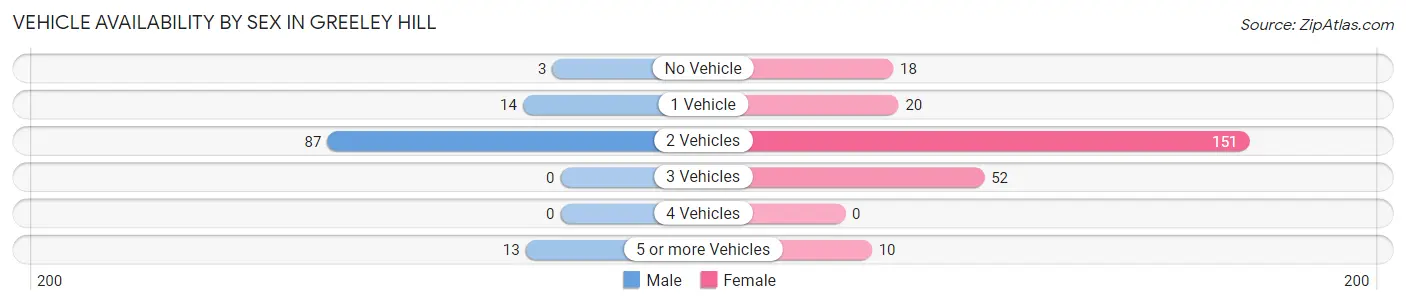
| Vehicles Available | Male | Female |
| No Vehicle | 3 (2.6%) | 18 (7.2%) |
| 1 Vehicle | 14 (12.0%) | 20 (8.0%) |
| 2 Vehicles | 87 (74.4%) | 151 (60.2%) |
| 3 Vehicles | 0 (0.0%) | 52 (20.7%) |
| 4 Vehicles | 0 (0.0%) | 0 (0.0%) |
| 5 or more Vehicles | 13 (11.1%) | 10 (4.0%) |
| Total | 117 (100.0%) | 251 (100.0%) |
Commute Time in Greeley Hill
The most frequently occuring commute durations in Greeley Hill are 15 to 19 minutes (97 commuters, 27.8%), 20 to 24 minutes (85 commuters, 24.4%), and 5 to 9 minutes (59 commuters, 16.9%).
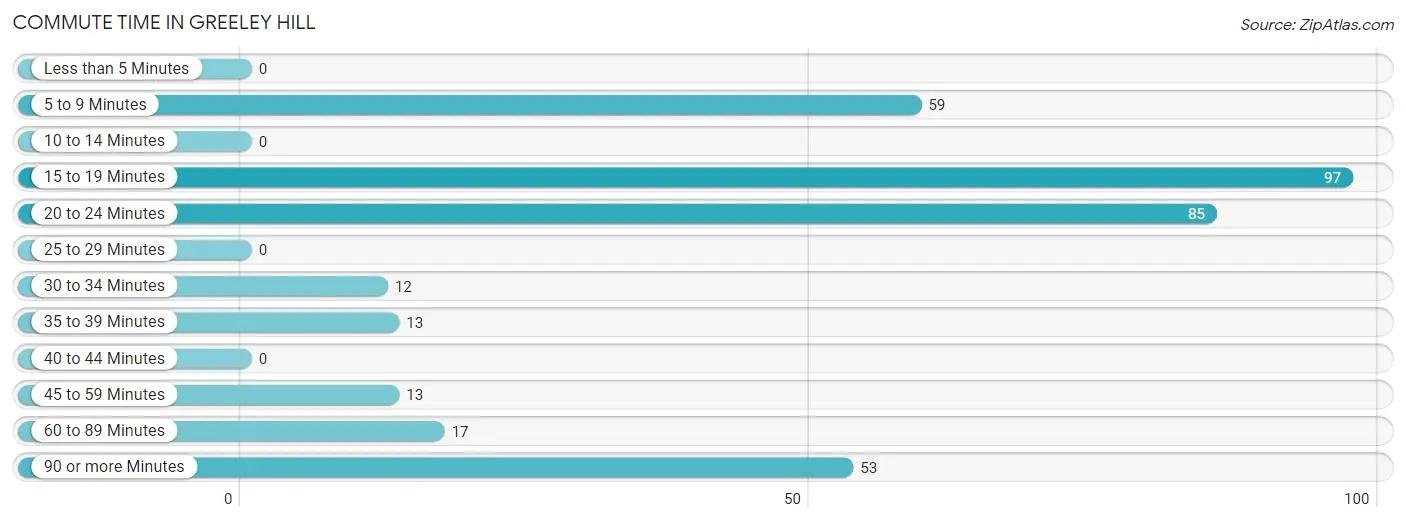
| Commute Time | # Commuters | % Commuters |
| Less than 5 Minutes | 0 | 0.0% |
| 5 to 9 Minutes | 59 | 16.9% |
| 10 to 14 Minutes | 0 | 0.0% |
| 15 to 19 Minutes | 97 | 27.8% |
| 20 to 24 Minutes | 85 | 24.4% |
| 25 to 29 Minutes | 0 | 0.0% |
| 30 to 34 Minutes | 12 | 3.4% |
| 35 to 39 Minutes | 13 | 3.7% |
| 40 to 44 Minutes | 0 | 0.0% |
| 45 to 59 Minutes | 13 | 3.7% |
| 60 to 89 Minutes | 17 | 4.9% |
| 90 or more Minutes | 53 | 15.2% |
Commute Time by Sex in Greeley Hill
The most common commute times in Greeley Hill are 15 to 19 minutes (87 commuters, 74.4%) for males and 20 to 24 minutes (84 commuters, 36.2%) for females.
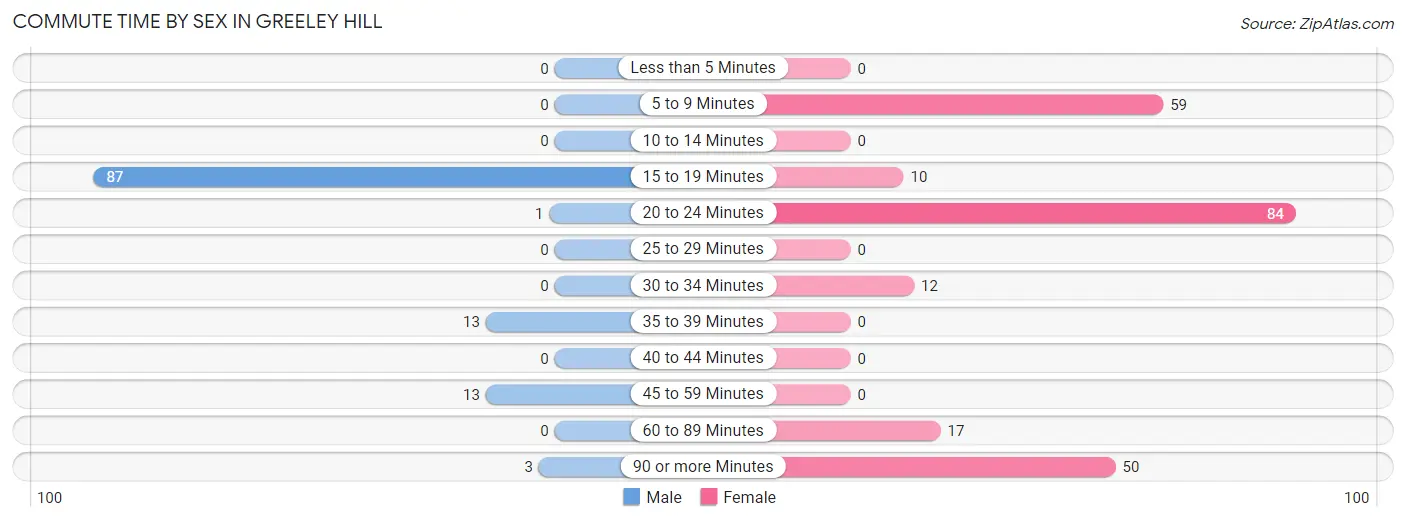
| Commute Time | Male | Female |
| Less than 5 Minutes | 0 (0.0%) | 0 (0.0%) |
| 5 to 9 Minutes | 0 (0.0%) | 59 (25.4%) |
| 10 to 14 Minutes | 0 (0.0%) | 0 (0.0%) |
| 15 to 19 Minutes | 87 (74.4%) | 10 (4.3%) |
| 20 to 24 Minutes | 1 (0.9%) | 84 (36.2%) |
| 25 to 29 Minutes | 0 (0.0%) | 0 (0.0%) |
| 30 to 34 Minutes | 0 (0.0%) | 12 (5.2%) |
| 35 to 39 Minutes | 13 (11.1%) | 0 (0.0%) |
| 40 to 44 Minutes | 0 (0.0%) | 0 (0.0%) |
| 45 to 59 Minutes | 13 (11.1%) | 0 (0.0%) |
| 60 to 89 Minutes | 0 (0.0%) | 17 (7.3%) |
| 90 or more Minutes | 3 (2.6%) | 50 (21.5%) |
Time of Departure to Work by Sex in Greeley Hill
The most frequent times of departure to work in Greeley Hill are 6:00 AM to 6:29 AM (87, 74.4%) for males and 4:00 PM to 11:59 PM (84, 36.2%) for females.
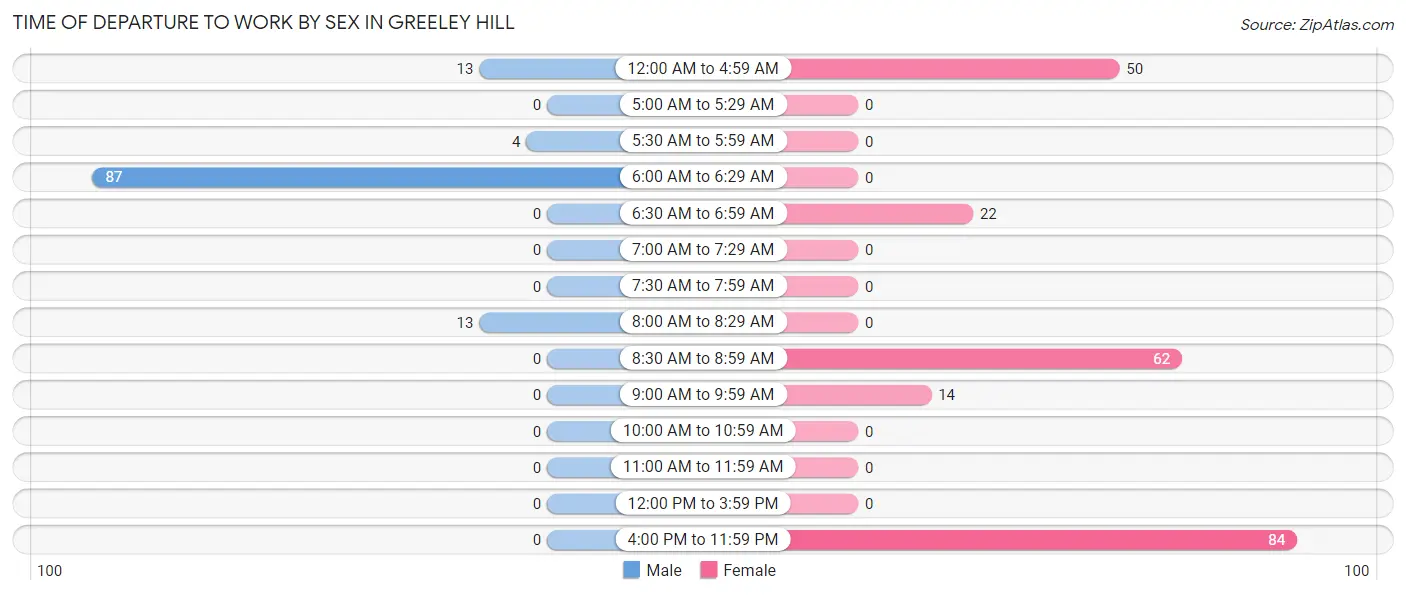
| Time of Departure | Male | Female |
| 12:00 AM to 4:59 AM | 13 (11.1%) | 50 (21.5%) |
| 5:00 AM to 5:29 AM | 0 (0.0%) | 0 (0.0%) |
| 5:30 AM to 5:59 AM | 4 (3.4%) | 0 (0.0%) |
| 6:00 AM to 6:29 AM | 87 (74.4%) | 0 (0.0%) |
| 6:30 AM to 6:59 AM | 0 (0.0%) | 22 (9.5%) |
| 7:00 AM to 7:29 AM | 0 (0.0%) | 0 (0.0%) |
| 7:30 AM to 7:59 AM | 0 (0.0%) | 0 (0.0%) |
| 8:00 AM to 8:29 AM | 13 (11.1%) | 0 (0.0%) |
| 8:30 AM to 8:59 AM | 0 (0.0%) | 62 (26.7%) |
| 9:00 AM to 9:59 AM | 0 (0.0%) | 14 (6.0%) |
| 10:00 AM to 10:59 AM | 0 (0.0%) | 0 (0.0%) |
| 11:00 AM to 11:59 AM | 0 (0.0%) | 0 (0.0%) |
| 12:00 PM to 3:59 PM | 0 (0.0%) | 0 (0.0%) |
| 4:00 PM to 11:59 PM | 0 (0.0%) | 84 (36.2%) |
| Total | 117 (100.0%) | 232 (100.0%) |
Housing Occupancy in Greeley Hill
Occupancy by Ownership in Greeley Hill
Of the total 487 dwellings in Greeley Hill, owner-occupied units account for 413 (84.8%), while renter-occupied units make up 74 (15.2%).
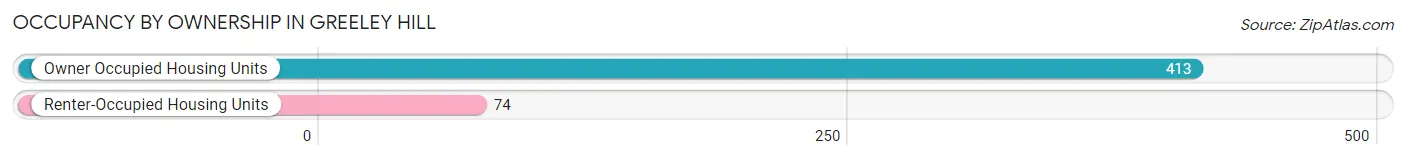
| Occupancy | # Housing Units | % Housing Units |
| Owner Occupied Housing Units | 413 | 84.8% |
| Renter-Occupied Housing Units | 74 | 15.2% |
| Total Occupied Housing Units | 487 | 100.0% |
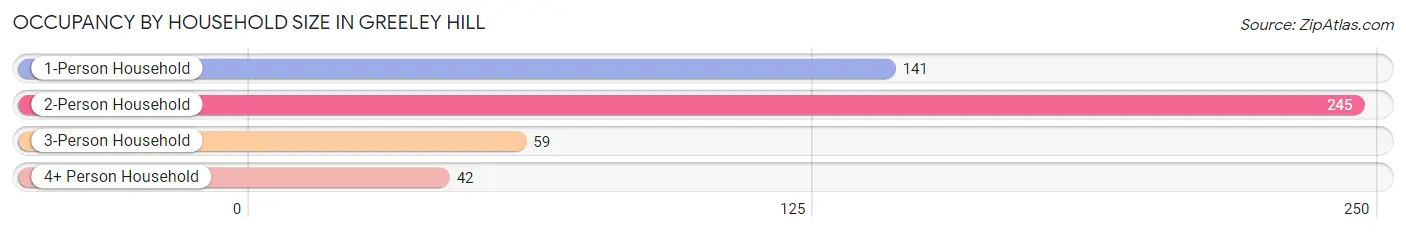
Occupancy by Household Size in Greeley Hill
| Household Size | # Housing Units | % Housing Units |
| 1-Person Household | 141 | 28.9% |
| 2-Person Household | 245 | 50.3% |
| 3-Person Household | 59 | 12.1% |
| 4+ Person Household | 42 | 8.6% |
| Total Housing Units | 487 | 100.0% |
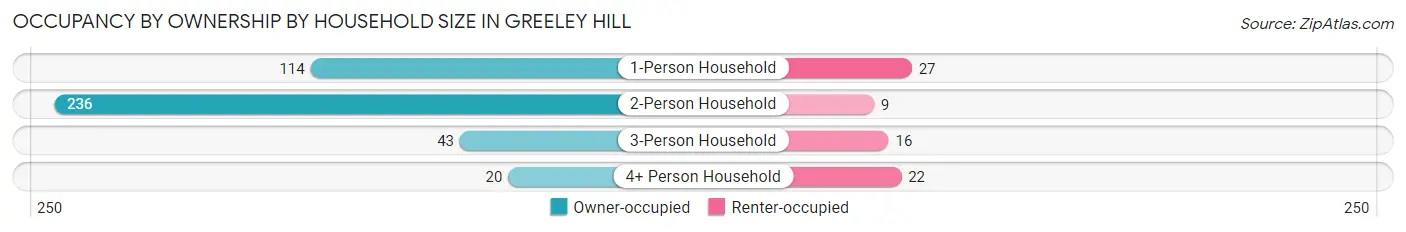
Occupancy by Ownership by Household Size in Greeley Hill
| Household Size | Owner-occupied | Renter-occupied |
| 1-Person Household | 114 (80.8%) | 27 (19.2%) |
| 2-Person Household | 236 (96.3%) | 9 (3.7%) |
| 3-Person Household | 43 (72.9%) | 16 (27.1%) |
| 4+ Person Household | 20 (47.6%) | 22 (52.4%) |
| Total Housing Units | 413 (84.8%) | 74 (15.2%) |
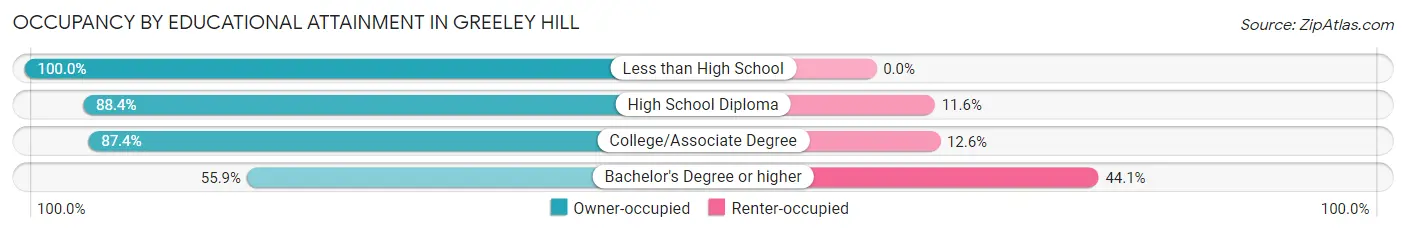
Occupancy by Educational Attainment in Greeley Hill
| Household Size | Owner-occupied | Renter-occupied |
| Less than High School | 39 (100.0%) | 0 (0.0%) |
| High School Diploma | 99 (88.4%) | 13 (11.6%) |
| College/Associate Degree | 242 (87.4%) | 35 (12.6%) |
| Bachelor's Degree or higher | 33 (55.9%) | 26 (44.1%) |
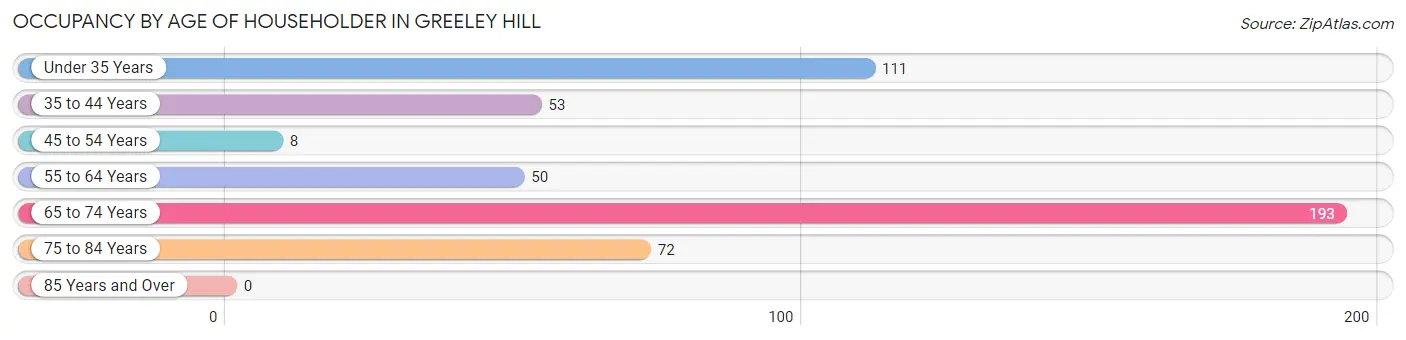
Occupancy by Age of Householder in Greeley Hill
| Age Bracket | # Households | % Households |
| Under 35 Years | 111 | 22.8% |
| 35 to 44 Years | 53 | 10.9% |
| 45 to 54 Years | 8 | 1.6% |
| 55 to 64 Years | 50 | 10.3% |
| 65 to 74 Years | 193 | 39.6% |
| 75 to 84 Years | 72 | 14.8% |
| 85 Years and Over | 0 | 0.0% |
| Total | 487 | 100.0% |
Housing Finances in Greeley Hill
Median Income by Occupancy in Greeley Hill
| Occupancy Type | # Households | Median Income |
| Owner-Occupied | 413 (84.8%) | $0 |
| Renter-Occupied | 74 (15.2%) | $0 |
| Average | 487 (100.0%) | $0 |
Occupancy by Householder Income Bracket in Greeley Hill
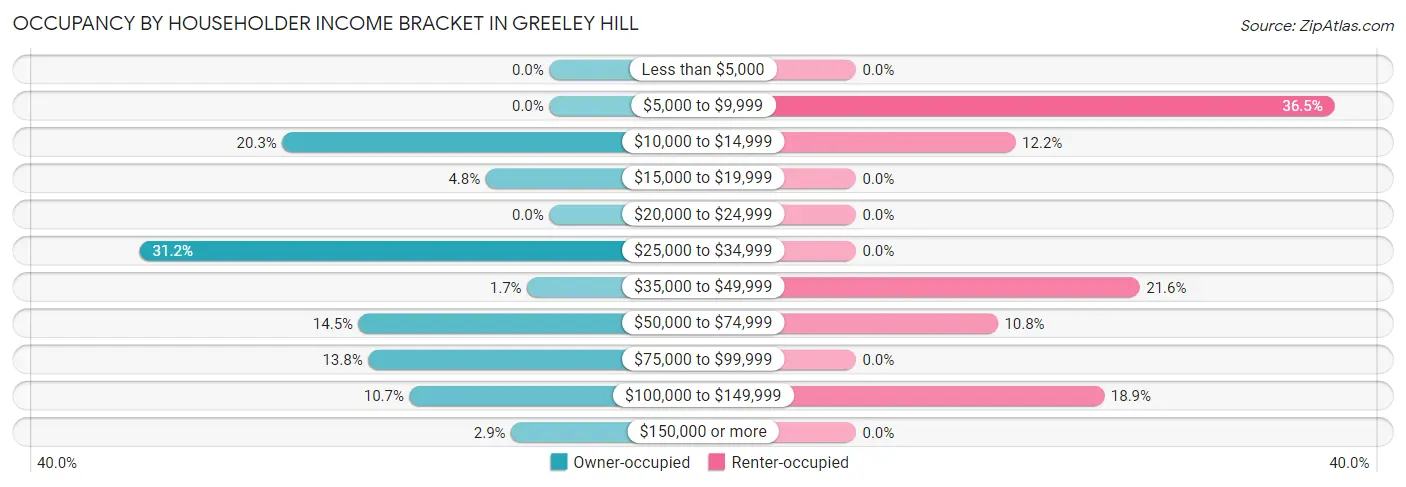
| Income Bracket | Owner-occupied | Renter-occupied |
| Less than $5,000 | 0 (0.0%) | 0 (0.0%) |
| $5,000 to $9,999 | 0 (0.0%) | 27 (36.5%) |
| $10,000 to $14,999 | 84 (20.3%) | 9 (12.2%) |
| $15,000 to $19,999 | 20 (4.8%) | 0 (0.0%) |
| $20,000 to $24,999 | 0 (0.0%) | 0 (0.0%) |
| $25,000 to $34,999 | 129 (31.2%) | 0 (0.0%) |
| $35,000 to $49,999 | 7 (1.7%) | 16 (21.6%) |
| $50,000 to $74,999 | 60 (14.5%) | 8 (10.8%) |
| $75,000 to $99,999 | 57 (13.8%) | 0 (0.0%) |
| $100,000 to $149,999 | 44 (10.6%) | 14 (18.9%) |
| $150,000 or more | 12 (2.9%) | 0 (0.0%) |
| Total | 413 (100.0%) | 74 (100.0%) |
Monthly Housing Cost Tiers in Greeley Hill
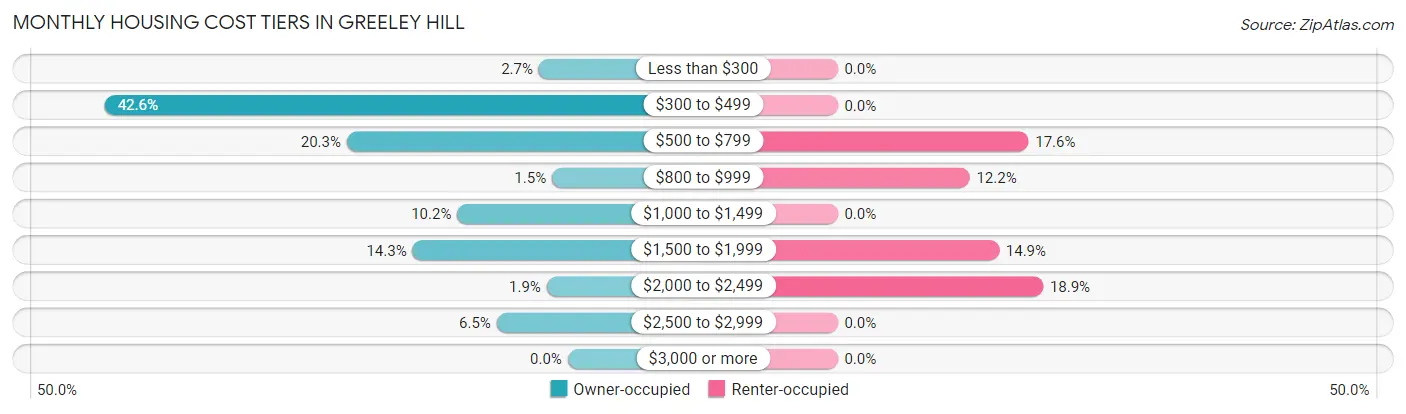
| Monthly Cost | Owner-occupied | Renter-occupied |
| Less than $300 | 11 (2.7%) | 0 (0.0%) |
| $300 to $499 | 176 (42.6%) | 0 (0.0%) |
| $500 to $799 | 84 (20.3%) | 13 (17.6%) |
| $800 to $999 | 6 (1.5%) | 9 (12.2%) |
| $1,000 to $1,499 | 42 (10.2%) | 0 (0.0%) |
| $1,500 to $1,999 | 59 (14.3%) | 11 (14.9%) |
| $2,000 to $2,499 | 8 (1.9%) | 14 (18.9%) |
| $2,500 to $2,999 | 27 (6.5%) | 0 (0.0%) |
| $3,000 or more | 0 (0.0%) | 0 (0.0%) |
| Total | 413 (100.0%) | 74 (100.0%) |
Physical Housing Characteristics in Greeley Hill
Housing Structures in Greeley Hill
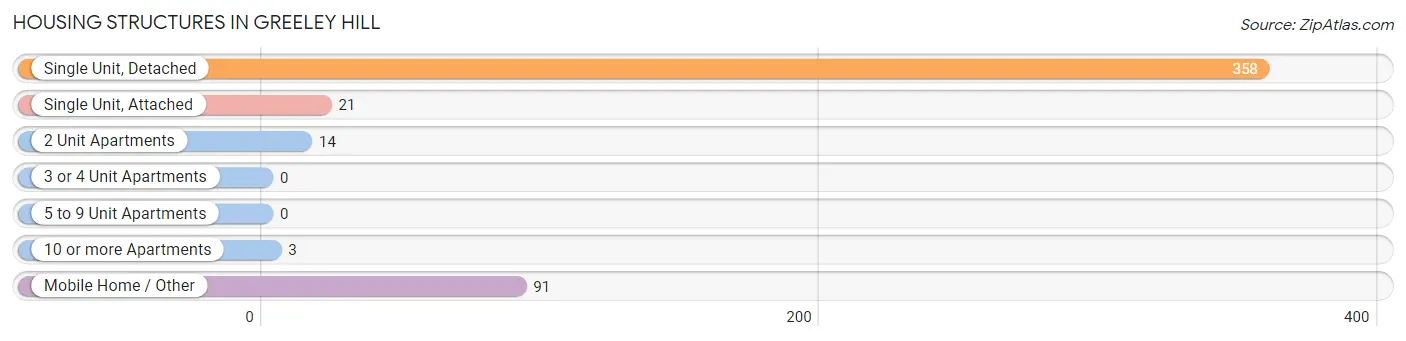
| Structure Type | # Housing Units | % Housing Units |
| Single Unit, Detached | 358 | 73.5% |
| Single Unit, Attached | 21 | 4.3% |
| 2 Unit Apartments | 14 | 2.9% |
| 3 or 4 Unit Apartments | 0 | 0.0% |
| 5 to 9 Unit Apartments | 0 | 0.0% |
| 10 or more Apartments | 3 | 0.6% |
| Mobile Home / Other | 91 | 18.7% |
| Total | 487 | 100.0% |
Housing Structures by Occupancy in Greeley Hill
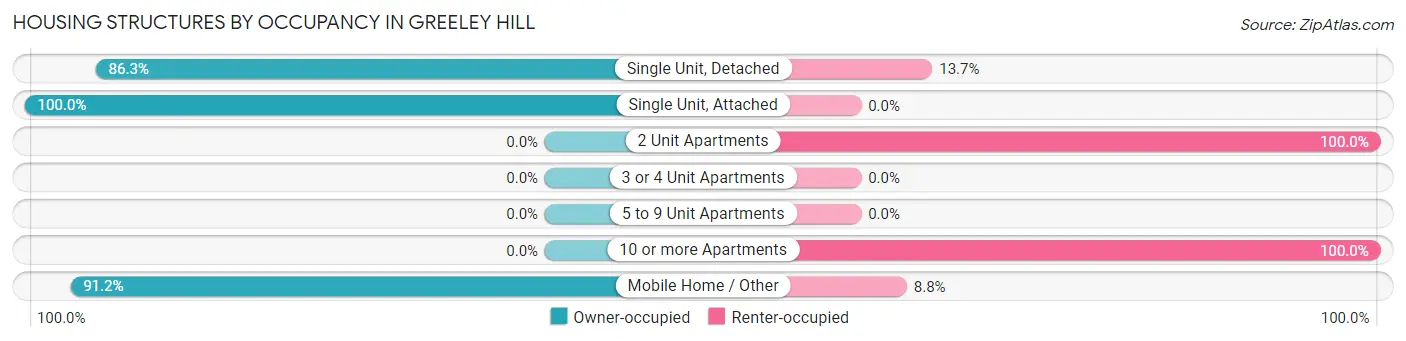
| Structure Type | Owner-occupied | Renter-occupied |
| Single Unit, Detached | 309 (86.3%) | 49 (13.7%) |
| Single Unit, Attached | 21 (100.0%) | 0 (0.0%) |
| 2 Unit Apartments | 0 (0.0%) | 14 (100.0%) |
| 3 or 4 Unit Apartments | 0 (0.0%) | 0 (0.0%) |
| 5 to 9 Unit Apartments | 0 (0.0%) | 0 (0.0%) |
| 10 or more Apartments | 0 (0.0%) | 3 (100.0%) |
| Mobile Home / Other | 83 (91.2%) | 8 (8.8%) |
| Total | 413 (84.8%) | 74 (15.2%) |
Housing Structures by Number of Rooms in Greeley Hill
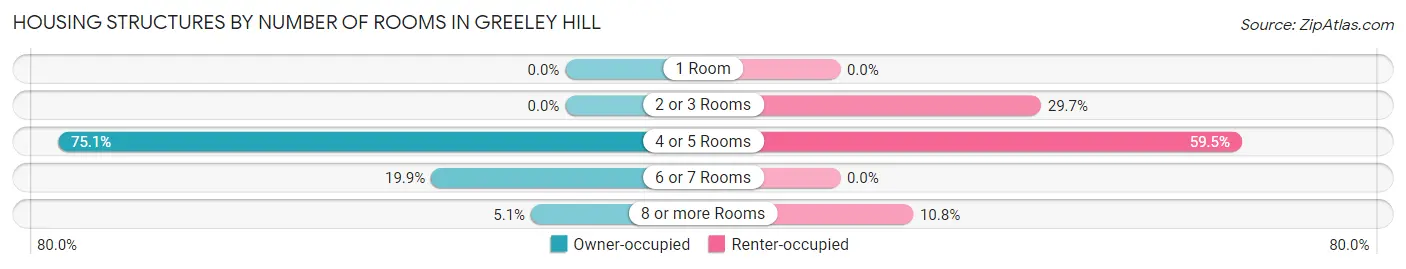
| Number of Rooms | Owner-occupied | Renter-occupied |
| 1 Room | 0 (0.0%) | 0 (0.0%) |
| 2 or 3 Rooms | 0 (0.0%) | 22 (29.7%) |
| 4 or 5 Rooms | 310 (75.1%) | 44 (59.5%) |
| 6 or 7 Rooms | 82 (19.9%) | 0 (0.0%) |
| 8 or more Rooms | 21 (5.1%) | 8 (10.8%) |
| Total | 413 (100.0%) | 74 (100.0%) |
Housing Structure by Heating Type in Greeley Hill
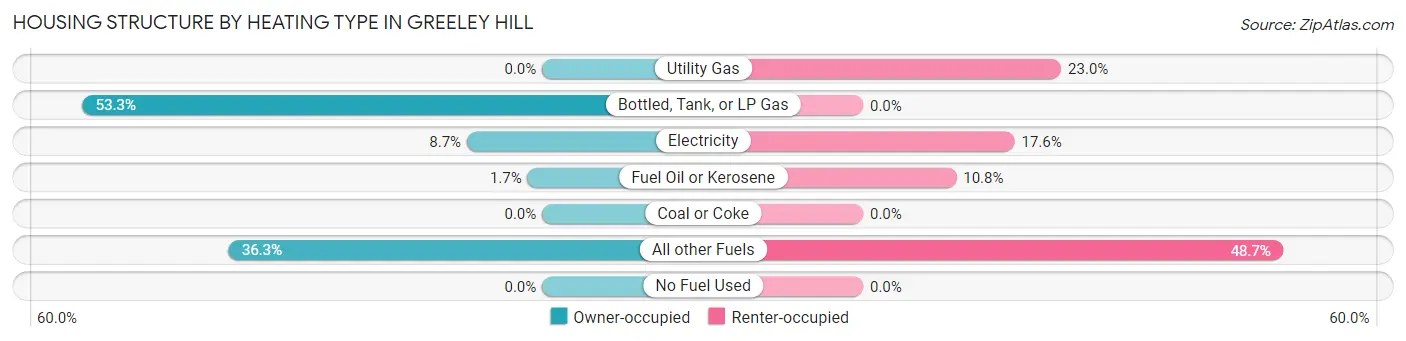
| Heating Type | Owner-occupied | Renter-occupied |
| Utility Gas | 0 (0.0%) | 17 (23.0%) |
| Bottled, Tank, or LP Gas | 220 (53.3%) | 0 (0.0%) |
| Electricity | 36 (8.7%) | 13 (17.6%) |
| Fuel Oil or Kerosene | 7 (1.7%) | 8 (10.8%) |
| Coal or Coke | 0 (0.0%) | 0 (0.0%) |
| All other Fuels | 150 (36.3%) | 36 (48.6%) |
| No Fuel Used | 0 (0.0%) | 0 (0.0%) |
| Total | 413 (100.0%) | 74 (100.0%) |
Household Vehicle Usage in Greeley Hill
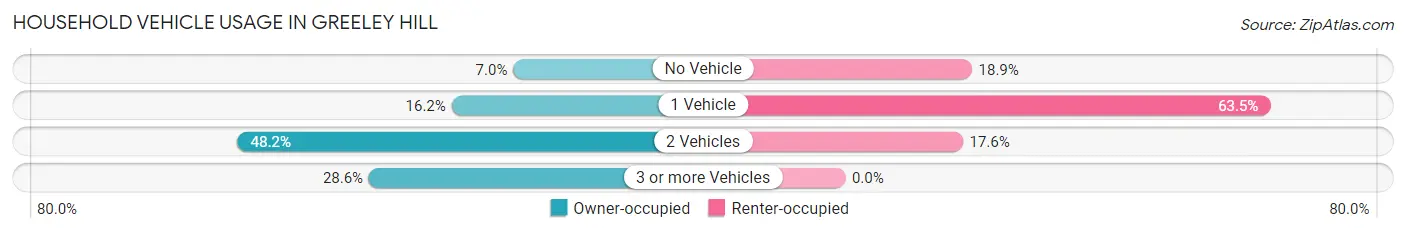
| Vehicles per Household | Owner-occupied | Renter-occupied |
| No Vehicle | 29 (7.0%) | 14 (18.9%) |
| 1 Vehicle | 67 (16.2%) | 47 (63.5%) |
| 2 Vehicles | 199 (48.2%) | 13 (17.6%) |
| 3 or more Vehicles | 118 (28.6%) | 0 (0.0%) |
| Total | 413 (100.0%) | 74 (100.0%) |
Real Estate & Mortgages in Greeley Hill
Real Estate and Mortgage Overview in Greeley Hill
| Characteristic | Without Mortgage | With Mortgage |
| Housing Units | 241 | 172 |
| Median Property Value | $188,500 | $330,400 |
| Median Household Income | - | - |
| Monthly Housing Costs | $437 | $0 |
| Real Estate Taxes | $1,354 | $0 |
Property Value by Mortgage Status in Greeley Hill
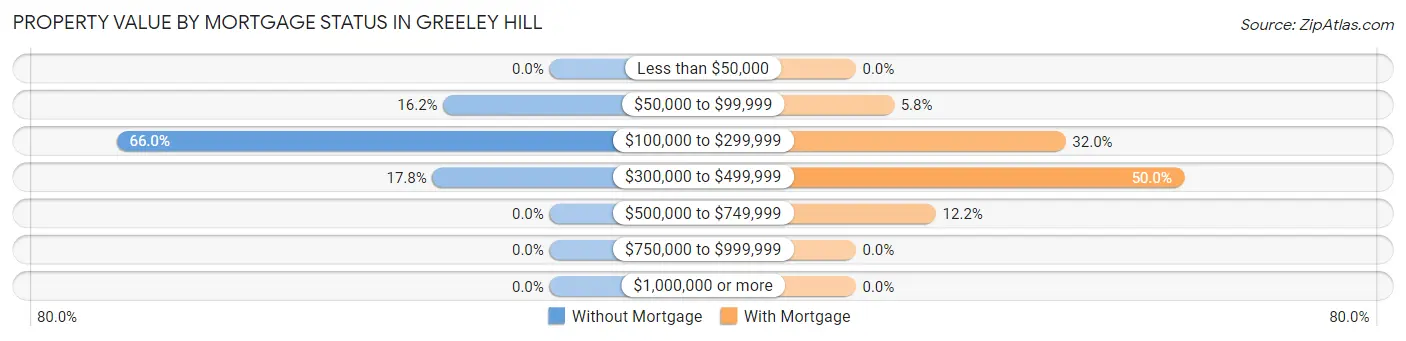
| Property Value | Without Mortgage | With Mortgage |
| Less than $50,000 | 0 (0.0%) | 0 (0.0%) |
| $50,000 to $99,999 | 39 (16.2%) | 10 (5.8%) |
| $100,000 to $299,999 | 159 (66.0%) | 55 (32.0%) |
| $300,000 to $499,999 | 43 (17.8%) | 86 (50.0%) |
| $500,000 to $749,999 | 0 (0.0%) | 21 (12.2%) |
| $750,000 to $999,999 | 0 (0.0%) | 0 (0.0%) |
| $1,000,000 or more | 0 (0.0%) | 0 (0.0%) |
| Total | 241 (100.0%) | 172 (100.0%) |
Household Income by Mortgage Status in Greeley Hill
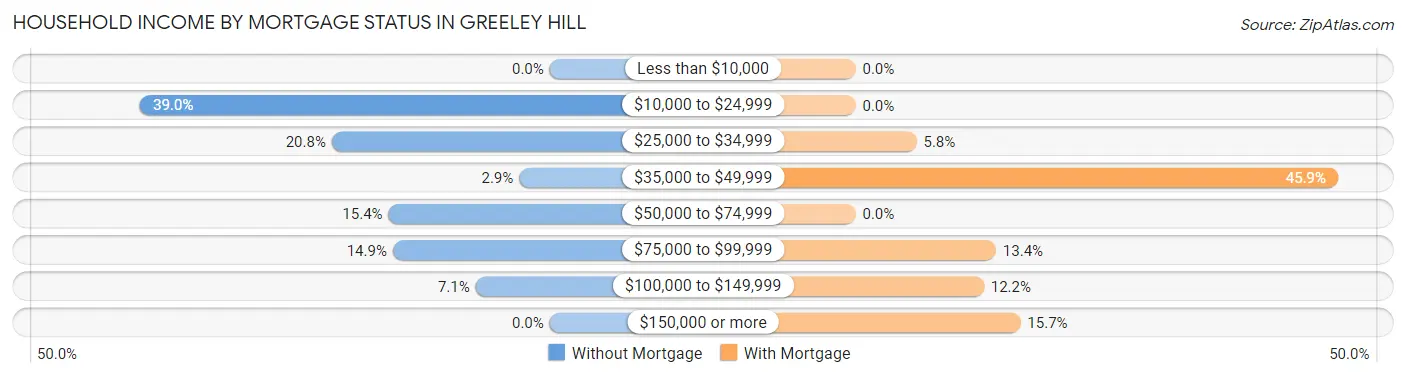
| Household Income | Without Mortgage | With Mortgage |
| Less than $10,000 | 0 (0.0%) | 0 (0.0%) |
| $10,000 to $24,999 | 94 (39.0%) | 0 (0.0%) |
| $25,000 to $34,999 | 50 (20.7%) | 10 (5.8%) |
| $35,000 to $49,999 | 7 (2.9%) | 79 (45.9%) |
| $50,000 to $74,999 | 37 (15.3%) | 0 (0.0%) |
| $75,000 to $99,999 | 36 (14.9%) | 23 (13.4%) |
| $100,000 to $149,999 | 17 (7.0%) | 21 (12.2%) |
| $150,000 or more | 0 (0.0%) | 27 (15.7%) |
| Total | 241 (100.0%) | 172 (100.0%) |
Property Value to Household Income Ratio in Greeley Hill
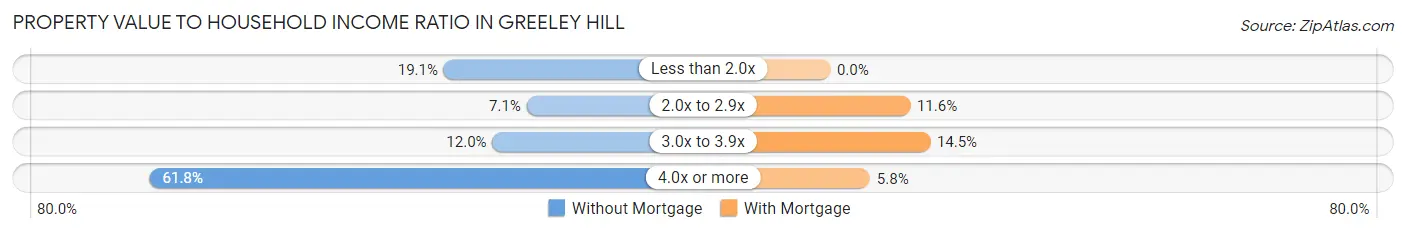
| Value-to-Income Ratio | Without Mortgage | With Mortgage |
| Less than 2.0x | 46 (19.1%) | 0 (0.0%) |
| 2.0x to 2.9x | 17 (7.0%) | 20 (11.6%) |
| 3.0x to 3.9x | 29 (12.0%) | 25 (14.5%) |
| 4.0x or more | 149 (61.8%) | 10 (5.8%) |
| Total | 241 (100.0%) | 172 (100.0%) |
Real Estate Taxes by Mortgage Status in Greeley Hill
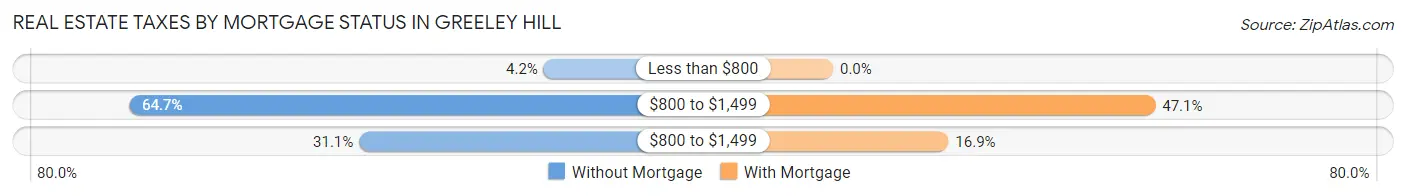
| Property Taxes | Without Mortgage | With Mortgage |
| Less than $800 | 10 (4.2%) | 0 (0.0%) |
| $800 to $1,499 | 156 (64.7%) | 81 (47.1%) |
| $800 to $1,499 | 75 (31.1%) | 29 (16.9%) |
| Total | 241 (100.0%) | 172 (100.0%) |
Health & Disability in Greeley Hill
Health Insurance Coverage by Age in Greeley Hill
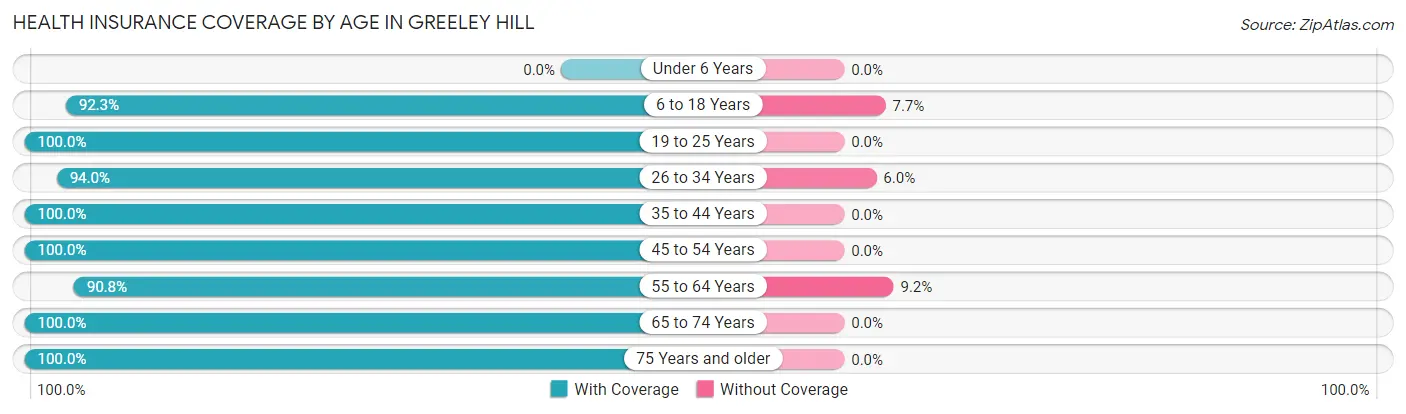
| Age Bracket | With Coverage | Without Coverage |
| Under 6 Years | 0 (0.0%) | 0 (0.0%) |
| 6 to 18 Years | 120 (92.3%) | 10 (7.7%) |
| 19 to 25 Years | 91 (100.0%) | 0 (0.0%) |
| 26 to 34 Years | 157 (94.0%) | 10 (6.0%) |
| 35 to 44 Years | 66 (100.0%) | 0 (0.0%) |
| 45 to 54 Years | 8 (100.0%) | 0 (0.0%) |
| 55 to 64 Years | 89 (90.8%) | 9 (9.2%) |
| 65 to 74 Years | 273 (100.0%) | 0 (0.0%) |
| 75 Years and older | 127 (100.0%) | 0 (0.0%) |
| Total | 931 (97.0%) | 29 (3.0%) |
Health Insurance Coverage by Citizenship Status in Greeley Hill
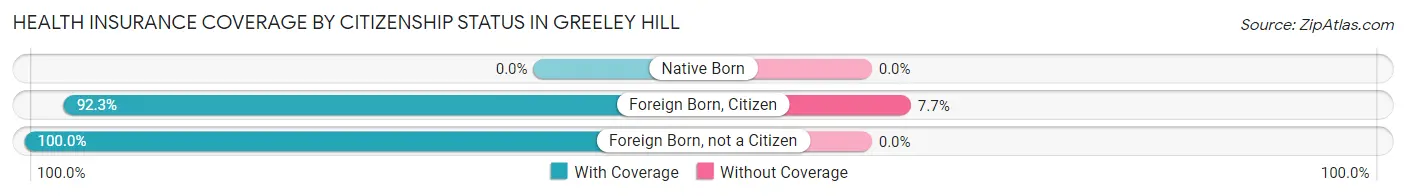
| Citizenship Status | With Coverage | Without Coverage |
| Native Born | 0 (0.0%) | 0 (0.0%) |
| Foreign Born, Citizen | 120 (92.3%) | 10 (7.7%) |
| Foreign Born, not a Citizen | 91 (100.0%) | 0 (0.0%) |
Health Insurance Coverage by Household Income in Greeley Hill
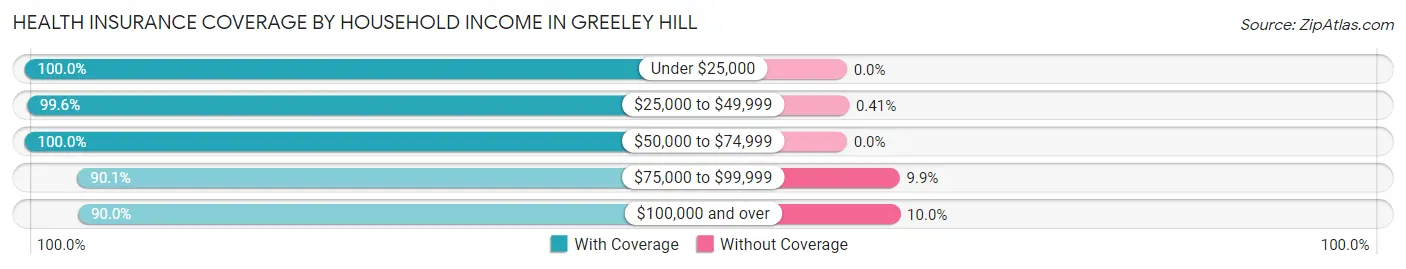
| Household Income | With Coverage | Without Coverage |
| Under $25,000 | 238 (100.0%) | 0 (0.0%) |
| $25,000 to $49,999 | 241 (99.6%) | 1 (0.4%) |
| $50,000 to $74,999 | 199 (100.0%) | 0 (0.0%) |
| $75,000 to $99,999 | 82 (90.1%) | 9 (9.9%) |
| $100,000 and over | 171 (90.0%) | 19 (10.0%) |
Public vs Private Health Insurance Coverage by Age in Greeley Hill
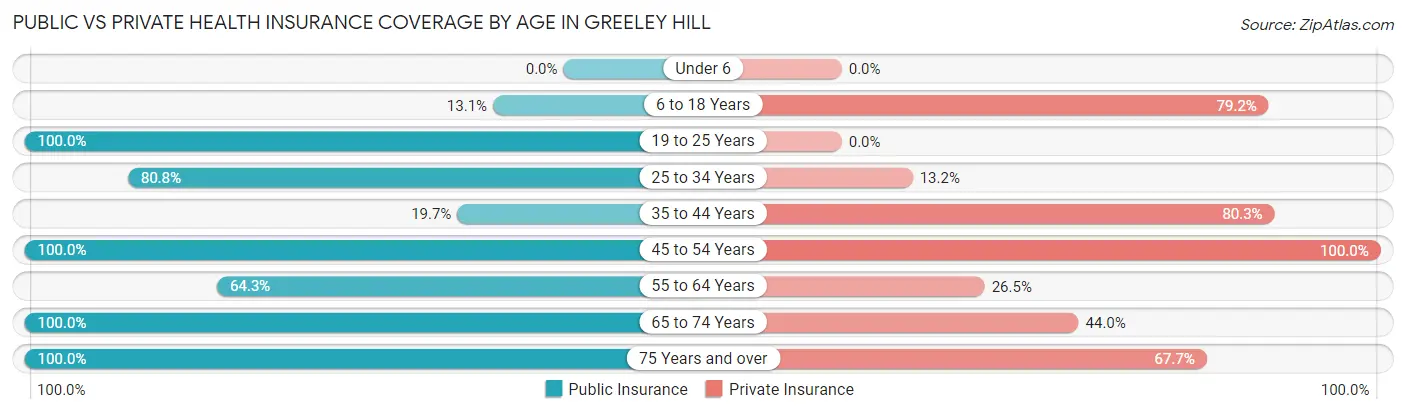
| Age Bracket | Public Insurance | Private Insurance |
| Under 6 | 0 (0.0%) | 0 (0.0%) |
| 6 to 18 Years | 17 (13.1%) | 103 (79.2%) |
| 19 to 25 Years | 91 (100.0%) | 0 (0.0%) |
| 25 to 34 Years | 135 (80.8%) | 22 (13.2%) |
| 35 to 44 Years | 13 (19.7%) | 53 (80.3%) |
| 45 to 54 Years | 8 (100.0%) | 8 (100.0%) |
| 55 to 64 Years | 63 (64.3%) | 26 (26.5%) |
| 65 to 74 Years | 273 (100.0%) | 120 (44.0%) |
| 75 Years and over | 127 (100.0%) | 86 (67.7%) |
| Total | 727 (75.7%) | 418 (43.5%) |
Disability Status by Sex by Age in Greeley Hill
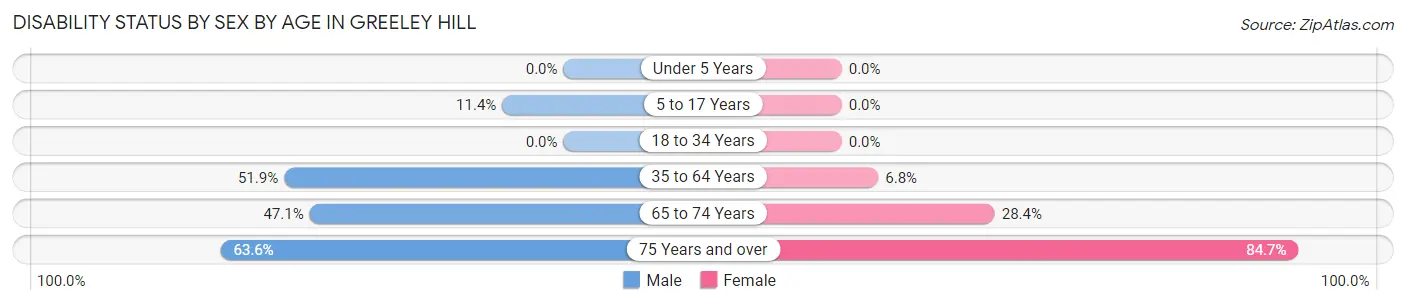
| Age Bracket | Male | Female |
| Under 5 Years | 0 (0.0%) | 0 (0.0%) |
| 5 to 17 Years | 10 (11.4%) | 0 (0.0%) |
| 18 to 34 Years | 0 (0.0%) | 0 (0.0%) |
| 35 to 64 Years | 28 (51.8%) | 8 (6.8%) |
| 65 to 74 Years | 49 (47.1%) | 48 (28.4%) |
| 75 Years and over | 35 (63.6%) | 61 (84.7%) |
Disability Class by Sex by Age in Greeley Hill
Disability Class: Hearing Difficulty
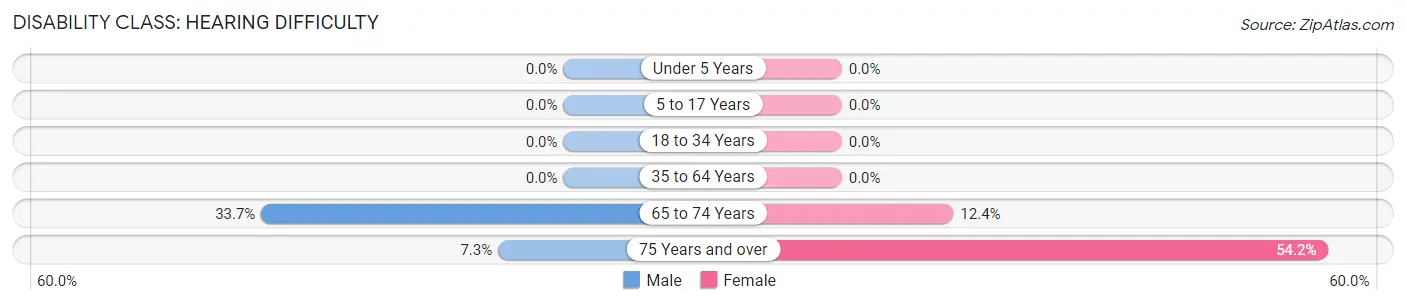
| Age Bracket | Male | Female |
| Under 5 Years | 0 (0.0%) | 0 (0.0%) |
| 5 to 17 Years | 0 (0.0%) | 0 (0.0%) |
| 18 to 34 Years | 0 (0.0%) | 0 (0.0%) |
| 35 to 64 Years | 0 (0.0%) | 0 (0.0%) |
| 65 to 74 Years | 35 (33.7%) | 21 (12.4%) |
| 75 Years and over | 4 (7.3%) | 39 (54.2%) |
Disability Class: Vision Difficulty
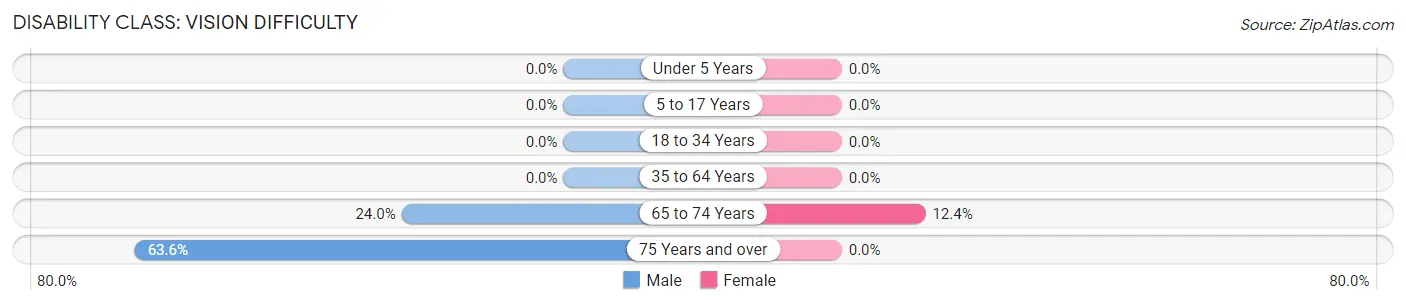
| Age Bracket | Male | Female |
| Under 5 Years | 0 (0.0%) | 0 (0.0%) |
| 5 to 17 Years | 0 (0.0%) | 0 (0.0%) |
| 18 to 34 Years | 0 (0.0%) | 0 (0.0%) |
| 35 to 64 Years | 0 (0.0%) | 0 (0.0%) |
| 65 to 74 Years | 25 (24.0%) | 21 (12.4%) |
| 75 Years and over | 35 (63.6%) | 0 (0.0%) |
Disability Class: Cognitive Difficulty
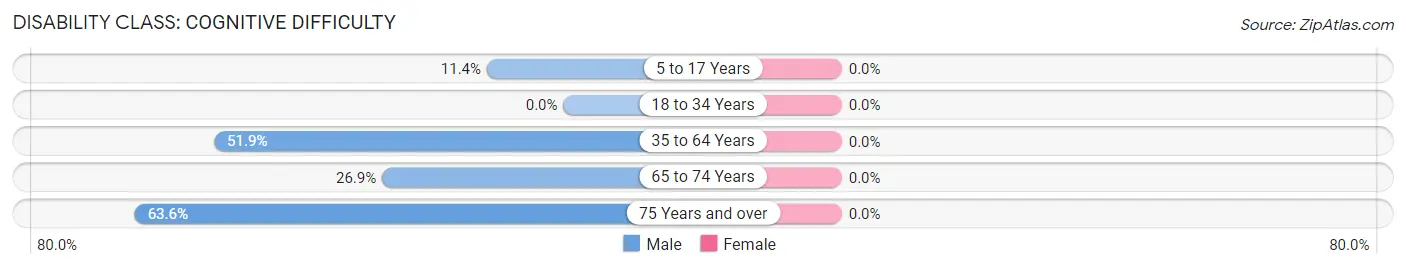
| Age Bracket | Male | Female |
| 5 to 17 Years | 10 (11.4%) | 0 (0.0%) |
| 18 to 34 Years | 0 (0.0%) | 0 (0.0%) |
| 35 to 64 Years | 28 (51.8%) | 0 (0.0%) |
| 65 to 74 Years | 28 (26.9%) | 0 (0.0%) |
| 75 Years and over | 35 (63.6%) | 0 (0.0%) |
Disability Class: Ambulatory Difficulty
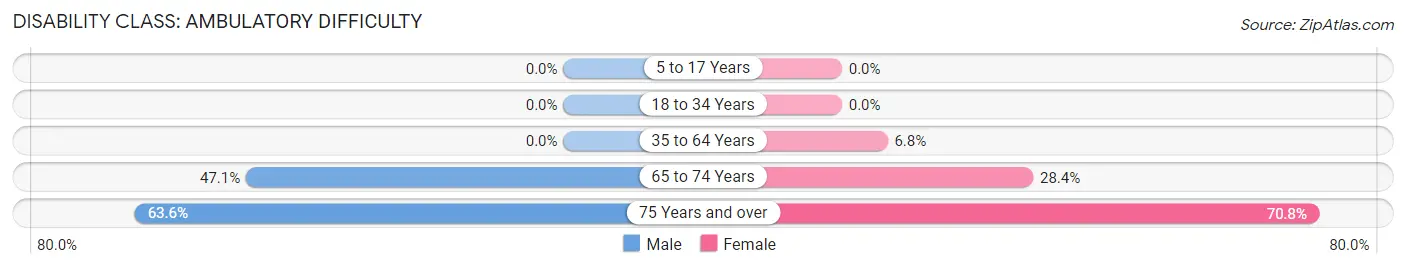
| Age Bracket | Male | Female |
| 5 to 17 Years | 0 (0.0%) | 0 (0.0%) |
| 18 to 34 Years | 0 (0.0%) | 0 (0.0%) |
| 35 to 64 Years | 0 (0.0%) | 8 (6.8%) |
| 65 to 74 Years | 49 (47.1%) | 48 (28.4%) |
| 75 Years and over | 35 (63.6%) | 51 (70.8%) |
Disability Class: Self-Care Difficulty
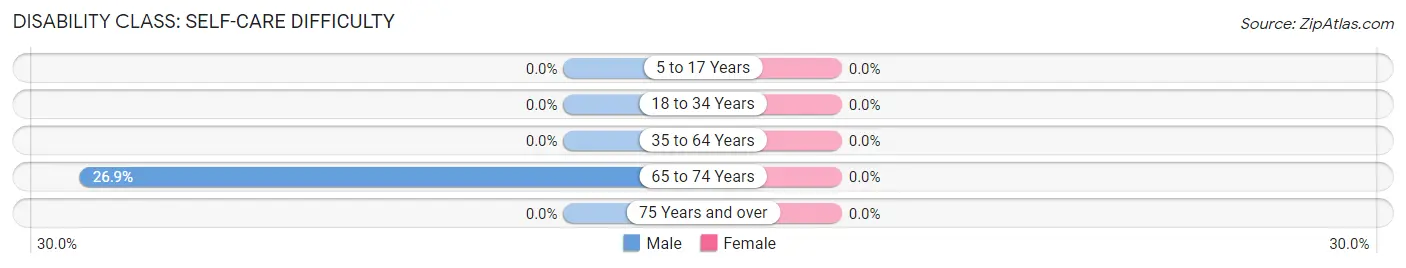
| Age Bracket | Male | Female |
| 5 to 17 Years | 0 (0.0%) | 0 (0.0%) |
| 18 to 34 Years | 0 (0.0%) | 0 (0.0%) |
| 35 to 64 Years | 0 (0.0%) | 0 (0.0%) |
| 65 to 74 Years | 28 (26.9%) | 0 (0.0%) |
| 75 Years and over | 0 (0.0%) | 0 (0.0%) |
Technology Access in Greeley Hill
Computing Device Access in Greeley Hill
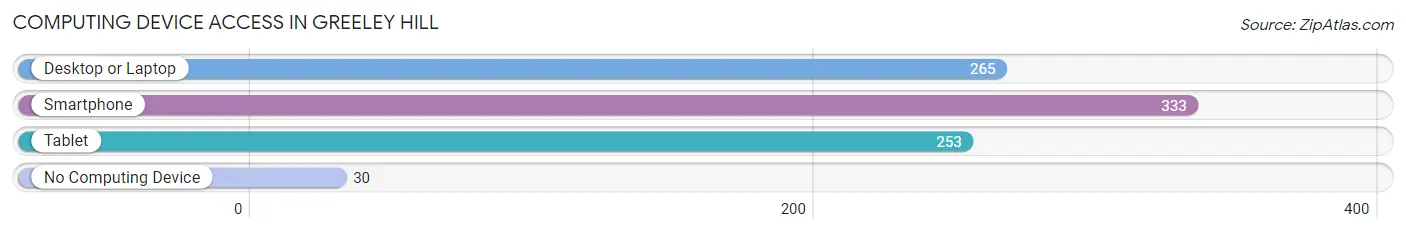
| Device Type | # Households | % Households |
| Desktop or Laptop | 265 | 54.4% |
| Smartphone | 333 | 68.4% |
| Tablet | 253 | 51.9% |
| No Computing Device | 30 | 6.2% |
| Total | 487 | 100.0% |
Internet Access in Greeley Hill
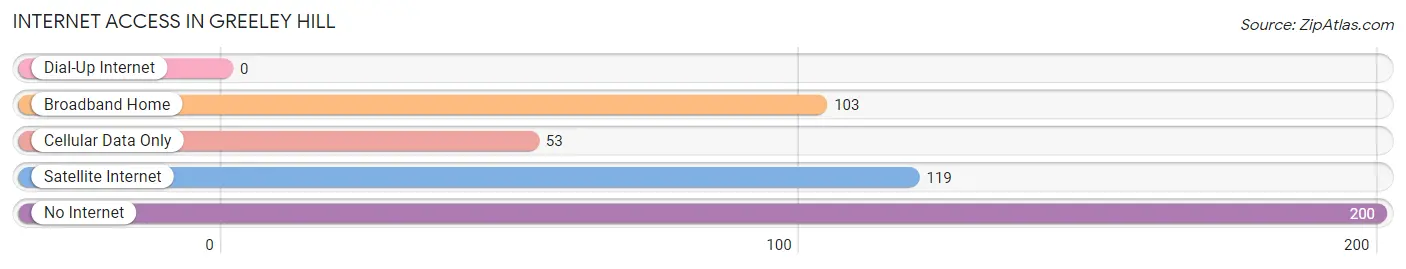
| Internet Type | # Households | % Households |
| Dial-Up Internet | 0 | 0.0% |
| Broadband Home | 103 | 21.1% |
| Cellular Data Only | 53 | 10.9% |
| Satellite Internet | 119 | 24.4% |
| No Internet | 200 | 41.1% |
| Total | 487 | 100.0% |
Greeley Hill Summary
Greeley Hill is an unincorporated community located in Mariposa County, California. It is situated in the Sierra Nevada foothills, approximately 25 miles east of the city of Mariposa. The population of Greeley Hill was estimated to be around 1,000 in 2020.
History
Greeley Hill was founded in 1854 by William Greeley, a miner who had come to California during the Gold Rush. He named the town after his hometown of Greeley, Maine. The town was initially a mining camp, but it soon became a center for logging and ranching. In the late 19th century, the town was home to a number of businesses, including a hotel, a general store, a blacksmith shop, and a saloon.
In the early 20th century, the town began to decline as the mining and logging industries moved away. By the 1950s, the population had dwindled to just a few hundred people. In the 1960s, the town was revitalized by the construction of a new highway, which connected it to the nearby cities of Mariposa and Merced.
Geography
Greeley Hill is located in the Sierra Nevada foothills, at an elevation of 2,400 feet. The town is situated on a hillside, surrounded by rolling hills and oak woodlands. The nearby Merced River provides a source of water for the town.
The climate in Greeley Hill is mild and temperate, with hot summers and cool winters. The average annual temperature is around 60°F, and the average annual precipitation is around 20 inches.
Economy
Greeley Hill is primarily a rural community, and the economy is based on agriculture and tourism. The town is home to a number of small businesses, including a general store, a cafe, and a gas station. The nearby Merced River provides a source of recreation for visitors, and the town is a popular destination for camping, fishing, and hiking.
Demographics
Greeley Hill has a population of around 1,000 people. The racial makeup of the town is predominantly white (90%), with small percentages of Hispanic (5%) and African American (2%) residents. The median household income is around $50,000, and the median home value is around $200,000.
Conclusion
Greeley Hill is a small, rural community located in the Sierra Nevada foothills of California. It was founded in 1854 by William Greeley, and it has a population of around 1,000 people. The economy is based on agriculture and tourism, and the town is a popular destination for camping, fishing, and hiking.
Common Questions
What is Per Capita Income in Greeley Hill?
Per Capita income in Greeley Hill is $22,184.
What is the Median Family Income in Greeley Hill?
Median Family Income in Greeley Hill is $66,346.
What is Inequality or Gini Index in Greeley Hill?
Inequality or Gini Index in Greeley Hill is 0.42.
What is the Total Population of Greeley Hill?
Total Population of Greeley Hill is 960.
What is the Total Male Population of Greeley Hill?
Total Male Population of Greeley Hill is 440.
What is the Total Female Population of Greeley Hill?
Total Female Population of Greeley Hill is 520.
What is the Ratio of Males per 100 Females in Greeley Hill?
There are 84.62 Males per 100 Females in Greeley Hill.
What is the Ratio of Females per 100 Males in Greeley Hill?
There are 118.18 Females per 100 Males in Greeley Hill.
What is the Median Population Age in Greeley Hill?
Median Population Age in Greeley Hill is 58.5 Years.
What is the Average Family Size in Greeley Hill
Average Family Size in Greeley Hill is 2.5 People.
What is the Average Household Size in Greeley Hill
Average Household Size in Greeley Hill is 2.0 People.
How Large is the Labor Force in Greeley Hill?
There are 387 People in the Labor Forcein in Greeley Hill.
What is the Percentage of People in the Labor Force in Greeley Hill?
45.0% of People are in the Labor Force in Greeley Hill.
What is the Unemployment Rate in Greeley Hill?
Unemployment Rate in Greeley Hill is 4.9%.