Cowan, CA Map & Demographics
Cowan Map
Cowan Overview
$16,377
PER CAPITA INCOME
$72,857
AVG FAMILY INCOME
$72,857
AVG HOUSEHOLD INCOME
0.14
INEQUALITY / GINI INDEX
263
TOTAL POPULATION
135
MALE POPULATION
128
FEMALE POPULATION
105.47
MALES / 100 FEMALES
94.81
FEMALES / 100 MALES
27.8
MEDIAN AGE
4.2
AVG FAMILY SIZE
4.2
AVG HOUSEHOLD SIZE
124
LABOR FORCE [ PEOPLE ]
54.1%
PERCENT IN LABOR FORCE
41.1%
UNEMPLOYMENT RATE
Income in Cowan
Income Overview in Cowan
Per Capita Income in Cowan is $16,377, while median incomes of families and households are $72,857 and $72,857 respectively.
| Characteristic | Number | Measure |
| Per Capita Income | 263 | $16,377 |
| Median Family Income | 62 | $72,857 |
| Mean Family Income | 62 | $62,315 |
| Median Household Income | 62 | $72,857 |
| Mean Household Income | 62 | $62,315 |
| Income Deficit | 62 | $0 |
| Wage / Income Gap (%) | 263 | 0.00% |
| Wage / Income Gap ($) | 263 | 100.00¢ per $1 |
| Gini / Inequality Index | 263 | 0.14 |
Earnings by Sex in Cowan
| Sex | Number | Average Earnings |
| Male | 22 (37.9%) | $0 |
| Female | 36 (62.1%) | $0 |
| Total | 58 (100.0%) | $0 |
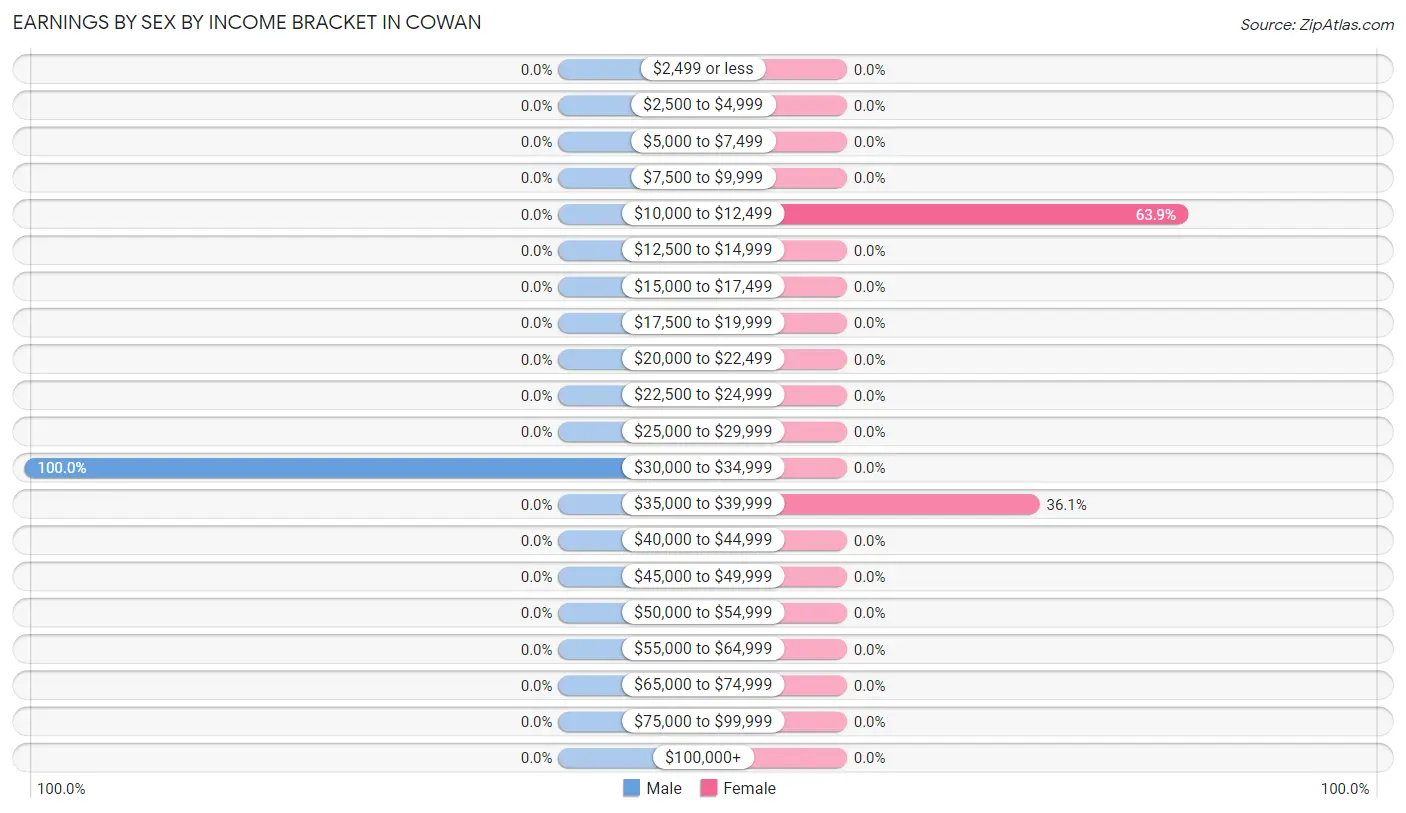
Earnings by Sex by Income Bracket in Cowan
The most common earnings brackets in Cowan are $30,000 to $34,999 for men (22 | 100.0%) and $10,000 to $12,499 for women (23 | 63.9%).
| Income | Male | Female |
| $2,499 or less | 0 (0.0%) | 0 (0.0%) |
| $2,500 to $4,999 | 0 (0.0%) | 0 (0.0%) |
| $5,000 to $7,499 | 0 (0.0%) | 0 (0.0%) |
| $7,500 to $9,999 | 0 (0.0%) | 0 (0.0%) |
| $10,000 to $12,499 | 0 (0.0%) | 23 (63.9%) |
| $12,500 to $14,999 | 0 (0.0%) | 0 (0.0%) |
| $15,000 to $17,499 | 0 (0.0%) | 0 (0.0%) |
| $17,500 to $19,999 | 0 (0.0%) | 0 (0.0%) |
| $20,000 to $22,499 | 0 (0.0%) | 0 (0.0%) |
| $22,500 to $24,999 | 0 (0.0%) | 0 (0.0%) |
| $25,000 to $29,999 | 0 (0.0%) | 0 (0.0%) |
| $30,000 to $34,999 | 22 (100.0%) | 0 (0.0%) |
| $35,000 to $39,999 | 0 (0.0%) | 13 (36.1%) |
| $40,000 to $44,999 | 0 (0.0%) | 0 (0.0%) |
| $45,000 to $49,999 | 0 (0.0%) | 0 (0.0%) |
| $50,000 to $54,999 | 0 (0.0%) | 0 (0.0%) |
| $55,000 to $64,999 | 0 (0.0%) | 0 (0.0%) |
| $65,000 to $74,999 | 0 (0.0%) | 0 (0.0%) |
| $75,000 to $99,999 | 0 (0.0%) | 0 (0.0%) |
| $100,000+ | 0 (0.0%) | 0 (0.0%) |
| Total | 22 (100.0%) | 36 (100.0%) |
Earnings by Sex by Educational Attainment in Cowan
| Educational Attainment | Male Income | Female Income |
| Less than High School | - | - |
| High School Diploma | - | - |
| College or Associate's Degree | - | - |
| Bachelor's Degree | - | - |
| Graduate Degree | - | - |
| Total | - | - |
Family Income in Cowan
Family Income Brackets in Cowan
According to the Cowan family income data, there are 34 families falling into the $50,000 to $74,999 income range, which is the most common income bracket and makes up 54.8% of all families.
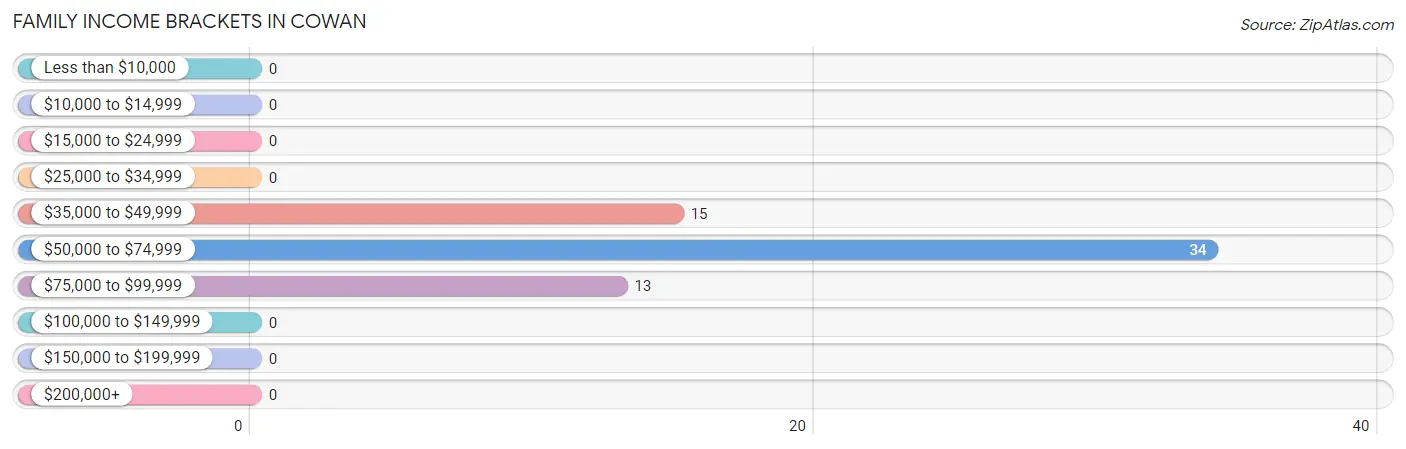
| Income Bracket | # Families | % Families |
| Less than $10,000 | 0 | 0.0% |
| $10,000 to $14,999 | 0 | 0.0% |
| $15,000 to $24,999 | 0 | 0.0% |
| $25,000 to $34,999 | 0 | 0.0% |
| $35,000 to $49,999 | 15 | 24.2% |
| $50,000 to $74,999 | 34 | 54.8% |
| $75,000 to $99,999 | 13 | 21.0% |
| $100,000 to $149,999 | 0 | 0.0% |
| $150,000 to $199,999 | 0 | 0.0% |
| $200,000+ | 0 | 0.0% |
Family Income by Famaliy Size in Cowan
4-person families (47 | 75.8%) account for the highest median family income in Cowan with $73,750 per family, while 4-person families (47 | 75.8%) have the highest median income of $18,438 per family member.
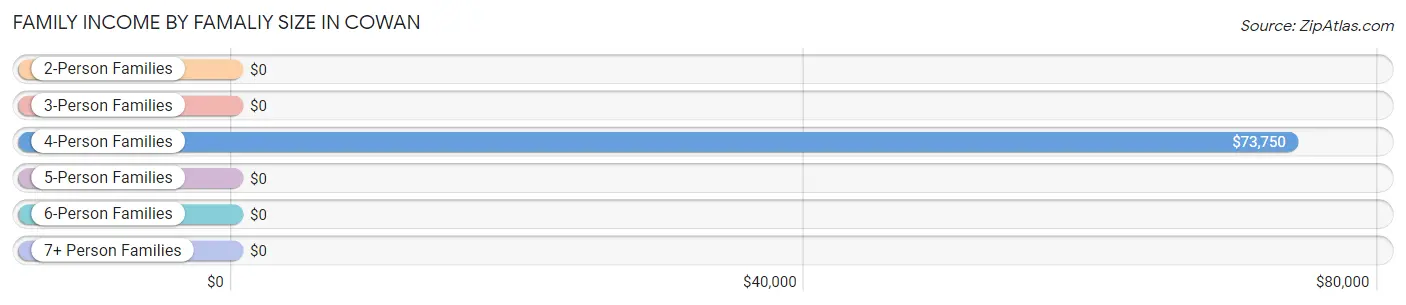
| Income Bracket | # Families | Median Income |
| 2-Person Families | 15 (24.2%) | $0 |
| 3-Person Families | 0 (0.0%) | $0 |
| 4-Person Families | 47 (75.8%) | $73,750 |
| 5-Person Families | 0 (0.0%) | $0 |
| 6-Person Families | 0 (0.0%) | $0 |
| 7+ Person Families | 0 (0.0%) | $0 |
| Total | 62 (100.0%) | $72,857 |
Family Income by Number of Earners in Cowan
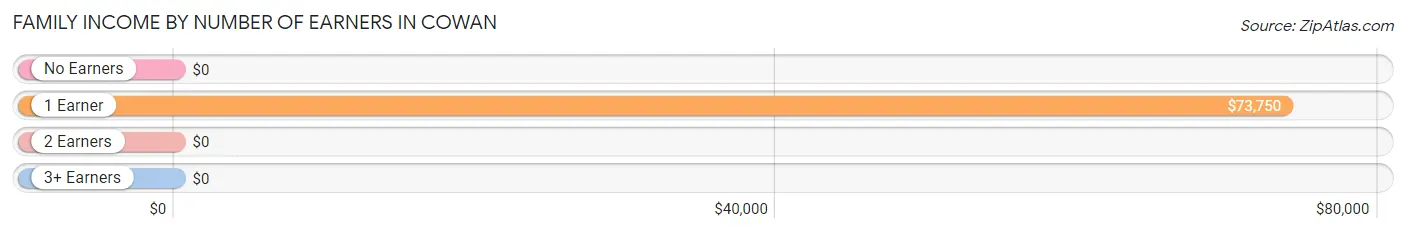
| Number of Earners | # Families | Median Income |
| No Earners | 15 (24.2%) | $0 |
| 1 Earner | 47 (75.8%) | $73,750 |
| 2 Earners | 0 (0.0%) | $0 |
| 3+ Earners | 0 (0.0%) | $0 |
| Total | 62 (100.0%) | $72,857 |
Household Income in Cowan
Household Income Brackets in Cowan
With 34 households falling in the category, the $50,000 to $74,999 income range is the most frequent in Cowan, accounting for 54.8% of all households.
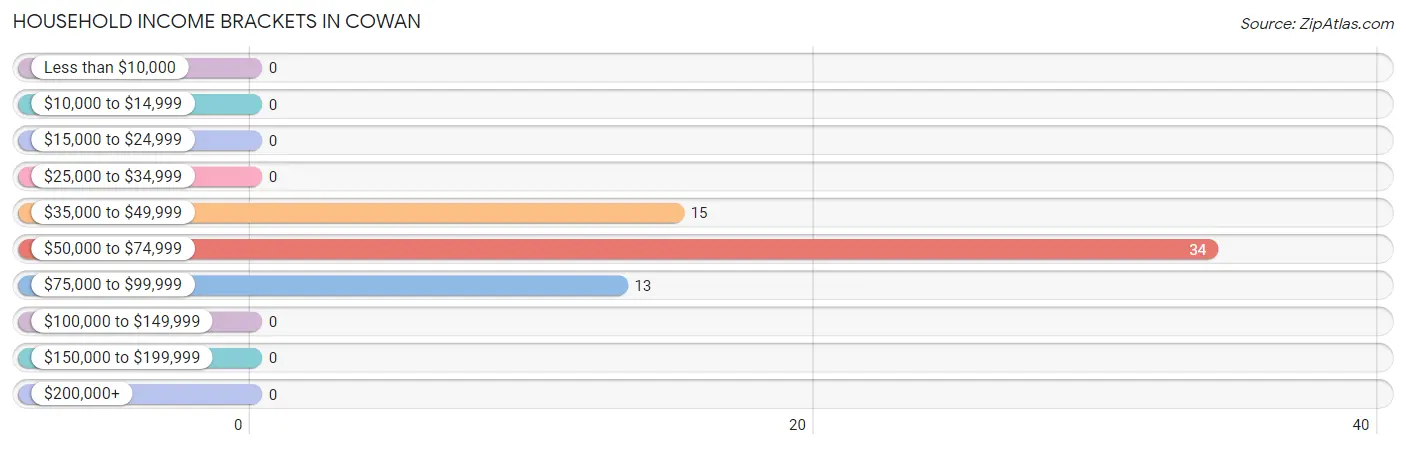
| Income Bracket | # Households | % Households |
| Less than $10,000 | 0 | 0.0% |
| $10,000 to $14,999 | 0 | 0.0% |
| $15,000 to $24,999 | 0 | 0.0% |
| $25,000 to $34,999 | 0 | 0.0% |
| $35,000 to $49,999 | 15 | 24.2% |
| $50,000 to $74,999 | 34 | 54.8% |
| $75,000 to $99,999 | 13 | 21.0% |
| $100,000 to $149,999 | 0 | 0.0% |
| $150,000 to $199,999 | 0 | 0.0% |
| $200,000+ | 0 | 0.0% |
Household Income by Householder Age in Cowan
The median household income in Cowan is $72,857, with the highest median household income of $73,631 found in the 65+ years age bracket for the primary householder. A total of 49 households (79.0%) fall into this category.
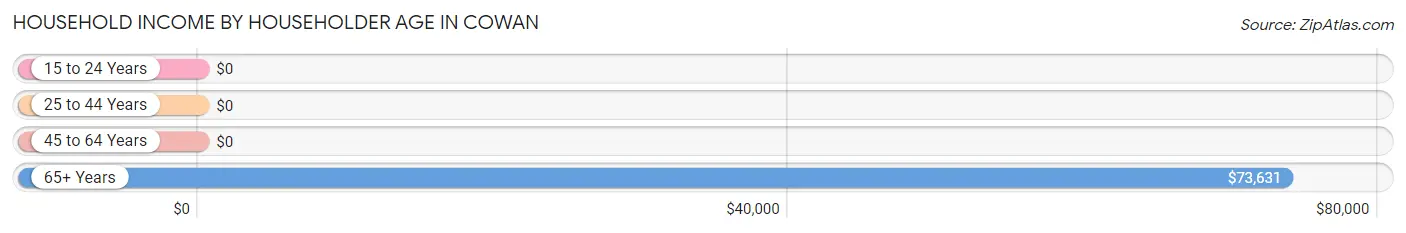
| Income Bracket | # Households | Median Income |
| 15 to 24 Years | 0 (0.0%) | $0 |
| 25 to 44 Years | 0 (0.0%) | $0 |
| 45 to 64 Years | 13 (21.0%) | $0 |
| 65+ Years | 49 (79.0%) | $73,631 |
| Total | 62 (100.0%) | $72,857 |
Poverty in Cowan
Income Below Poverty by Sex and Age in Cowan
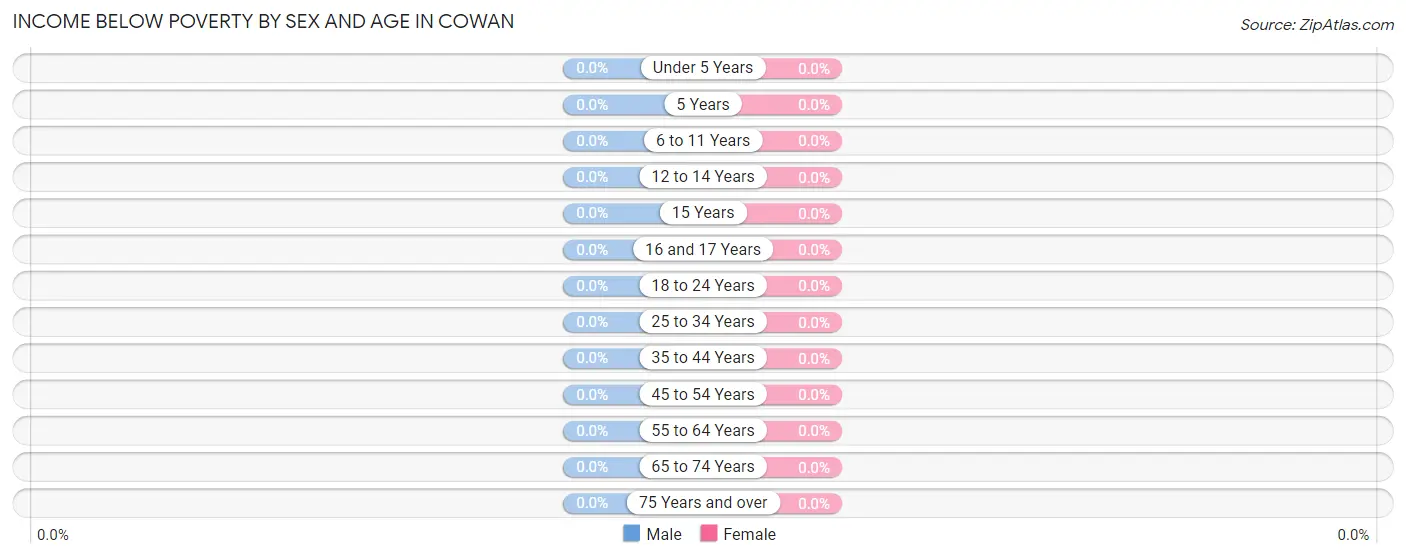
| Age Bracket | Male | Female |
| Under 5 Years | 0 (0.0%) | 0 (0.0%) |
| 5 Years | 0 (0.0%) | 0 (0.0%) |
| 6 to 11 Years | 0 (0.0%) | 0 (0.0%) |
| 12 to 14 Years | 0 (0.0%) | 0 (0.0%) |
| 15 Years | 0 (0.0%) | 0 (0.0%) |
| 16 and 17 Years | 0 (0.0%) | 0 (0.0%) |
| 18 to 24 Years | 0 (0.0%) | 0 (0.0%) |
| 25 to 34 Years | 0 (0.0%) | 0 (0.0%) |
| 35 to 44 Years | 0 (0.0%) | 0 (0.0%) |
| 45 to 54 Years | 0 (0.0%) | 0 (0.0%) |
| 55 to 64 Years | 0 (0.0%) | 0 (0.0%) |
| 65 to 74 Years | 0 (0.0%) | 0 (0.0%) |
| 75 Years and over | 0 (0.0%) | 0 (0.0%) |
| Total | 0 (0.0%) | 0 (0.0%) |
Income Above Poverty by Sex and Age in Cowan
According to the poverty statistics in Cowan, males aged under 5 years and females aged 6 to 11 years are the age groups that are most secure financially, with 100.0% of males and 100.0% of females in these age groups living above the poverty line.
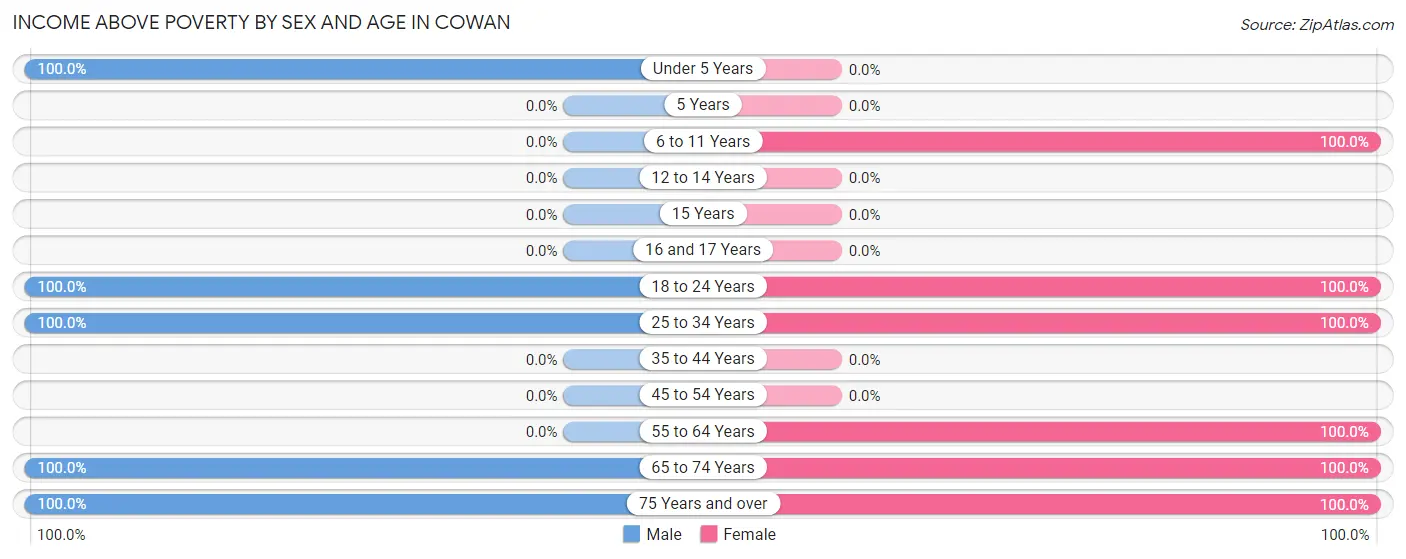
| Age Bracket | Male | Female |
| Under 5 Years | 18 (100.0%) | 0 (0.0%) |
| 5 Years | 0 (0.0%) | 0 (0.0%) |
| 6 to 11 Years | 0 (0.0%) | 16 (100.0%) |
| 12 to 14 Years | 0 (0.0%) | 0 (0.0%) |
| 15 Years | 0 (0.0%) | 0 (0.0%) |
| 16 and 17 Years | 0 (0.0%) | 0 (0.0%) |
| 18 to 24 Years | 22 (100.0%) | 23 (100.0%) |
| 25 to 34 Years | 69 (100.0%) | 16 (100.0%) |
| 35 to 44 Years | 0 (0.0%) | 0 (0.0%) |
| 45 to 54 Years | 0 (0.0%) | 0 (0.0%) |
| 55 to 64 Years | 0 (0.0%) | 37 (100.0%) |
| 65 to 74 Years | 13 (100.0%) | 15 (100.0%) |
| 75 Years and over | 13 (100.0%) | 21 (100.0%) |
| Total | 135 (100.0%) | 128 (100.0%) |
Income Below Poverty Among Married-Couple Families in Cowan
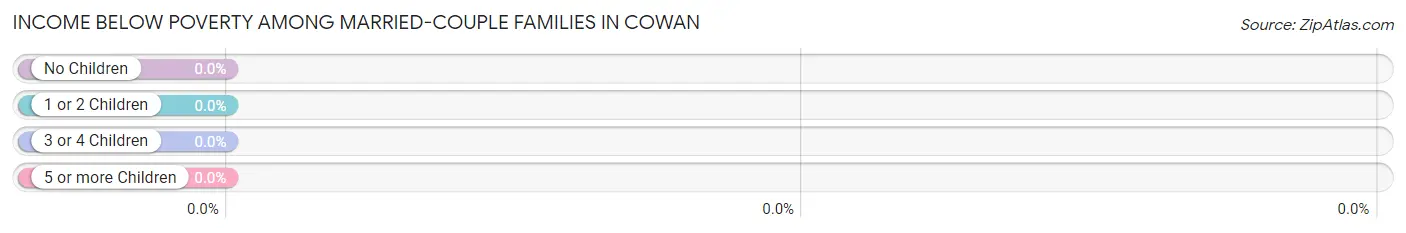
| Children | Above Poverty | Below Poverty |
| No Children | 13 (100.0%) | 0 (0.0%) |
| 1 or 2 Children | 0 (0.0%) | 0 (0.0%) |
| 3 or 4 Children | 0 (0.0%) | 0 (0.0%) |
| 5 or more Children | 0 (0.0%) | 0 (0.0%) |
| Total | 13 (100.0%) | 0 (0.0%) |
Income Below Poverty Among Single-Parent Households in Cowan
| Children | Single Father | Single Mother |
| No Children | 0 (0.0%) | 0 (0.0%) |
| 1 or 2 Children | 0 (0.0%) | 0 (0.0%) |
| 3 or 4 Children | 0 (0.0%) | 0 (0.0%) |
| 5 or more Children | 0 (0.0%) | 0 (0.0%) |
| Total | 0 (0.0%) | 0 (0.0%) |
Income Below Poverty Among Married-Couple vs Single-Parent Households in Cowan
| Children | Married-Couple Families | Single-Parent Households |
| No Children | 0 (0.0%) | 0 (0.0%) |
| 1 or 2 Children | 0 (0.0%) | 0 (0.0%) |
| 3 or 4 Children | 0 (0.0%) | 0 (0.0%) |
| 5 or more Children | 0 (0.0%) | 0 (0.0%) |
| Total | 0 (0.0%) | 0 (0.0%) |
Race in Cowan
The most populous races in Cowan are White / Caucasian (217 | 82.5%), Asian (24 | 9.1%), and Two or more Races (22 | 8.4%).
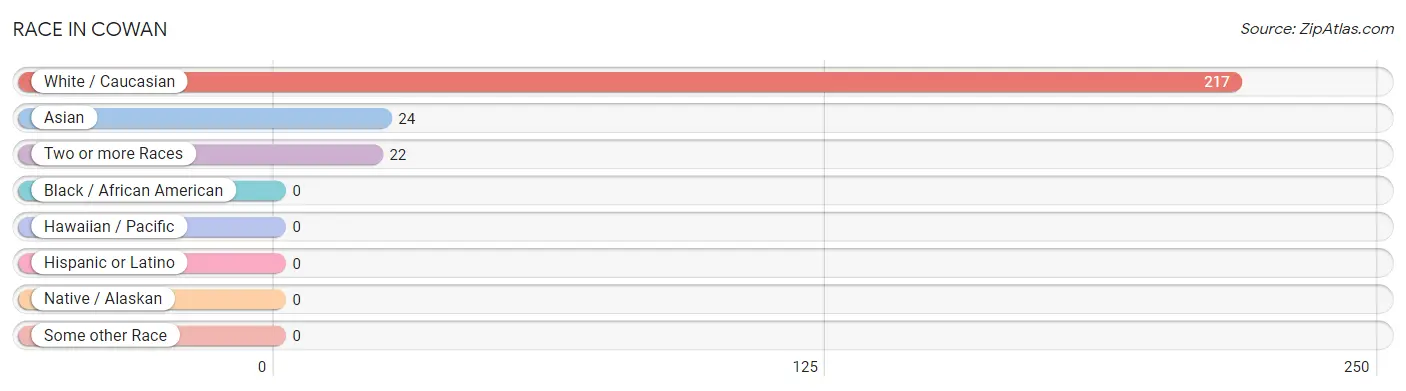
| Race | # Population | % Population |
| Asian | 24 | 9.1% |
| Black / African American | 0 | 0.0% |
| Hawaiian / Pacific | 0 | 0.0% |
| Hispanic or Latino | 0 | 0.0% |
| Native / Alaskan | 0 | 0.0% |
| White / Caucasian | 217 | 82.5% |
| Two or more Races | 22 | 8.4% |
| Some other Race | 0 | 0.0% |
| Total | 263 | 100.0% |
Ancestry in Cowan
The most populous ancestries reported in Cowan are Irish (95 | 36.1%), English (71 | 27.0%), Swedish (28 | 10.6%), Korean (24 | 9.1%), and French (22 | 8.4%), together accounting for 91.3% of all Cowan residents.
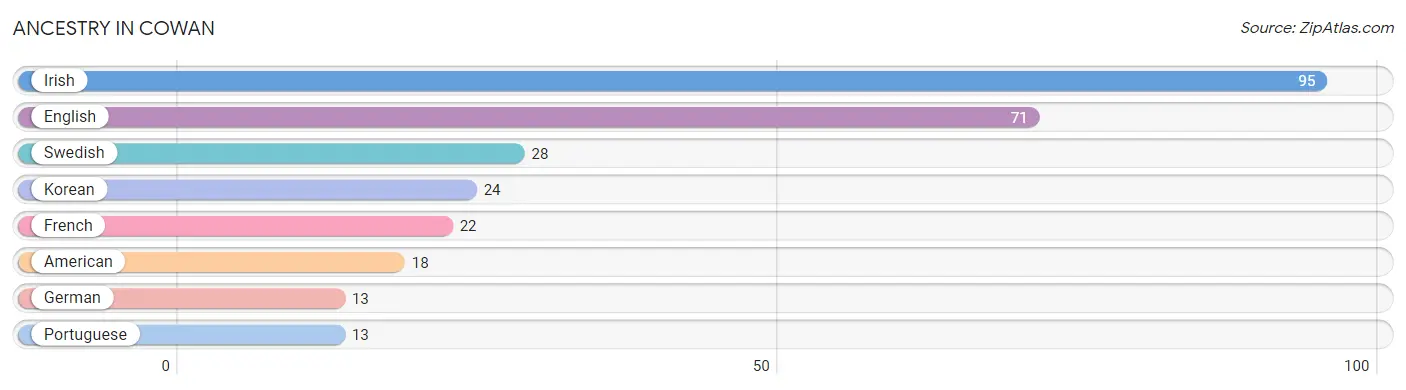
| Ancestry | # Population | % Population |
| American | 18 | 6.8% |
| English | 71 | 27.0% |
| French | 22 | 8.4% |
| German | 13 | 4.9% |
| Irish | 95 | 36.1% |
| Korean | 24 | 9.1% |
| Portuguese | 13 | 4.9% |
| Swedish | 28 | 10.6% | View All 8 Rows |
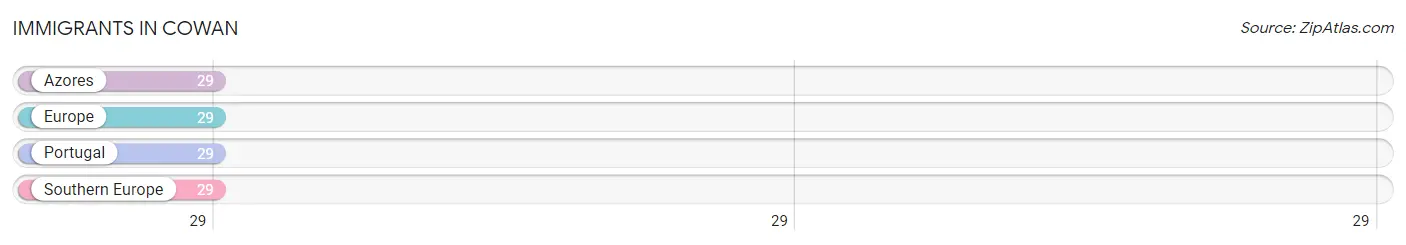
Immigrants in Cowan
The most numerous immigrant groups reported in Cowan came from Azores (29 | 11.0%), Europe (29 | 11.0%), Portugal (29 | 11.0%), and Southern Europe (29 | 11.0%), together accounting for 44.1% of all Cowan residents.
| Immigration Origin | # Population | % Population |
| Azores | 29 | 11.0% |
| Europe | 29 | 11.0% |
| Portugal | 29 | 11.0% |
| Southern Europe | 29 | 11.0% | View All 4 Rows |
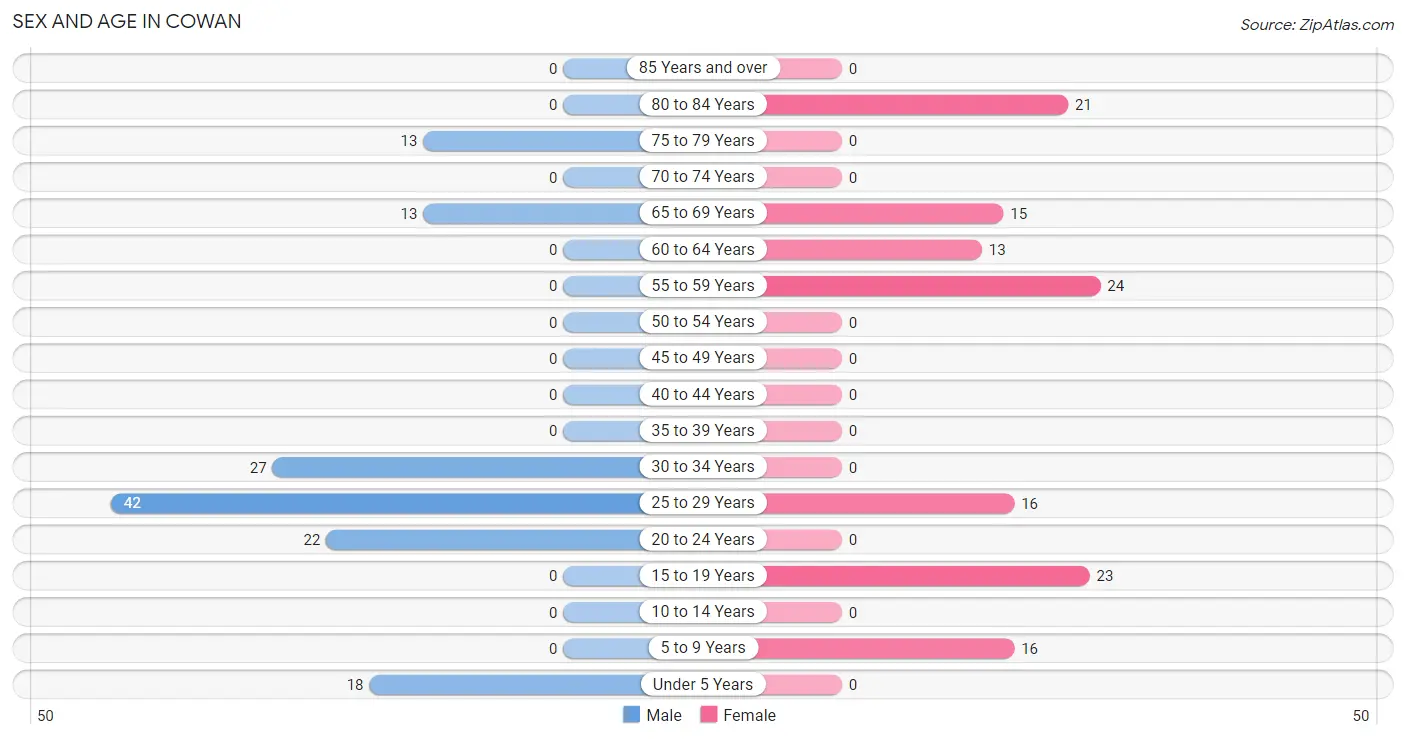
Sex and Age in Cowan
Sex and Age in Cowan
The most populous age groups in Cowan are 25 to 29 Years (42 | 31.1%) for men and 55 to 59 Years (24 | 18.8%) for women.
| Age Bracket | Male | Female |
| Under 5 Years | 18 (13.3%) | 0 (0.0%) |
| 5 to 9 Years | 0 (0.0%) | 16 (12.5%) |
| 10 to 14 Years | 0 (0.0%) | 0 (0.0%) |
| 15 to 19 Years | 0 (0.0%) | 23 (18.0%) |
| 20 to 24 Years | 22 (16.3%) | 0 (0.0%) |
| 25 to 29 Years | 42 (31.1%) | 16 (12.5%) |
| 30 to 34 Years | 27 (20.0%) | 0 (0.0%) |
| 35 to 39 Years | 0 (0.0%) | 0 (0.0%) |
| 40 to 44 Years | 0 (0.0%) | 0 (0.0%) |
| 45 to 49 Years | 0 (0.0%) | 0 (0.0%) |
| 50 to 54 Years | 0 (0.0%) | 0 (0.0%) |
| 55 to 59 Years | 0 (0.0%) | 24 (18.8%) |
| 60 to 64 Years | 0 (0.0%) | 13 (10.2%) |
| 65 to 69 Years | 13 (9.6%) | 15 (11.7%) |
| 70 to 74 Years | 0 (0.0%) | 0 (0.0%) |
| 75 to 79 Years | 13 (9.6%) | 0 (0.0%) |
| 80 to 84 Years | 0 (0.0%) | 21 (16.4%) |
| 85 Years and over | 0 (0.0%) | 0 (0.0%) |
| Total | 135 (100.0%) | 128 (100.0%) |
Families and Households in Cowan
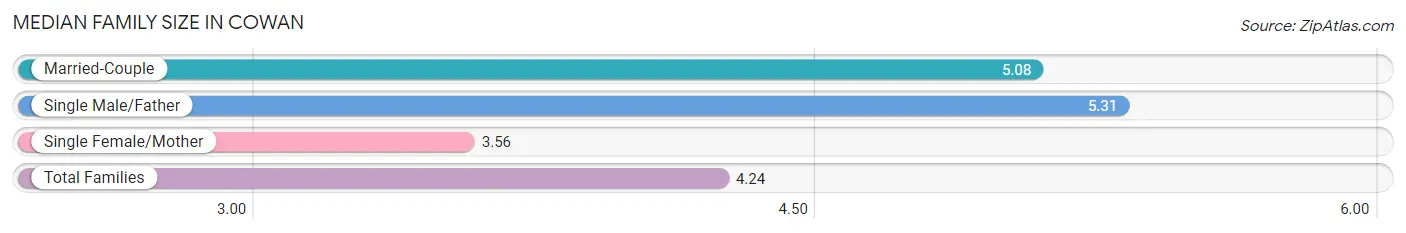
Median Family Size in Cowan
The median family size in Cowan is 4.24 persons per family, with single male/father families (13 | 21.0%) accounting for the largest median family size of 5.31 persons per family. On the other hand, single female/mother families (36 | 58.1%) represent the smallest median family size with 3.56 persons per family.
| Family Type | # Families | Family Size |
| Married-Couple | 13 (21.0%) | 5.08 |
| Single Male/Father | 13 (21.0%) | 5.31 |
| Single Female/Mother | 36 (58.1%) | 3.56 |
| Total Families | 62 (100.0%) | 4.24 |
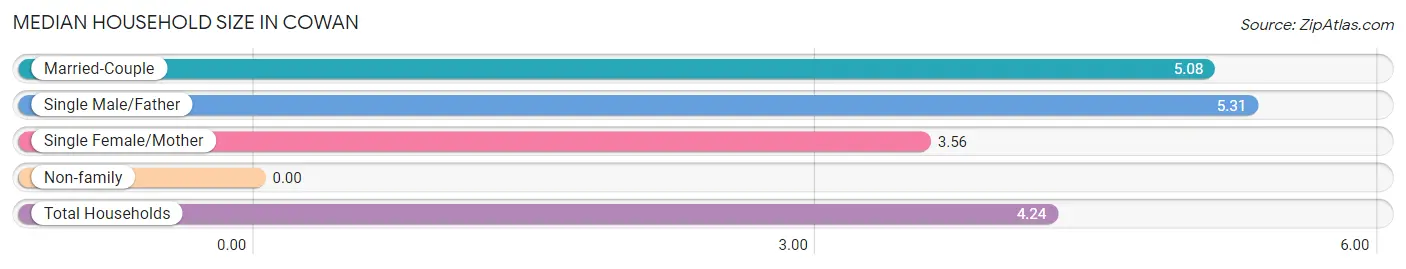
Median Household Size in Cowan
| Household Type | # Households | Household Size |
| Married-Couple | 13 (21.0%) | 5.08 |
| Single Male/Father | 13 (21.0%) | 5.31 |
| Single Female/Mother | 36 (58.1%) | 3.56 |
| Non-family | 0 (0.0%) | - |
| Total Households | 62 (100.0%) | 4.24 |
Household Size by Marriage Status in Cowan
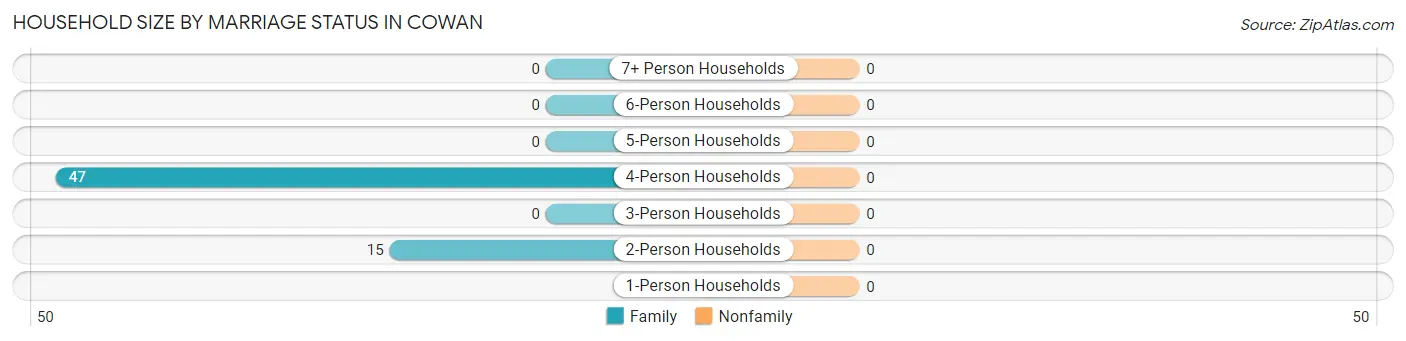
| Household Size | Family Households | Nonfamily Households |
| 1-Person Households | - | 0 (0.0%) |
| 2-Person Households | 15 (24.2%) | 0 (0.0%) |
| 3-Person Households | 0 (0.0%) | 0 (0.0%) |
| 4-Person Households | 47 (75.8%) | 0 (0.0%) |
| 5-Person Households | 0 (0.0%) | 0 (0.0%) |
| 6-Person Households | 0 (0.0%) | 0 (0.0%) |
| 7+ Person Households | 0 (0.0%) | 0 (0.0%) |
| Total | 62 (100.0%) | 0 (0.0%) |
Female Fertility in Cowan
Fertility by Age in Cowan
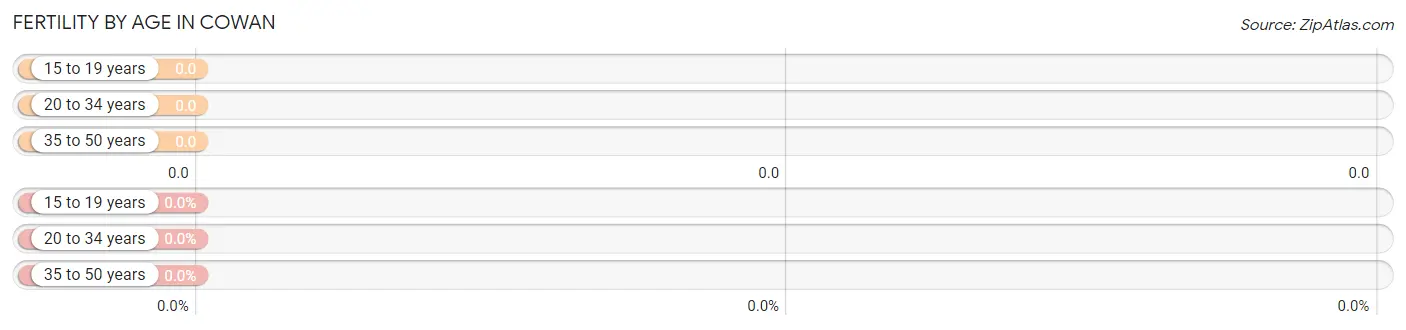
| Age Bracket | Women with Births | Births / 1,000 Women |
| 15 to 19 years | 0 (0.0%) | 0.0 |
| 20 to 34 years | 0 (0.0%) | 0.0 |
| 35 to 50 years | 0 (0.0%) | 0.0 |
| Total | 0 (0.0%) | 0.0 |
Fertility by Age by Marriage Status in Cowan
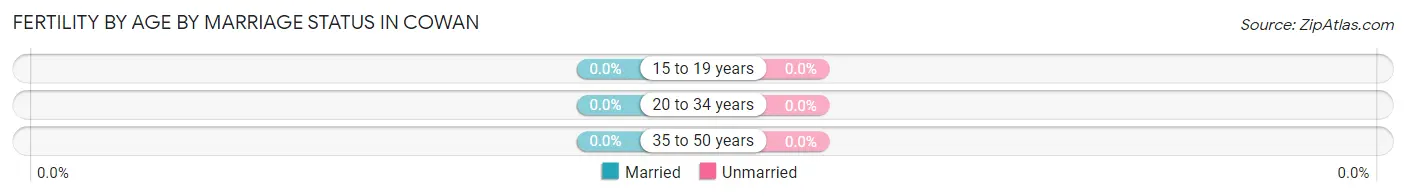
| Age Bracket | Married | Unmarried |
| 15 to 19 years | 0 (0.0%) | 0 (0.0%) |
| 20 to 34 years | 0 (0.0%) | 0 (0.0%) |
| 35 to 50 years | 0 (0.0%) | 0 (0.0%) |
| Total | 0 (0.0%) | 0 (0.0%) |
Fertility by Education in Cowan
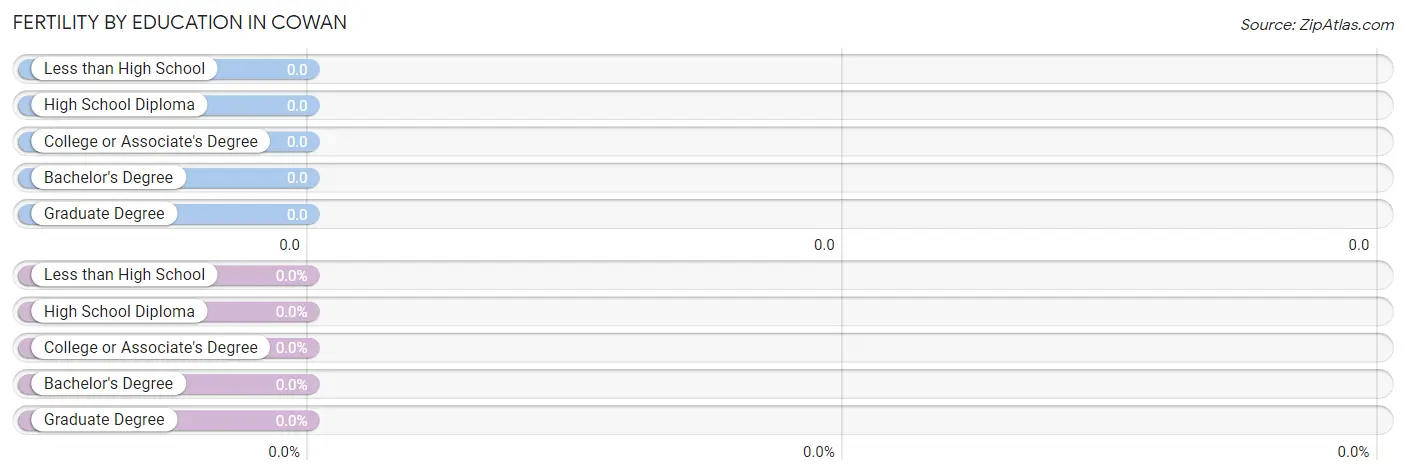
| Educational Attainment | Women with Births | Births / 1,000 Women |
| Less than High School | 0 (0.0%) | 0.0 |
| High School Diploma | 0 (0.0%) | 0.0 |
| College or Associate's Degree | 0 (0.0%) | 0.0 |
| Bachelor's Degree | 0 (0.0%) | 0.0 |
| Graduate Degree | 0 (0.0%) | 0.0 |
| Total | 0 (0.0%) | 0.0 |
Fertility by Education by Marriage Status in Cowan
| Educational Attainment | Married | Unmarried |
| Less than High School | 0 (0.0%) | 0 (0.0%) |
| High School Diploma | 0 (0.0%) | 0 (0.0%) |
| College or Associate's Degree | 0 (0.0%) | 0 (0.0%) |
| Bachelor's Degree | 0 (0.0%) | 0 (0.0%) |
| Graduate Degree | 0 (0.0%) | 0 (0.0%) |
| Total | 0 (0.0%) | 0 (0.0%) |
Employment Characteristics in Cowan
Employment by Class of Employer in Cowan
Among the 58 employed individuals in Cowan, , and private company employees (58 | 100.0%) make up the most common classes of employment.
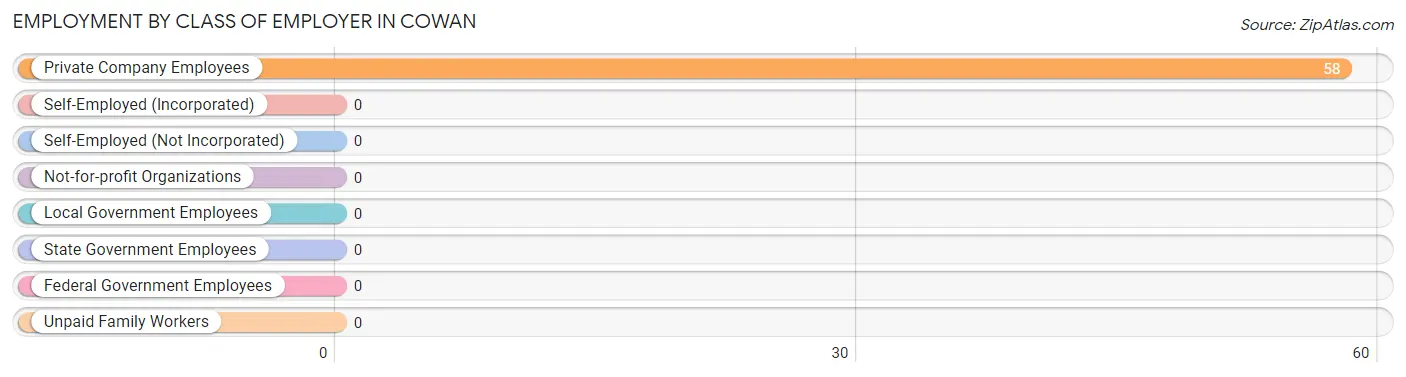
| Employer Class | # Employees | % Employees |
| Private Company Employees | 58 | 100.0% |
| Self-Employed (Incorporated) | 0 | 0.0% |
| Self-Employed (Not Incorporated) | 0 | 0.0% |
| Not-for-profit Organizations | 0 | 0.0% |
| Local Government Employees | 0 | 0.0% |
| State Government Employees | 0 | 0.0% |
| Federal Government Employees | 0 | 0.0% |
| Unpaid Family Workers | 0 | 0.0% |
| Total | 58 | 100.0% |
Employment Status by Age in Cowan
According to the labor force statistics for Cowan, out of the total population over 16 years of age (229), 54.1% or 124 individuals are in the labor force, with 41.1% or 51 of them unemployed. The age group with the highest labor force participation rate is 16 to 19 years, with 100.0% or 23 individuals in the labor force. Within the labor force, the 25 to 29 years age range has the highest percentage of unemployed individuals, with 100.0% or 24 of them being unemployed.
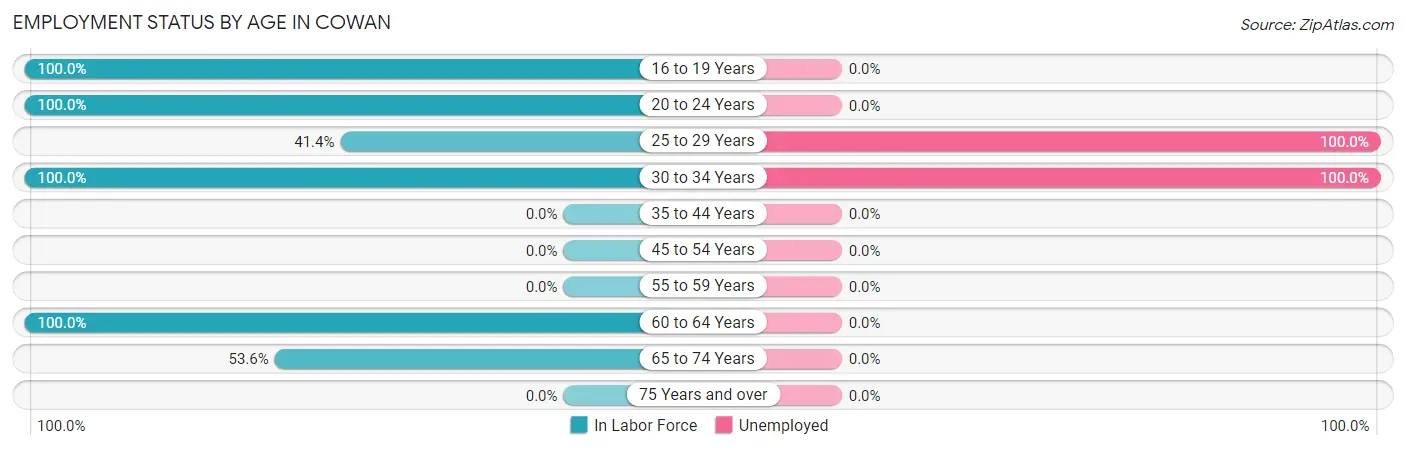
| Age Bracket | In Labor Force | Unemployed |
| 16 to 19 Years | 23 (100.0%) | 0 (0.0%) |
| 20 to 24 Years | 22 (100.0%) | 0 (0.0%) |
| 25 to 29 Years | 24 (41.4%) | 24 (100.0%) |
| 30 to 34 Years | 27 (100.0%) | 27 (100.0%) |
| 35 to 44 Years | 0 (0.0%) | 0 (0.0%) |
| 45 to 54 Years | 0 (0.0%) | 0 (0.0%) |
| 55 to 59 Years | 0 (0.0%) | 0 (0.0%) |
| 60 to 64 Years | 13 (100.0%) | 0 (0.0%) |
| 65 to 74 Years | 15 (53.6%) | 0 (0.0%) |
| 75 Years and over | 0 (0.0%) | 0 (0.0%) |
| Total | 124 (54.1%) | 51 (41.1%) |
Employment Status by Educational Attainment in Cowan
According to labor force statistics for Cowan, 52.5% of individuals (64) out of the total population between 25 and 64 years of age (122) are in the labor force, with 79.7% or 51 of them being unemployed. The group with the highest labor force participation rate are those with the educational attainment of college / associate degree, with 100.0% or 37 individuals in the labor force. Within the labor force, individuals with high school diploma education have the highest percentage of unemployment, with 100.0% or 27 of them being unemployed.
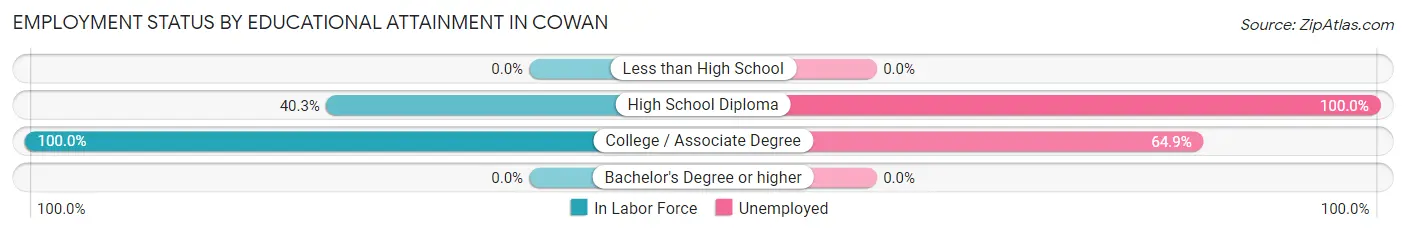
| Educational Attainment | In Labor Force | Unemployed |
| Less than High School | 0 (0.0%) | 0 (0.0%) |
| High School Diploma | 27 (40.3%) | 67 (100.0%) |
| College / Associate Degree | 37 (100.0%) | 24 (64.9%) |
| Bachelor's Degree or higher | 0 (0.0%) | 0 (0.0%) |
| Total | 64 (52.5%) | 97 (79.7%) |
Employment Occupations by Sex in Cowan
Management, Business, Science and Arts Occupations
Management, Business, Science and Arts Occupations by Sex
| Occupation | Male | Female |
| Management | 0 (0.0%) | 0 (0.0%) |
| Business & Financial | 0 (0.0%) | 0 (0.0%) |
| Computers, Engineering & Science | 0 (0.0%) | 0 (0.0%) |
| Computers & Mathematics | 0 (0.0%) | 0 (0.0%) |
| Architecture & Engineering | 0 (0.0%) | 0 (0.0%) |
| Life, Physical & Social Science | 0 (0.0%) | 0 (0.0%) |
| Community & Social Service | 0 (0.0%) | 0 (0.0%) |
| Education, Arts & Media | 0 (0.0%) | 0 (0.0%) |
| Legal Services & Support | 0 (0.0%) | 0 (0.0%) |
| Education Instruction & Library | 0 (0.0%) | 0 (0.0%) |
| Arts, Media & Entertainment | 0 (0.0%) | 0 (0.0%) |
| Health Diagnosing & Treating | 0 (0.0%) | 0 (0.0%) |
| Health Technologists | 0 (0.0%) | 0 (0.0%) |
| Total (Category) | 0 (0.0%) | 0 (0.0%) |
| Total (Overall) | 22 (30.1%) | 51 (69.9%) |
Services Occupations
The most common Services occupations in Cowan are , and Food Preparation & Serving (23 | 31.5%).
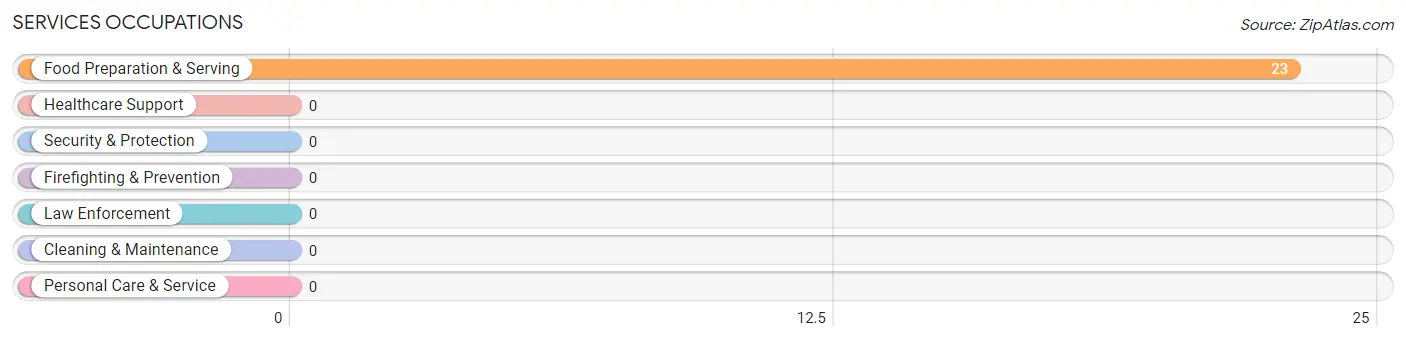
Services Occupations by Sex
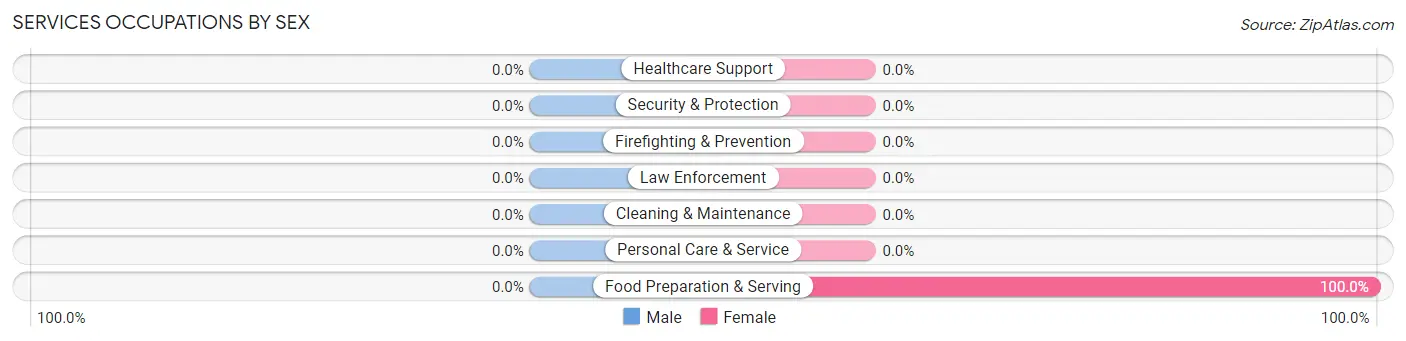
| Occupation | Male | Female |
| Healthcare Support | 0 (0.0%) | 0 (0.0%) |
| Security & Protection | 0 (0.0%) | 0 (0.0%) |
| Firefighting & Prevention | 0 (0.0%) | 0 (0.0%) |
| Law Enforcement | 0 (0.0%) | 0 (0.0%) |
| Food Preparation & Serving | 0 (0.0%) | 23 (100.0%) |
| Cleaning & Maintenance | 0 (0.0%) | 0 (0.0%) |
| Personal Care & Service | 0 (0.0%) | 0 (0.0%) |
| Total (Category) | 0 (0.0%) | 23 (100.0%) |
| Total (Overall) | 22 (30.1%) | 51 (69.9%) |
Sales and Office Occupations
The most common Sales and Office occupations in Cowan are , and Office & Administration (13 | 17.8%).
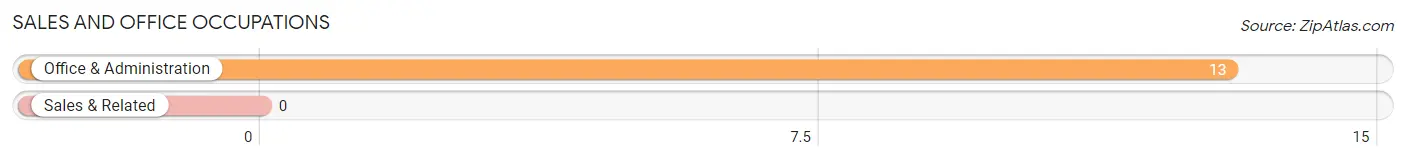
Sales and Office Occupations by Sex
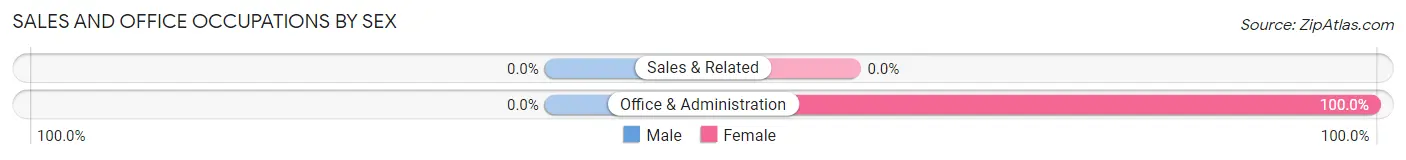
| Occupation | Male | Female |
| Sales & Related | 0 (0.0%) | 0 (0.0%) |
| Office & Administration | 0 (0.0%) | 13 (100.0%) |
| Total (Category) | 0 (0.0%) | 13 (100.0%) |
| Total (Overall) | 22 (30.1%) | 51 (69.9%) |
Natural Resources, Construction and Maintenance Occupations
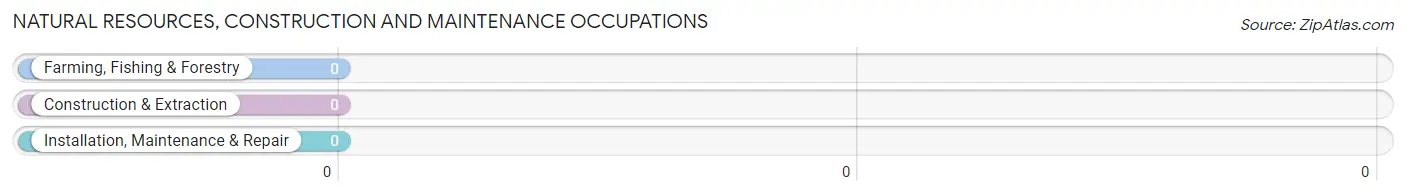
Natural Resources, Construction and Maintenance Occupations by Sex
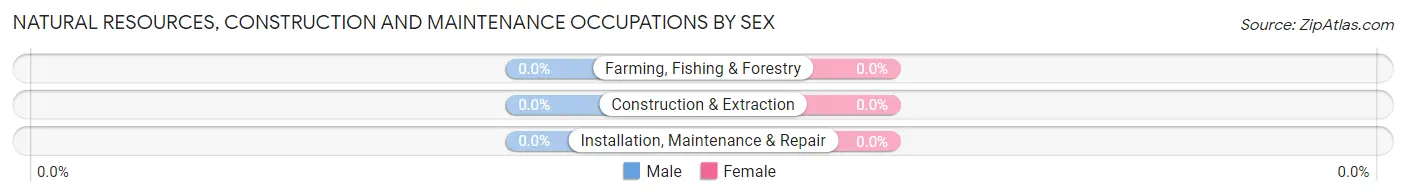
| Occupation | Male | Female |
| Farming, Fishing & Forestry | 0 (0.0%) | 0 (0.0%) |
| Construction & Extraction | 0 (0.0%) | 0 (0.0%) |
| Installation, Maintenance & Repair | 0 (0.0%) | 0 (0.0%) |
| Total (Category) | 0 (0.0%) | 0 (0.0%) |
| Total (Overall) | 22 (30.1%) | 51 (69.9%) |
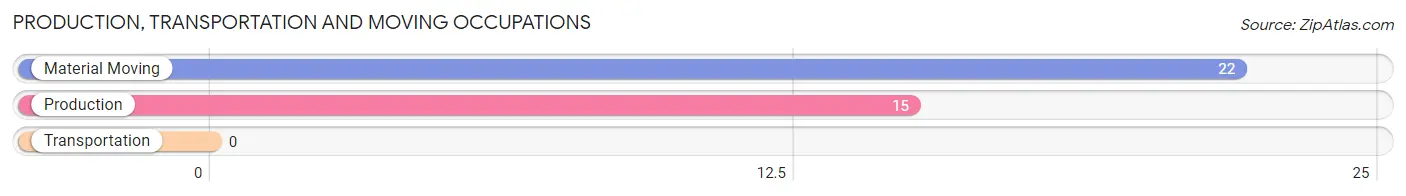
Production, Transportation and Moving Occupations
The most common Production, Transportation and Moving occupations in Cowan are Material Moving (22 | 30.1%), and Production (15 | 20.5%).
Production, Transportation and Moving Occupations by Sex
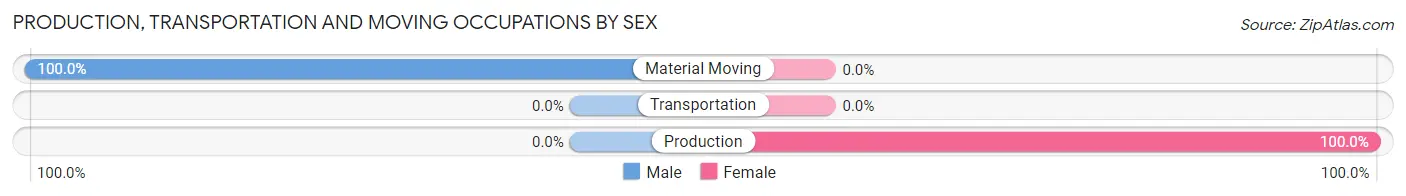
| Occupation | Male | Female |
| Production | 0 (0.0%) | 15 (100.0%) |
| Transportation | 0 (0.0%) | 0 (0.0%) |
| Material Moving | 22 (100.0%) | 0 (0.0%) |
| Total (Category) | 22 (59.5%) | 15 (40.5%) |
| Total (Overall) | 22 (30.1%) | 51 (69.9%) |
Employment Industries by Sex in Cowan
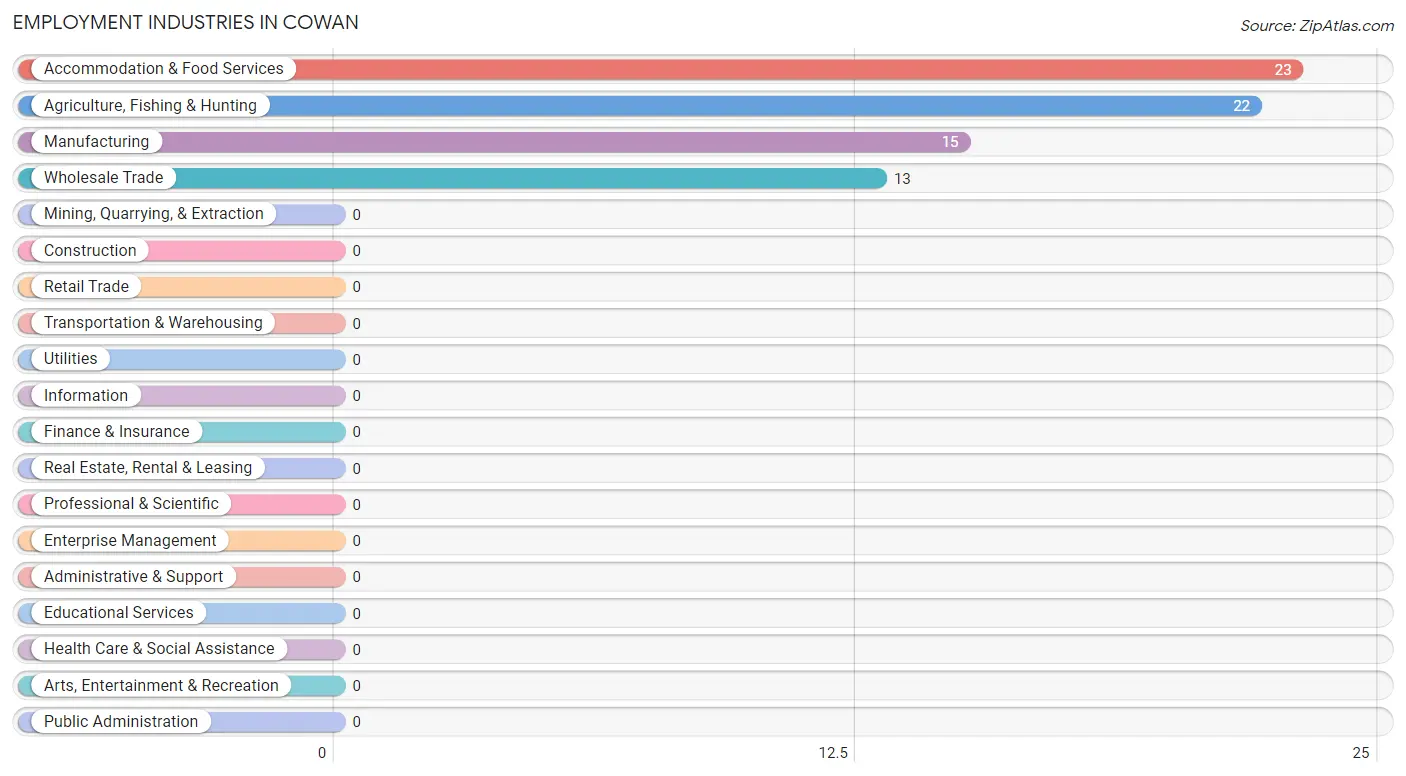
Employment Industries in Cowan
The major employment industries in Cowan include Accommodation & Food Services (23 | 31.5%), Agriculture, Fishing & Hunting (22 | 30.1%), Manufacturing (15 | 20.5%), and Wholesale Trade (13 | 17.8%).
Employment Industries by Sex in Cowan
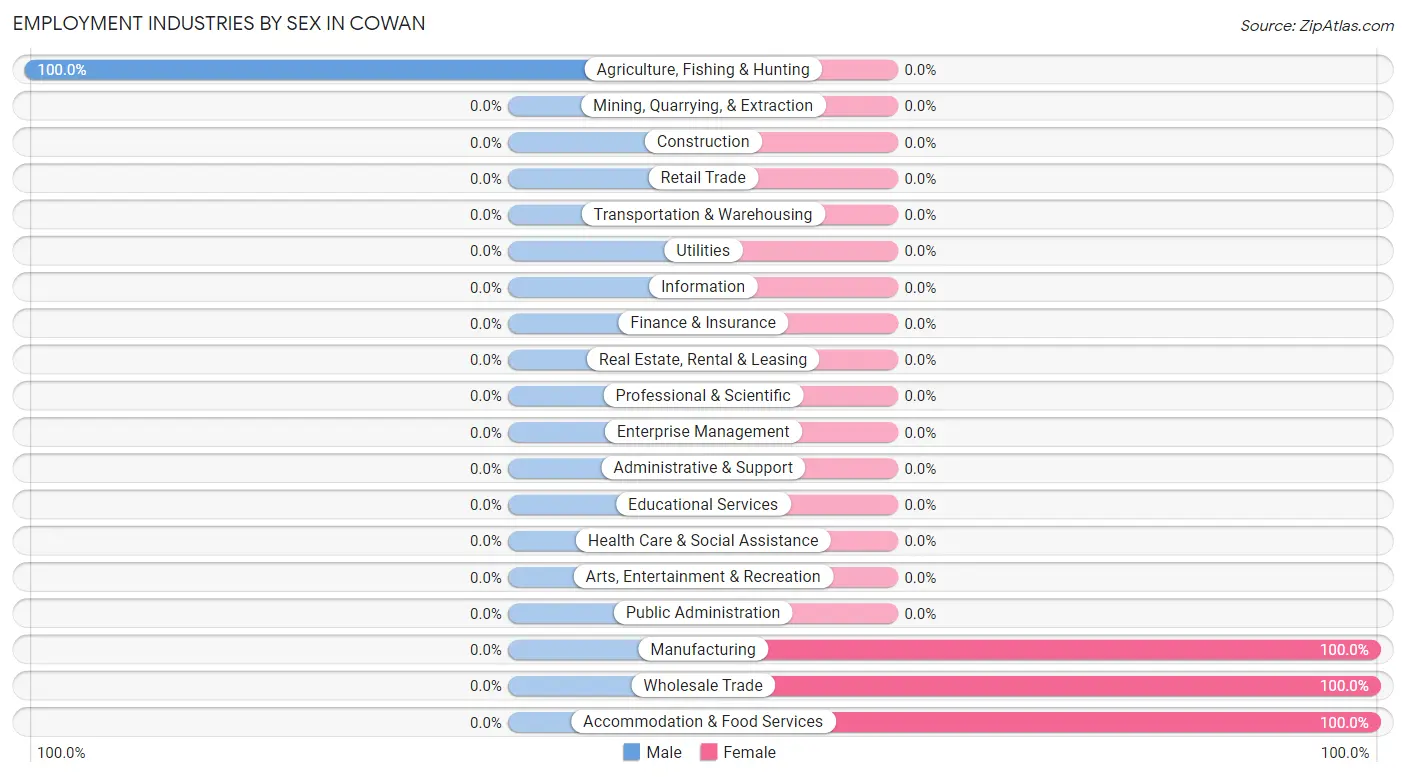
| Industry | Male | Female |
| Agriculture, Fishing & Hunting | 22 (100.0%) | 0 (0.0%) |
| Mining, Quarrying, & Extraction | 0 (0.0%) | 0 (0.0%) |
| Construction | 0 (0.0%) | 0 (0.0%) |
| Manufacturing | 0 (0.0%) | 15 (100.0%) |
| Wholesale Trade | 0 (0.0%) | 13 (100.0%) |
| Retail Trade | 0 (0.0%) | 0 (0.0%) |
| Transportation & Warehousing | 0 (0.0%) | 0 (0.0%) |
| Utilities | 0 (0.0%) | 0 (0.0%) |
| Information | 0 (0.0%) | 0 (0.0%) |
| Finance & Insurance | 0 (0.0%) | 0 (0.0%) |
| Real Estate, Rental & Leasing | 0 (0.0%) | 0 (0.0%) |
| Professional & Scientific | 0 (0.0%) | 0 (0.0%) |
| Enterprise Management | 0 (0.0%) | 0 (0.0%) |
| Administrative & Support | 0 (0.0%) | 0 (0.0%) |
| Educational Services | 0 (0.0%) | 0 (0.0%) |
| Health Care & Social Assistance | 0 (0.0%) | 0 (0.0%) |
| Arts, Entertainment & Recreation | 0 (0.0%) | 0 (0.0%) |
| Accommodation & Food Services | 0 (0.0%) | 23 (100.0%) |
| Public Administration | 0 (0.0%) | 0 (0.0%) |
| Total | 22 (30.1%) | 51 (69.9%) |
Education in Cowan
School Enrollment in Cowan
The most common levels of schooling among the 40 students in Cowan are college / undergraduate (24 | 60.0%), and elementary school (16 | 40.0%).
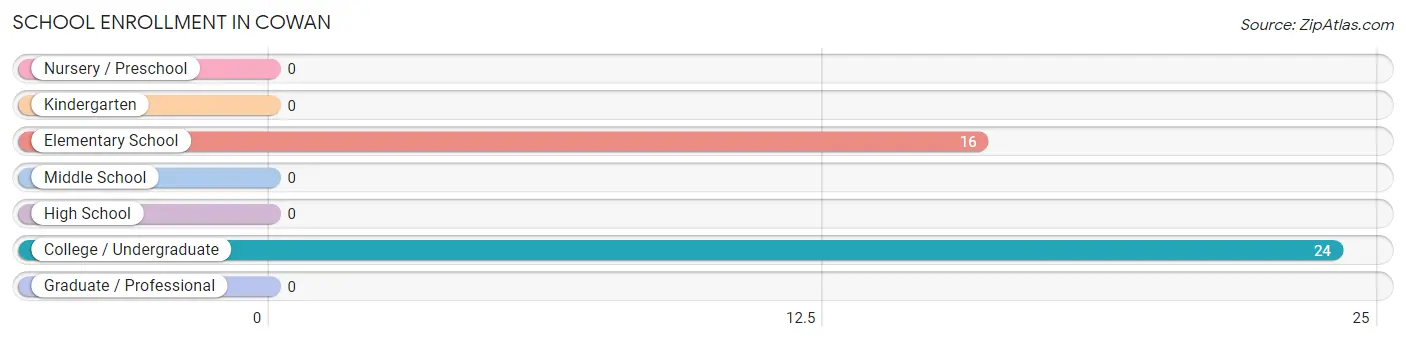
| School Level | # Students | % Students |
| Nursery / Preschool | 0 | 0.0% |
| Kindergarten | 0 | 0.0% |
| Elementary School | 16 | 40.0% |
| Middle School | 0 | 0.0% |
| High School | 0 | 0.0% |
| College / Undergraduate | 24 | 60.0% |
| Graduate / Professional | 0 | 0.0% |
| Total | 40 | 100.0% |
School Enrollment by Age by Funding Source in Cowan
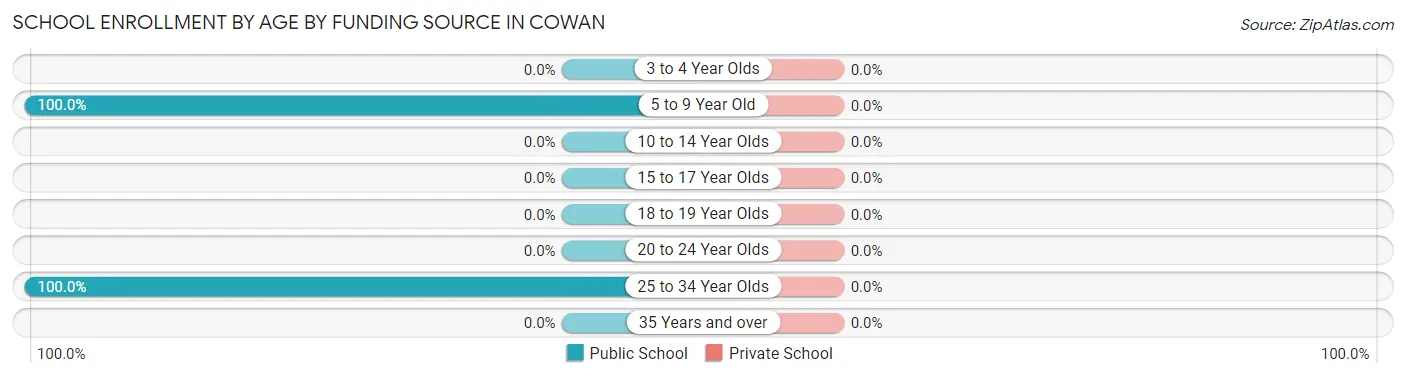
| Age Bracket | Public School | Private School |
| 3 to 4 Year Olds | 0 (0.0%) | 0 (0.0%) |
| 5 to 9 Year Old | 16 (100.0%) | 0 (0.0%) |
| 10 to 14 Year Olds | 0 (0.0%) | 0 (0.0%) |
| 15 to 17 Year Olds | 0 (0.0%) | 0 (0.0%) |
| 18 to 19 Year Olds | 0 (0.0%) | 0 (0.0%) |
| 20 to 24 Year Olds | 0 (0.0%) | 0 (0.0%) |
| 25 to 34 Year Olds | 24 (100.0%) | 0 (0.0%) |
| 35 Years and over | 0 (0.0%) | 0 (0.0%) |
| Total | 40 (100.0%) | 0 (0.0%) |
Educational Attainment by Field of Study in Cowan
, and computers & mathematics (18 | 100.0%) are the most common fields of study among 18 individuals in Cowan who have obtained a bachelor's degree or higher.
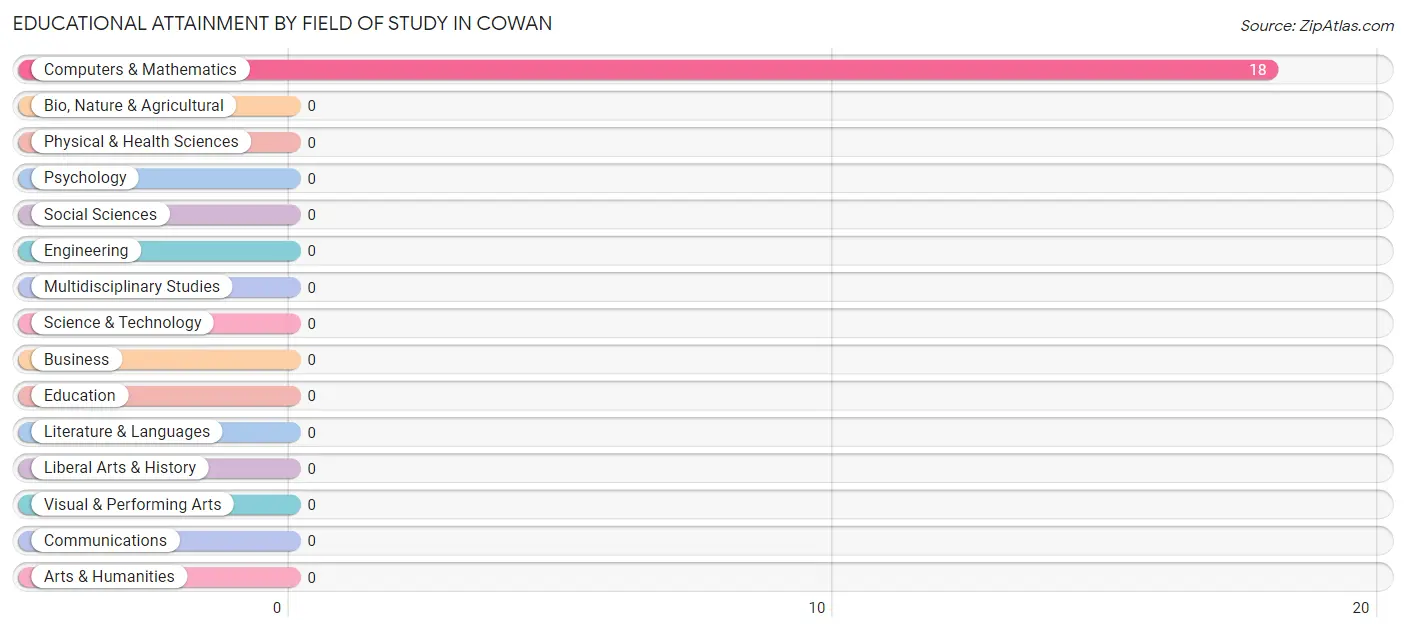
| Field of Study | # Graduates | % Graduates |
| Computers & Mathematics | 18 | 100.0% |
| Bio, Nature & Agricultural | 0 | 0.0% |
| Physical & Health Sciences | 0 | 0.0% |
| Psychology | 0 | 0.0% |
| Social Sciences | 0 | 0.0% |
| Engineering | 0 | 0.0% |
| Multidisciplinary Studies | 0 | 0.0% |
| Science & Technology | 0 | 0.0% |
| Business | 0 | 0.0% |
| Education | 0 | 0.0% |
| Literature & Languages | 0 | 0.0% |
| Liberal Arts & History | 0 | 0.0% |
| Visual & Performing Arts | 0 | 0.0% |
| Communications | 0 | 0.0% |
| Arts & Humanities | 0 | 0.0% |
| Total | 18 | 100.0% |
Transportation & Commute in Cowan
Vehicle Availability by Sex in Cowan
The most prevalent vehicle ownership categories in Cowan are males with 1 vehicle (22, accounting for 100.0%) and females with 1 vehicle (0, making up 61.1%).
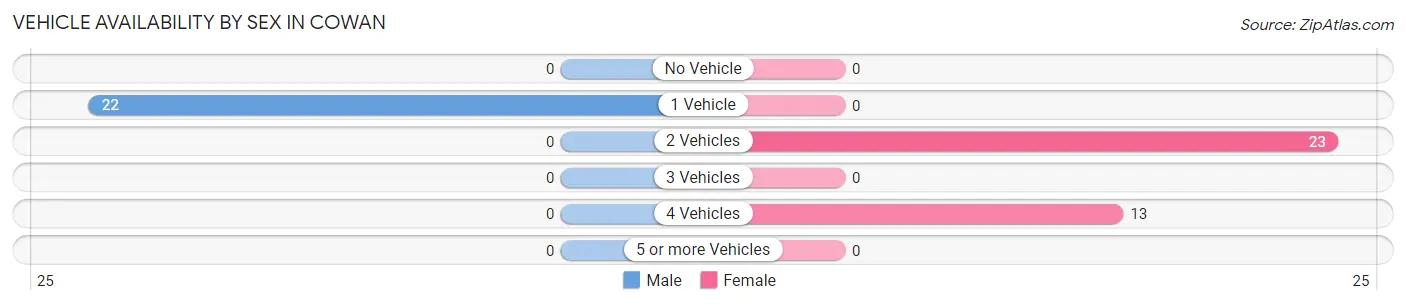
| Vehicles Available | Male | Female |
| No Vehicle | 0 (0.0%) | 0 (0.0%) |
| 1 Vehicle | 22 (100.0%) | 0 (0.0%) |
| 2 Vehicles | 0 (0.0%) | 23 (63.9%) |
| 3 Vehicles | 0 (0.0%) | 0 (0.0%) |
| 4 Vehicles | 0 (0.0%) | 13 (36.1%) |
| 5 or more Vehicles | 0 (0.0%) | 0 (0.0%) |
| Total | 22 (100.0%) | 36 (100.0%) |
Commute Time in Cowan
The most frequently occuring commute durations in Cowan are 15 to 19 minutes (23 commuters, 39.7%), 20 to 24 minutes (22 commuters, 37.9%), and 25 to 29 minutes (13 commuters, 22.4%).
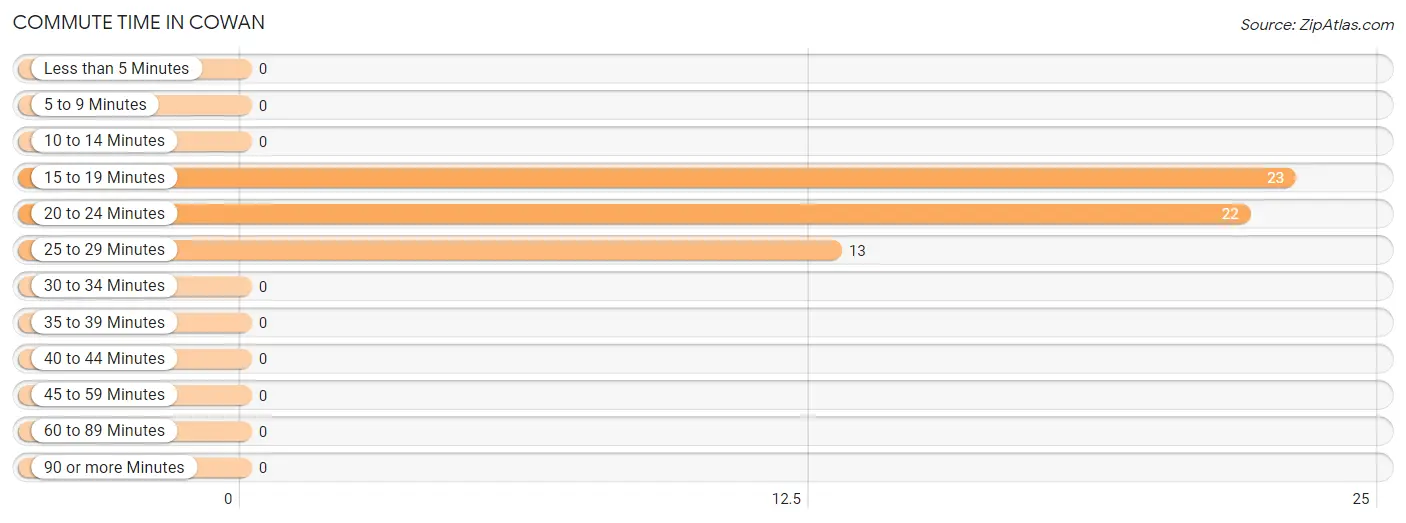
| Commute Time | # Commuters | % Commuters |
| Less than 5 Minutes | 0 | 0.0% |
| 5 to 9 Minutes | 0 | 0.0% |
| 10 to 14 Minutes | 0 | 0.0% |
| 15 to 19 Minutes | 23 | 39.7% |
| 20 to 24 Minutes | 22 | 37.9% |
| 25 to 29 Minutes | 13 | 22.4% |
| 30 to 34 Minutes | 0 | 0.0% |
| 35 to 39 Minutes | 0 | 0.0% |
| 40 to 44 Minutes | 0 | 0.0% |
| 45 to 59 Minutes | 0 | 0.0% |
| 60 to 89 Minutes | 0 | 0.0% |
| 90 or more Minutes | 0 | 0.0% |
Commute Time by Sex in Cowan
The most common commute times in Cowan are 20 to 24 minutes (22 commuters, 100.0%) for males and 15 to 19 minutes (23 commuters, 63.9%) for females.
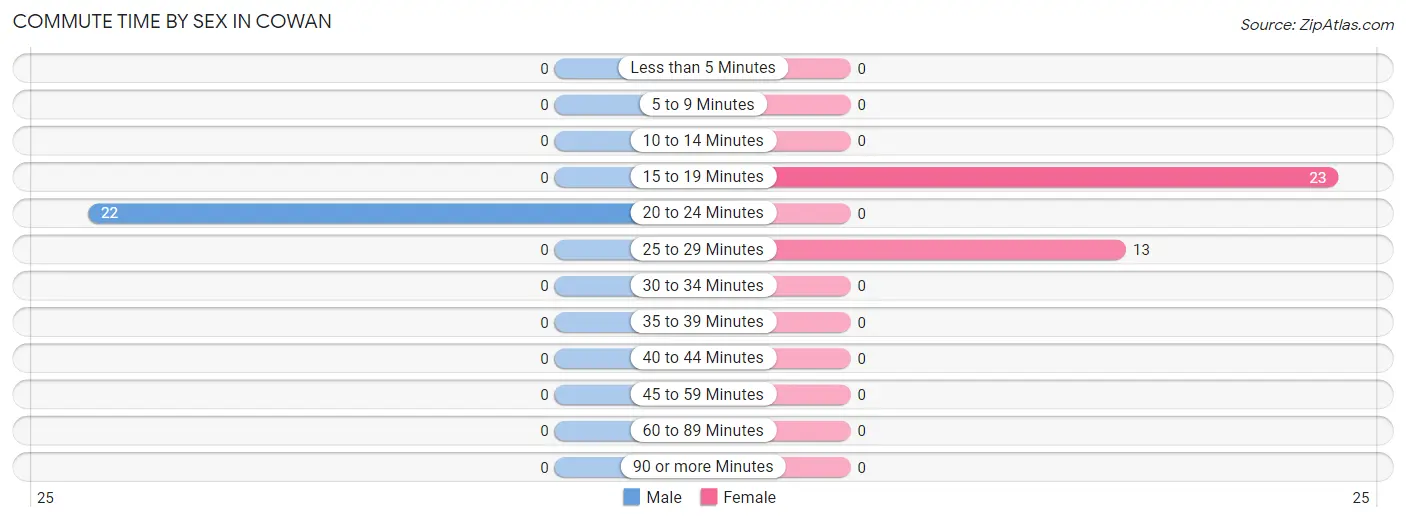
| Commute Time | Male | Female |
| Less than 5 Minutes | 0 (0.0%) | 0 (0.0%) |
| 5 to 9 Minutes | 0 (0.0%) | 0 (0.0%) |
| 10 to 14 Minutes | 0 (0.0%) | 0 (0.0%) |
| 15 to 19 Minutes | 0 (0.0%) | 23 (63.9%) |
| 20 to 24 Minutes | 22 (100.0%) | 0 (0.0%) |
| 25 to 29 Minutes | 0 (0.0%) | 13 (36.1%) |
| 30 to 34 Minutes | 0 (0.0%) | 0 (0.0%) |
| 35 to 39 Minutes | 0 (0.0%) | 0 (0.0%) |
| 40 to 44 Minutes | 0 (0.0%) | 0 (0.0%) |
| 45 to 59 Minutes | 0 (0.0%) | 0 (0.0%) |
| 60 to 89 Minutes | 0 (0.0%) | 0 (0.0%) |
| 90 or more Minutes | 0 (0.0%) | 0 (0.0%) |
Time of Departure to Work by Sex in Cowan
The most frequent times of departure to work in Cowan are 5:30 AM to 5:59 AM (22, 100.0%) for males and 12:00 PM to 3:59 PM (23, 63.9%) for females.
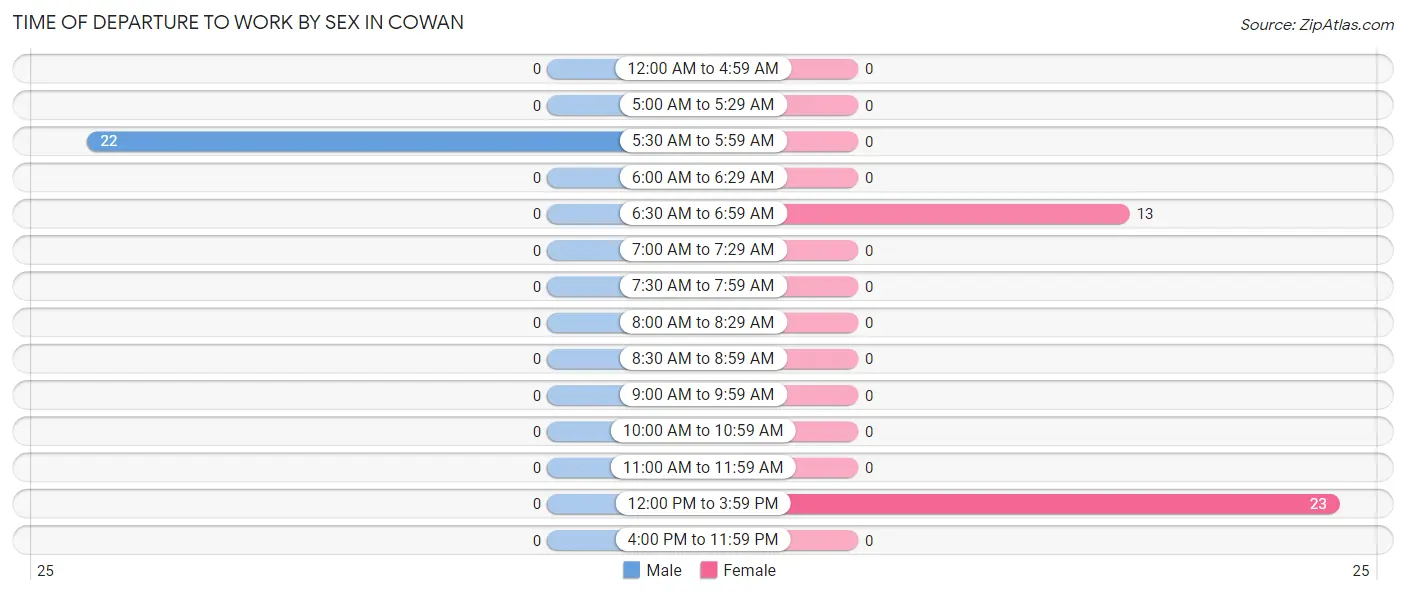
| Time of Departure | Male | Female |
| 12:00 AM to 4:59 AM | 0 (0.0%) | 0 (0.0%) |
| 5:00 AM to 5:29 AM | 0 (0.0%) | 0 (0.0%) |
| 5:30 AM to 5:59 AM | 22 (100.0%) | 0 (0.0%) |
| 6:00 AM to 6:29 AM | 0 (0.0%) | 0 (0.0%) |
| 6:30 AM to 6:59 AM | 0 (0.0%) | 13 (36.1%) |
| 7:00 AM to 7:29 AM | 0 (0.0%) | 0 (0.0%) |
| 7:30 AM to 7:59 AM | 0 (0.0%) | 0 (0.0%) |
| 8:00 AM to 8:29 AM | 0 (0.0%) | 0 (0.0%) |
| 8:30 AM to 8:59 AM | 0 (0.0%) | 0 (0.0%) |
| 9:00 AM to 9:59 AM | 0 (0.0%) | 0 (0.0%) |
| 10:00 AM to 10:59 AM | 0 (0.0%) | 0 (0.0%) |
| 11:00 AM to 11:59 AM | 0 (0.0%) | 0 (0.0%) |
| 12:00 PM to 3:59 PM | 0 (0.0%) | 23 (63.9%) |
| 4:00 PM to 11:59 PM | 0 (0.0%) | 0 (0.0%) |
| Total | 22 (100.0%) | 36 (100.0%) |
Housing Occupancy in Cowan
Occupancy by Ownership in Cowan
Of the total 62 dwellings in Cowan, owner-occupied units account for 62 (100.0%), while renter-occupied units make up 0 (0.0%).
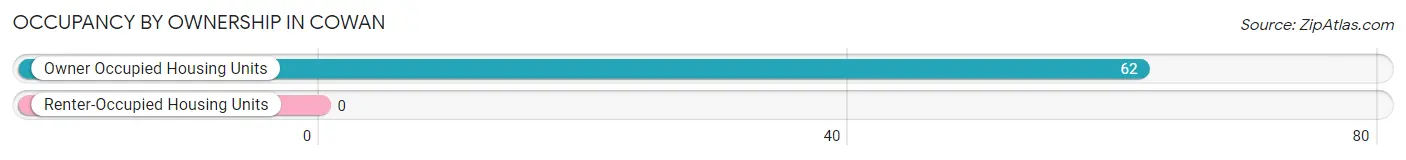
| Occupancy | # Housing Units | % Housing Units |
| Owner Occupied Housing Units | 62 | 100.0% |
| Renter-Occupied Housing Units | 0 | 0.0% |
| Total Occupied Housing Units | 62 | 100.0% |
Occupancy by Household Size in Cowan
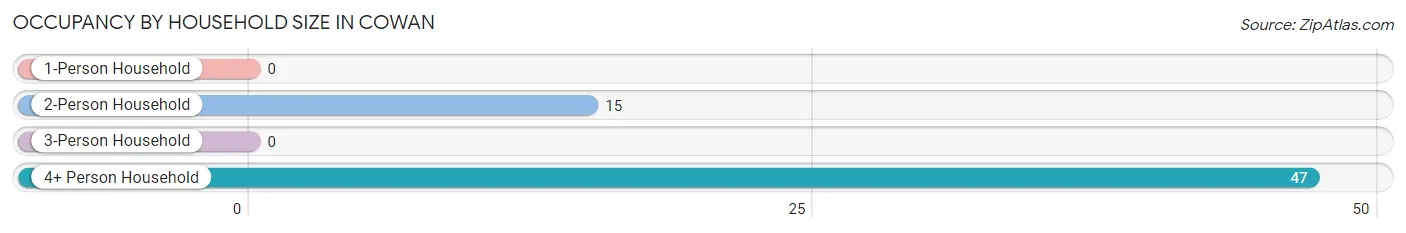
| Household Size | # Housing Units | % Housing Units |
| 1-Person Household | 0 | 0.0% |
| 2-Person Household | 15 | 24.2% |
| 3-Person Household | 0 | 0.0% |
| 4+ Person Household | 47 | 75.8% |
| Total Housing Units | 62 | 100.0% |
Occupancy by Ownership by Household Size in Cowan
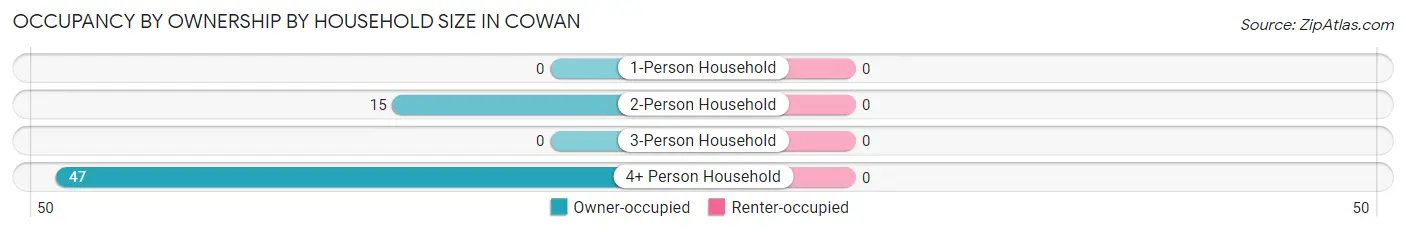
| Household Size | Owner-occupied | Renter-occupied |
| 1-Person Household | 0 (0.0%) | 0 (0.0%) |
| 2-Person Household | 15 (100.0%) | 0 (0.0%) |
| 3-Person Household | 0 (0.0%) | 0 (0.0%) |
| 4+ Person Household | 47 (100.0%) | 0 (0.0%) |
| Total Housing Units | 62 (100.0%) | 0 (0.0%) |
Occupancy by Educational Attainment in Cowan
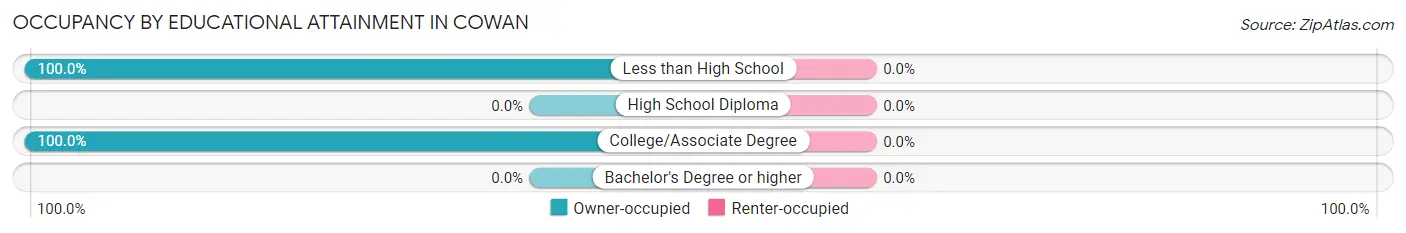
| Household Size | Owner-occupied | Renter-occupied |
| Less than High School | 21 (100.0%) | 0 (0.0%) |
| High School Diploma | 0 (0.0%) | 0 (0.0%) |
| College/Associate Degree | 41 (100.0%) | 0 (0.0%) |
| Bachelor's Degree or higher | 0 (0.0%) | 0 (0.0%) |
Occupancy by Age of Householder in Cowan
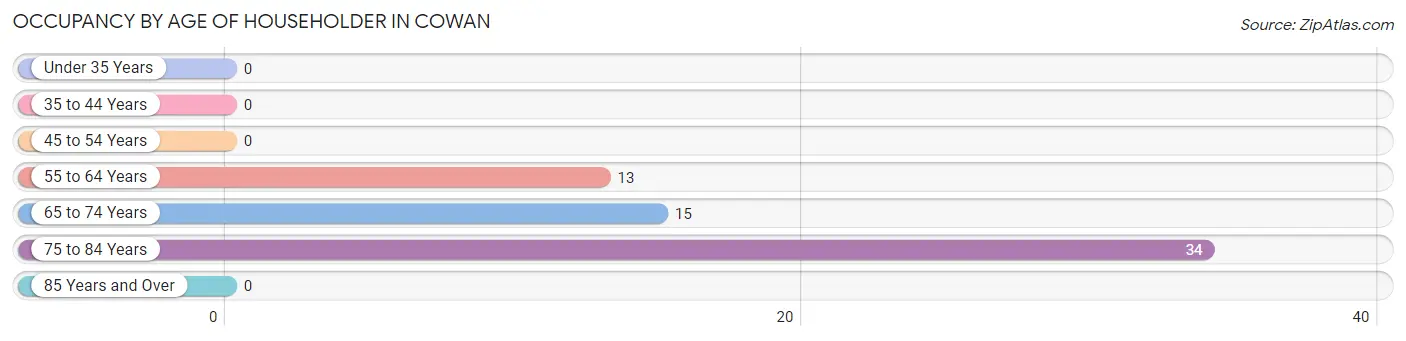
| Age Bracket | # Households | % Households |
| Under 35 Years | 0 | 0.0% |
| 35 to 44 Years | 0 | 0.0% |
| 45 to 54 Years | 0 | 0.0% |
| 55 to 64 Years | 13 | 21.0% |
| 65 to 74 Years | 15 | 24.2% |
| 75 to 84 Years | 34 | 54.8% |
| 85 Years and Over | 0 | 0.0% |
| Total | 62 | 100.0% |
Housing Finances in Cowan
Median Income by Occupancy in Cowan
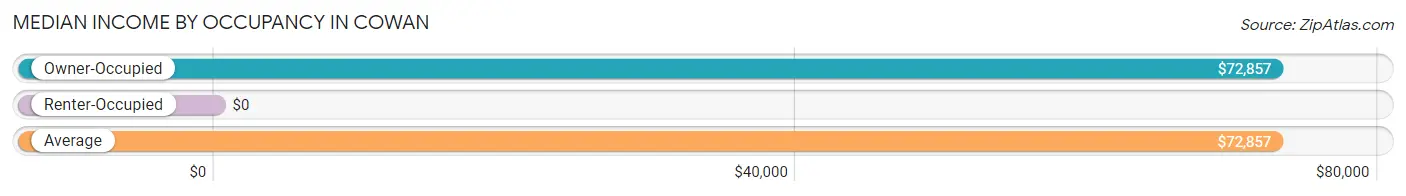
| Occupancy Type | # Households | Median Income |
| Owner-Occupied | 62 (100.0%) | $72,857 |
| Renter-Occupied | 0 (0.0%) | $0 |
| Average | 62 (100.0%) | $72,857 |
Occupancy by Householder Income Bracket in Cowan
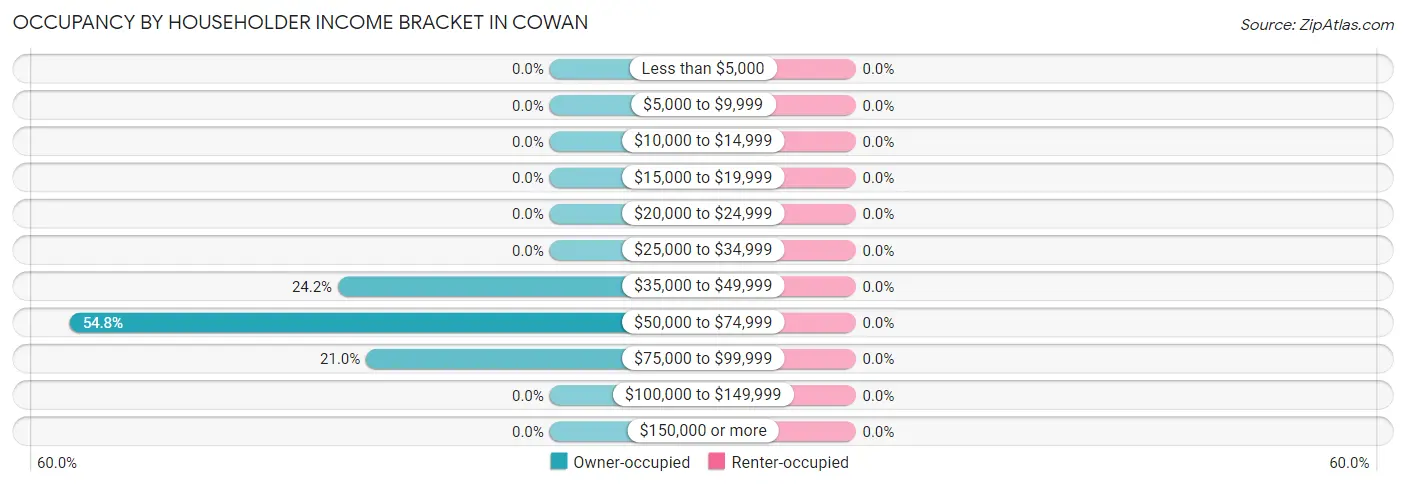
| Income Bracket | Owner-occupied | Renter-occupied |
| Less than $5,000 | 0 (0.0%) | 0 (0.0%) |
| $5,000 to $9,999 | 0 (0.0%) | 0 (0.0%) |
| $10,000 to $14,999 | 0 (0.0%) | 0 (0.0%) |
| $15,000 to $19,999 | 0 (0.0%) | 0 (0.0%) |
| $20,000 to $24,999 | 0 (0.0%) | 0 (0.0%) |
| $25,000 to $34,999 | 0 (0.0%) | 0 (0.0%) |
| $35,000 to $49,999 | 15 (24.2%) | 0 (0.0%) |
| $50,000 to $74,999 | 34 (54.8%) | 0 (0.0%) |
| $75,000 to $99,999 | 13 (21.0%) | 0 (0.0%) |
| $100,000 to $149,999 | 0 (0.0%) | 0 (0.0%) |
| $150,000 or more | 0 (0.0%) | 0 (0.0%) |
| Total | 62 (100.0%) | 0 (0.0%) |
Monthly Housing Cost Tiers in Cowan
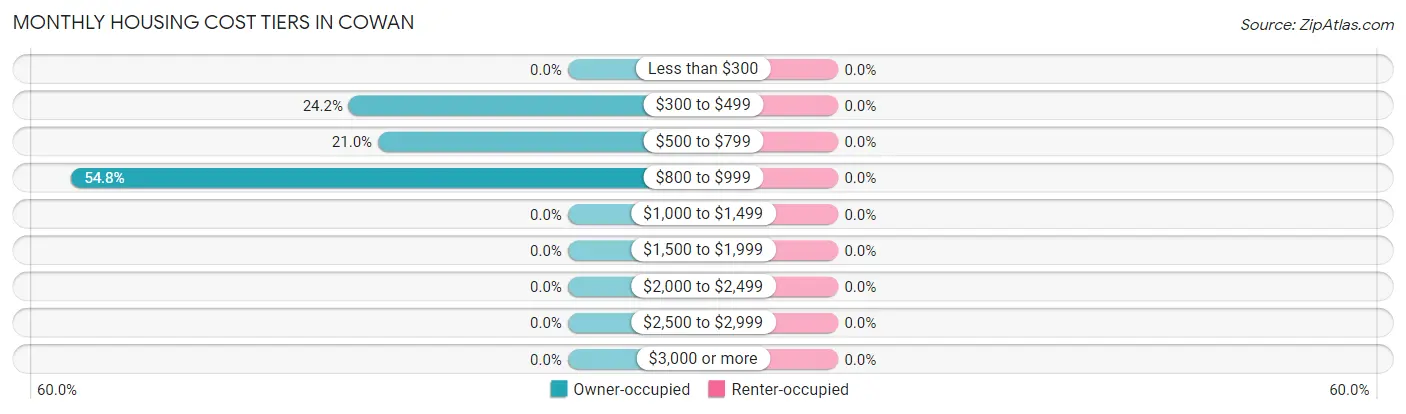
| Monthly Cost | Owner-occupied | Renter-occupied |
| Less than $300 | 0 (0.0%) | 0 (0.0%) |
| $300 to $499 | 15 (24.2%) | 0 (0.0%) |
| $500 to $799 | 13 (21.0%) | 0 (0.0%) |
| $800 to $999 | 34 (54.8%) | 0 (0.0%) |
| $1,000 to $1,499 | 0 (0.0%) | 0 (0.0%) |
| $1,500 to $1,999 | 0 (0.0%) | 0 (0.0%) |
| $2,000 to $2,499 | 0 (0.0%) | 0 (0.0%) |
| $2,500 to $2,999 | 0 (0.0%) | 0 (0.0%) |
| $3,000 or more | 0 (0.0%) | 0 (0.0%) |
| Total | 62 (100.0%) | 0 (0.0%) |
Physical Housing Characteristics in Cowan
Housing Structures in Cowan
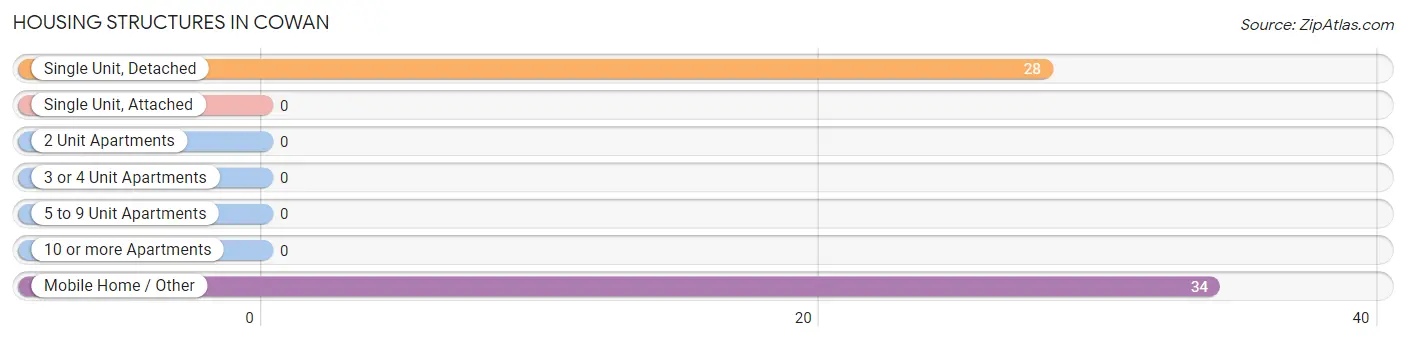
| Structure Type | # Housing Units | % Housing Units |
| Single Unit, Detached | 28 | 45.2% |
| Single Unit, Attached | 0 | 0.0% |
| 2 Unit Apartments | 0 | 0.0% |
| 3 or 4 Unit Apartments | 0 | 0.0% |
| 5 to 9 Unit Apartments | 0 | 0.0% |
| 10 or more Apartments | 0 | 0.0% |
| Mobile Home / Other | 34 | 54.8% |
| Total | 62 | 100.0% |
Housing Structures by Occupancy in Cowan
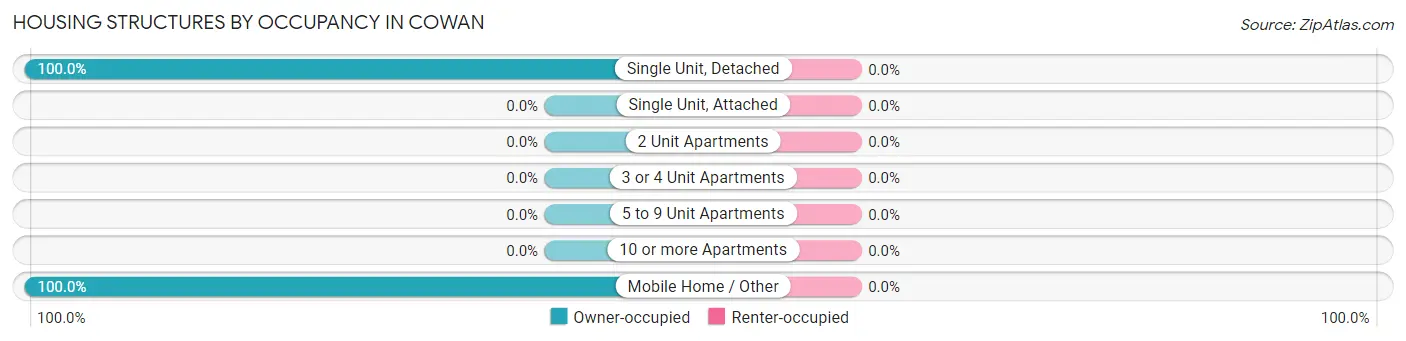
| Structure Type | Owner-occupied | Renter-occupied |
| Single Unit, Detached | 28 (100.0%) | 0 (0.0%) |
| Single Unit, Attached | 0 (0.0%) | 0 (0.0%) |
| 2 Unit Apartments | 0 (0.0%) | 0 (0.0%) |
| 3 or 4 Unit Apartments | 0 (0.0%) | 0 (0.0%) |
| 5 to 9 Unit Apartments | 0 (0.0%) | 0 (0.0%) |
| 10 or more Apartments | 0 (0.0%) | 0 (0.0%) |
| Mobile Home / Other | 34 (100.0%) | 0 (0.0%) |
| Total | 62 (100.0%) | 0 (0.0%) |
Housing Structures by Number of Rooms in Cowan
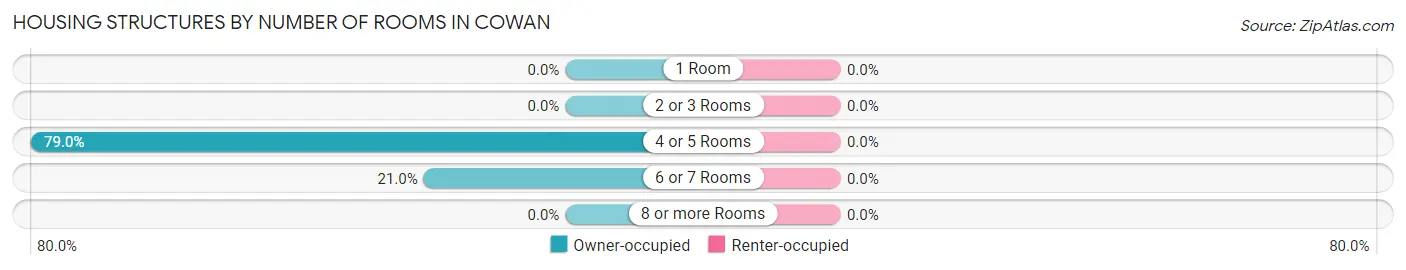
| Number of Rooms | Owner-occupied | Renter-occupied |
| 1 Room | 0 (0.0%) | 0 (0.0%) |
| 2 or 3 Rooms | 0 (0.0%) | 0 (0.0%) |
| 4 or 5 Rooms | 49 (79.0%) | 0 (0.0%) |
| 6 or 7 Rooms | 13 (21.0%) | 0 (0.0%) |
| 8 or more Rooms | 0 (0.0%) | 0 (0.0%) |
| Total | 62 (100.0%) | 0 (0.0%) |
Housing Structure by Heating Type in Cowan
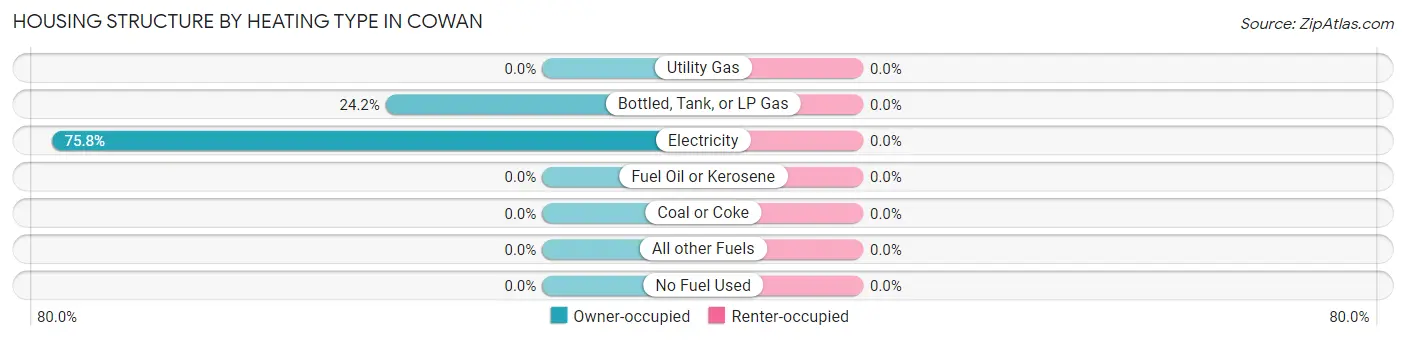
| Heating Type | Owner-occupied | Renter-occupied |
| Utility Gas | 0 (0.0%) | 0 (0.0%) |
| Bottled, Tank, or LP Gas | 15 (24.2%) | 0 (0.0%) |
| Electricity | 47 (75.8%) | 0 (0.0%) |
| Fuel Oil or Kerosene | 0 (0.0%) | 0 (0.0%) |
| Coal or Coke | 0 (0.0%) | 0 (0.0%) |
| All other Fuels | 0 (0.0%) | 0 (0.0%) |
| No Fuel Used | 0 (0.0%) | 0 (0.0%) |
| Total | 62 (100.0%) | 0 (0.0%) |
Household Vehicle Usage in Cowan
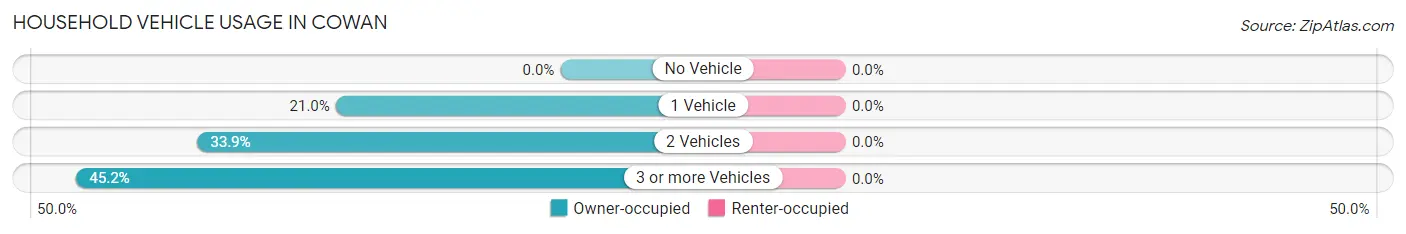
| Vehicles per Household | Owner-occupied | Renter-occupied |
| No Vehicle | 0 (0.0%) | 0 (0.0%) |
| 1 Vehicle | 13 (21.0%) | 0 (0.0%) |
| 2 Vehicles | 21 (33.9%) | 0 (0.0%) |
| 3 or more Vehicles | 28 (45.2%) | 0 (0.0%) |
| Total | 62 (100.0%) | 0 (0.0%) |
Real Estate & Mortgages in Cowan
Real Estate and Mortgage Overview in Cowan
| Characteristic | Without Mortgage | With Mortgage |
| Housing Units | 62 | 0 |
| Median Property Value | $261,900 | $0 |
| Median Household Income | $72,857 | $0 |
| Monthly Housing Costs | $823 | $0 |
| Real Estate Taxes | $1,571 | $0 |
Property Value by Mortgage Status in Cowan
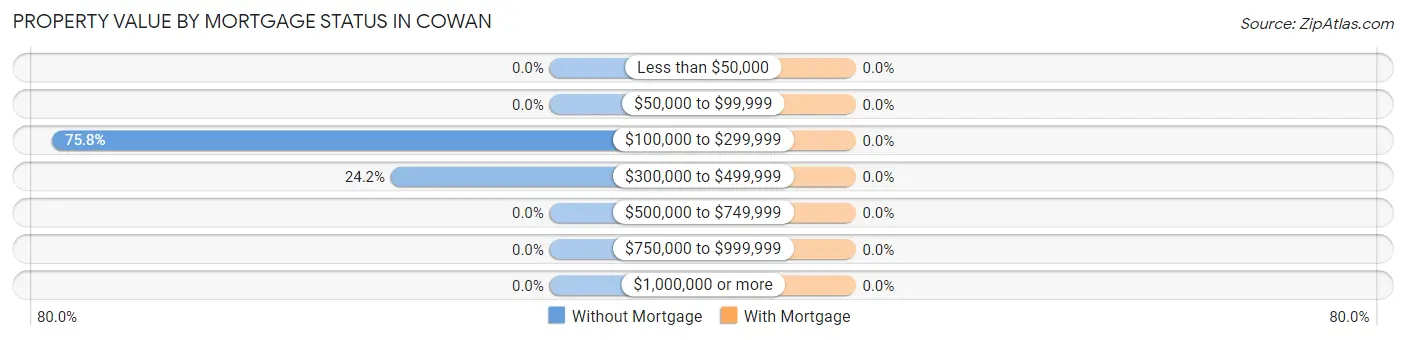
| Property Value | Without Mortgage | With Mortgage |
| Less than $50,000 | 0 (0.0%) | 0 (0.0%) |
| $50,000 to $99,999 | 0 (0.0%) | 0 (0.0%) |
| $100,000 to $299,999 | 47 (75.8%) | 0 (0.0%) |
| $300,000 to $499,999 | 15 (24.2%) | 0 (0.0%) |
| $500,000 to $749,999 | 0 (0.0%) | 0 (0.0%) |
| $750,000 to $999,999 | 0 (0.0%) | 0 (0.0%) |
| $1,000,000 or more | 0 (0.0%) | 0 (0.0%) |
| Total | 62 (100.0%) | 0 (0.0%) |
Household Income by Mortgage Status in Cowan
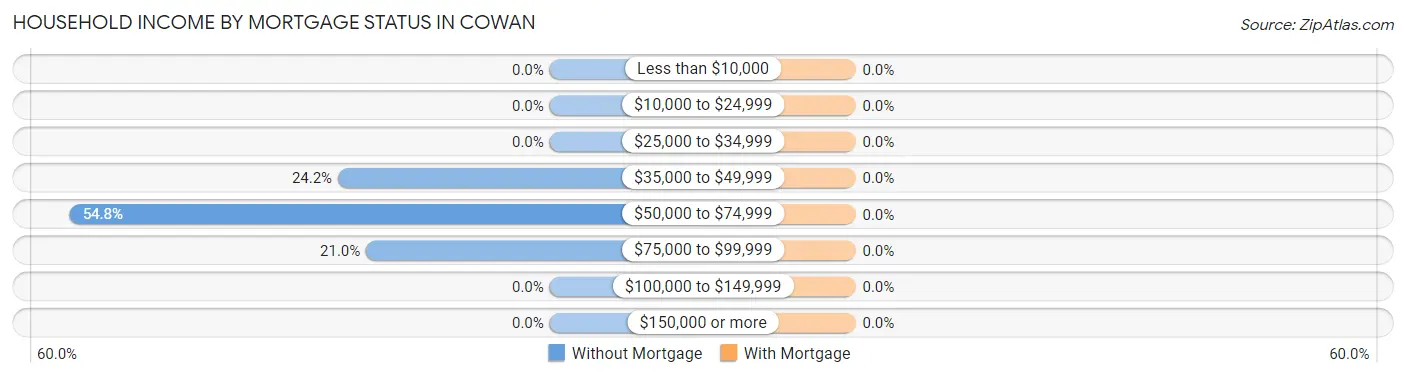
| Household Income | Without Mortgage | With Mortgage |
| Less than $10,000 | 0 (0.0%) | 0 (0.0%) |
| $10,000 to $24,999 | 0 (0.0%) | 0 (0.0%) |
| $25,000 to $34,999 | 0 (0.0%) | 0 (0.0%) |
| $35,000 to $49,999 | 15 (24.2%) | 0 (0.0%) |
| $50,000 to $74,999 | 34 (54.8%) | 0 (0.0%) |
| $75,000 to $99,999 | 13 (21.0%) | 0 (0.0%) |
| $100,000 to $149,999 | 0 (0.0%) | 0 (0.0%) |
| $150,000 or more | 0 (0.0%) | 0 (0.0%) |
| Total | 62 (100.0%) | 0 (0.0%) |
Property Value to Household Income Ratio in Cowan
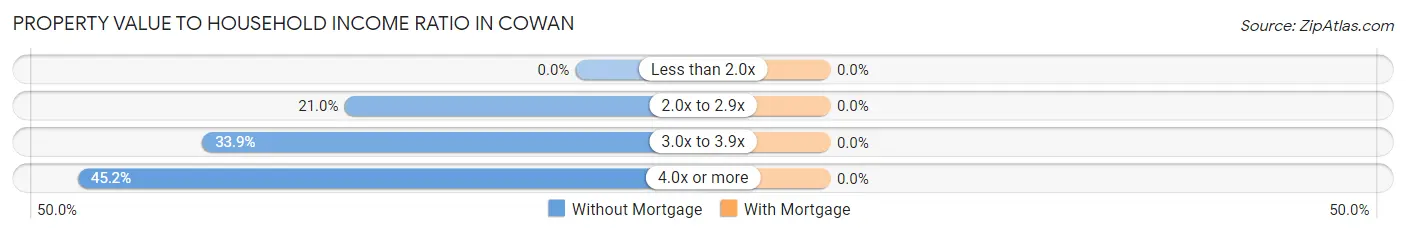
| Value-to-Income Ratio | Without Mortgage | With Mortgage |
| Less than 2.0x | 0 (0.0%) | 0 (0.0%) |
| 2.0x to 2.9x | 13 (21.0%) | 0 (0.0%) |
| 3.0x to 3.9x | 21 (33.9%) | 0 (0.0%) |
| 4.0x or more | 28 (45.2%) | 0 (0.0%) |
| Total | 62 (100.0%) | 0 (0.0%) |
Real Estate Taxes by Mortgage Status in Cowan
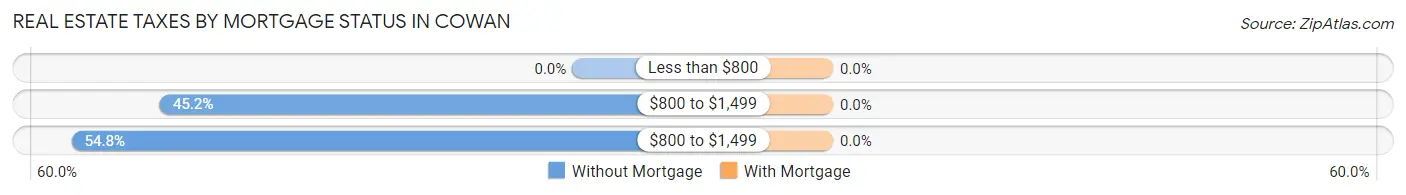
| Property Taxes | Without Mortgage | With Mortgage |
| Less than $800 | 0 (0.0%) | 0 (0.0%) |
| $800 to $1,499 | 28 (45.2%) | 0 (0.0%) |
| $800 to $1,499 | 34 (54.8%) | 0 (0.0%) |
| Total | 62 (100.0%) | 0 (0.0%) |
Health & Disability in Cowan
Health Insurance Coverage by Age in Cowan
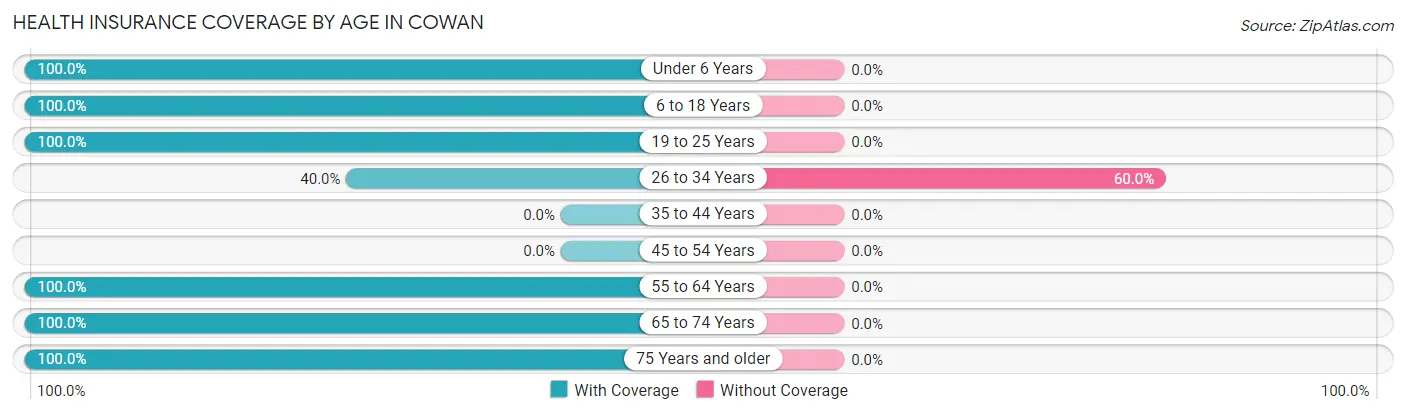
| Age Bracket | With Coverage | Without Coverage |
| Under 6 Years | 18 (100.0%) | 0 (0.0%) |
| 6 to 18 Years | 39 (100.0%) | 0 (0.0%) |
| 19 to 25 Years | 22 (100.0%) | 0 (0.0%) |
| 26 to 34 Years | 34 (40.0%) | 51 (60.0%) |
| 35 to 44 Years | 0 (0.0%) | 0 (0.0%) |
| 45 to 54 Years | 0 (0.0%) | 0 (0.0%) |
| 55 to 64 Years | 37 (100.0%) | 0 (0.0%) |
| 65 to 74 Years | 28 (100.0%) | 0 (0.0%) |
| 75 Years and older | 34 (100.0%) | 0 (0.0%) |
| Total | 212 (80.6%) | 51 (19.4%) |
Health Insurance Coverage by Citizenship Status in Cowan
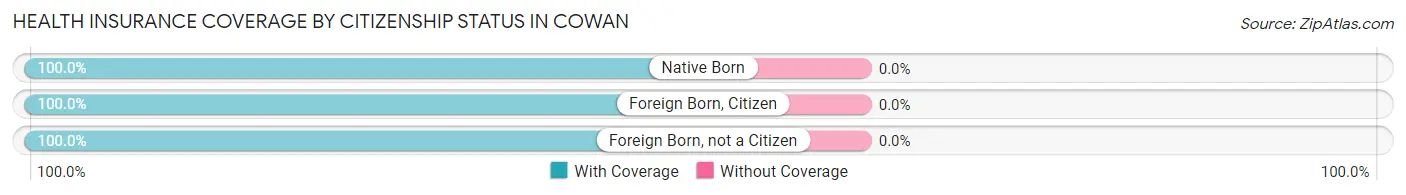
| Citizenship Status | With Coverage | Without Coverage |
| Native Born | 18 (100.0%) | 0 (0.0%) |
| Foreign Born, Citizen | 39 (100.0%) | 0 (0.0%) |
| Foreign Born, not a Citizen | 22 (100.0%) | 0 (0.0%) |
Health Insurance Coverage by Household Income in Cowan
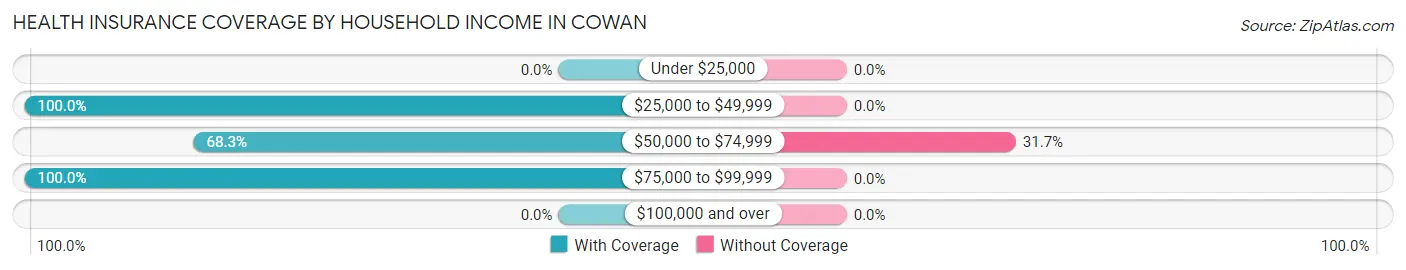
| Household Income | With Coverage | Without Coverage |
| Under $25,000 | 0 (0.0%) | 0 (0.0%) |
| $25,000 to $49,999 | 33 (100.0%) | 0 (0.0%) |
| $50,000 to $74,999 | 110 (68.3%) | 51 (31.7%) |
| $75,000 to $99,999 | 69 (100.0%) | 0 (0.0%) |
| $100,000 and over | 0 (0.0%) | 0 (0.0%) |
Public vs Private Health Insurance Coverage by Age in Cowan
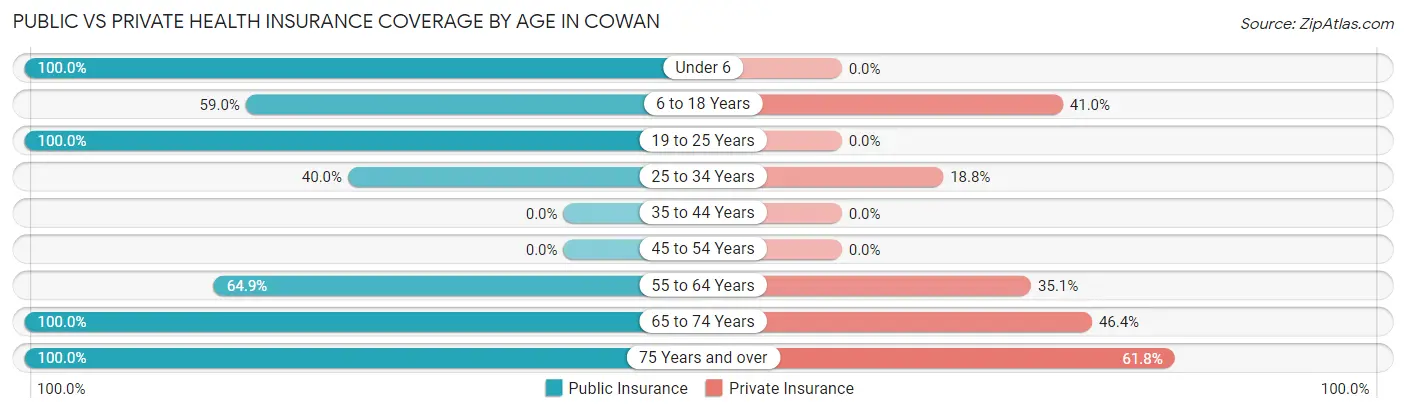
| Age Bracket | Public Insurance | Private Insurance |
| Under 6 | 18 (100.0%) | 0 (0.0%) |
| 6 to 18 Years | 23 (59.0%) | 16 (41.0%) |
| 19 to 25 Years | 22 (100.0%) | 0 (0.0%) |
| 25 to 34 Years | 34 (40.0%) | 16 (18.8%) |
| 35 to 44 Years | 0 (0.0%) | 0 (0.0%) |
| 45 to 54 Years | 0 (0.0%) | 0 (0.0%) |
| 55 to 64 Years | 24 (64.9%) | 13 (35.1%) |
| 65 to 74 Years | 28 (100.0%) | 13 (46.4%) |
| 75 Years and over | 34 (100.0%) | 21 (61.8%) |
| Total | 183 (69.6%) | 79 (30.0%) |
Disability Status by Sex by Age in Cowan
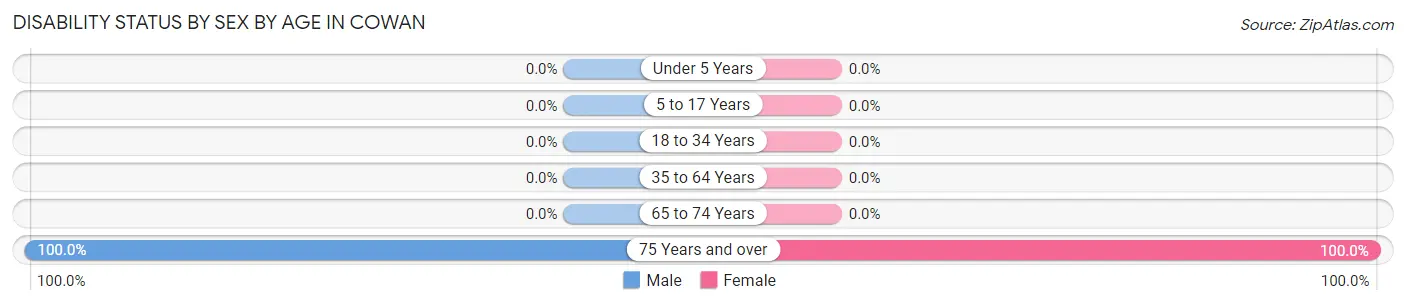
| Age Bracket | Male | Female |
| Under 5 Years | 0 (0.0%) | 0 (0.0%) |
| 5 to 17 Years | 0 (0.0%) | 0 (0.0%) |
| 18 to 34 Years | 0 (0.0%) | 0 (0.0%) |
| 35 to 64 Years | 0 (0.0%) | 0 (0.0%) |
| 65 to 74 Years | 0 (0.0%) | 0 (0.0%) |
| 75 Years and over | 13 (100.0%) | 21 (100.0%) |
Disability Class by Sex by Age in Cowan
Disability Class: Hearing Difficulty
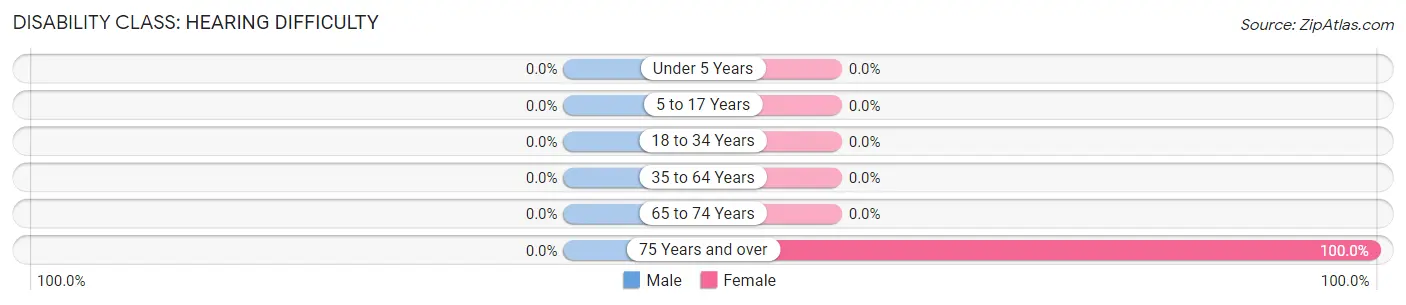
| Age Bracket | Male | Female |
| Under 5 Years | 0 (0.0%) | 0 (0.0%) |
| 5 to 17 Years | 0 (0.0%) | 0 (0.0%) |
| 18 to 34 Years | 0 (0.0%) | 0 (0.0%) |
| 35 to 64 Years | 0 (0.0%) | 0 (0.0%) |
| 65 to 74 Years | 0 (0.0%) | 0 (0.0%) |
| 75 Years and over | 0 (0.0%) | 21 (100.0%) |
Disability Class: Vision Difficulty
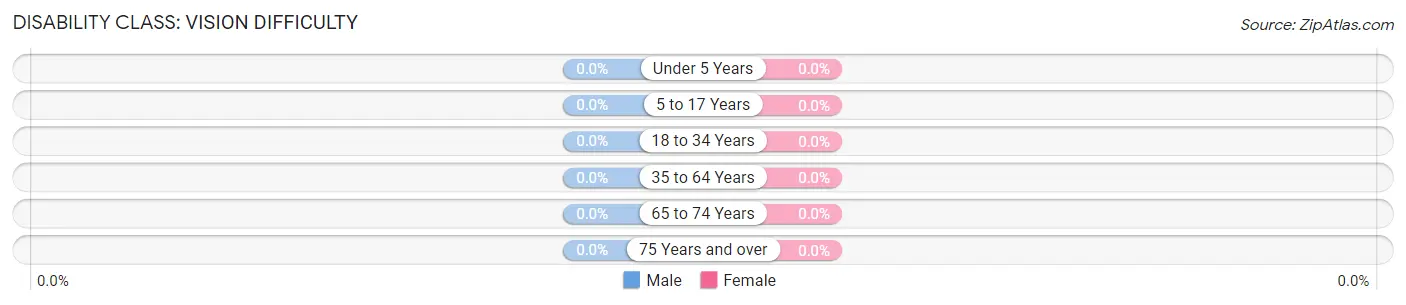
| Age Bracket | Male | Female |
| Under 5 Years | 0 (0.0%) | 0 (0.0%) |
| 5 to 17 Years | 0 (0.0%) | 0 (0.0%) |
| 18 to 34 Years | 0 (0.0%) | 0 (0.0%) |
| 35 to 64 Years | 0 (0.0%) | 0 (0.0%) |
| 65 to 74 Years | 0 (0.0%) | 0 (0.0%) |
| 75 Years and over | 0 (0.0%) | 0 (0.0%) |
Disability Class: Cognitive Difficulty
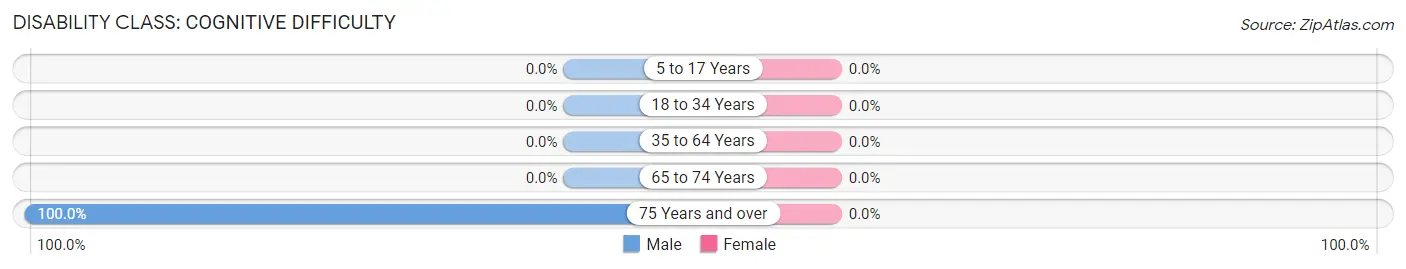
| Age Bracket | Male | Female |
| 5 to 17 Years | 0 (0.0%) | 0 (0.0%) |
| 18 to 34 Years | 0 (0.0%) | 0 (0.0%) |
| 35 to 64 Years | 0 (0.0%) | 0 (0.0%) |
| 65 to 74 Years | 0 (0.0%) | 0 (0.0%) |
| 75 Years and over | 13 (100.0%) | 0 (0.0%) |
Disability Class: Ambulatory Difficulty
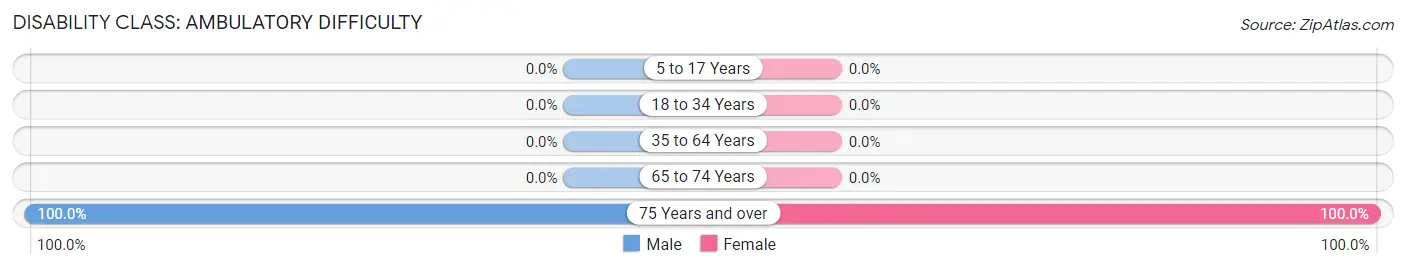
| Age Bracket | Male | Female |
| 5 to 17 Years | 0 (0.0%) | 0 (0.0%) |
| 18 to 34 Years | 0 (0.0%) | 0 (0.0%) |
| 35 to 64 Years | 0 (0.0%) | 0 (0.0%) |
| 65 to 74 Years | 0 (0.0%) | 0 (0.0%) |
| 75 Years and over | 13 (100.0%) | 21 (100.0%) |
Disability Class: Self-Care Difficulty
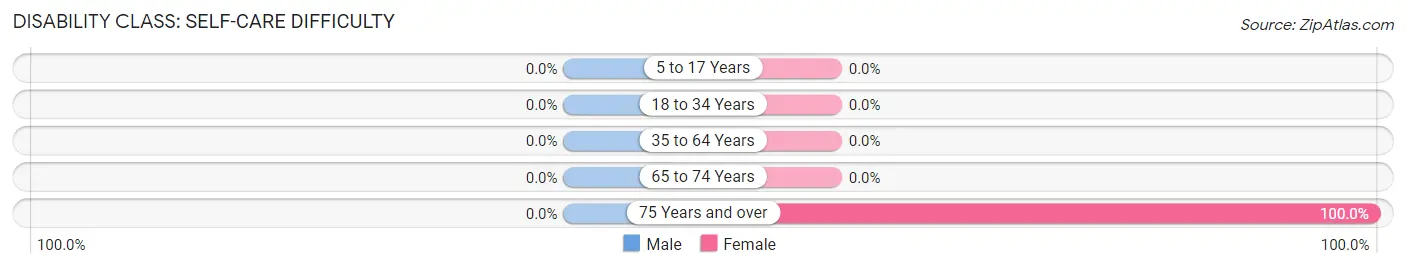
| Age Bracket | Male | Female |
| 5 to 17 Years | 0 (0.0%) | 0 (0.0%) |
| 18 to 34 Years | 0 (0.0%) | 0 (0.0%) |
| 35 to 64 Years | 0 (0.0%) | 0 (0.0%) |
| 65 to 74 Years | 0 (0.0%) | 0 (0.0%) |
| 75 Years and over | 0 (0.0%) | 21 (100.0%) |
Technology Access in Cowan
Computing Device Access in Cowan
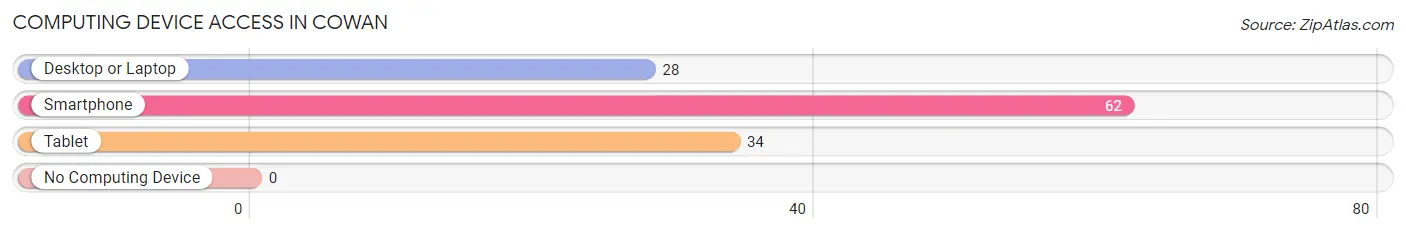
| Device Type | # Households | % Households |
| Desktop or Laptop | 28 | 45.2% |
| Smartphone | 62 | 100.0% |
| Tablet | 34 | 54.8% |
| No Computing Device | 0 | 0.0% |
| Total | 62 | 100.0% |
Internet Access in Cowan
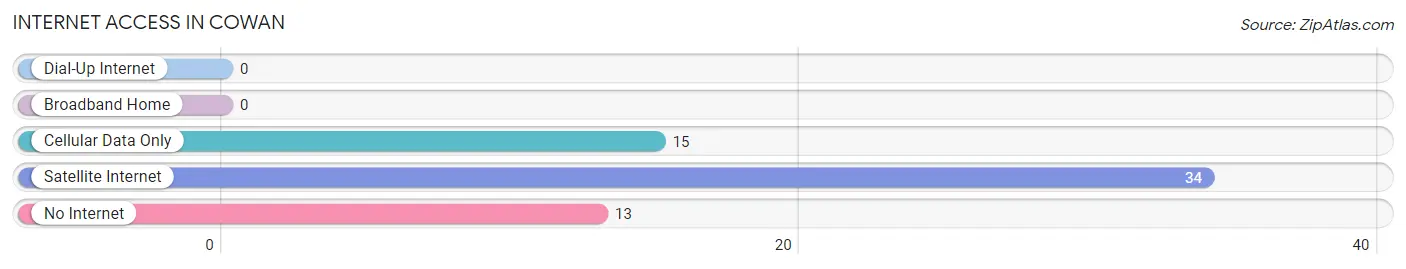
| Internet Type | # Households | % Households |
| Dial-Up Internet | 0 | 0.0% |
| Broadband Home | 0 | 0.0% |
| Cellular Data Only | 15 | 24.2% |
| Satellite Internet | 34 | 54.8% |
| No Internet | 13 | 21.0% |
| Total | 62 | 100.0% |
Cowan Summary
History
The small town of Cowan, California is located in the Sierra Nevada foothills of El Dorado County. It was founded in 1849 by a group of miners who were searching for gold. The town was named after a local miner, John Cowan, who was one of the first to discover gold in the area. The town quickly grew and by the late 1800s, it had become a bustling mining town with a population of over 1,000 people.
The town was home to several businesses, including a hotel, saloon, general store, and a post office. The town also had a school, which was built in 1876. The school was the first in the area and served as a hub for the community.
In the early 1900s, the town began to decline as the gold rush ended and the population dwindled. By the 1950s, the population had dropped to just over 200 people. The town was mostly abandoned and the buildings were left to decay.
In the late 1970s, the town was rediscovered by a group of artists and musicians who were looking for a place to live and work. They began to restore the old buildings and the town slowly began to come back to life. Today, Cowan is a thriving community with a population of over 500 people.
Geography
Cowan is located in the Sierra Nevada foothills of El Dorado County, California. It is situated at an elevation of 2,400 feet and is surrounded by rolling hills and lush forests. The town is located about 30 miles east of Sacramento and is accessible by Highway 50.
The climate in Cowan is mild and temperate, with hot summers and cool winters. The average temperature in the summer is around 80 degrees Fahrenheit and the average temperature in the winter is around 40 degrees Fahrenheit.
Economy
The economy of Cowan is largely based on tourism. The town is a popular destination for outdoor enthusiasts, as it is surrounded by hiking trails, lakes, and rivers. The town also has several wineries and vineyards, which attract visitors from all over the world.
In addition to tourism, the town is also home to several small businesses, including restaurants, shops, and galleries. The town also has a small manufacturing sector, which produces furniture and other wood products.
Demographics
As of the 2010 census, the population of Cowan was 514 people. The racial makeup of the town was 94.3% White, 0.6% African American, 0.4% Native American, 0.8% Asian, 0.2% Pacific Islander, and 3.7% from other races. The median household income was $50,000 and the median age was 44.
Conclusion
Cowan, California is a small town located in the Sierra Nevada foothills of El Dorado County. It was founded in 1849 by a group of miners and quickly grew into a bustling mining town. In the 1950s, the population dwindled and the town was mostly abandoned. In the late 1970s, the town was rediscovered by a group of artists and musicians and has since become a thriving community. The economy of Cowan is largely based on tourism and the town is home to several small businesses. The population of Cowan is 514 people, with a median household income of $50,000 and a median age of 44.
Common Questions
What is Per Capita Income in Cowan?
Per Capita income in Cowan is $16,377.
What is the Median Family Income in Cowan?
Median Family Income in Cowan is $72,857.
What is the Median Household income in Cowan?
Median Household Income in Cowan is $72,857.
What is Inequality or Gini Index in Cowan?
Inequality or Gini Index in Cowan is 0.14.
What is the Total Population of Cowan?
Total Population of Cowan is 263.
What is the Total Male Population of Cowan?
Total Male Population of Cowan is 135.
What is the Total Female Population of Cowan?
Total Female Population of Cowan is 128.
What is the Ratio of Males per 100 Females in Cowan?
There are 105.47 Males per 100 Females in Cowan.
What is the Ratio of Females per 100 Males in Cowan?
There are 94.81 Females per 100 Males in Cowan.
What is the Median Population Age in Cowan?
Median Population Age in Cowan is 27.8 Years.
What is the Average Family Size in Cowan
Average Family Size in Cowan is 4.2 People.
What is the Average Household Size in Cowan
Average Household Size in Cowan is 4.2 People.
How Large is the Labor Force in Cowan?
There are 124 People in the Labor Forcein in Cowan.
What is the Percentage of People in the Labor Force in Cowan?
54.1% of People are in the Labor Force in Cowan.
What is the Unemployment Rate in Cowan?
Unemployment Rate in Cowan is 41.1%.