Cities with the Highest Percentage of Population Employed in Food Preparation & Serving in Vermont
RELATED REPORTS & OPTIONS
Food Preparation & Serving
Vermont
Compare Cities
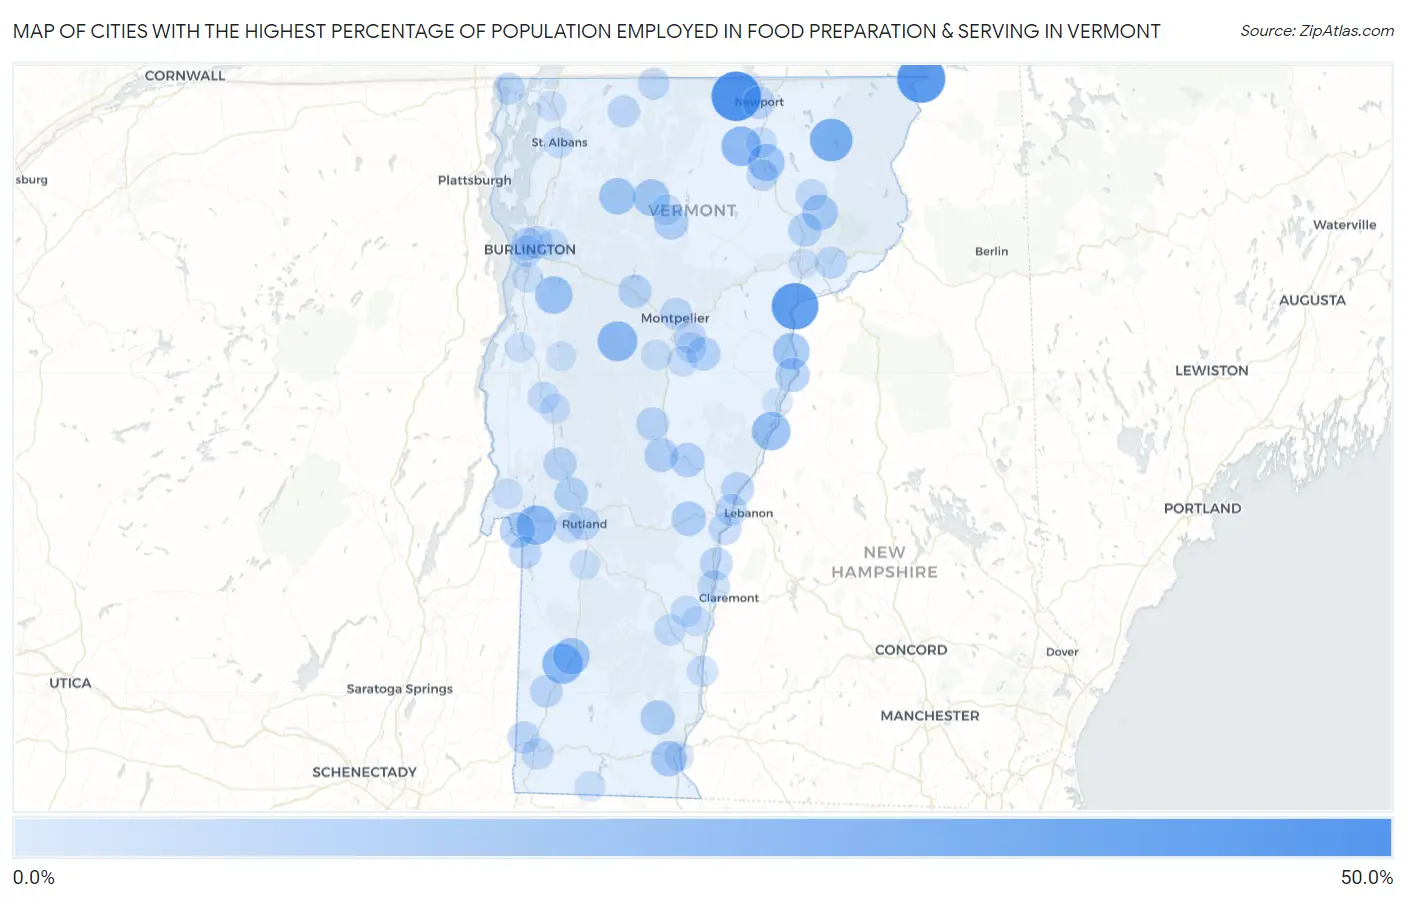
Map of Cities with the Highest Percentage of Population Employed in Food Preparation & Serving in Vermont
0.0%
50.0%
Cities with the Highest Percentage of Population Employed in Food Preparation & Serving in Vermont
| City | % Employed | vs State | vs National | |
| 1. | South Woodstock | 41.7% | 5.3%(+36.4)#1 | 5.3%(+36.4)#171 |
| 2. | Newport Center | 41.3% | 5.3%(+36.0)#2 | 5.3%(+36.0)#176 |
| 3. | Beecher Falls | 38.5% | 5.3%(+33.2)#3 | 5.3%(+33.2)#203 |
| 4. | Barnet | 35.5% | 5.3%(+30.2)#4 | 5.3%(+30.2)#244 |
| 5. | North Clarendon | 28.4% | 5.3%(+23.1)#5 | 5.3%(+23.1)#388 |
| 6. | Island Pond | 27.2% | 5.3%(+21.9)#6 | 5.3%(+21.9)#423 |
| 7. | South Londonderry | 23.7% | 5.3%(+18.4)#7 | 5.3%(+18.4)#571 |
| 8. | Manchester | 22.3% | 5.3%(+17.0)#8 | 5.3%(+17.0)#654 |
| 9. | West Dummerston | 22.2% | 5.3%(+17.0)#9 | 5.3%(+16.9)#668 |
| 10. | Waitsfield | 21.6% | 5.3%(+16.3)#10 | 5.3%(+16.3)#706 |
| 11. | Irasburg | 21.2% | 5.3%(+16.0)#11 | 5.3%(+16.0)#721 |
| 12. | Hartford | 20.8% | 5.3%(+15.5)#12 | 5.3%(+15.5)#759 |
| 13. | Castleton | 20.7% | 5.3%(+15.4)#13 | 5.3%(+15.4)#763 |
| 14. | Fairlee | 19.0% | 5.3%(+13.7)#14 | 5.3%(+13.7)#954 |
| 15. | Castleton Four Corners | 18.8% | 5.3%(+13.5)#15 | 5.3%(+13.5)#966 |
| 16. | Hinesburg | 16.8% | 5.3%(+11.5)#16 | 5.3%(+11.5)#1,233 |
| 17. | Lincoln | 16.3% | 5.3%(+11.0)#17 | 5.3%(+11.0)#1,341 |
| 18. | Barton | 15.9% | 5.3%(+10.6)#18 | 5.3%(+10.6)#1,429 |
| 19. | Manchester Center | 15.5% | 5.3%(+10.2)#19 | 5.3%(+10.2)#1,503 |
| 20. | Wells River | 15.3% | 5.3%(+9.98)#20 | 5.3%(+9.97)#1,567 |
| 21. | Johnson | 15.1% | 5.3%(+9.79)#21 | 5.3%(+9.77)#1,612 |
| 22. | Jeffersonville | 14.7% | 5.3%(+9.38)#22 | 5.3%(+9.37)#1,720 |
| 23. | East Burke | 13.3% | 5.3%(+7.98)#23 | 5.3%(+7.97)#2,159 |
| 24. | West Brattleboro | 13.2% | 5.3%(+7.94)#24 | 5.3%(+7.92)#2,175 |
| 25. | Fair Haven | 12.6% | 5.3%(+7.31)#25 | 5.3%(+7.30)#2,452 |
| 26. | West Woodstock | 12.6% | 5.3%(+7.29)#26 | 5.3%(+7.27)#2,462 |
| 27. | North Hyde Park | 12.6% | 5.3%(+7.28)#27 | 5.3%(+7.26)#2,464 |
| 28. | Newfane | 11.4% | 5.3%(+6.13)#28 | 5.3%(+6.12)#3,128 |
| 29. | Algiers | 11.3% | 5.3%(+6.08)#29 | 5.3%(+6.06)#3,166 |
| 30. | Woodstock | 11.3% | 5.3%(+6.04)#30 | 5.3%(+6.02)#3,193 |
| 31. | Morrisville | 10.9% | 5.3%(+5.64)#31 | 5.3%(+5.63)#3,434 |
| 32. | Newbury | 10.8% | 5.3%(+5.54)#32 | 5.3%(+5.52)#3,505 |
| 33. | South Royalton | 10.6% | 5.3%(+5.37)#33 | 5.3%(+5.35)#3,628 |
| 34. | Bethel | 10.5% | 5.3%(+5.20)#34 | 5.3%(+5.18)#3,747 |
| 35. | Killington | 10.2% | 5.3%(+4.98)#35 | 5.3%(+4.96)#3,901 |
| 36. | Lyndonville | 9.6% | 5.3%(+4.35)#36 | 5.3%(+4.33)#4,423 |
| 37. | Pittsford | 9.5% | 5.3%(+4.23)#37 | 5.3%(+4.22)#4,533 |
| 38. | East Barre | 9.4% | 5.3%(+4.15)#38 | 5.3%(+4.14)#4,612 |
| 39. | New Haven | 9.2% | 5.3%(+3.89)#39 | 5.3%(+3.87)#4,876 |
| 40. | Waterbury | 8.8% | 5.3%(+3.56)#40 | 5.3%(+3.54)#5,278 |
| 41. | Norwich | 8.7% | 5.3%(+3.39)#41 | 5.3%(+3.38)#5,480 |
| 42. | Brandon | 8.6% | 5.3%(+3.34)#42 | 5.3%(+3.33)#5,535 |
| 43. | Randolph | 8.4% | 5.3%(+3.14)#43 | 5.3%(+3.12)#5,773 |
| 44. | Rutland | 8.0% | 5.3%(+2.75)#44 | 5.3%(+2.73)#6,307 |
| 45. | Windsor | 8.0% | 5.3%(+2.71)#45 | 5.3%(+2.69)#6,368 |
| 46. | Winooski | 8.0% | 5.3%(+2.70)#46 | 5.3%(+2.68)#6,387 |
| 47. | Huntington | 7.7% | 5.3%(+2.39)#47 | 5.3%(+2.38)#6,893 |
| 48. | Newport | 7.7% | 5.3%(+2.39)#48 | 5.3%(+2.37)#6,903 |
| 49. | Burlington | 7.6% | 5.3%(+2.35)#49 | 5.3%(+2.34)#6,961 |
| 50. | Arlington | 7.6% | 5.3%(+2.34)#50 | 5.3%(+2.32)#6,981 |
| 51. | Huntington Center | 7.5% | 5.3%(+2.26)#51 | 5.3%(+2.24)#7,096 |
| 52. | Bolton Valley | 7.5% | 5.3%(+2.25)#52 | 5.3%(+2.23)#7,105 |
| 53. | North Hartland | 7.3% | 5.3%(+2.06)#53 | 5.3%(+2.04)#7,400 |
| 54. | Concord | 7.2% | 5.3%(+1.94)#54 | 5.3%(+1.92)#7,605 |
| 55. | St. George | 7.2% | 5.3%(+1.91)#55 | 5.3%(+1.89)#7,652 |
| 56. | Poultney | 7.1% | 5.3%(+1.81)#56 | 5.3%(+1.80)#7,852 |
| 57. | Enosburg Falls | 6.9% | 5.3%(+1.62)#57 | 5.3%(+1.60)#8,224 |
| 58. | North Bennington | 6.9% | 5.3%(+1.59)#58 | 5.3%(+1.58)#8,264 |
| 59. | Wolcott | 6.7% | 5.3%(+1.40)#59 | 5.3%(+1.38)#8,699 |
| 60. | Montpelier | 6.6% | 5.3%(+1.31)#60 | 5.3%(+1.29)#8,905 |
| 61. | White River Junction | 6.6% | 5.3%(+1.29)#61 | 5.3%(+1.28)#8,939 |
| 62. | Alburgh | 6.4% | 5.3%(+1.15)#62 | 5.3%(+1.14)#9,289 |
| 63. | Barre | 6.3% | 5.3%(+1.06)#63 | 5.3%(+1.04)#9,500 |
| 64. | Ascutney | 6.2% | 5.3%(+0.979)#64 | 5.3%(+0.964)#9,665 |
| 65. | Richford | 6.2% | 5.3%(+0.886)#65 | 5.3%(+0.870)#9,909 |
| 66. | Glover | 6.2% | 5.3%(+0.883)#66 | 5.3%(+0.868)#9,925 |
| 67. | Bennington | 6.1% | 5.3%(+0.849)#67 | 5.3%(+0.834)#10,025 |
| 68. | Danby | 6.1% | 5.3%(+0.790)#68 | 5.3%(+0.775)#10,173 |
| 69. | South Burlington | 5.9% | 5.3%(+0.656)#69 | 5.3%(+0.641)#10,507 |
| 70. | West Burke | 5.9% | 5.3%(+0.611)#70 | 5.3%(+0.596)#10,612 |
| 71. | Middlebury | 5.8% | 5.3%(+0.497)#71 | 5.3%(+0.482)#10,892 |
| 72. | Harmonyville | 5.7% | 5.3%(+0.462)#72 | 5.3%(+0.446)#10,989 |
| 73. | Chester | 5.3% | 5.3%(+0.052)#73 | 5.3%(+0.037)#12,098 |
| 74. | Bellows Falls | 5.2% | 5.3%(-0.113)#74 | 5.3%(-0.129)#12,556 |
| 75. | North Springfield | 4.9% | 5.3%(-0.363)#75 | 5.3%(-0.378)#13,285 |
| 76. | Hyde Park | 4.7% | 5.3%(-0.576)#76 | 5.3%(-0.591)#13,908 |
| 77. | Essex Junction | 4.7% | 5.3%(-0.598)#77 | 5.3%(-0.613)#13,981 |
| 78. | Orleans | 4.6% | 5.3%(-0.659)#78 | 5.3%(-0.674)#14,145 |
| 79. | St Albans | 4.4% | 5.3%(-0.833)#79 | 5.3%(-0.848)#14,633 |
| 80. | Bakersfield | 4.3% | 5.3%(-0.961)#80 | 5.3%(-0.976)#15,011 |
| 81. | Proctor | 4.3% | 5.3%(-1.00)#81 | 5.3%(-1.02)#15,154 |
| 82. | South Barre | 4.2% | 5.3%(-1.08)#82 | 5.3%(-1.09)#15,358 |
| 83. | Chittenden | 4.1% | 5.3%(-1.15)#83 | 5.3%(-1.16)#15,589 |
| 84. | West Rutland | 4.0% | 5.3%(-1.23)#84 | 5.3%(-1.24)#15,839 |
| 85. | Northfield | 4.0% | 5.3%(-1.31)#85 | 5.3%(-1.33)#16,112 |
| 86. | Williamstown | 3.7% | 5.3%(-1.53)#86 | 5.3%(-1.55)#16,805 |
| 87. | Readsboro | 3.7% | 5.3%(-1.57)#87 | 5.3%(-1.58)#16,903 |
| 88. | Shelburne | 3.7% | 5.3%(-1.58)#88 | 5.3%(-1.60)#16,947 |
| 89. | Benson | 3.4% | 5.3%(-1.86)#89 | 5.3%(-1.88)#17,817 |
| 90. | Springfield | 3.3% | 5.3%(-2.00)#90 | 5.3%(-2.01)#18,221 |
| 91. | Underhill Flats | 3.2% | 5.3%(-2.05)#91 | 5.3%(-2.06)#18,344 |
| 92. | Swanton | 3.1% | 5.3%(-2.12)#92 | 5.3%(-2.14)#18,551 |
| 93. | East Middlebury | 3.1% | 5.3%(-2.12)#93 | 5.3%(-2.14)#18,559 |
| 94. | Wallingford | 3.1% | 5.3%(-2.15)#94 | 5.3%(-2.17)#18,658 |
| 95. | Brattleboro | 3.0% | 5.3%(-2.26)#95 | 5.3%(-2.27)#18,961 |
| 96. | West Pawlet | 3.0% | 5.3%(-2.26)#96 | 5.3%(-2.27)#18,964 |
| 97. | Bradford | 2.8% | 5.3%(-2.47)#97 | 5.3%(-2.49)#19,533 |
| 98. | St Johnsbury | 2.7% | 5.3%(-2.52)#98 | 5.3%(-2.54)#19,679 |
| 99. | Vergennes | 2.7% | 5.3%(-2.53)#99 | 5.3%(-2.54)#19,689 |
| 100. | Bristol | 2.6% | 5.3%(-2.71)#100 | 5.3%(-2.72)#20,178 |
1
2Common Questions
What are the Top 10 Cities with the Highest Percentage of Population Employed in Food Preparation & Serving in Vermont?
Top 10 Cities with the Highest Percentage of Population Employed in Food Preparation & Serving in Vermont are:
#1
41.3%
#2
38.5%
#3
35.5%
#4
27.2%
#5
22.3%
#6
21.6%
#7
21.2%
#8
20.7%
#9
19.0%
#10
16.8%
What city has the Highest Percentage of Population Employed in Food Preparation & Serving in Vermont?
Newport Center has the Highest Percentage of Population Employed in Food Preparation & Serving in Vermont with 41.3%.
What is the Percentage of Population Employed in Food Preparation & Serving in the State of Vermont?
Percentage of Population Employed in Food Preparation & Serving in Vermont is 5.3%.
What is the Percentage of Population Employed in Food Preparation & Serving in the United States?
Percentage of Population Employed in Food Preparation & Serving in the United States is 5.3%.