San Miguel CDP San Luis Obispo County, CA Map & Demographics
San Miguel CDP San Luis Obispo County Overview
$20,843
PER CAPITA INCOME
$73,807
AVG FAMILY INCOME
$73,008
AVG HOUSEHOLD INCOME
4.5%
WAGE / INCOME GAP [ % ]
95.5¢/ $1
WAGE / INCOME GAP [ $ ]
0.35
INEQUALITY / GINI INDEX
2,756
TOTAL POPULATION
1,673
MALE POPULATION
1,083
FEMALE POPULATION
154.48
MALES / 100 FEMALES
64.73
FEMALES / 100 MALES
29.1
MEDIAN AGE
4.1
AVG FAMILY SIZE
3.5
AVG HOUSEHOLD SIZE
1,379
LABOR FORCE [ PEOPLE ]
70.1%
PERCENT IN LABOR FORCE
5.4%
UNEMPLOYMENT RATE
Income in San Miguel CDP San Luis Obispo County
Income Overview in San Miguel CDP San Luis Obispo County
Per Capita Income in San Miguel CDP San Luis Obispo County is $20,843, while median incomes of families and households are $73,807 and $73,008 respectively.
| Characteristic | Number | Measure |
| Per Capita Income | 2,756 | $20,843 |
| Median Family Income | 586 | $73,807 |
| Mean Family Income | 586 | $68,490 |
| Median Household Income | 782 | $73,008 |
| Mean Household Income | 782 | $69,924 |
| Income Deficit | 586 | $0 |
| Wage / Income Gap (%) | 2,756 | 4.46% |
| Wage / Income Gap ($) | 2,756 | 95.54¢ per $1 |
| Gini / Inequality Index | 2,756 | 0.35 |
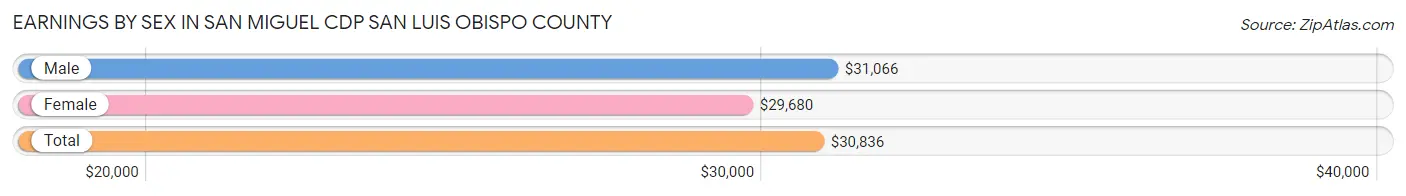
Earnings by Sex in San Miguel CDP San Luis Obispo County
Average Earnings in San Miguel CDP San Luis Obispo County are $30,836, $31,066 for men and $29,680 for women, a difference of 4.5%.
| Sex | Number | Average Earnings |
| Male | 918 (66.9%) | $31,066 |
| Female | 455 (33.1%) | $29,680 |
| Total | 1,373 (100.0%) | $30,836 |
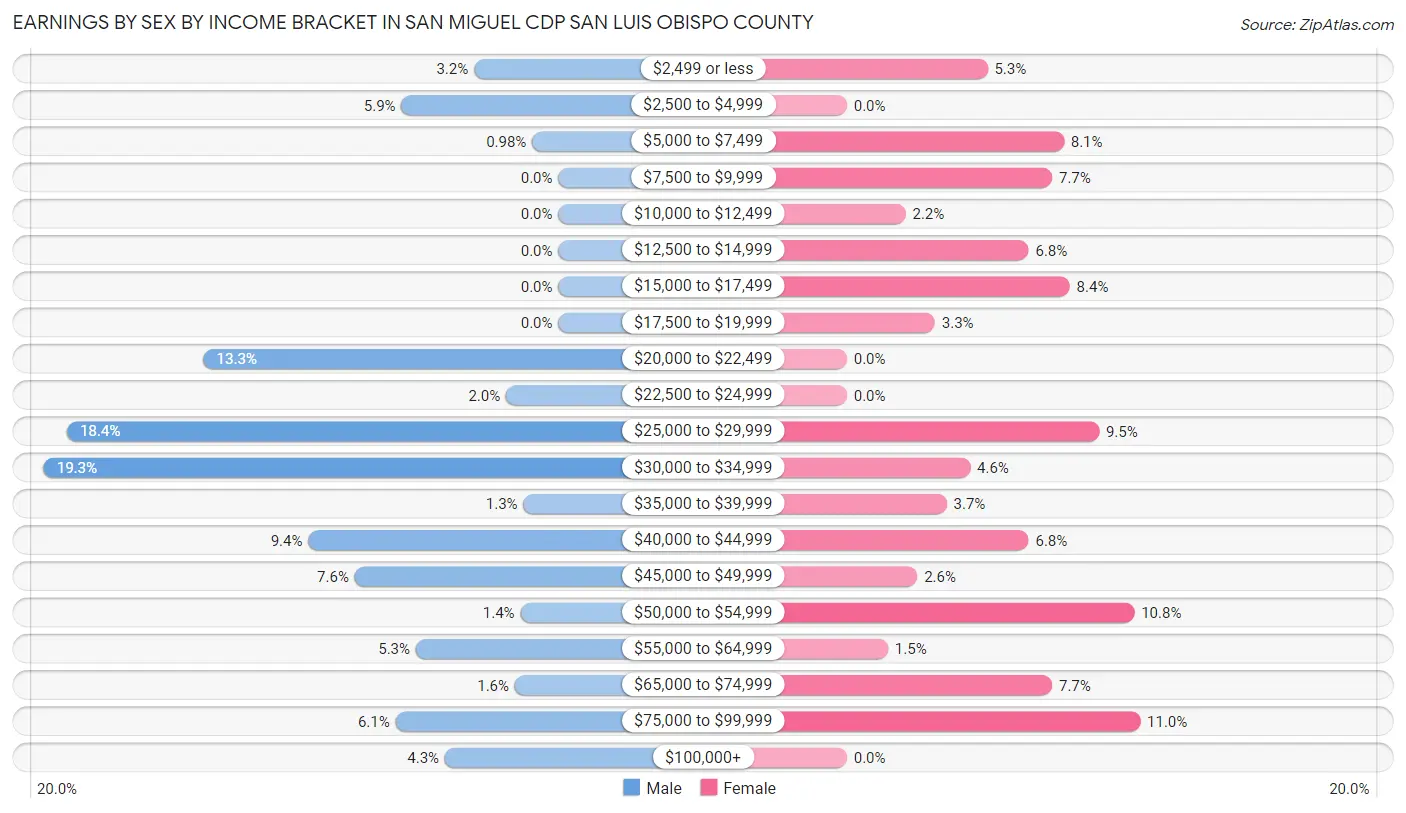
Earnings by Sex by Income Bracket in San Miguel CDP San Luis Obispo County
The most common earnings brackets in San Miguel CDP San Luis Obispo County are $30,000 to $34,999 for men (177 | 19.3%) and $75,000 to $99,999 for women (50 | 11.0%).
| Income | Male | Female |
| $2,499 or less | 29 (3.2%) | 24 (5.3%) |
| $2,500 to $4,999 | 54 (5.9%) | 0 (0.0%) |
| $5,000 to $7,499 | 9 (1.0%) | 37 (8.1%) |
| $7,500 to $9,999 | 0 (0.0%) | 35 (7.7%) |
| $10,000 to $12,499 | 0 (0.0%) | 10 (2.2%) |
| $12,500 to $14,999 | 0 (0.0%) | 31 (6.8%) |
| $15,000 to $17,499 | 0 (0.0%) | 38 (8.4%) |
| $17,500 to $19,999 | 0 (0.0%) | 15 (3.3%) |
| $20,000 to $22,499 | 122 (13.3%) | 0 (0.0%) |
| $22,500 to $24,999 | 18 (2.0%) | 0 (0.0%) |
| $25,000 to $29,999 | 169 (18.4%) | 43 (9.5%) |
| $30,000 to $34,999 | 177 (19.3%) | 21 (4.6%) |
| $35,000 to $39,999 | 12 (1.3%) | 17 (3.7%) |
| $40,000 to $44,999 | 86 (9.4%) | 31 (6.8%) |
| $45,000 to $49,999 | 70 (7.6%) | 12 (2.6%) |
| $50,000 to $54,999 | 13 (1.4%) | 49 (10.8%) |
| $55,000 to $64,999 | 49 (5.3%) | 7 (1.5%) |
| $65,000 to $74,999 | 15 (1.6%) | 35 (7.7%) |
| $75,000 to $99,999 | 56 (6.1%) | 50 (11.0%) |
| $100,000+ | 39 (4.3%) | 0 (0.0%) |
| Total | 918 (100.0%) | 455 (100.0%) |
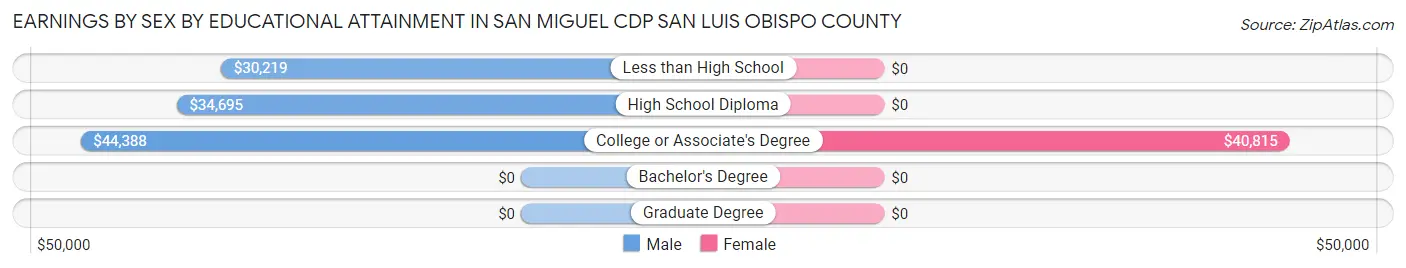
Earnings by Sex by Educational Attainment in San Miguel CDP San Luis Obispo County
Average earnings in San Miguel CDP San Luis Obispo County are $37,708 for men and $30,774 for women, a difference of 18.4%. Men with an educational attainment of college or associate's degree enjoy the highest average annual earnings of $44,388, while those with less than high school education earn the least with $30,219. Women with an educational attainment of college or associate's degree earn the most with the average annual earnings of $40,815, while those with college or associate's degree education have the smallest earnings of $40,815.
| Educational Attainment | Male Income | Female Income |
| Less than High School | $30,219 | $0 |
| High School Diploma | $34,695 | $0 |
| College or Associate's Degree | $44,388 | $40,815 |
| Bachelor's Degree | - | - |
| Graduate Degree | - | - |
| Total | $37,708 | $30,774 |
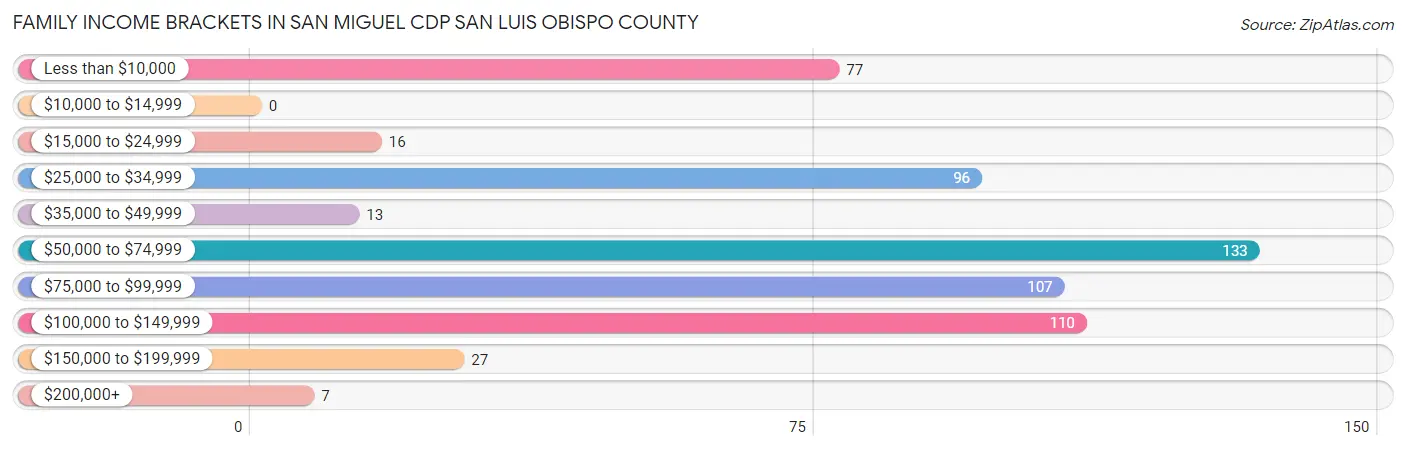
Family Income in San Miguel CDP San Luis Obispo County
Family Income Brackets in San Miguel CDP San Luis Obispo County
According to the San Miguel CDP San Luis Obispo County family income data, there are 133 families falling into the $50,000 to $74,999 income range, which is the most common income bracket and makes up 22.7% of all families.
| Income Bracket | # Families | % Families |
| Less than $10,000 | 77 | 13.1% |
| $10,000 to $14,999 | 0 | 0.0% |
| $15,000 to $24,999 | 16 | 2.7% |
| $25,000 to $34,999 | 96 | 16.4% |
| $35,000 to $49,999 | 13 | 2.2% |
| $50,000 to $74,999 | 133 | 22.7% |
| $75,000 to $99,999 | 107 | 18.3% |
| $100,000 to $149,999 | 110 | 18.8% |
| $150,000 to $199,999 | 27 | 4.6% |
| $200,000+ | 7 | 1.2% |
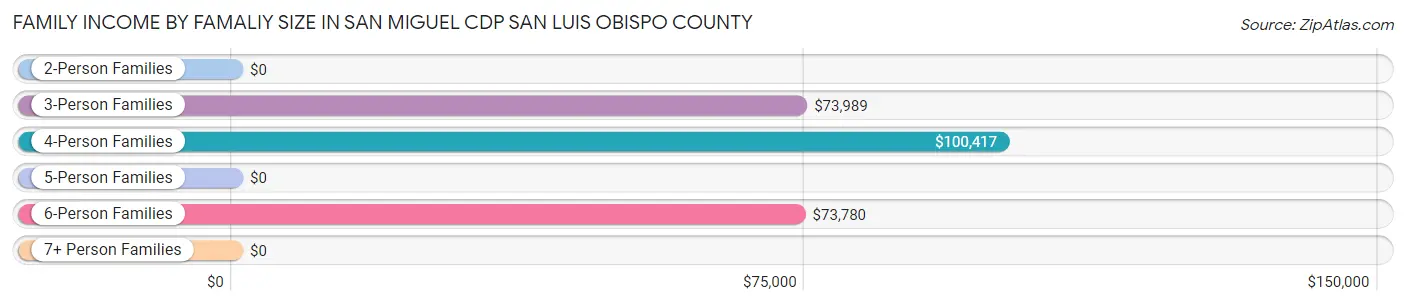
Family Income by Famaliy Size in San Miguel CDP San Luis Obispo County
4-person families (167 | 28.5%) account for the highest median family income in San Miguel CDP San Luis Obispo County with $100,417 per family, while 4-person families (167 | 28.5%) have the highest median income of $25,104 per family member.
| Income Bracket | # Families | Median Income |
| 2-Person Families | 162 (27.7%) | $0 |
| 3-Person Families | 114 (19.5%) | $73,989 |
| 4-Person Families | 167 (28.5%) | $100,417 |
| 5-Person Families | 43 (7.3%) | $0 |
| 6-Person Families | 100 (17.1%) | $73,780 |
| 7+ Person Families | 0 (0.0%) | $0 |
| Total | 586 (100.0%) | $73,807 |
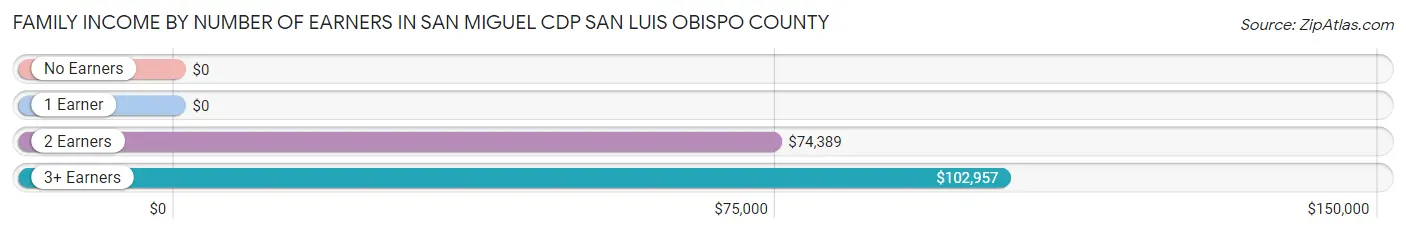
Family Income by Number of Earners in San Miguel CDP San Luis Obispo County
| Number of Earners | # Families | Median Income |
| No Earners | 42 (7.2%) | $0 |
| 1 Earner | 186 (31.7%) | $0 |
| 2 Earners | 265 (45.2%) | $74,389 |
| 3+ Earners | 93 (15.9%) | $102,957 |
| Total | 586 (100.0%) | $73,807 |
Household Income in San Miguel CDP San Luis Obispo County
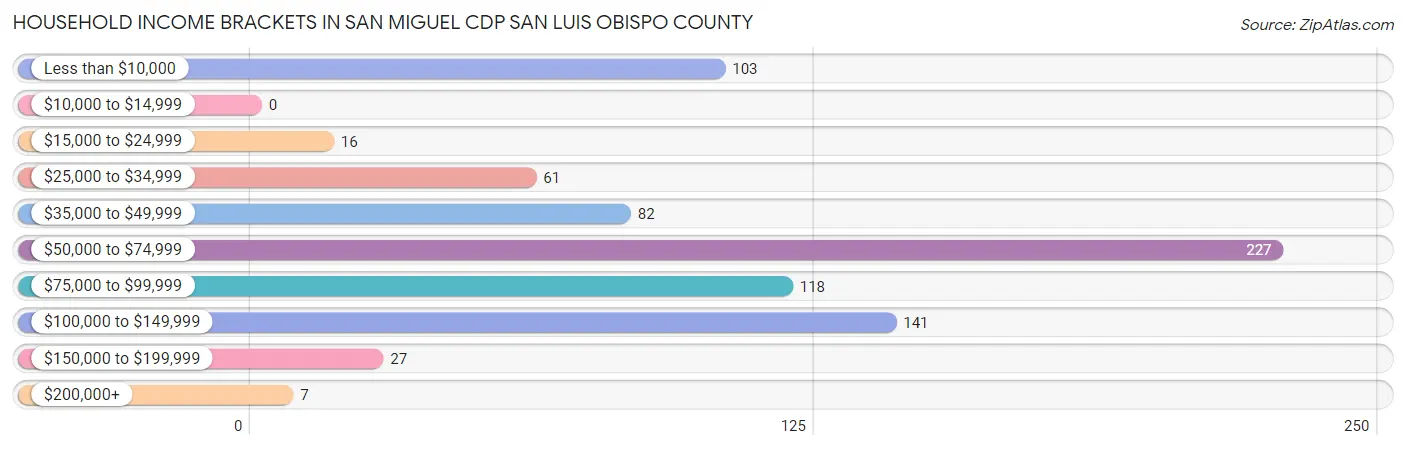
Household Income Brackets in San Miguel CDP San Luis Obispo County
With 227 households falling in the category, the $50,000 to $74,999 income range is the most frequent in San Miguel CDP San Luis Obispo County, accounting for 29.0% of all households.
| Income Bracket | # Households | % Households |
| Less than $10,000 | 103 | 13.2% |
| $10,000 to $14,999 | 0 | 0.0% |
| $15,000 to $24,999 | 16 | 2.0% |
| $25,000 to $34,999 | 61 | 7.8% |
| $35,000 to $49,999 | 82 | 10.5% |
| $50,000 to $74,999 | 227 | 29.0% |
| $75,000 to $99,999 | 118 | 15.1% |
| $100,000 to $149,999 | 141 | 18.0% |
| $150,000 to $199,999 | 27 | 3.5% |
| $200,000+ | 7 | 0.9% |
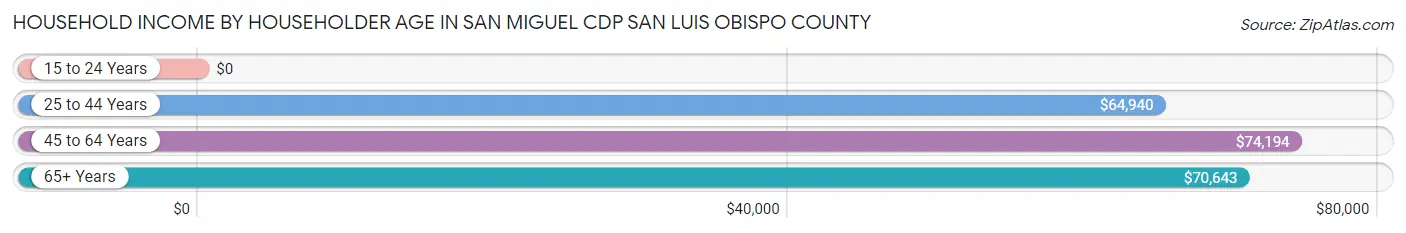
Household Income by Householder Age in San Miguel CDP San Luis Obispo County
The median household income in San Miguel CDP San Luis Obispo County is $73,008, with the highest median household income of $74,194 found in the 45 to 64 years age bracket for the primary householder. A total of 323 households (41.3%) fall into this category.
| Income Bracket | # Households | Median Income |
| 15 to 24 Years | 0 (0.0%) | $0 |
| 25 to 44 Years | 373 (47.7%) | $64,940 |
| 45 to 64 Years | 323 (41.3%) | $74,194 |
| 65+ Years | 86 (11.0%) | $70,643 |
| Total | 782 (100.0%) | $73,008 |
Poverty in San Miguel CDP San Luis Obispo County
Income Below Poverty by Sex and Age in San Miguel CDP San Luis Obispo County
With 27.6% poverty level for males and 33.4% for females among the residents of San Miguel CDP San Luis Obispo County, 15 year old males and 18 to 24 year old females are the most vulnerable to poverty, with 33 males (73.3%) and 93 females (100.0%) in their respective age groups living below the poverty level.
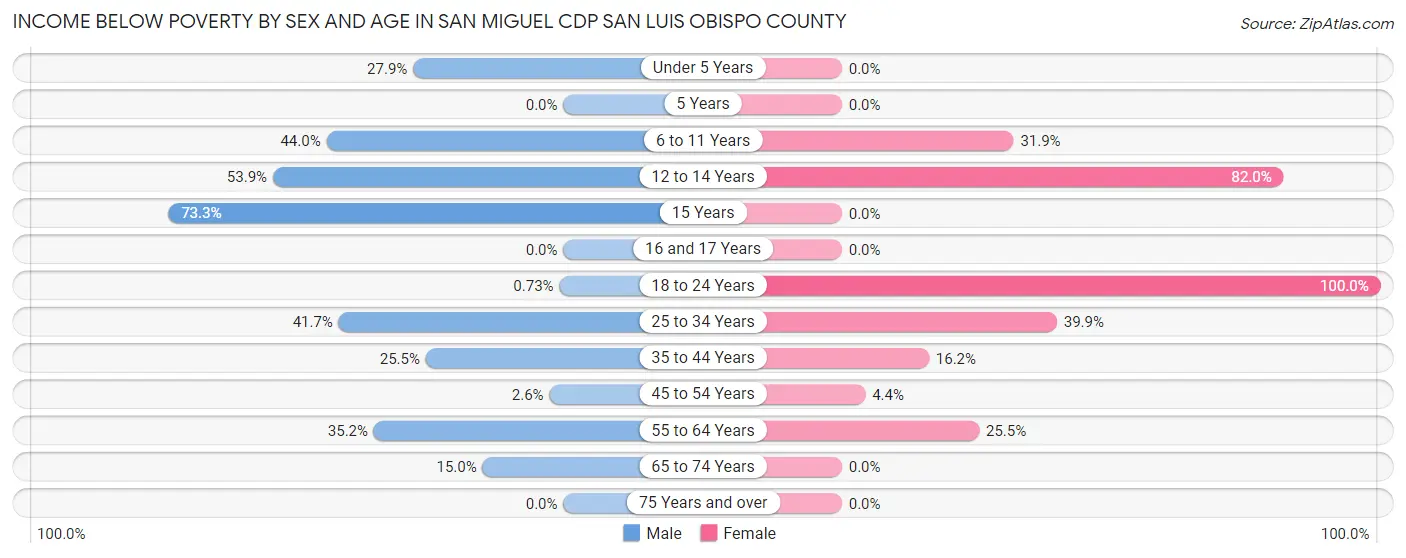
| Age Bracket | Male | Female |
| Under 5 Years | 29 (27.9%) | 0 (0.0%) |
| 5 Years | 0 (0.0%) | 0 (0.0%) |
| 6 to 11 Years | 113 (44.0%) | 36 (31.9%) |
| 12 to 14 Years | 69 (53.9%) | 82 (82.0%) |
| 15 Years | 33 (73.3%) | 0 (0.0%) |
| 16 and 17 Years | 0 (0.0%) | 0 (0.0%) |
| 18 to 24 Years | 2 (0.7%) | 93 (100.0%) |
| 25 to 34 Years | 98 (41.7%) | 87 (39.9%) |
| 35 to 44 Years | 60 (25.5%) | 16 (16.2%) |
| 45 to 54 Years | 4 (2.6%) | 7 (4.3%) |
| 55 to 64 Years | 51 (35.2%) | 41 (25.5%) |
| 65 to 74 Years | 3 (15.0%) | 0 (0.0%) |
| 75 Years and over | 0 (0.0%) | 0 (0.0%) |
| Total | 462 (27.6%) | 362 (33.4%) |
Income Above Poverty by Sex and Age in San Miguel CDP San Luis Obispo County
According to the poverty statistics in San Miguel CDP San Luis Obispo County, males aged 5 years and females aged 5 years are the age groups that are most secure financially, with 100.0% of males and 100.0% of females in these age groups living above the poverty line.
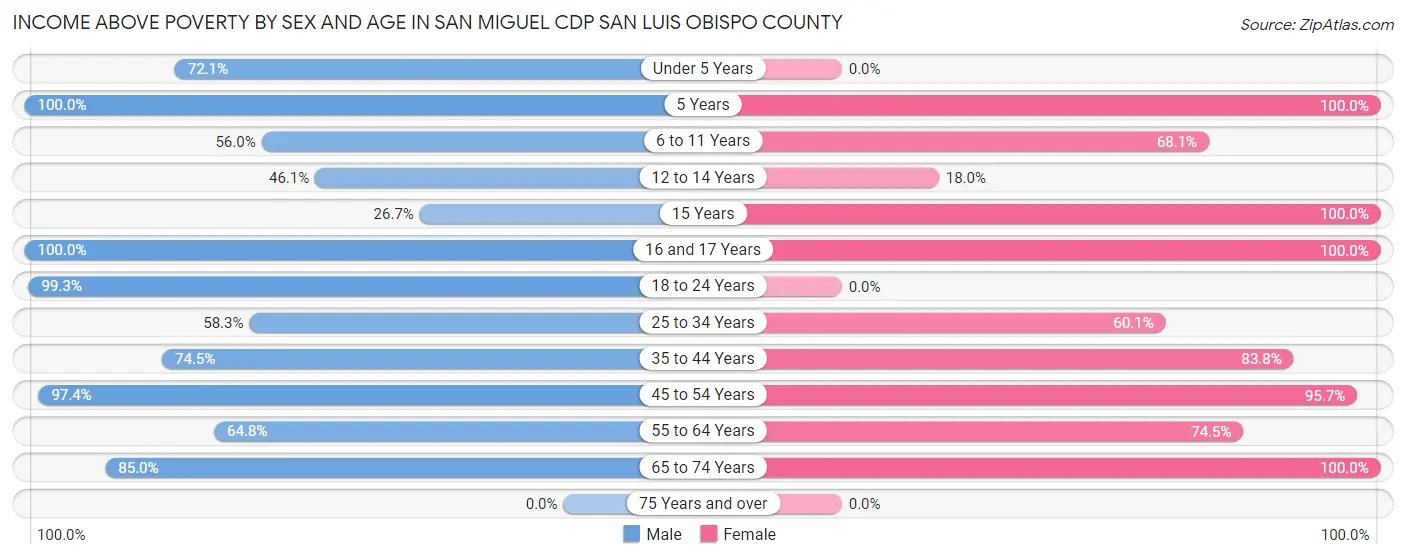
| Age Bracket | Male | Female |
| Under 5 Years | 75 (72.1%) | 0 (0.0%) |
| 5 Years | 28 (100.0%) | 12 (100.0%) |
| 6 to 11 Years | 144 (56.0%) | 77 (68.1%) |
| 12 to 14 Years | 59 (46.1%) | 18 (18.0%) |
| 15 Years | 12 (26.7%) | 2 (100.0%) |
| 16 and 17 Years | 48 (100.0%) | 22 (100.0%) |
| 18 to 24 Years | 271 (99.3%) | 0 (0.0%) |
| 25 to 34 Years | 137 (58.3%) | 131 (60.1%) |
| 35 to 44 Years | 175 (74.5%) | 83 (83.8%) |
| 45 to 54 Years | 151 (97.4%) | 154 (95.7%) |
| 55 to 64 Years | 94 (64.8%) | 120 (74.5%) |
| 65 to 74 Years | 17 (85.0%) | 102 (100.0%) |
| 75 Years and over | 0 (0.0%) | 0 (0.0%) |
| Total | 1,211 (72.4%) | 721 (66.6%) |
Income Below Poverty Among Married-Couple Families in San Miguel CDP San Luis Obispo County
The poverty statistics for married-couple families in San Miguel CDP San Luis Obispo County show that 28.6% or 112 of the total 392 families live below the poverty line. Families with 3 or 4 children have the highest poverty rate of 59.8%, comprising of 61 families. On the other hand, families with 1 or 2 children have the lowest poverty rate of 0.0%, which includes 0 families.
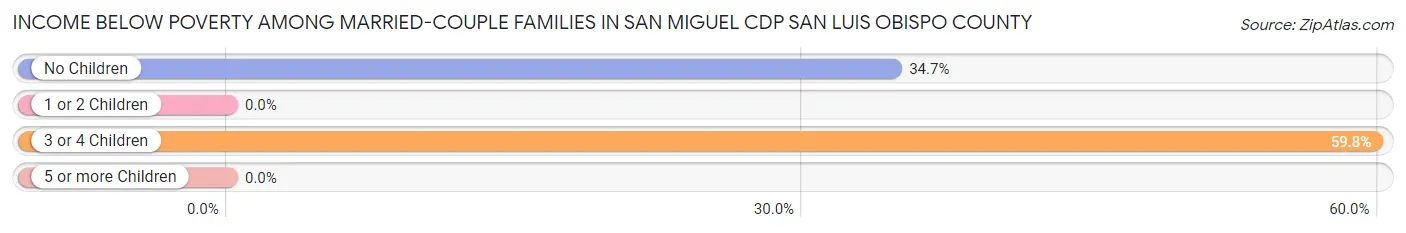
| Children | Above Poverty | Below Poverty |
| No Children | 96 (65.3%) | 51 (34.7%) |
| 1 or 2 Children | 143 (100.0%) | 0 (0.0%) |
| 3 or 4 Children | 41 (40.2%) | 61 (59.8%) |
| 5 or more Children | 0 (0.0%) | 0 (0.0%) |
| Total | 280 (71.4%) | 112 (28.6%) |
Income Below Poverty Among Single-Parent Households in San Miguel CDP San Luis Obispo County
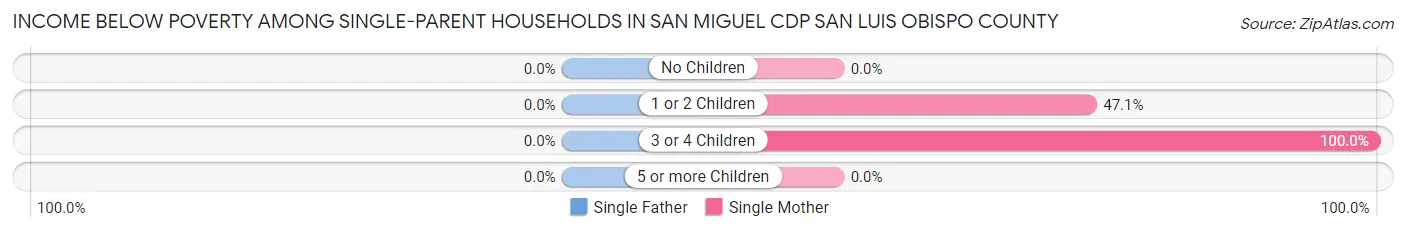
| Children | Single Father | Single Mother |
| No Children | 0 (0.0%) | 0 (0.0%) |
| 1 or 2 Children | 0 (0.0%) | 16 (47.1%) |
| 3 or 4 Children | 0 (0.0%) | 26 (100.0%) |
| 5 or more Children | 0 (0.0%) | 0 (0.0%) |
| Total | 0 (0.0%) | 42 (44.2%) |
Income Below Poverty Among Married-Couple vs Single-Parent Households in San Miguel CDP San Luis Obispo County
The poverty data for San Miguel CDP San Luis Obispo County shows that 112 of the married-couple family households (28.6%) and 42 of the single-parent households (21.6%) are living below the poverty level. Within the married-couple family households, those with 3 or 4 children have the highest poverty rate, with 61 households (59.8%) falling below the poverty line. Among the single-parent households, those with 3 or 4 children have the highest poverty rate, with 26 household (100.0%) living below poverty.
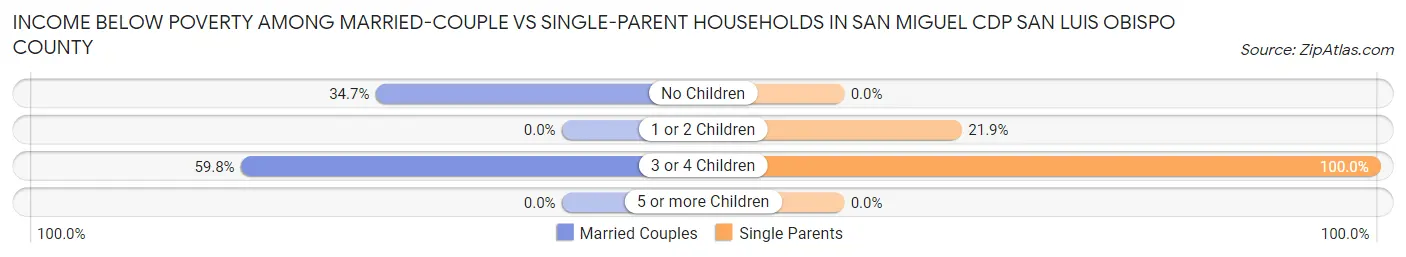
| Children | Married-Couple Families | Single-Parent Households |
| No Children | 51 (34.7%) | 0 (0.0%) |
| 1 or 2 Children | 0 (0.0%) | 16 (21.9%) |
| 3 or 4 Children | 61 (59.8%) | 26 (100.0%) |
| 5 or more Children | 0 (0.0%) | 0 (0.0%) |
| Total | 112 (28.6%) | 42 (21.6%) |
Race in San Miguel CDP San Luis Obispo County
The most populous races in San Miguel CDP San Luis Obispo County are Hispanic or Latino (2,024 | 73.4%), White / Caucasian (1,664 | 60.4%), and Some other Race (515 | 18.7%).
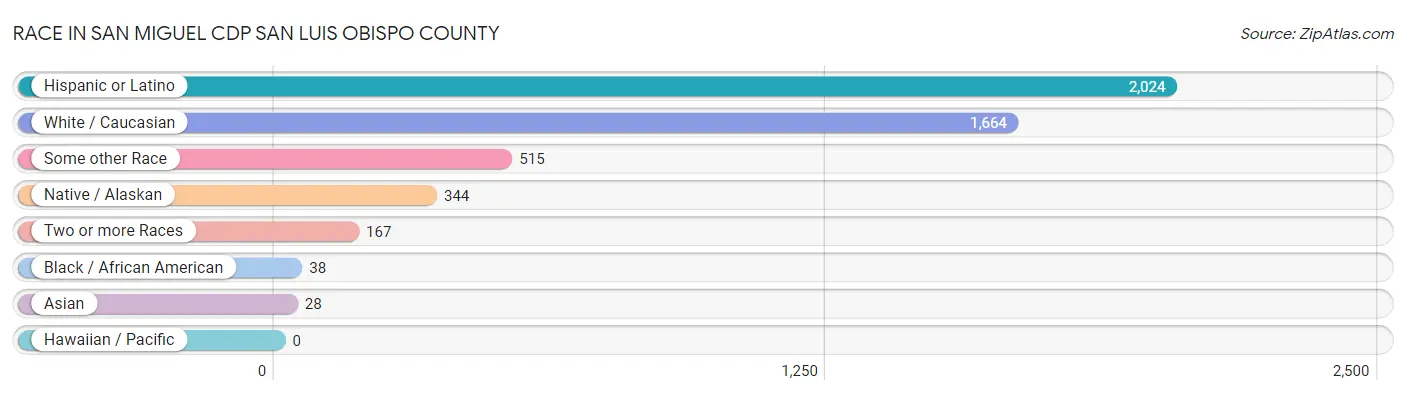
| Race | # Population | % Population |
| Asian | 28 | 1.0% |
| Black / African American | 38 | 1.4% |
| Hawaiian / Pacific | 0 | 0.0% |
| Hispanic or Latino | 2,024 | 73.4% |
| Native / Alaskan | 344 | 12.5% |
| White / Caucasian | 1,664 | 60.4% |
| Two or more Races | 167 | 6.1% |
| Some other Race | 515 | 18.7% |
| Total | 2,756 | 100.0% |
Ancestry in San Miguel CDP San Luis Obispo County
The most populous ancestries reported in San Miguel CDP San Luis Obispo County are Mexican (2,024 | 73.4%), Mexican American Indian (344 | 12.5%), English (265 | 9.6%), German (119 | 4.3%), and Irish (57 | 2.1%), together accounting for 101.9% of all San Miguel CDP San Luis Obispo County residents.
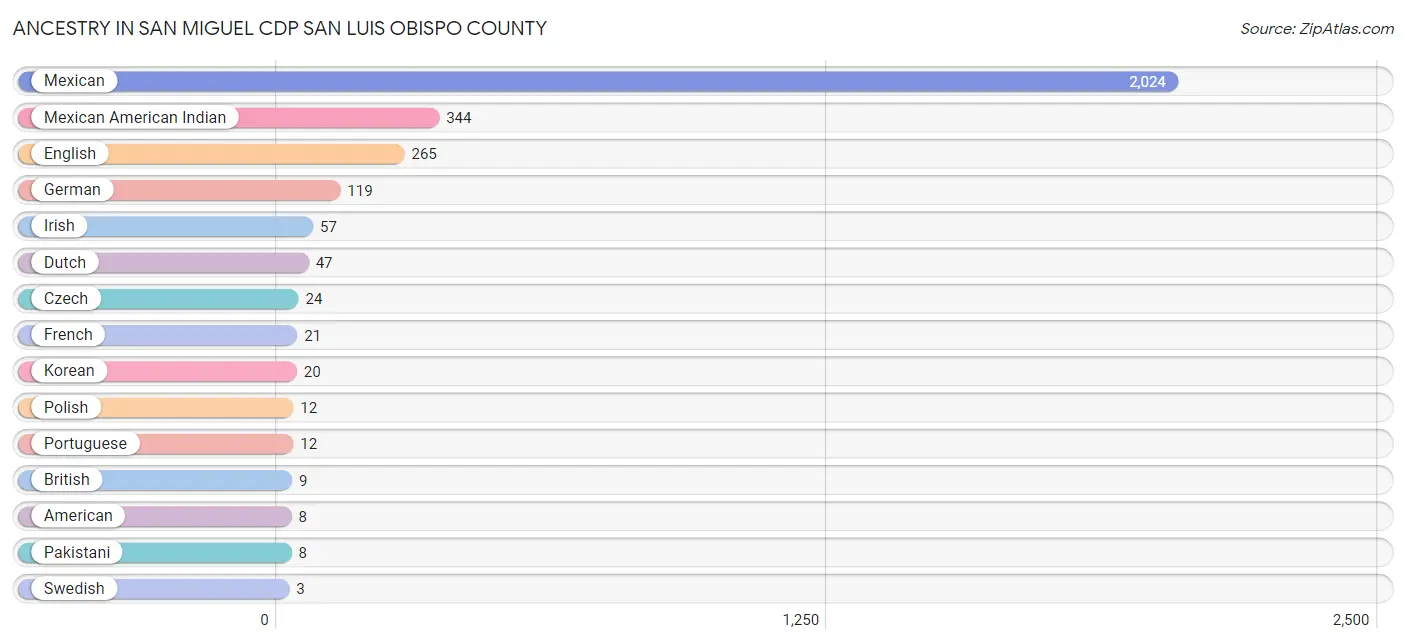
| Ancestry | # Population | % Population |
| American | 8 | 0.3% |
| British | 9 | 0.3% |
| Czech | 24 | 0.9% |
| Dutch | 47 | 1.7% |
| English | 265 | 9.6% |
| French | 21 | 0.8% |
| German | 119 | 4.3% |
| Irish | 57 | 2.1% |
| Korean | 20 | 0.7% |
| Mexican | 2,024 | 73.4% |
| Mexican American Indian | 344 | 12.5% |
| Pakistani | 8 | 0.3% |
| Polish | 12 | 0.4% |
| Portuguese | 12 | 0.4% |
| Swedish | 3 | 0.1% | View All 15 Rows |
Immigrants in San Miguel CDP San Luis Obispo County
The most numerous immigrant groups reported in San Miguel CDP San Luis Obispo County came from Central America (1,290 | 46.8%), Latin America (1,290 | 46.8%), Mexico (1,290 | 46.8%), Asia (20 | 0.7%), and South Eastern Asia (20 | 0.7%), together accounting for 141.9% of all San Miguel CDP San Luis Obispo County residents.
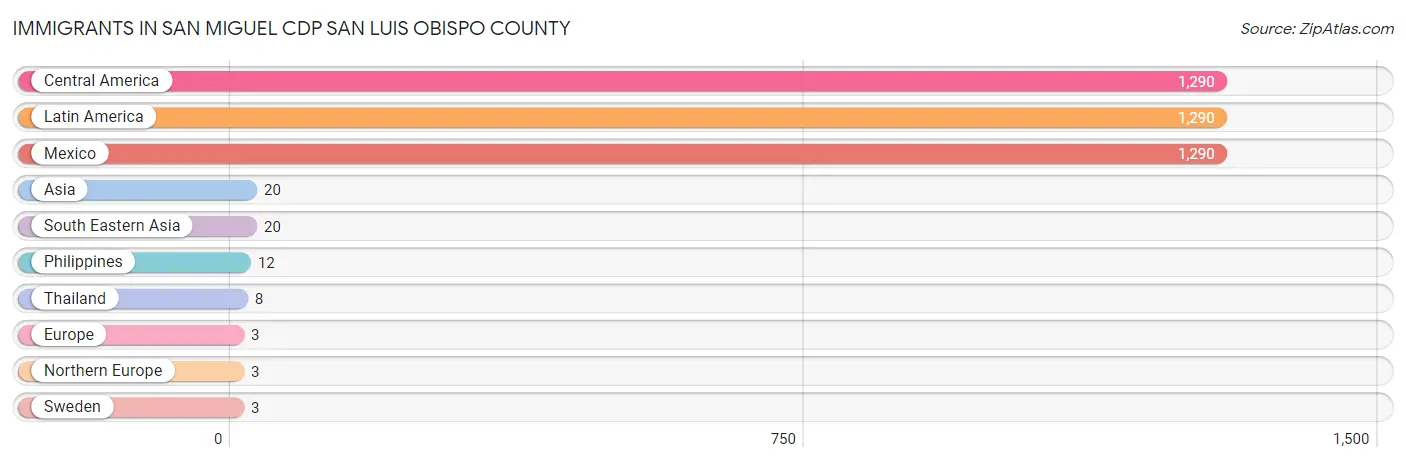
| Immigration Origin | # Population | % Population |
| Asia | 20 | 0.7% |
| Central America | 1,290 | 46.8% |
| Europe | 3 | 0.1% |
| Latin America | 1,290 | 46.8% |
| Mexico | 1,290 | 46.8% |
| Northern Europe | 3 | 0.1% |
| Philippines | 12 | 0.4% |
| South Eastern Asia | 20 | 0.7% |
| Sweden | 3 | 0.1% |
| Thailand | 8 | 0.3% | View All 10 Rows |
Sex and Age in San Miguel CDP San Luis Obispo County
Sex and Age in San Miguel CDP San Luis Obispo County
The most populous age groups in San Miguel CDP San Luis Obispo County are 20 to 24 Years (262 | 15.7%) for men and 30 to 34 Years (164 | 15.1%) for women.
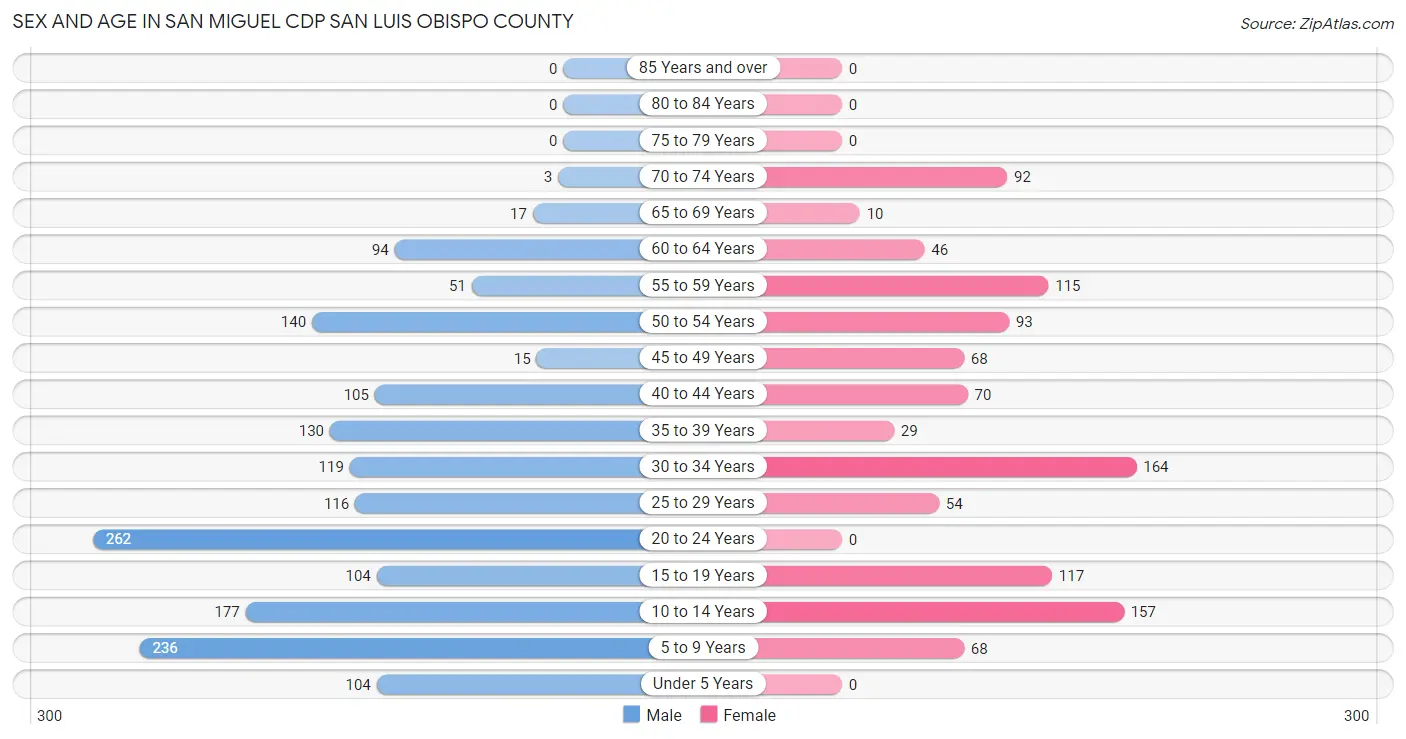
| Age Bracket | Male | Female |
| Under 5 Years | 104 (6.2%) | 0 (0.0%) |
| 5 to 9 Years | 236 (14.1%) | 68 (6.3%) |
| 10 to 14 Years | 177 (10.6%) | 157 (14.5%) |
| 15 to 19 Years | 104 (6.2%) | 117 (10.8%) |
| 20 to 24 Years | 262 (15.7%) | 0 (0.0%) |
| 25 to 29 Years | 116 (6.9%) | 54 (5.0%) |
| 30 to 34 Years | 119 (7.1%) | 164 (15.1%) |
| 35 to 39 Years | 130 (7.8%) | 29 (2.7%) |
| 40 to 44 Years | 105 (6.3%) | 70 (6.5%) |
| 45 to 49 Years | 15 (0.9%) | 68 (6.3%) |
| 50 to 54 Years | 140 (8.4%) | 93 (8.6%) |
| 55 to 59 Years | 51 (3.0%) | 115 (10.6%) |
| 60 to 64 Years | 94 (5.6%) | 46 (4.3%) |
| 65 to 69 Years | 17 (1.0%) | 10 (0.9%) |
| 70 to 74 Years | 3 (0.2%) | 92 (8.5%) |
| 75 to 79 Years | 0 (0.0%) | 0 (0.0%) |
| 80 to 84 Years | 0 (0.0%) | 0 (0.0%) |
| 85 Years and over | 0 (0.0%) | 0 (0.0%) |
| Total | 1,673 (100.0%) | 1,083 (100.0%) |
Families and Households in San Miguel CDP San Luis Obispo County
Median Family Size in San Miguel CDP San Luis Obispo County
The median family size in San Miguel CDP San Luis Obispo County is 4.12 persons per family, with married-couple families (392 | 66.9%) accounting for the largest median family size of 4.48 persons per family. On the other hand, single female/mother families (95 | 16.2%) represent the smallest median family size with 3.21 persons per family.
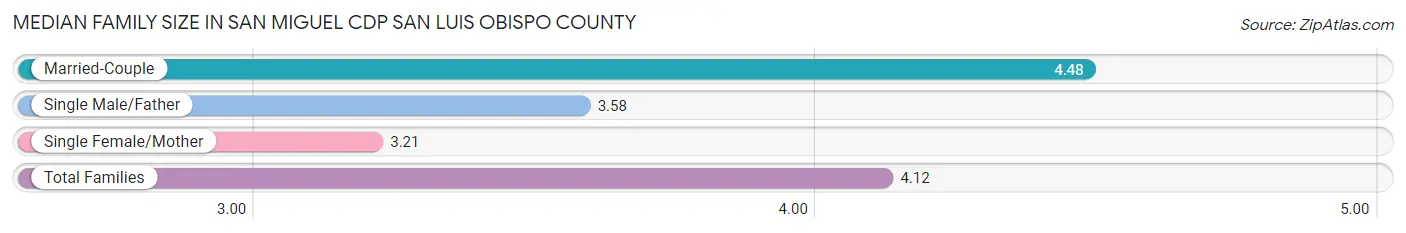
| Family Type | # Families | Family Size |
| Married-Couple | 392 (66.9%) | 4.48 |
| Single Male/Father | 99 (16.9%) | 3.58 |
| Single Female/Mother | 95 (16.2%) | 3.21 |
| Total Families | 586 (100.0%) | 4.12 |
Median Household Size in San Miguel CDP San Luis Obispo County
The median household size in San Miguel CDP San Luis Obispo County is 3.50 persons per household, with married-couple households (392 | 50.1%) accounting for the largest median household size of 4.52 persons per household. non-family households (196 | 25.1%) represent the smallest median household size with 1.11 persons per household.
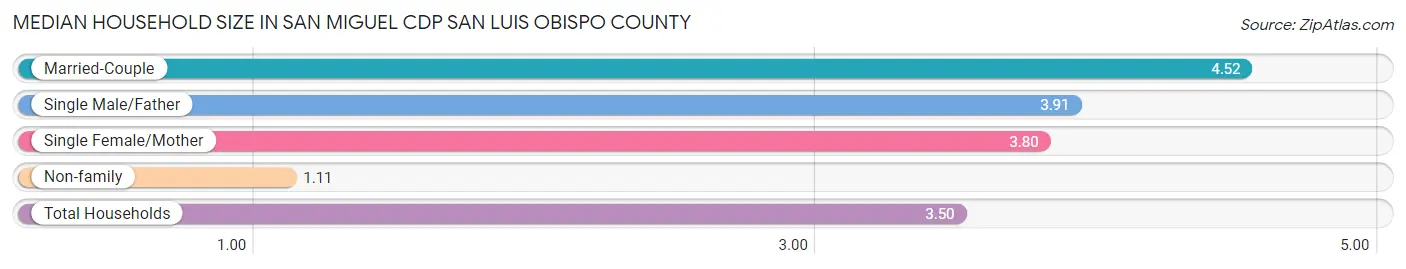
| Household Type | # Households | Household Size |
| Married-Couple | 392 (50.1%) | 4.52 |
| Single Male/Father | 99 (12.7%) | 3.91 |
| Single Female/Mother | 95 (12.1%) | 3.80 |
| Non-family | 196 (25.1%) | 1.11 |
| Total Households | 782 (100.0%) | 3.50 |
Household Size by Marriage Status in San Miguel CDP San Luis Obispo County
Out of a total of 782 households in San Miguel CDP San Luis Obispo County, 586 (74.9%) are family households, while 196 (25.1%) are nonfamily households. The most numerous type of family households are 3-person households, comprising 153, and the most common type of nonfamily households are 1-person households, comprising 174.
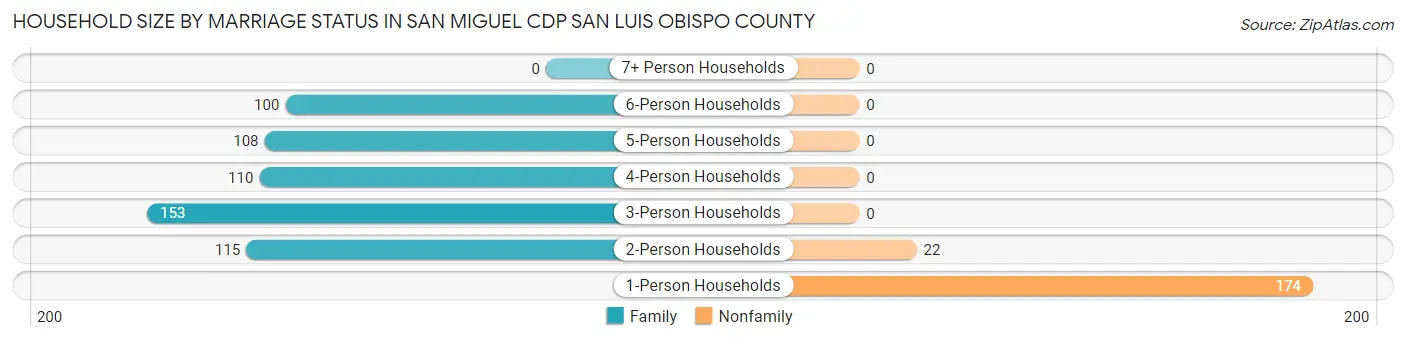
| Household Size | Family Households | Nonfamily Households |
| 1-Person Households | - | 174 (22.3%) |
| 2-Person Households | 115 (14.7%) | 22 (2.8%) |
| 3-Person Households | 153 (19.6%) | 0 (0.0%) |
| 4-Person Households | 110 (14.1%) | 0 (0.0%) |
| 5-Person Households | 108 (13.8%) | 0 (0.0%) |
| 6-Person Households | 100 (12.8%) | 0 (0.0%) |
| 7+ Person Households | 0 (0.0%) | 0 (0.0%) |
| Total | 586 (74.9%) | 196 (25.1%) |
Female Fertility in San Miguel CDP San Luis Obispo County
Fertility by Age in San Miguel CDP San Luis Obispo County
| Age Bracket | Women with Births | Births / 1,000 Women |
| 15 to 19 years | 0 (0.0%) | 0.0 |
| 20 to 34 years | 0 (0.0%) | 0.0 |
| 35 to 50 years | 0 (0.0%) | 0.0 |
| Total | 0 (0.0%) | 0.0 |
Fertility by Age by Marriage Status in San Miguel CDP San Luis Obispo County
| Age Bracket | Married | Unmarried |
| 15 to 19 years | 0 (0.0%) | 0 (0.0%) |
| 20 to 34 years | 0 (0.0%) | 0 (0.0%) |
| 35 to 50 years | 0 (0.0%) | 0 (0.0%) |
| Total | 0 (0.0%) | 0 (0.0%) |
Fertility by Education in San Miguel CDP San Luis Obispo County
| Educational Attainment | Women with Births | Births / 1,000 Women |
| Less than High School | 0 (0.0%) | 0.0 |
| High School Diploma | 0 (0.0%) | 0.0 |
| College or Associate's Degree | 0 (0.0%) | 0.0 |
| Bachelor's Degree | 0 (0.0%) | 0.0 |
| Graduate Degree | 0 (0.0%) | 0.0 |
| Total | 0 (0.0%) | 0.0 |
Fertility by Education by Marriage Status in San Miguel CDP San Luis Obispo County
| Educational Attainment | Married | Unmarried |
| Less than High School | 0 (0.0%) | 0 (0.0%) |
| High School Diploma | 0 (0.0%) | 0 (0.0%) |
| College or Associate's Degree | 0 (0.0%) | 0 (0.0%) |
| Bachelor's Degree | 0 (0.0%) | 0 (0.0%) |
| Graduate Degree | 0 (0.0%) | 0 (0.0%) |
| Total | 0 (0.0%) | 0 (0.0%) |
Employment Characteristics in San Miguel CDP San Luis Obispo County
Employment by Class of Employer in San Miguel CDP San Luis Obispo County
Among the 1,290 employed individuals in San Miguel CDP San Luis Obispo County, private company employees (870 | 67.4%), self-employed (not incorporated) (144 | 11.2%), and state government employees (100 | 7.7%) make up the most common classes of employment.
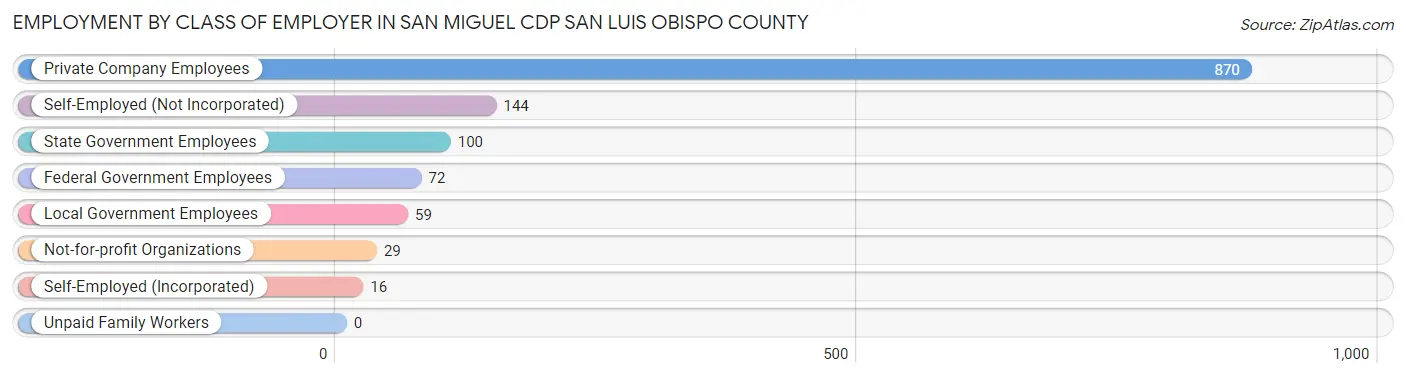
| Employer Class | # Employees | % Employees |
| Private Company Employees | 870 | 67.4% |
| Self-Employed (Incorporated) | 16 | 1.2% |
| Self-Employed (Not Incorporated) | 144 | 11.2% |
| Not-for-profit Organizations | 29 | 2.2% |
| Local Government Employees | 59 | 4.6% |
| State Government Employees | 100 | 7.7% |
| Federal Government Employees | 72 | 5.6% |
| Unpaid Family Workers | 0 | 0.0% |
| Total | 1,290 | 100.0% |
Employment Status by Age in San Miguel CDP San Luis Obispo County
According to the labor force statistics for San Miguel CDP San Luis Obispo County, out of the total population over 16 years of age (1,967), 70.1% or 1,379 individuals are in the labor force, with 5.4% or 74 of them unemployed. The age group with the highest labor force participation rate is 20 to 24 years, with 99.2% or 260 individuals in the labor force. Within the labor force, the 30 to 34 years age range has the highest percentage of unemployed individuals, with 21.0% or 42 of them being unemployed.
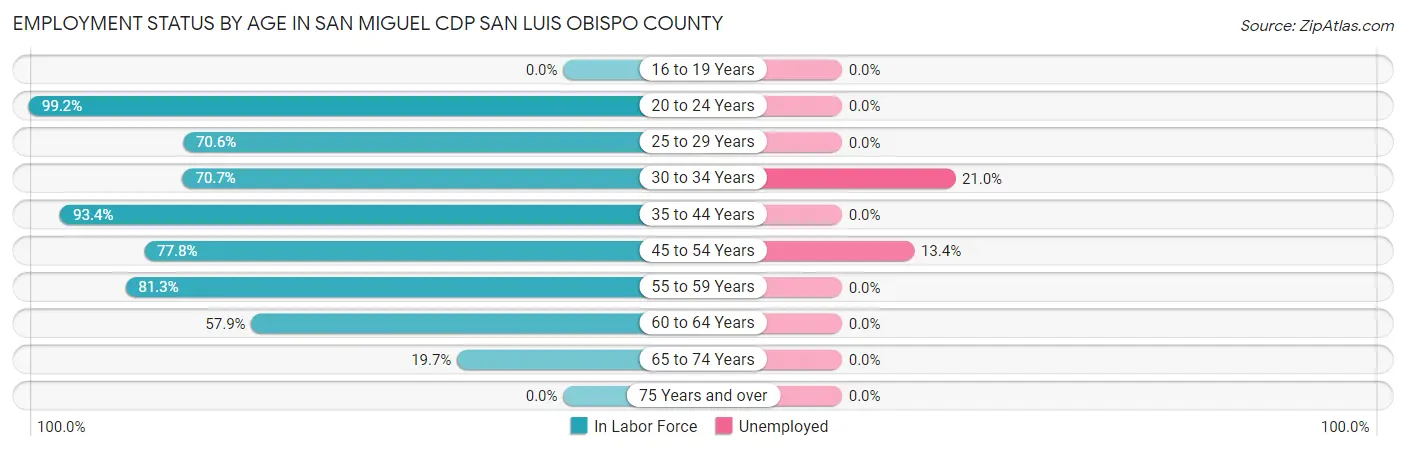
| Age Bracket | In Labor Force | Unemployed |
| 16 to 19 Years | 0 (0.0%) | 0 (0.0%) |
| 20 to 24 Years | 260 (99.2%) | 0 (0.0%) |
| 25 to 29 Years | 120 (70.6%) | 0 (0.0%) |
| 30 to 34 Years | 200 (70.7%) | 42 (21.0%) |
| 35 to 44 Years | 312 (93.4%) | 0 (0.0%) |
| 45 to 54 Years | 246 (77.8%) | 33 (13.4%) |
| 55 to 59 Years | 135 (81.3%) | 0 (0.0%) |
| 60 to 64 Years | 81 (57.9%) | 0 (0.0%) |
| 65 to 74 Years | 24 (19.7%) | 0 (0.0%) |
| 75 Years and over | 0 (0.0%) | 0 (0.0%) |
| Total | 1,379 (70.1%) | 74 (5.4%) |
Employment Status by Educational Attainment in San Miguel CDP San Luis Obispo County
According to labor force statistics for San Miguel CDP San Luis Obispo County, 77.6% of individuals (1,093) out of the total population between 25 and 64 years of age (1,409) are in the labor force, with 6.9% or 75 of them being unemployed. The group with the highest labor force participation rate are those with the educational attainment of college / associate degree, with 84.7% or 300 individuals in the labor force. Within the labor force, individuals with less than high school education have the highest percentage of unemployment, with 17.7% or 65 of them being unemployed.
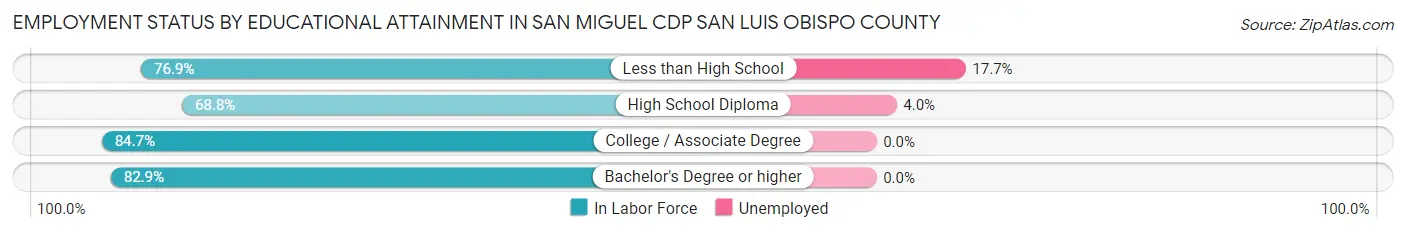
| Educational Attainment | In Labor Force | Unemployed |
| Less than High School | 367 (76.9%) | 84 (17.7%) |
| High School Diploma | 253 (68.8%) | 15 (4.0%) |
| College / Associate Degree | 300 (84.7%) | 0 (0.0%) |
| Bachelor's Degree or higher | 174 (82.9%) | 0 (0.0%) |
| Total | 1,093 (77.6%) | 97 (6.9%) |
Employment Occupations by Sex in San Miguel CDP San Luis Obispo County
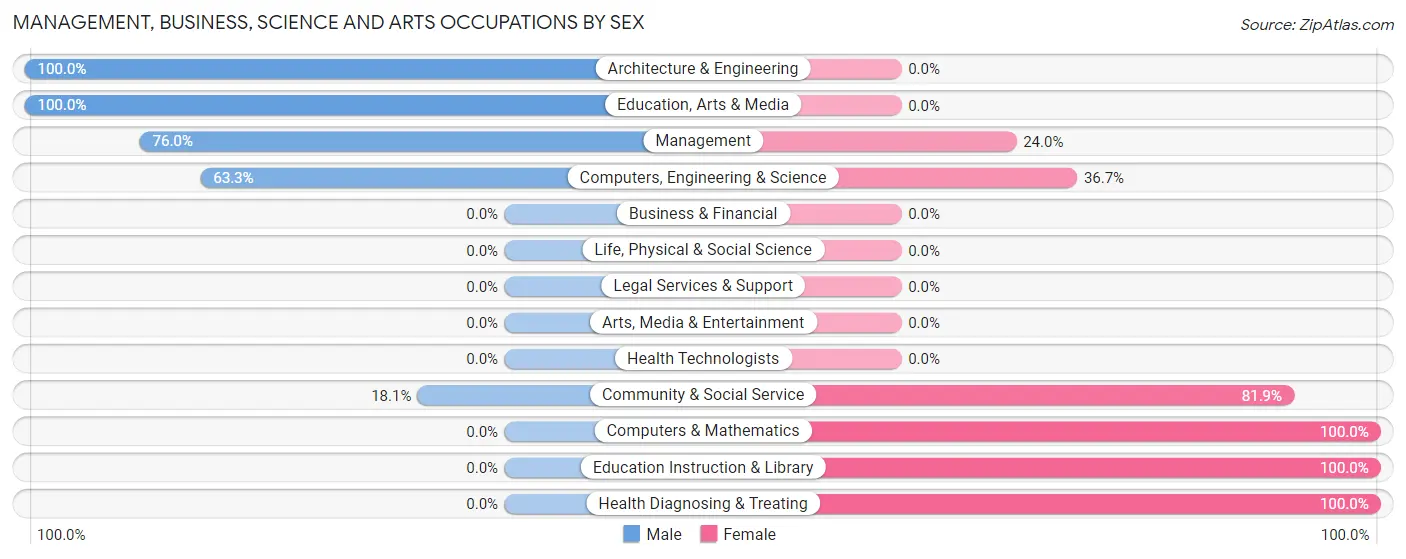
Management, Business, Science and Arts Occupations
The most common Management, Business, Science and Arts occupations in San Miguel CDP San Luis Obispo County are Community & Social Service (94 | 7.2%), Education Instruction & Library (77 | 5.9%), Computers, Engineering & Science (30 | 2.3%), Management (25 | 1.9%), and Architecture & Engineering (19 | 1.5%).
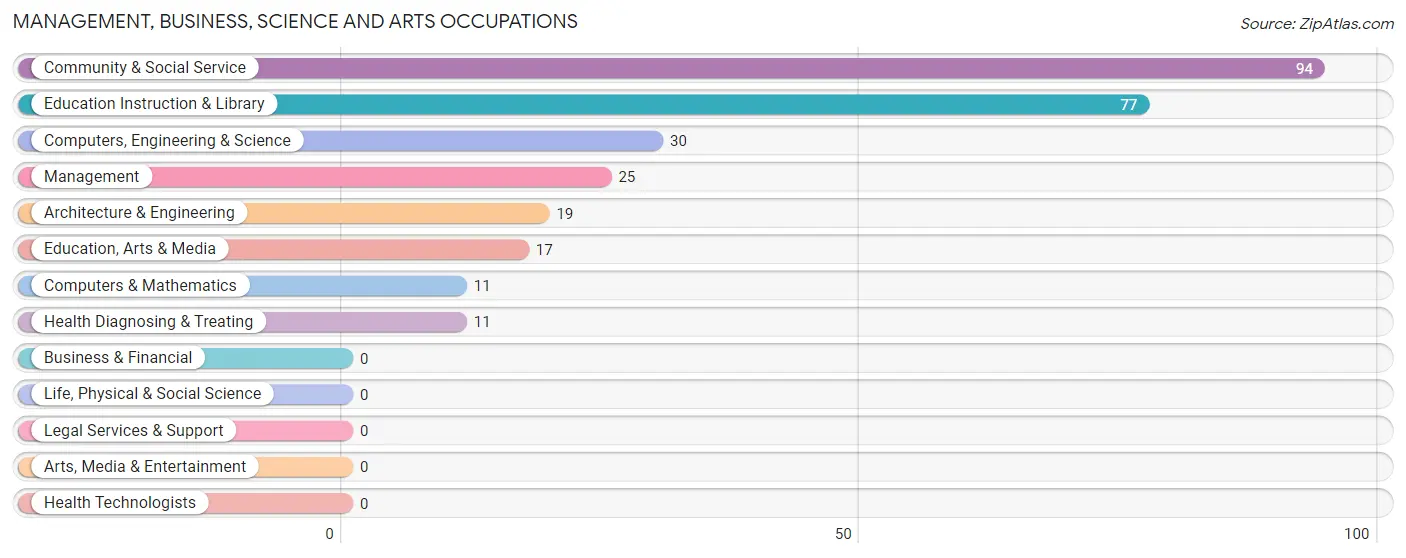
Management, Business, Science and Arts Occupations by Sex
Within the Management, Business, Science and Arts occupations in San Miguel CDP San Luis Obispo County, the most male-oriented occupations are Architecture & Engineering (100.0%), Education, Arts & Media (100.0%), and Management (76.0%), while the most female-oriented occupations are Computers & Mathematics (100.0%), Education Instruction & Library (100.0%), and Health Diagnosing & Treating (100.0%).
| Occupation | Male | Female |
| Management | 19 (76.0%) | 6 (24.0%) |
| Business & Financial | 0 (0.0%) | 0 (0.0%) |
| Computers, Engineering & Science | 19 (63.3%) | 11 (36.7%) |
| Computers & Mathematics | 0 (0.0%) | 11 (100.0%) |
| Architecture & Engineering | 19 (100.0%) | 0 (0.0%) |
| Life, Physical & Social Science | 0 (0.0%) | 0 (0.0%) |
| Community & Social Service | 17 (18.1%) | 77 (81.9%) |
| Education, Arts & Media | 17 (100.0%) | 0 (0.0%) |
| Legal Services & Support | 0 (0.0%) | 0 (0.0%) |
| Education Instruction & Library | 0 (0.0%) | 77 (100.0%) |
| Arts, Media & Entertainment | 0 (0.0%) | 0 (0.0%) |
| Health Diagnosing & Treating | 0 (0.0%) | 11 (100.0%) |
| Health Technologists | 0 (0.0%) | 0 (0.0%) |
| Total (Category) | 55 (34.4%) | 105 (65.6%) |
| Total (Overall) | 915 (70.2%) | 388 (29.8%) |
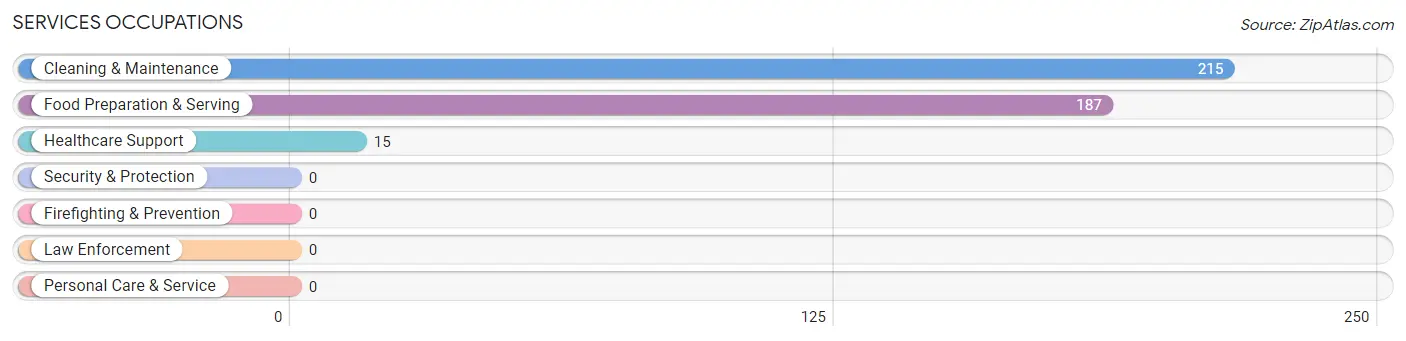
Services Occupations
The most common Services occupations in San Miguel CDP San Luis Obispo County are Cleaning & Maintenance (215 | 16.5%), Food Preparation & Serving (187 | 14.3%), and Healthcare Support (15 | 1.1%).
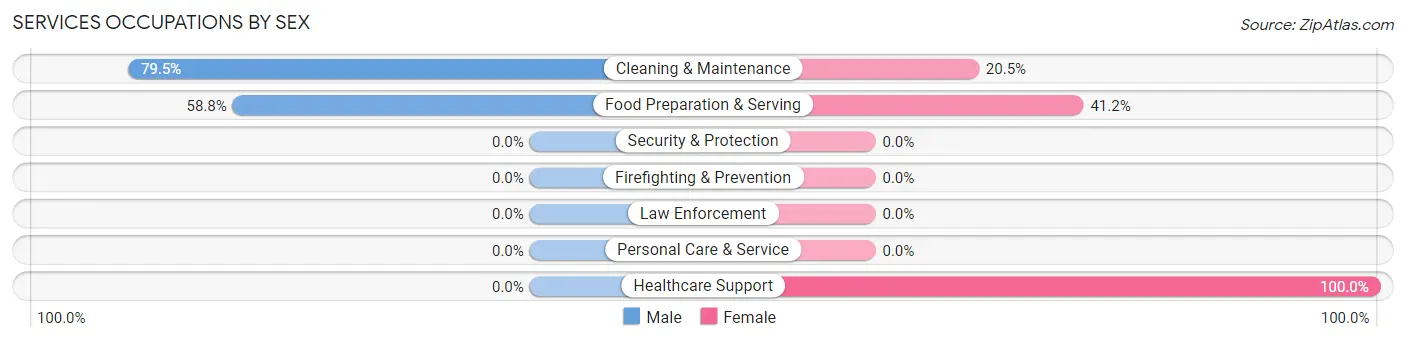
Services Occupations by Sex
Within the Services occupations in San Miguel CDP San Luis Obispo County, the most male-oriented occupations are Cleaning & Maintenance (79.5%), and Food Preparation & Serving (58.8%), while the most female-oriented occupations are Healthcare Support (100.0%), Food Preparation & Serving (41.2%), and Cleaning & Maintenance (20.5%).
| Occupation | Male | Female |
| Healthcare Support | 0 (0.0%) | 15 (100.0%) |
| Security & Protection | 0 (0.0%) | 0 (0.0%) |
| Firefighting & Prevention | 0 (0.0%) | 0 (0.0%) |
| Law Enforcement | 0 (0.0%) | 0 (0.0%) |
| Food Preparation & Serving | 110 (58.8%) | 77 (41.2%) |
| Cleaning & Maintenance | 171 (79.5%) | 44 (20.5%) |
| Personal Care & Service | 0 (0.0%) | 0 (0.0%) |
| Total (Category) | 281 (67.4%) | 136 (32.6%) |
| Total (Overall) | 915 (70.2%) | 388 (29.8%) |
Sales and Office Occupations
The most common Sales and Office occupations in San Miguel CDP San Luis Obispo County are Office & Administration (152 | 11.7%), and Sales & Related (56 | 4.3%).

Sales and Office Occupations by Sex

| Occupation | Male | Female |
| Sales & Related | 56 (100.0%) | 0 (0.0%) |
| Office & Administration | 55 (36.2%) | 97 (63.8%) |
| Total (Category) | 111 (53.4%) | 97 (46.6%) |
| Total (Overall) | 915 (70.2%) | 388 (29.8%) |
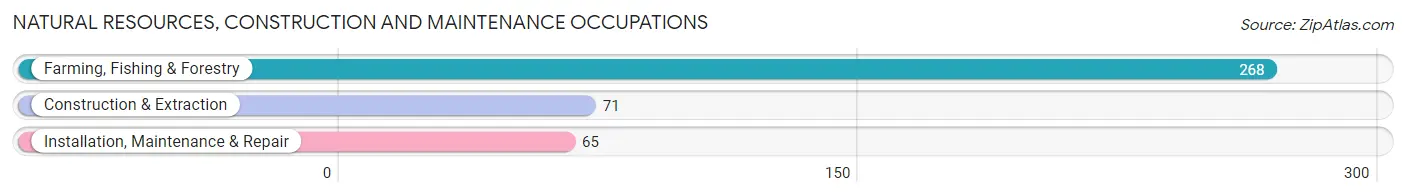
Natural Resources, Construction and Maintenance Occupations
The most common Natural Resources, Construction and Maintenance occupations in San Miguel CDP San Luis Obispo County are Farming, Fishing & Forestry (268 | 20.6%), Construction & Extraction (71 | 5.4%), and Installation, Maintenance & Repair (65 | 5.0%).
Natural Resources, Construction and Maintenance Occupations by Sex

| Occupation | Male | Female |
| Farming, Fishing & Forestry | 239 (89.2%) | 29 (10.8%) |
| Construction & Extraction | 71 (100.0%) | 0 (0.0%) |
| Installation, Maintenance & Repair | 65 (100.0%) | 0 (0.0%) |
| Total (Category) | 375 (92.8%) | 29 (7.2%) |
| Total (Overall) | 915 (70.2%) | 388 (29.8%) |
Production, Transportation and Moving Occupations
The most common Production, Transportation and Moving occupations in San Miguel CDP San Luis Obispo County are Production (98 | 7.5%), and Transportation (16 | 1.2%).
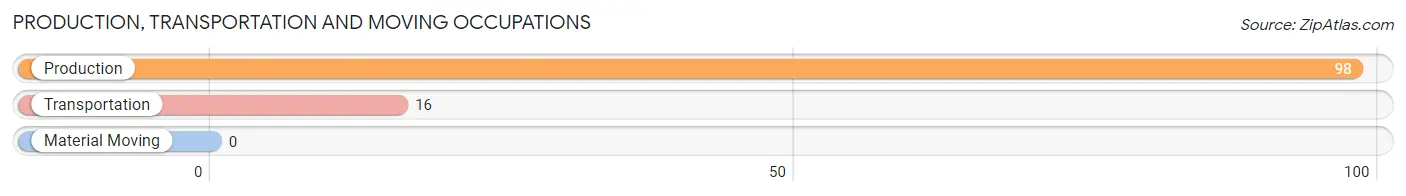
Production, Transportation and Moving Occupations by Sex
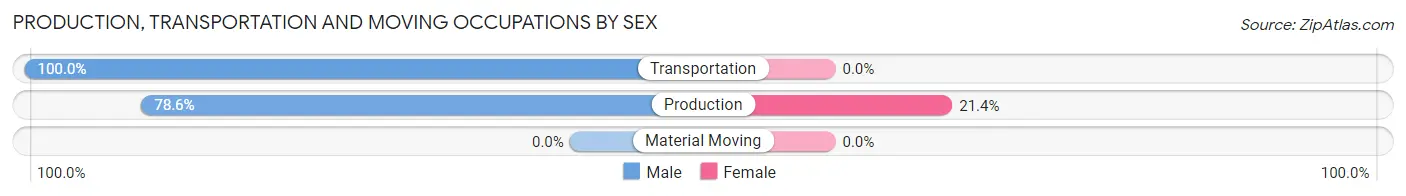
| Occupation | Male | Female |
| Production | 77 (78.6%) | 21 (21.4%) |
| Transportation | 16 (100.0%) | 0 (0.0%) |
| Material Moving | 0 (0.0%) | 0 (0.0%) |
| Total (Category) | 93 (81.6%) | 21 (18.4%) |
| Total (Overall) | 915 (70.2%) | 388 (29.8%) |
Employment Industries by Sex in San Miguel CDP San Luis Obispo County
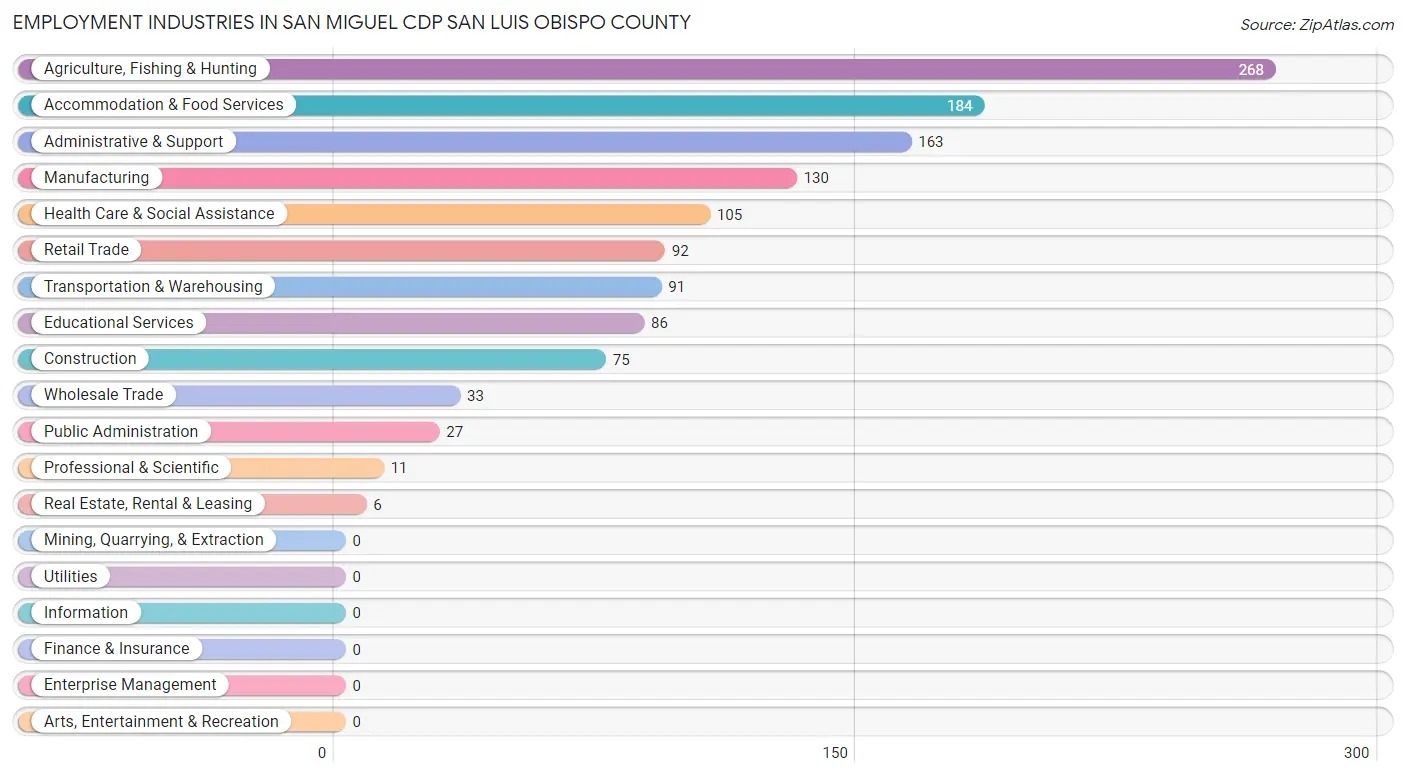
Employment Industries in San Miguel CDP San Luis Obispo County
The major employment industries in San Miguel CDP San Luis Obispo County include Agriculture, Fishing & Hunting (268 | 20.6%), Accommodation & Food Services (184 | 14.1%), Administrative & Support (163 | 12.5%), Manufacturing (130 | 10.0%), and Health Care & Social Assistance (105 | 8.1%).
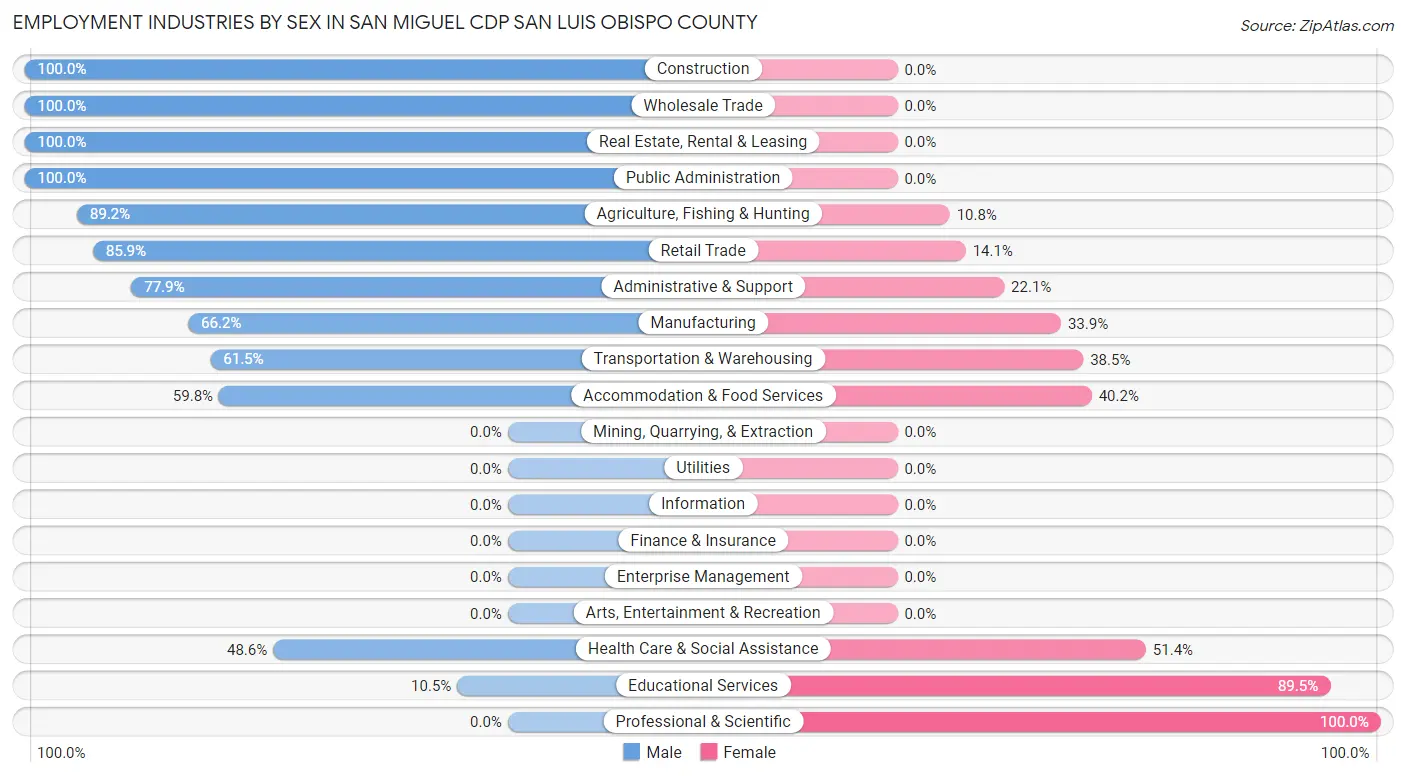
Employment Industries by Sex in San Miguel CDP San Luis Obispo County
The San Miguel CDP San Luis Obispo County industries that see more men than women are Construction (100.0%), Wholesale Trade (100.0%), and Real Estate, Rental & Leasing (100.0%), whereas the industries that tend to have a higher number of women are Professional & Scientific (100.0%), Educational Services (89.5%), and Health Care & Social Assistance (51.4%).
| Industry | Male | Female |
| Agriculture, Fishing & Hunting | 239 (89.2%) | 29 (10.8%) |
| Mining, Quarrying, & Extraction | 0 (0.0%) | 0 (0.0%) |
| Construction | 75 (100.0%) | 0 (0.0%) |
| Manufacturing | 86 (66.1%) | 44 (33.9%) |
| Wholesale Trade | 33 (100.0%) | 0 (0.0%) |
| Retail Trade | 79 (85.9%) | 13 (14.1%) |
| Transportation & Warehousing | 56 (61.5%) | 35 (38.5%) |
| Utilities | 0 (0.0%) | 0 (0.0%) |
| Information | 0 (0.0%) | 0 (0.0%) |
| Finance & Insurance | 0 (0.0%) | 0 (0.0%) |
| Real Estate, Rental & Leasing | 6 (100.0%) | 0 (0.0%) |
| Professional & Scientific | 0 (0.0%) | 11 (100.0%) |
| Enterprise Management | 0 (0.0%) | 0 (0.0%) |
| Administrative & Support | 127 (77.9%) | 36 (22.1%) |
| Educational Services | 9 (10.5%) | 77 (89.5%) |
| Health Care & Social Assistance | 51 (48.6%) | 54 (51.4%) |
| Arts, Entertainment & Recreation | 0 (0.0%) | 0 (0.0%) |
| Accommodation & Food Services | 110 (59.8%) | 74 (40.2%) |
| Public Administration | 27 (100.0%) | 0 (0.0%) |
| Total | 915 (70.2%) | 388 (29.8%) |
Education in San Miguel CDP San Luis Obispo County
School Enrollment in San Miguel CDP San Luis Obispo County
The most common levels of schooling among the 1,026 students in San Miguel CDP San Luis Obispo County are high school (296 | 28.8%), middle school (222 | 21.6%), and elementary school (219 | 21.3%).
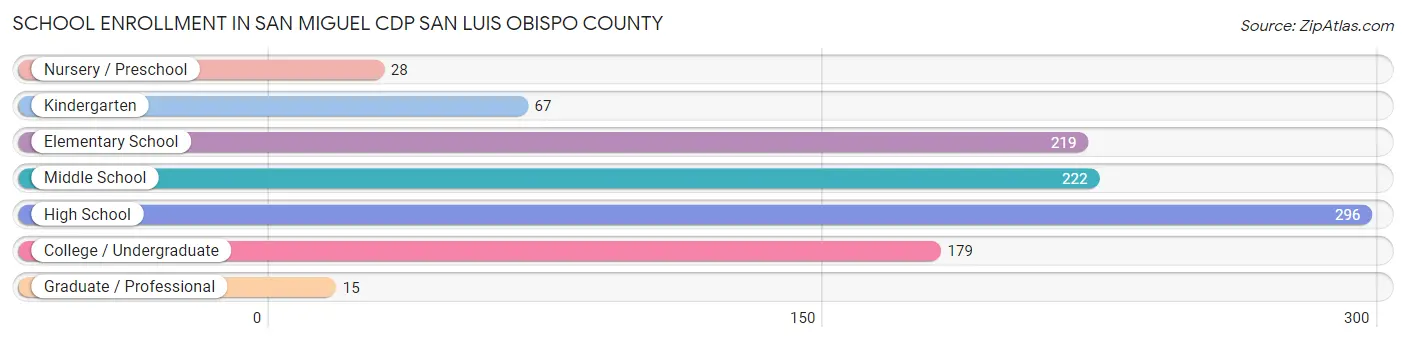
| School Level | # Students | % Students |
| Nursery / Preschool | 28 | 2.7% |
| Kindergarten | 67 | 6.5% |
| Elementary School | 219 | 21.3% |
| Middle School | 222 | 21.6% |
| High School | 296 | 28.8% |
| College / Undergraduate | 179 | 17.4% |
| Graduate / Professional | 15 | 1.5% |
| Total | 1,026 | 100.0% |
School Enrollment by Age by Funding Source in San Miguel CDP San Luis Obispo County
Out of a total of 1,026 students who are enrolled in schools in San Miguel CDP San Luis Obispo County, 25 (2.4%) attend a private institution, while the remaining 1,001 (97.6%) are enrolled in public schools. The age group of 25 to 34 year olds has the highest likelihood of being enrolled in private schools, with 15 (31.2% in the age bracket) enrolled. Conversely, the age group of 10 to 14 year olds has the lowest likelihood of being enrolled in a private school, with 334 (100.0% in the age bracket) attending a public institution.
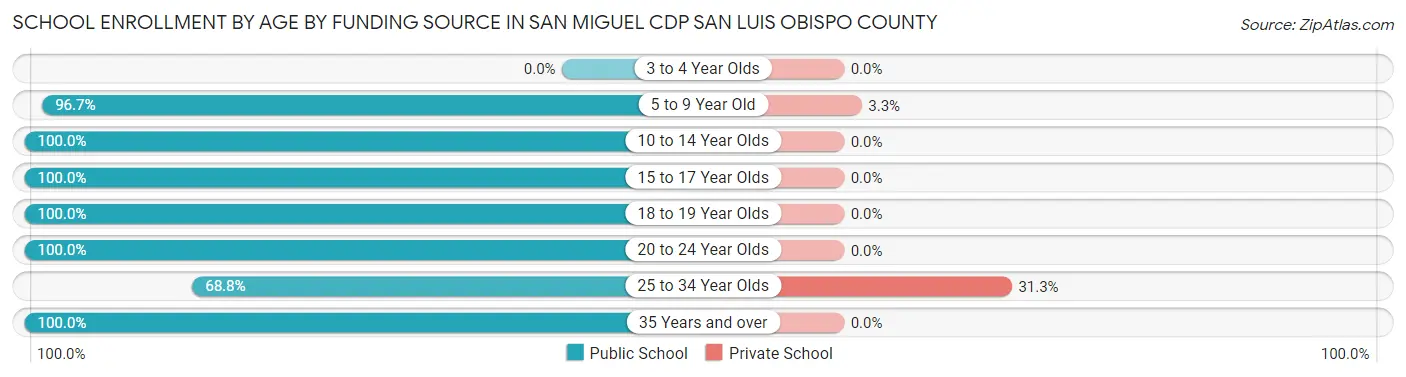
| Age Bracket | Public School | Private School |
| 3 to 4 Year Olds | 0 (0.0%) | 0 (0.0%) |
| 5 to 9 Year Old | 294 (96.7%) | 10 (3.3%) |
| 10 to 14 Year Olds | 334 (100.0%) | 0 (0.0%) |
| 15 to 17 Year Olds | 117 (100.0%) | 0 (0.0%) |
| 18 to 19 Year Olds | 93 (100.0%) | 0 (0.0%) |
| 20 to 24 Year Olds | 122 (100.0%) | 0 (0.0%) |
| 25 to 34 Year Olds | 33 (68.8%) | 15 (31.2%) |
| 35 Years and over | 8 (100.0%) | 0 (0.0%) |
| Total | 1,001 (97.6%) | 25 (2.4%) |
Educational Attainment by Field of Study in San Miguel CDP San Luis Obispo County
Engineering (66 | 27.7%), business (63 | 26.5%), education (48 | 20.2%), liberal arts & history (32 | 13.5%), and bio, nature & agricultural (21 | 8.8%) are the most common fields of study among 238 individuals in San Miguel CDP San Luis Obispo County who have obtained a bachelor's degree or higher.
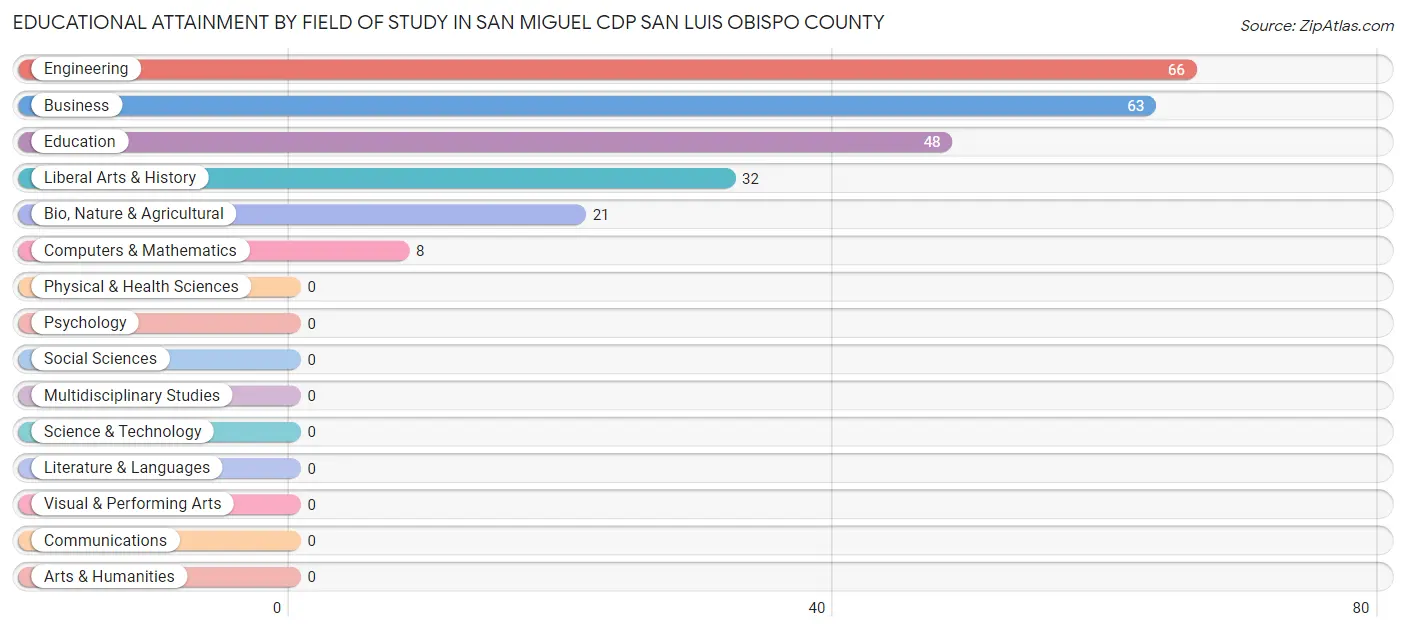
| Field of Study | # Graduates | % Graduates |
| Computers & Mathematics | 8 | 3.4% |
| Bio, Nature & Agricultural | 21 | 8.8% |
| Physical & Health Sciences | 0 | 0.0% |
| Psychology | 0 | 0.0% |
| Social Sciences | 0 | 0.0% |
| Engineering | 66 | 27.7% |
| Multidisciplinary Studies | 0 | 0.0% |
| Science & Technology | 0 | 0.0% |
| Business | 63 | 26.5% |
| Education | 48 | 20.2% |
| Literature & Languages | 0 | 0.0% |
| Liberal Arts & History | 32 | 13.5% |
| Visual & Performing Arts | 0 | 0.0% |
| Communications | 0 | 0.0% |
| Arts & Humanities | 0 | 0.0% |
| Total | 238 | 100.0% |
Transportation & Commute in San Miguel CDP San Luis Obispo County
Vehicle Availability by Sex in San Miguel CDP San Luis Obispo County
The most prevalent vehicle ownership categories in San Miguel CDP San Luis Obispo County are males with 3 vehicles (394, accounting for 43.3%) and females with 3 vehicles (61, making up 105.1%).
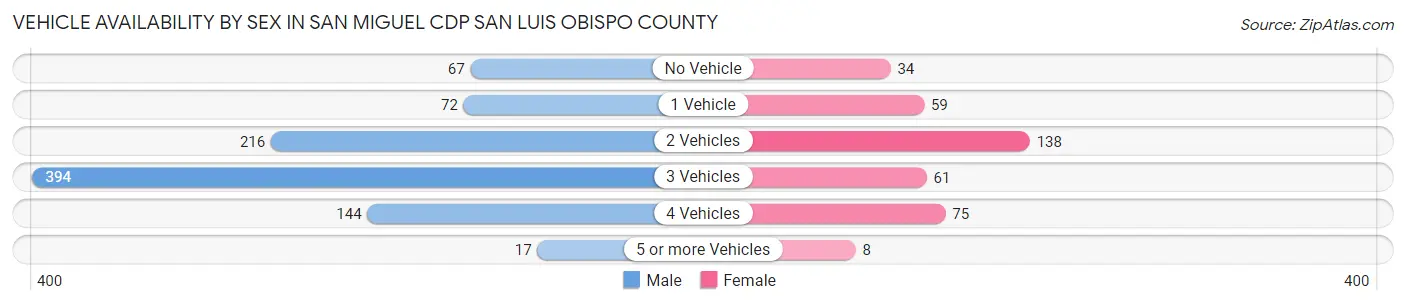
| Vehicles Available | Male | Female |
| No Vehicle | 67 (7.4%) | 34 (9.1%) |
| 1 Vehicle | 72 (7.9%) | 59 (15.7%) |
| 2 Vehicles | 216 (23.7%) | 138 (36.8%) |
| 3 Vehicles | 394 (43.3%) | 61 (16.3%) |
| 4 Vehicles | 144 (15.8%) | 75 (20.0%) |
| 5 or more Vehicles | 17 (1.9%) | 8 (2.1%) |
| Total | 910 (100.0%) | 375 (100.0%) |
Commute Time in San Miguel CDP San Luis Obispo County
The most frequently occuring commute durations in San Miguel CDP San Luis Obispo County are 15 to 19 minutes (279 commuters, 22.4%), 30 to 34 minutes (214 commuters, 17.2%), and 10 to 14 minutes (203 commuters, 16.3%).
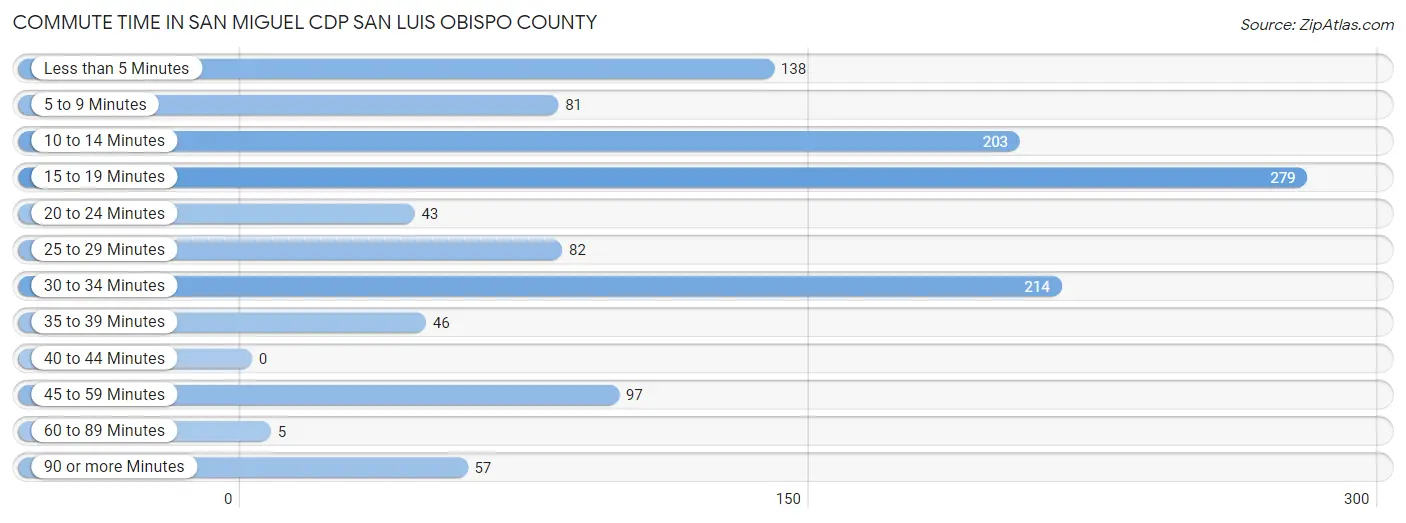
| Commute Time | # Commuters | % Commuters |
| Less than 5 Minutes | 138 | 11.1% |
| 5 to 9 Minutes | 81 | 6.5% |
| 10 to 14 Minutes | 203 | 16.3% |
| 15 to 19 Minutes | 279 | 22.4% |
| 20 to 24 Minutes | 43 | 3.5% |
| 25 to 29 Minutes | 82 | 6.6% |
| 30 to 34 Minutes | 214 | 17.2% |
| 35 to 39 Minutes | 46 | 3.7% |
| 40 to 44 Minutes | 0 | 0.0% |
| 45 to 59 Minutes | 97 | 7.8% |
| 60 to 89 Minutes | 5 | 0.4% |
| 90 or more Minutes | 57 | 4.6% |
Commute Time by Sex in San Miguel CDP San Luis Obispo County
The most common commute times in San Miguel CDP San Luis Obispo County are 15 to 19 minutes (233 commuters, 25.5%) for males and 10 to 14 minutes (77 commuters, 23.2%) for females.
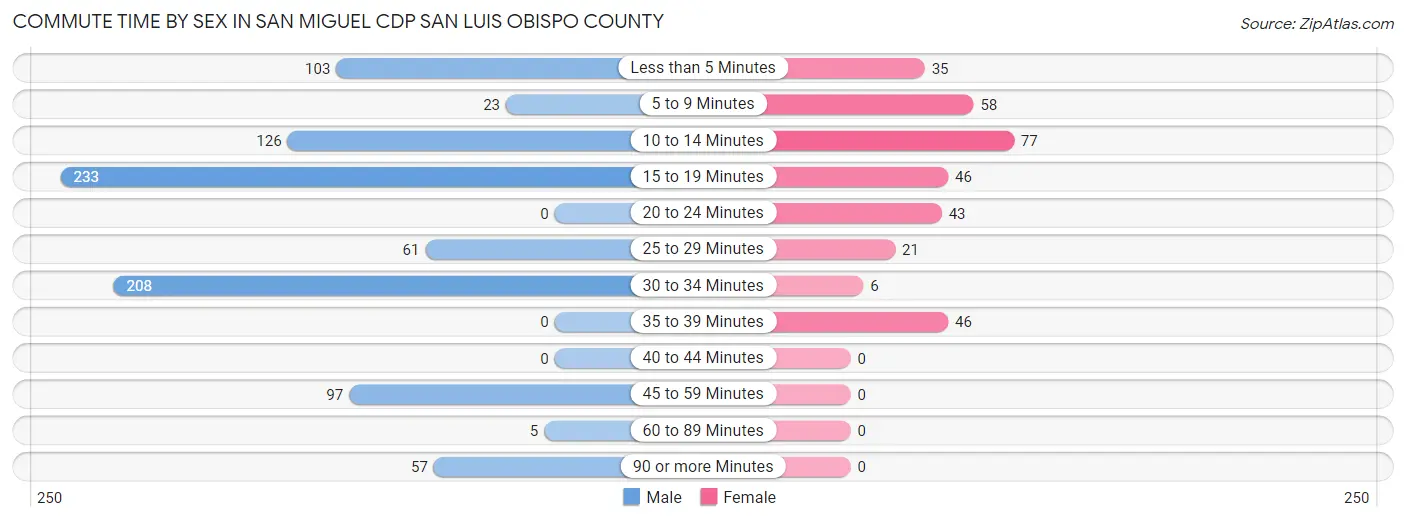
| Commute Time | Male | Female |
| Less than 5 Minutes | 103 (11.3%) | 35 (10.5%) |
| 5 to 9 Minutes | 23 (2.5%) | 58 (17.5%) |
| 10 to 14 Minutes | 126 (13.8%) | 77 (23.2%) |
| 15 to 19 Minutes | 233 (25.5%) | 46 (13.9%) |
| 20 to 24 Minutes | 0 (0.0%) | 43 (13.0%) |
| 25 to 29 Minutes | 61 (6.7%) | 21 (6.3%) |
| 30 to 34 Minutes | 208 (22.8%) | 6 (1.8%) |
| 35 to 39 Minutes | 0 (0.0%) | 46 (13.9%) |
| 40 to 44 Minutes | 0 (0.0%) | 0 (0.0%) |
| 45 to 59 Minutes | 97 (10.6%) | 0 (0.0%) |
| 60 to 89 Minutes | 5 (0.5%) | 0 (0.0%) |
| 90 or more Minutes | 57 (6.2%) | 0 (0.0%) |
Time of Departure to Work by Sex in San Miguel CDP San Luis Obispo County
The most frequent times of departure to work in San Miguel CDP San Luis Obispo County are 6:30 AM to 6:59 AM (217, 23.8%) for males and 11:00 AM to 11:59 AM (75, 22.6%) for females.
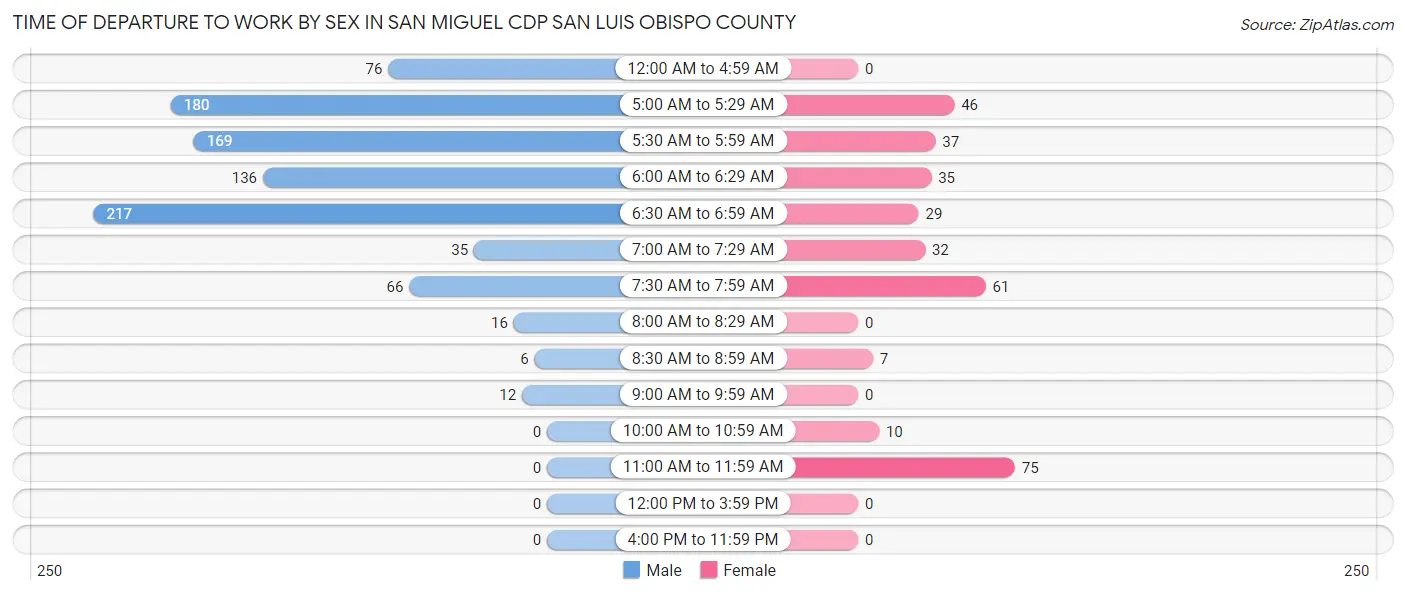
| Time of Departure | Male | Female |
| 12:00 AM to 4:59 AM | 76 (8.3%) | 0 (0.0%) |
| 5:00 AM to 5:29 AM | 180 (19.7%) | 46 (13.9%) |
| 5:30 AM to 5:59 AM | 169 (18.5%) | 37 (11.1%) |
| 6:00 AM to 6:29 AM | 136 (14.9%) | 35 (10.5%) |
| 6:30 AM to 6:59 AM | 217 (23.8%) | 29 (8.7%) |
| 7:00 AM to 7:29 AM | 35 (3.8%) | 32 (9.6%) |
| 7:30 AM to 7:59 AM | 66 (7.2%) | 61 (18.4%) |
| 8:00 AM to 8:29 AM | 16 (1.8%) | 0 (0.0%) |
| 8:30 AM to 8:59 AM | 6 (0.7%) | 7 (2.1%) |
| 9:00 AM to 9:59 AM | 12 (1.3%) | 0 (0.0%) |
| 10:00 AM to 10:59 AM | 0 (0.0%) | 10 (3.0%) |
| 11:00 AM to 11:59 AM | 0 (0.0%) | 75 (22.6%) |
| 12:00 PM to 3:59 PM | 0 (0.0%) | 0 (0.0%) |
| 4:00 PM to 11:59 PM | 0 (0.0%) | 0 (0.0%) |
| Total | 913 (100.0%) | 332 (100.0%) |
Housing Occupancy in San Miguel CDP San Luis Obispo County
Occupancy by Ownership in San Miguel CDP San Luis Obispo County
Of the total 782 dwellings in San Miguel CDP San Luis Obispo County, owner-occupied units account for 406 (51.9%), while renter-occupied units make up 376 (48.1%).
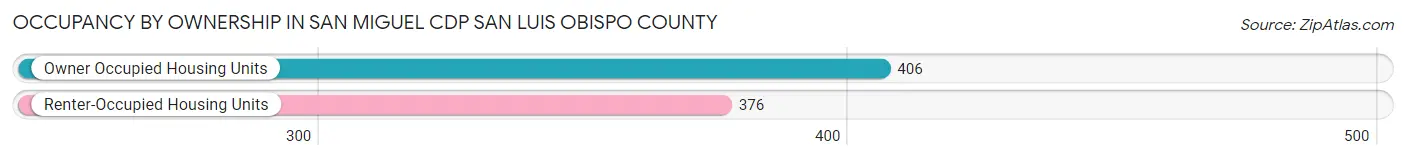
| Occupancy | # Housing Units | % Housing Units |
| Owner Occupied Housing Units | 406 | 51.9% |
| Renter-Occupied Housing Units | 376 | 48.1% |
| Total Occupied Housing Units | 782 | 100.0% |
Occupancy by Household Size in San Miguel CDP San Luis Obispo County
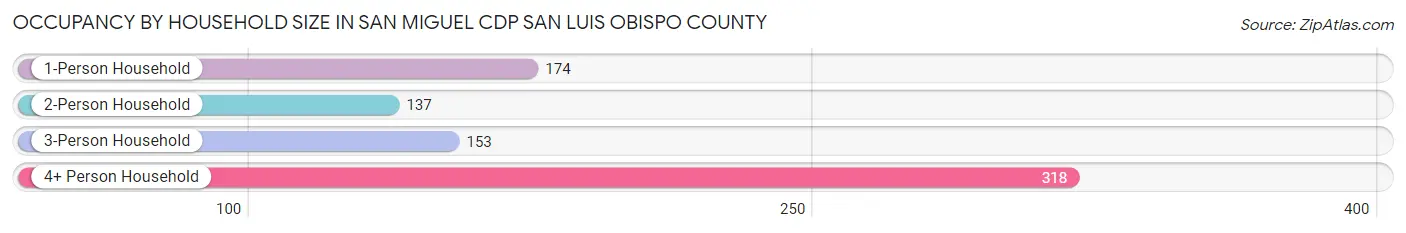
| Household Size | # Housing Units | % Housing Units |
| 1-Person Household | 174 | 22.3% |
| 2-Person Household | 137 | 17.5% |
| 3-Person Household | 153 | 19.6% |
| 4+ Person Household | 318 | 40.7% |
| Total Housing Units | 782 | 100.0% |
Occupancy by Ownership by Household Size in San Miguel CDP San Luis Obispo County
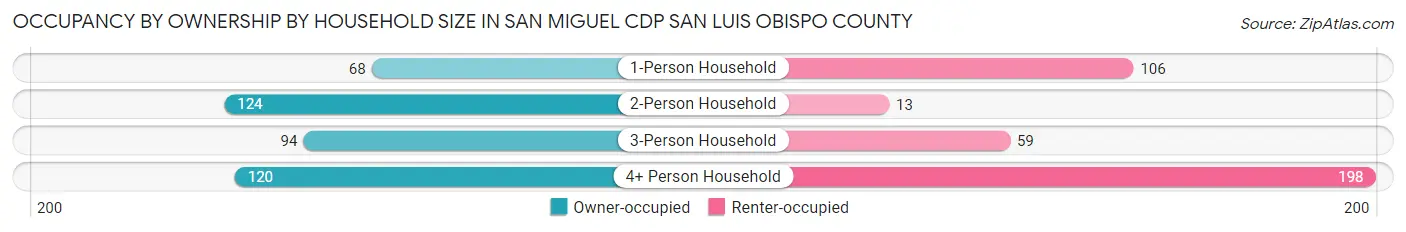
| Household Size | Owner-occupied | Renter-occupied |
| 1-Person Household | 68 (39.1%) | 106 (60.9%) |
| 2-Person Household | 124 (90.5%) | 13 (9.5%) |
| 3-Person Household | 94 (61.4%) | 59 (38.6%) |
| 4+ Person Household | 120 (37.7%) | 198 (62.3%) |
| Total Housing Units | 406 (51.9%) | 376 (48.1%) |
Occupancy by Educational Attainment in San Miguel CDP San Luis Obispo County

| Household Size | Owner-occupied | Renter-occupied |
| Less than High School | 32 (27.6%) | 84 (72.4%) |
| High School Diploma | 170 (57.2%) | 127 (42.8%) |
| College/Associate Degree | 139 (59.4%) | 95 (40.6%) |
| Bachelor's Degree or higher | 65 (48.1%) | 70 (51.8%) |
Occupancy by Age of Householder in San Miguel CDP San Luis Obispo County
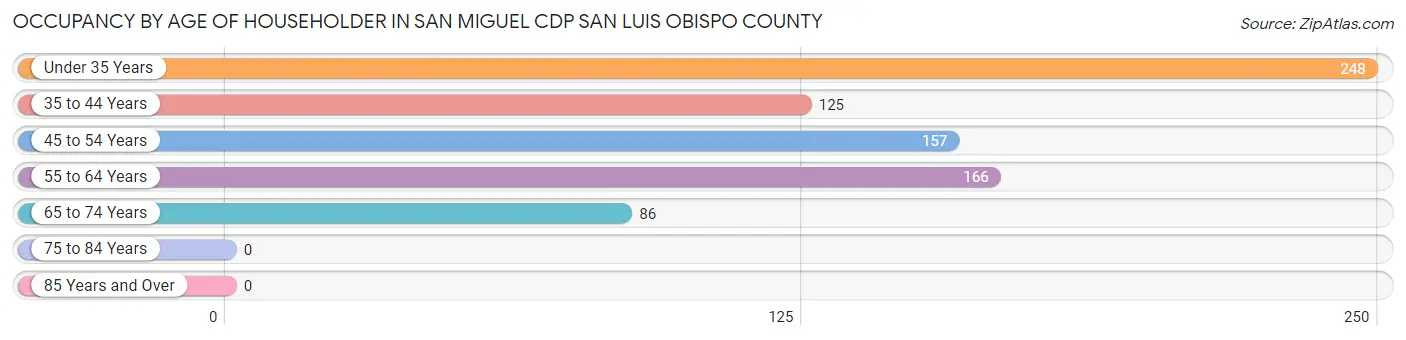
| Age Bracket | # Households | % Households |
| Under 35 Years | 248 | 31.7% |
| 35 to 44 Years | 125 | 16.0% |
| 45 to 54 Years | 157 | 20.1% |
| 55 to 64 Years | 166 | 21.2% |
| 65 to 74 Years | 86 | 11.0% |
| 75 to 84 Years | 0 | 0.0% |
| 85 Years and Over | 0 | 0.0% |
| Total | 782 | 100.0% |
Housing Finances in San Miguel CDP San Luis Obispo County
Median Income by Occupancy in San Miguel CDP San Luis Obispo County
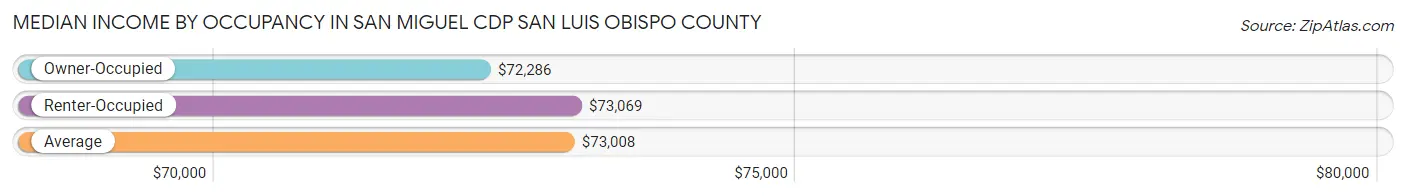
| Occupancy Type | # Households | Median Income |
| Owner-Occupied | 406 (51.9%) | $72,286 |
| Renter-Occupied | 376 (48.1%) | $73,069 |
| Average | 782 (100.0%) | $73,008 |
Occupancy by Householder Income Bracket in San Miguel CDP San Luis Obispo County
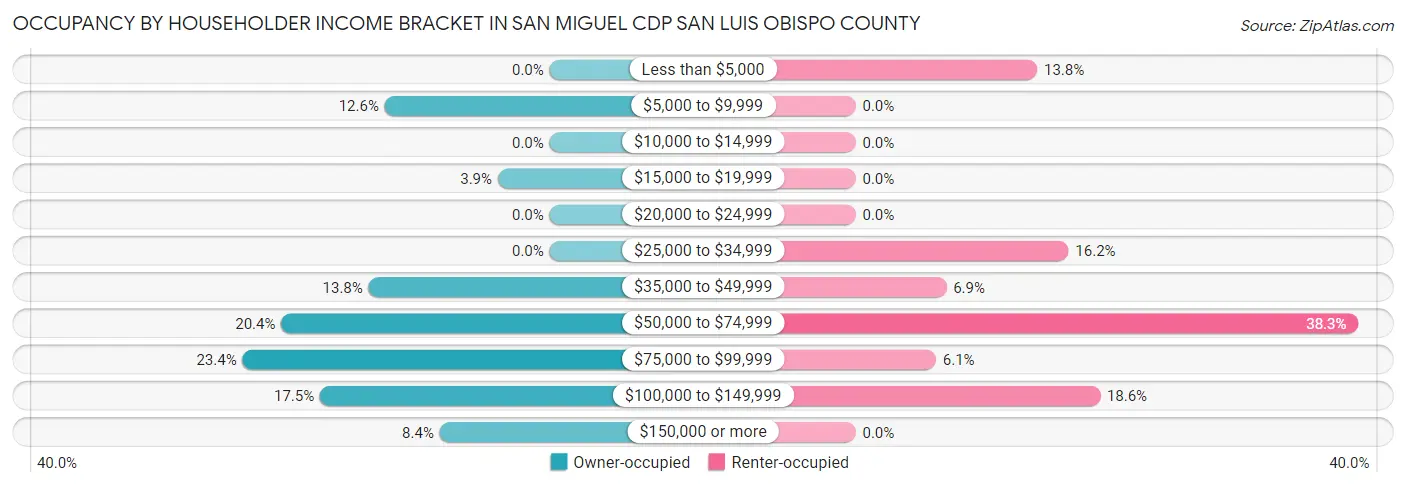
| Income Bracket | Owner-occupied | Renter-occupied |
| Less than $5,000 | 0 (0.0%) | 52 (13.8%) |
| $5,000 to $9,999 | 51 (12.6%) | 0 (0.0%) |
| $10,000 to $14,999 | 0 (0.0%) | 0 (0.0%) |
| $15,000 to $19,999 | 16 (3.9%) | 0 (0.0%) |
| $20,000 to $24,999 | 0 (0.0%) | 0 (0.0%) |
| $25,000 to $34,999 | 0 (0.0%) | 61 (16.2%) |
| $35,000 to $49,999 | 56 (13.8%) | 26 (6.9%) |
| $50,000 to $74,999 | 83 (20.4%) | 144 (38.3%) |
| $75,000 to $99,999 | 95 (23.4%) | 23 (6.1%) |
| $100,000 to $149,999 | 71 (17.5%) | 70 (18.6%) |
| $150,000 or more | 34 (8.4%) | 0 (0.0%) |
| Total | 406 (100.0%) | 376 (100.0%) |
Monthly Housing Cost Tiers in San Miguel CDP San Luis Obispo County
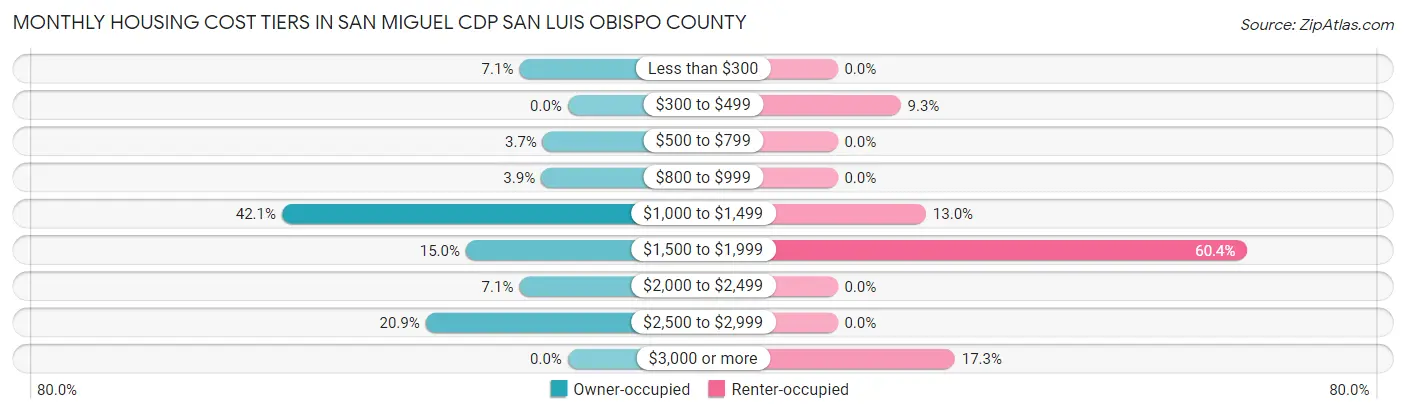
| Monthly Cost | Owner-occupied | Renter-occupied |
| Less than $300 | 29 (7.1%) | 0 (0.0%) |
| $300 to $499 | 0 (0.0%) | 35 (9.3%) |
| $500 to $799 | 15 (3.7%) | 0 (0.0%) |
| $800 to $999 | 16 (3.9%) | 0 (0.0%) |
| $1,000 to $1,499 | 171 (42.1%) | 49 (13.0%) |
| $1,500 to $1,999 | 61 (15.0%) | 227 (60.4%) |
| $2,000 to $2,499 | 29 (7.1%) | 0 (0.0%) |
| $2,500 to $2,999 | 85 (20.9%) | 0 (0.0%) |
| $3,000 or more | 0 (0.0%) | 65 (17.3%) |
| Total | 406 (100.0%) | 376 (100.0%) |
Physical Housing Characteristics in San Miguel CDP San Luis Obispo County
Housing Structures in San Miguel CDP San Luis Obispo County
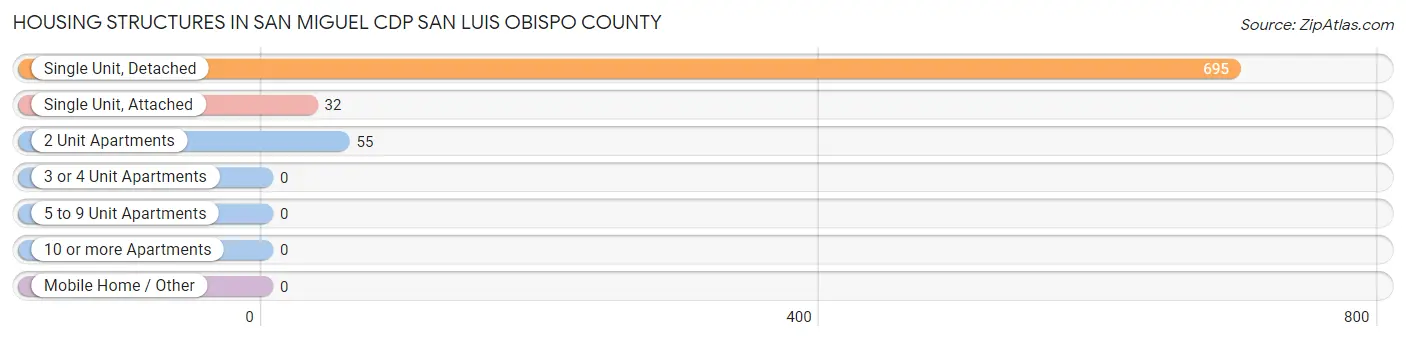
| Structure Type | # Housing Units | % Housing Units |
| Single Unit, Detached | 695 | 88.9% |
| Single Unit, Attached | 32 | 4.1% |
| 2 Unit Apartments | 55 | 7.0% |
| 3 or 4 Unit Apartments | 0 | 0.0% |
| 5 to 9 Unit Apartments | 0 | 0.0% |
| 10 or more Apartments | 0 | 0.0% |
| Mobile Home / Other | 0 | 0.0% |
| Total | 782 | 100.0% |
Housing Structures by Occupancy in San Miguel CDP San Luis Obispo County
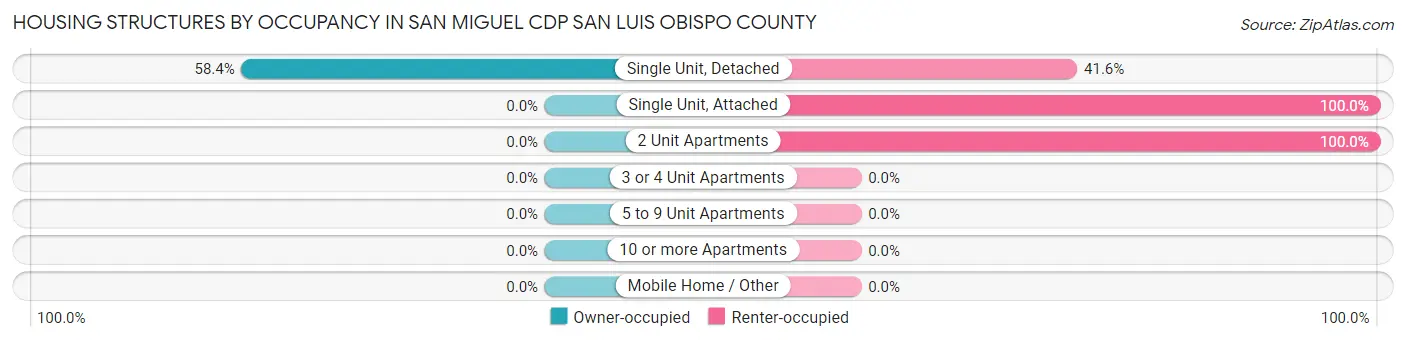
| Structure Type | Owner-occupied | Renter-occupied |
| Single Unit, Detached | 406 (58.4%) | 289 (41.6%) |
| Single Unit, Attached | 0 (0.0%) | 32 (100.0%) |
| 2 Unit Apartments | 0 (0.0%) | 55 (100.0%) |
| 3 or 4 Unit Apartments | 0 (0.0%) | 0 (0.0%) |
| 5 to 9 Unit Apartments | 0 (0.0%) | 0 (0.0%) |
| 10 or more Apartments | 0 (0.0%) | 0 (0.0%) |
| Mobile Home / Other | 0 (0.0%) | 0 (0.0%) |
| Total | 406 (51.9%) | 376 (48.1%) |
Housing Structures by Number of Rooms in San Miguel CDP San Luis Obispo County
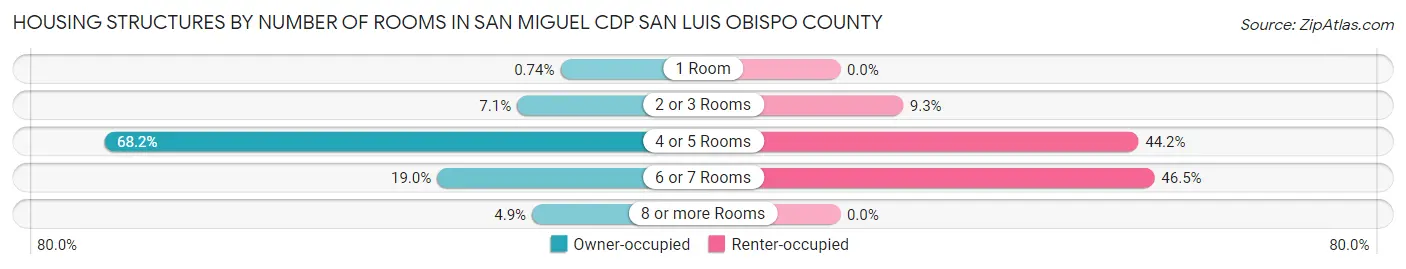
| Number of Rooms | Owner-occupied | Renter-occupied |
| 1 Room | 3 (0.7%) | 0 (0.0%) |
| 2 or 3 Rooms | 29 (7.1%) | 35 (9.3%) |
| 4 or 5 Rooms | 277 (68.2%) | 166 (44.2%) |
| 6 or 7 Rooms | 77 (19.0%) | 175 (46.5%) |
| 8 or more Rooms | 20 (4.9%) | 0 (0.0%) |
| Total | 406 (100.0%) | 376 (100.0%) |
Housing Structure by Heating Type in San Miguel CDP San Luis Obispo County
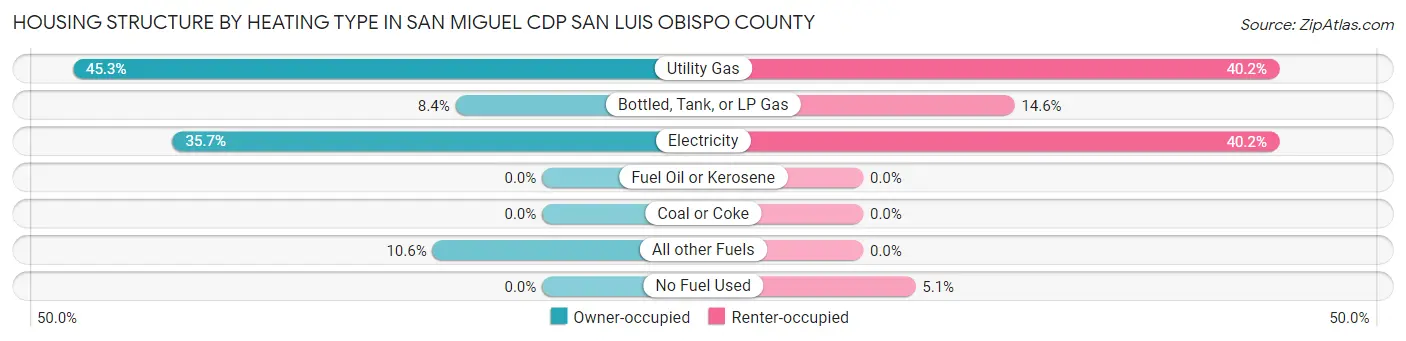
| Heating Type | Owner-occupied | Renter-occupied |
| Utility Gas | 184 (45.3%) | 151 (40.2%) |
| Bottled, Tank, or LP Gas | 34 (8.4%) | 55 (14.6%) |
| Electricity | 145 (35.7%) | 151 (40.2%) |
| Fuel Oil or Kerosene | 0 (0.0%) | 0 (0.0%) |
| Coal or Coke | 0 (0.0%) | 0 (0.0%) |
| All other Fuels | 43 (10.6%) | 0 (0.0%) |
| No Fuel Used | 0 (0.0%) | 19 (5.1%) |
| Total | 406 (100.0%) | 376 (100.0%) |
Household Vehicle Usage in San Miguel CDP San Luis Obispo County
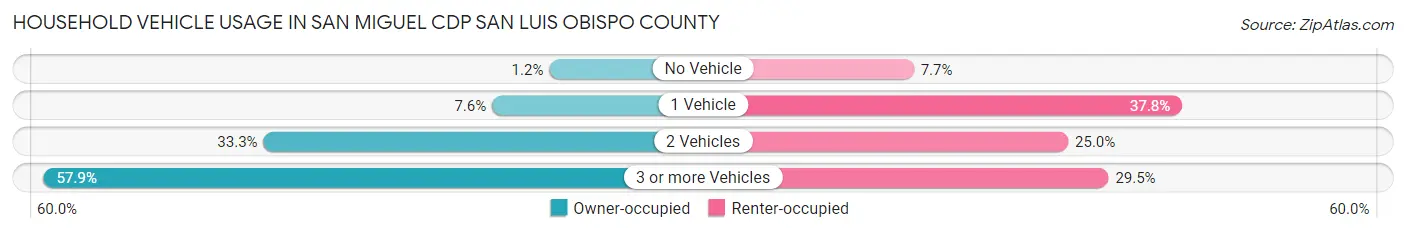
| Vehicles per Household | Owner-occupied | Renter-occupied |
| No Vehicle | 5 (1.2%) | 29 (7.7%) |
| 1 Vehicle | 31 (7.6%) | 142 (37.8%) |
| 2 Vehicles | 135 (33.3%) | 94 (25.0%) |
| 3 or more Vehicles | 235 (57.9%) | 111 (29.5%) |
| Total | 406 (100.0%) | 376 (100.0%) |
Real Estate & Mortgages in San Miguel CDP San Luis Obispo County
Real Estate and Mortgage Overview in San Miguel CDP San Luis Obispo County
| Characteristic | Without Mortgage | With Mortgage |
| Housing Units | 32 | 374 |
| Median Property Value | - | - |
| Median Household Income | $61,094 | $34 |
| Monthly Housing Costs | $956 | $0 |
| Real Estate Taxes | - | - |
Property Value by Mortgage Status in San Miguel CDP San Luis Obispo County
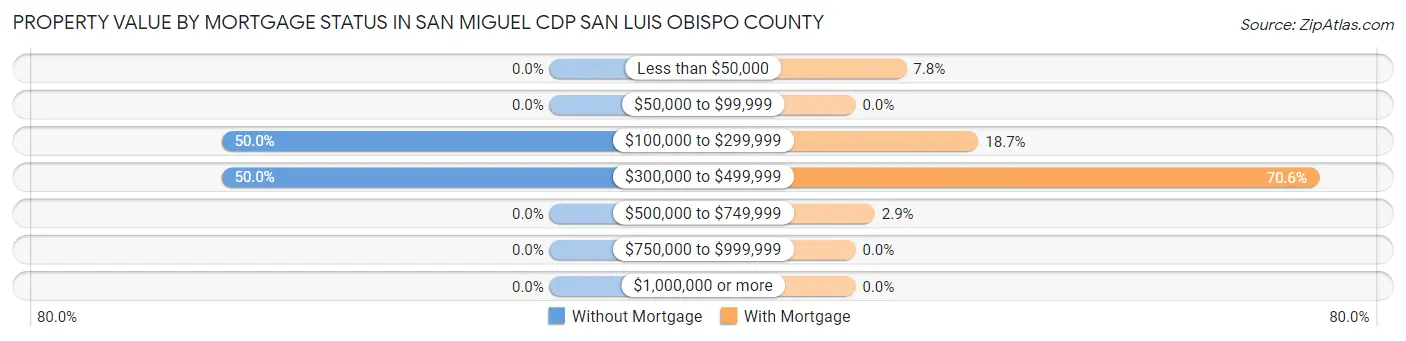
| Property Value | Without Mortgage | With Mortgage |
| Less than $50,000 | 0 (0.0%) | 29 (7.7%) |
| $50,000 to $99,999 | 0 (0.0%) | 0 (0.0%) |
| $100,000 to $299,999 | 16 (50.0%) | 70 (18.7%) |
| $300,000 to $499,999 | 16 (50.0%) | 264 (70.6%) |
| $500,000 to $749,999 | 0 (0.0%) | 11 (2.9%) |
| $750,000 to $999,999 | 0 (0.0%) | 0 (0.0%) |
| $1,000,000 or more | 0 (0.0%) | 0 (0.0%) |
| Total | 32 (100.0%) | 374 (100.0%) |
Household Income by Mortgage Status in San Miguel CDP San Luis Obispo County
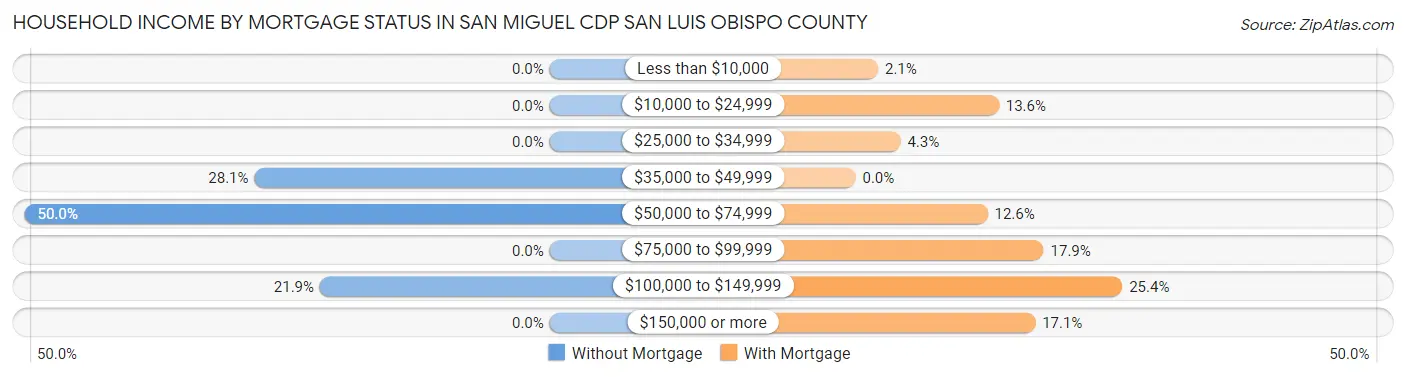
| Household Income | Without Mortgage | With Mortgage |
| Less than $10,000 | 0 (0.0%) | 8 (2.1%) |
| $10,000 to $24,999 | 0 (0.0%) | 51 (13.6%) |
| $25,000 to $34,999 | 0 (0.0%) | 16 (4.3%) |
| $35,000 to $49,999 | 9 (28.1%) | 0 (0.0%) |
| $50,000 to $74,999 | 16 (50.0%) | 47 (12.6%) |
| $75,000 to $99,999 | 0 (0.0%) | 67 (17.9%) |
| $100,000 to $149,999 | 7 (21.9%) | 95 (25.4%) |
| $150,000 or more | 0 (0.0%) | 64 (17.1%) |
| Total | 32 (100.0%) | 374 (100.0%) |
Property Value to Household Income Ratio in San Miguel CDP San Luis Obispo County
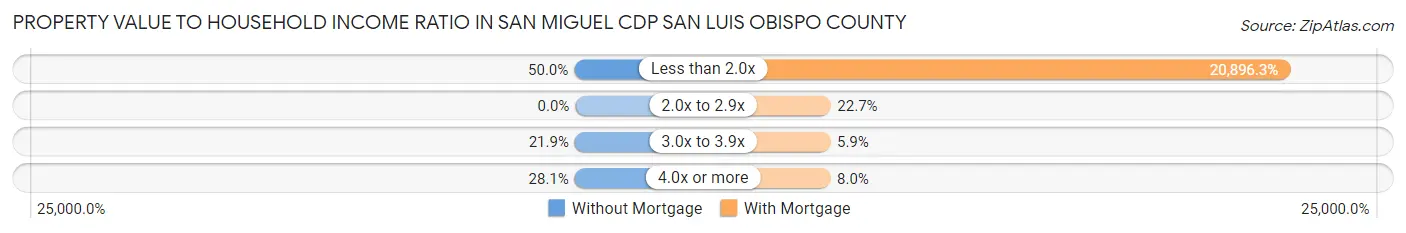
| Value-to-Income Ratio | Without Mortgage | With Mortgage |
| Less than 2.0x | 16 (50.0%) | 78,152 (20,896.3%) |
| 2.0x to 2.9x | 0 (0.0%) | 85 (22.7%) |
| 3.0x to 3.9x | 7 (21.9%) | 22 (5.9%) |
| 4.0x or more | 9 (28.1%) | 30 (8.0%) |
| Total | 32 (100.0%) | 374 (100.0%) |
Real Estate Taxes by Mortgage Status in San Miguel CDP San Luis Obispo County
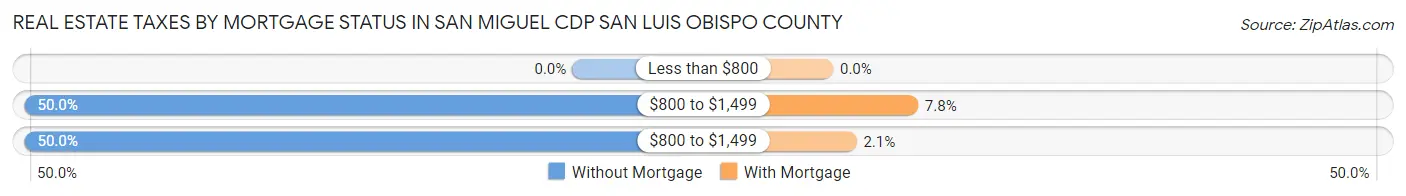
| Property Taxes | Without Mortgage | With Mortgage |
| Less than $800 | 0 (0.0%) | 0 (0.0%) |
| $800 to $1,499 | 16 (50.0%) | 29 (7.7%) |
| $800 to $1,499 | 16 (50.0%) | 8 (2.1%) |
| Total | 32 (100.0%) | 374 (100.0%) |
Health & Disability in San Miguel CDP San Luis Obispo County
Health Insurance Coverage by Age in San Miguel CDP San Luis Obispo County
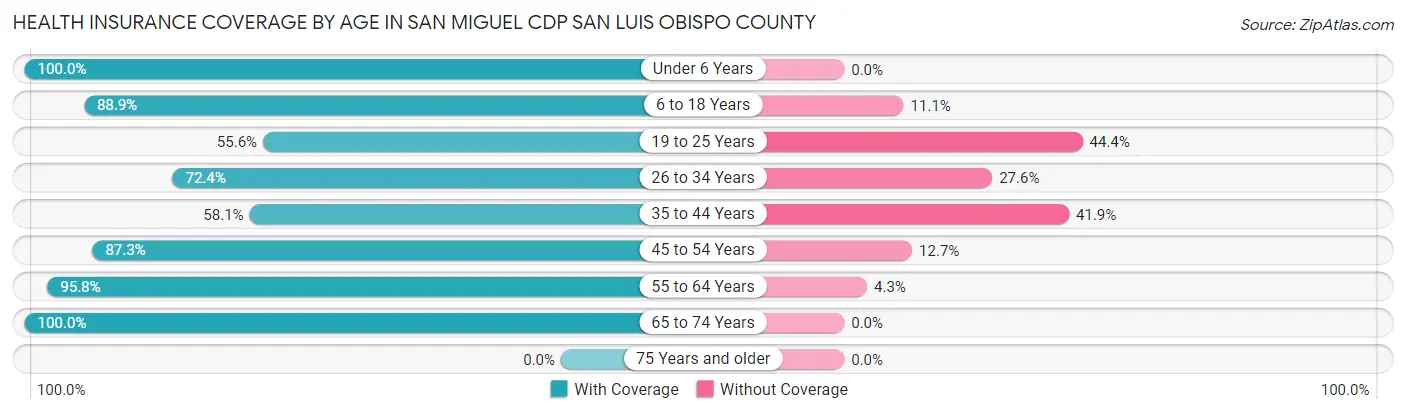
| Age Bracket | With Coverage | Without Coverage |
| Under 6 Years | 144 (100.0%) | 0 (0.0%) |
| 6 to 18 Years | 707 (88.9%) | 88 (11.1%) |
| 19 to 25 Years | 175 (55.6%) | 140 (44.4%) |
| 26 to 34 Years | 307 (72.4%) | 117 (27.6%) |
| 35 to 44 Years | 194 (58.1%) | 140 (41.9%) |
| 45 to 54 Years | 276 (87.3%) | 40 (12.7%) |
| 55 to 64 Years | 293 (95.8%) | 13 (4.3%) |
| 65 to 74 Years | 122 (100.0%) | 0 (0.0%) |
| 75 Years and older | 0 (0.0%) | 0 (0.0%) |
| Total | 2,218 (80.5%) | 538 (19.5%) |
Health Insurance Coverage by Citizenship Status in San Miguel CDP San Luis Obispo County
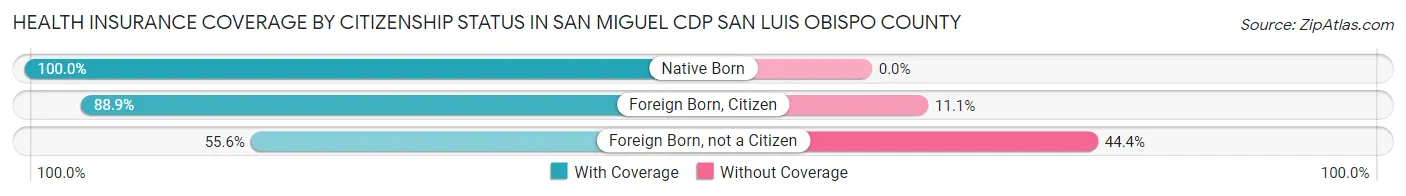
| Citizenship Status | With Coverage | Without Coverage |
| Native Born | 144 (100.0%) | 0 (0.0%) |
| Foreign Born, Citizen | 707 (88.9%) | 88 (11.1%) |
| Foreign Born, not a Citizen | 175 (55.6%) | 140 (44.4%) |
Health Insurance Coverage by Household Income in San Miguel CDP San Luis Obispo County
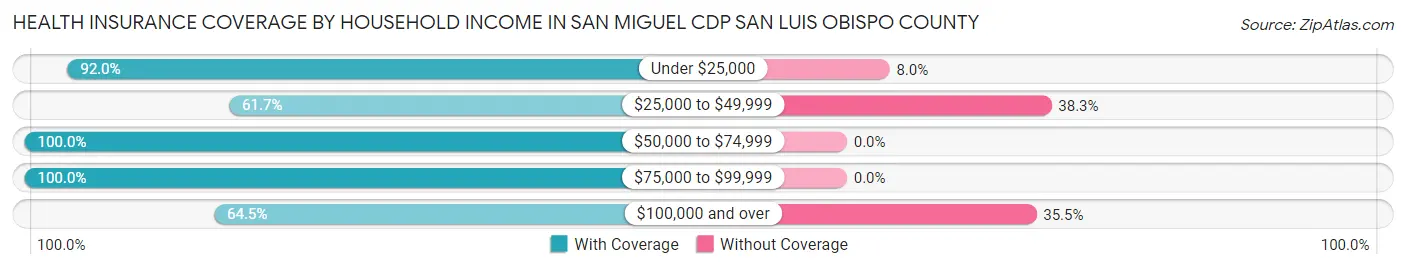
| Household Income | With Coverage | Without Coverage |
| Under $25,000 | 184 (92.0%) | 16 (8.0%) |
| $25,000 to $49,999 | 444 (61.7%) | 276 (38.3%) |
| $50,000 to $74,999 | 715 (100.0%) | 0 (0.0%) |
| $75,000 to $99,999 | 427 (100.0%) | 0 (0.0%) |
| $100,000 and over | 436 (64.5%) | 240 (35.5%) |
Public vs Private Health Insurance Coverage by Age in San Miguel CDP San Luis Obispo County
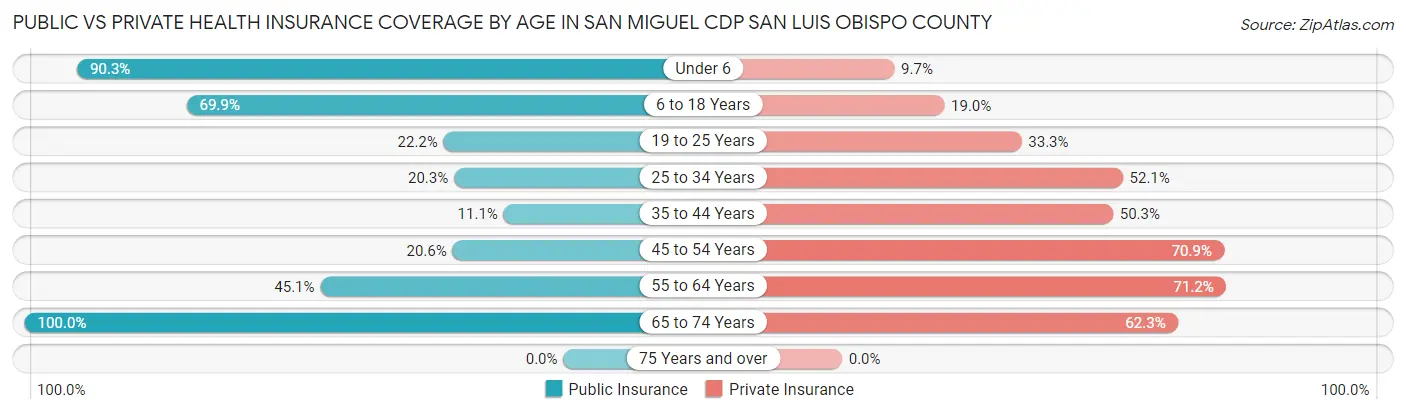
| Age Bracket | Public Insurance | Private Insurance |
| Under 6 | 130 (90.3%) | 14 (9.7%) |
| 6 to 18 Years | 556 (69.9%) | 151 (19.0%) |
| 19 to 25 Years | 70 (22.2%) | 105 (33.3%) |
| 25 to 34 Years | 86 (20.3%) | 221 (52.1%) |
| 35 to 44 Years | 37 (11.1%) | 168 (50.3%) |
| 45 to 54 Years | 65 (20.6%) | 224 (70.9%) |
| 55 to 64 Years | 138 (45.1%) | 218 (71.2%) |
| 65 to 74 Years | 122 (100.0%) | 76 (62.3%) |
| 75 Years and over | 0 (0.0%) | 0 (0.0%) |
| Total | 1,204 (43.7%) | 1,177 (42.7%) |
Disability Status by Sex by Age in San Miguel CDP San Luis Obispo County
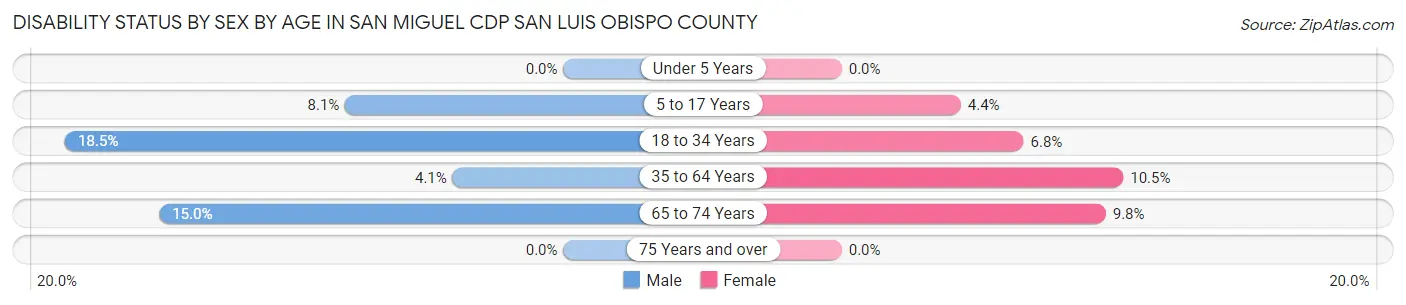
| Age Bracket | Male | Female |
| Under 5 Years | 0 (0.0%) | 0 (0.0%) |
| 5 to 17 Years | 41 (8.1%) | 11 (4.4%) |
| 18 to 34 Years | 94 (18.5%) | 21 (6.8%) |
| 35 to 64 Years | 22 (4.1%) | 44 (10.4%) |
| 65 to 74 Years | 3 (15.0%) | 10 (9.8%) |
| 75 Years and over | 0 (0.0%) | 0 (0.0%) |
Disability Class by Sex by Age in San Miguel CDP San Luis Obispo County
Disability Class: Hearing Difficulty
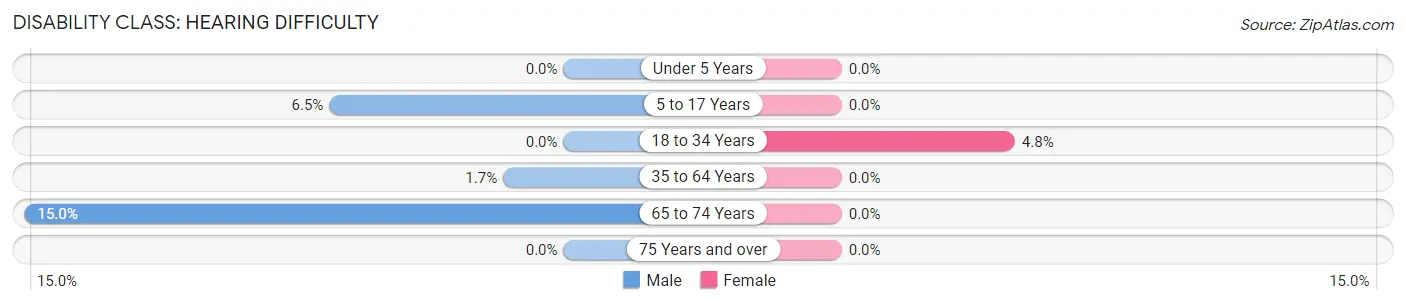
| Age Bracket | Male | Female |
| Under 5 Years | 0 (0.0%) | 0 (0.0%) |
| 5 to 17 Years | 33 (6.5%) | 0 (0.0%) |
| 18 to 34 Years | 0 (0.0%) | 15 (4.8%) |
| 35 to 64 Years | 9 (1.7%) | 0 (0.0%) |
| 65 to 74 Years | 3 (15.0%) | 0 (0.0%) |
| 75 Years and over | 0 (0.0%) | 0 (0.0%) |
Disability Class: Vision Difficulty
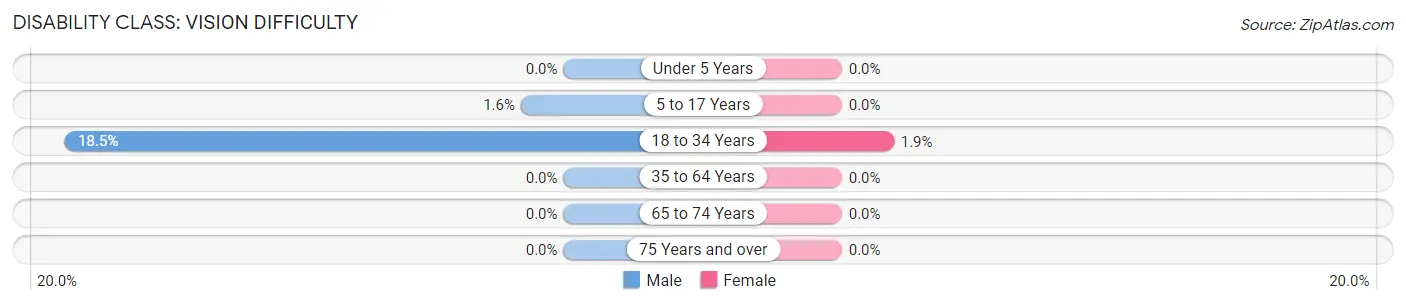
| Age Bracket | Male | Female |
| Under 5 Years | 0 (0.0%) | 0 (0.0%) |
| 5 to 17 Years | 8 (1.6%) | 0 (0.0%) |
| 18 to 34 Years | 94 (18.5%) | 6 (1.9%) |
| 35 to 64 Years | 0 (0.0%) | 0 (0.0%) |
| 65 to 74 Years | 0 (0.0%) | 0 (0.0%) |
| 75 Years and over | 0 (0.0%) | 0 (0.0%) |
Disability Class: Cognitive Difficulty
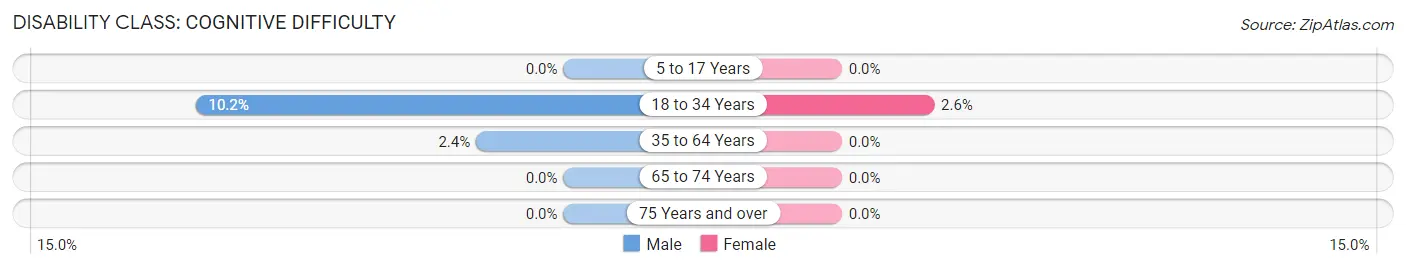
| Age Bracket | Male | Female |
| 5 to 17 Years | 0 (0.0%) | 0 (0.0%) |
| 18 to 34 Years | 52 (10.2%) | 8 (2.6%) |
| 35 to 64 Years | 13 (2.4%) | 0 (0.0%) |
| 65 to 74 Years | 0 (0.0%) | 0 (0.0%) |
| 75 Years and over | 0 (0.0%) | 0 (0.0%) |
Disability Class: Ambulatory Difficulty
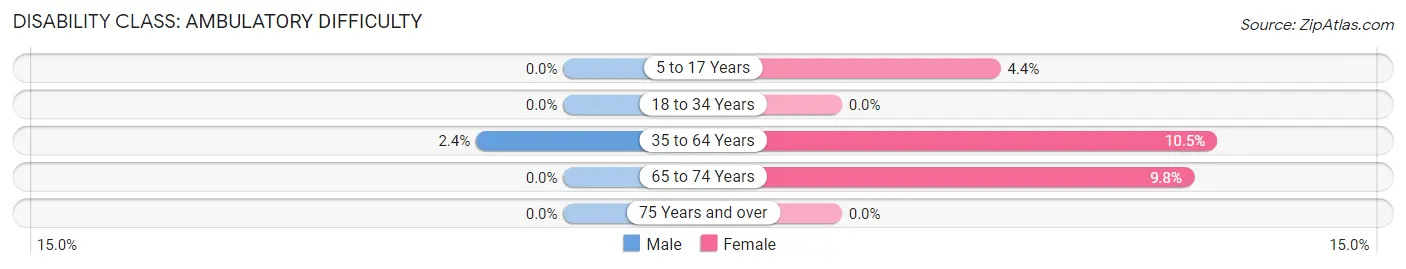
| Age Bracket | Male | Female |
| 5 to 17 Years | 0 (0.0%) | 11 (4.4%) |
| 18 to 34 Years | 0 (0.0%) | 0 (0.0%) |
| 35 to 64 Years | 13 (2.4%) | 44 (10.4%) |
| 65 to 74 Years | 0 (0.0%) | 10 (9.8%) |
| 75 Years and over | 0 (0.0%) | 0 (0.0%) |
Disability Class: Self-Care Difficulty
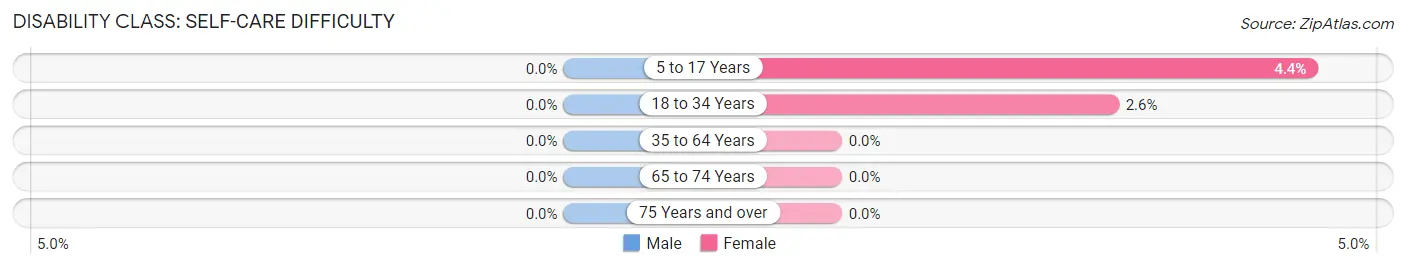
| Age Bracket | Male | Female |
| 5 to 17 Years | 0 (0.0%) | 11 (4.4%) |
| 18 to 34 Years | 0 (0.0%) | 8 (2.6%) |
| 35 to 64 Years | 0 (0.0%) | 0 (0.0%) |
| 65 to 74 Years | 0 (0.0%) | 0 (0.0%) |
| 75 Years and over | 0 (0.0%) | 0 (0.0%) |
Technology Access in San Miguel CDP San Luis Obispo County
Computing Device Access in San Miguel CDP San Luis Obispo County
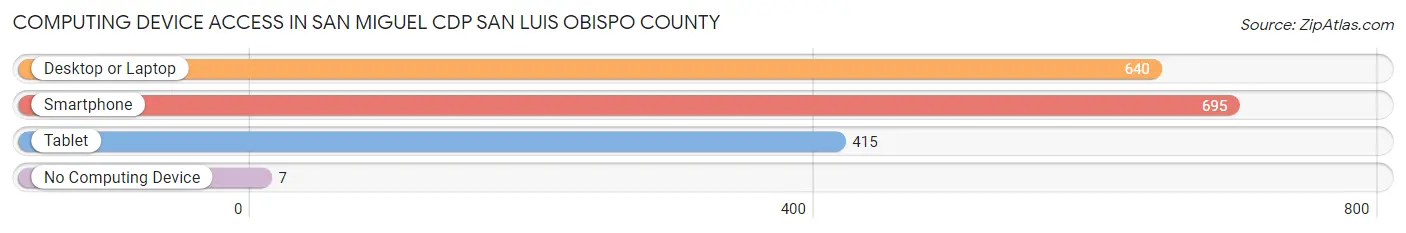
| Device Type | # Households | % Households |
| Desktop or Laptop | 640 | 81.8% |
| Smartphone | 695 | 88.9% |
| Tablet | 415 | 53.1% |
| No Computing Device | 7 | 0.9% |
| Total | 782 | 100.0% |
Internet Access in San Miguel CDP San Luis Obispo County

| Internet Type | # Households | % Households |
| Dial-Up Internet | 0 | 0.0% |
| Broadband Home | 518 | 66.2% |
| Cellular Data Only | 110 | 14.1% |
| Satellite Internet | 56 | 7.2% |
| No Internet | 106 | 13.6% |
| Total | 782 | 100.0% |
San Miguel CDP San Luis Obispo County Summary
San Miguel CDP is a census-designated place (CDP) located in San Luis Obispo County, California. It is situated in the southern part of the county, approximately 8 miles east of the city of San Luis Obispo. As of the 2010 census, the population of San Miguel CDP was 4,935.
History
The area now known as San Miguel CDP was originally inhabited by the Chumash people, who lived in the area for thousands of years before the arrival of Europeans. The first Europeans to settle in the area were Spanish missionaries, who established the Mission San Miguel Arcángel in 1797. The mission was the 16th of the 21 missions established in California by the Spanish. The mission was named after the Archangel Michael, and was intended to convert the local Chumash people to Christianity.
The mission was secularized in 1834, and the land was divided into large ranchos. The area was sparsely populated until the late 19th century, when the Southern Pacific Railroad was built through the area. This brought an influx of settlers, and the area began to develop. The town of San Miguel was founded in 1874, and the post office was established in 1876.
Geography
San Miguel CDP is located at 35°17'25"N 120°37'17"W (35.290278, -120.621389). It has an area of 4.3 square miles, all of which is land.
The CDP is located in the southern part of San Luis Obispo County, approximately 8 miles east of the city of San Luis Obispo. It is bordered to the north by the city of Paso Robles, to the east by the city of Atascadero, to the south by the city of Templeton, and to the west by the city of San Luis Obispo.
Economy
The economy of San Miguel CDP is largely based on agriculture. The area is home to a number of vineyards and wineries, as well as a number of other agricultural operations. The area is also home to a number of small businesses, including restaurants, retail stores, and service providers.
Demographics
As of the 2010 census, there were 4,935 people, 1,845 households, and 1,323 families residing in the CDP. The population density was 1,145.3 people per square mile. The racial makeup of the CDP was 77.2% White, 0.7% African American, 1.2% Native American, 0.7% Asian, 0.1% Pacific Islander, 16.7% from other races, and 3.4% from two or more races. Hispanic or Latino of any race were 33.2% of the population.
The median income for a household in the CDP was $45,938, and the median income for a family was $51,964. Males had a median income of $41,964 versus $30,938 for females. The per capita income for the CDP was $20,964. About 11.2% of families and 14.2% of the population were below the poverty line, including 19.2% of those under age 18 and 8.2% of those age 65 or over.
Common Questions
What is Per Capita Income in San Miguel CDP San Luis Obispo County?
Per Capita income in San Miguel CDP San Luis Obispo County is $20,843.
What is the Median Family Income in San Miguel CDP San Luis Obispo County?
Median Family Income in San Miguel CDP San Luis Obispo County is $73,807.
What is the Median Household income in San Miguel CDP San Luis Obispo County?
Median Household Income in San Miguel CDP San Luis Obispo County is $73,008.
What is Income or Wage Gap in San Miguel CDP San Luis Obispo County?
Income or Wage Gap in San Miguel CDP San Luis Obispo County is 4.5%.
Women in San Miguel CDP San Luis Obispo County earn 95.5 cents for every dollar earned by a man.
What is Inequality or Gini Index in San Miguel CDP San Luis Obispo County?
Inequality or Gini Index in San Miguel CDP San Luis Obispo County is 0.35.
What is the Total Population of San Miguel CDP San Luis Obispo County?
Total Population of San Miguel CDP San Luis Obispo County is 2,756.
What is the Total Male Population of San Miguel CDP San Luis Obispo County?
Total Male Population of San Miguel CDP San Luis Obispo County is 1,673.
What is the Total Female Population of San Miguel CDP San Luis Obispo County?
Total Female Population of San Miguel CDP San Luis Obispo County is 1,083.
What is the Ratio of Males per 100 Females in San Miguel CDP San Luis Obispo County?
There are 154.48 Males per 100 Females in San Miguel CDP San Luis Obispo County.
What is the Ratio of Females per 100 Males in San Miguel CDP San Luis Obispo County?
There are 64.73 Females per 100 Males in San Miguel CDP San Luis Obispo County.
What is the Median Population Age in San Miguel CDP San Luis Obispo County?
Median Population Age in San Miguel CDP San Luis Obispo County is 29.1 Years.
What is the Average Family Size in San Miguel CDP San Luis Obispo County
Average Family Size in San Miguel CDP San Luis Obispo County is 4.1 People.
What is the Average Household Size in San Miguel CDP San Luis Obispo County
Average Household Size in San Miguel CDP San Luis Obispo County is 3.5 People.
How Large is the Labor Force in San Miguel CDP San Luis Obispo County?
There are 1,379 People in the Labor Forcein in San Miguel CDP San Luis Obispo County.
What is the Percentage of People in the Labor Force in San Miguel CDP San Luis Obispo County?
70.1% of People are in the Labor Force in San Miguel CDP San Luis Obispo County.
What is the Unemployment Rate in San Miguel CDP San Luis Obispo County?
Unemployment Rate in San Miguel CDP San Luis Obispo County is 5.4%.