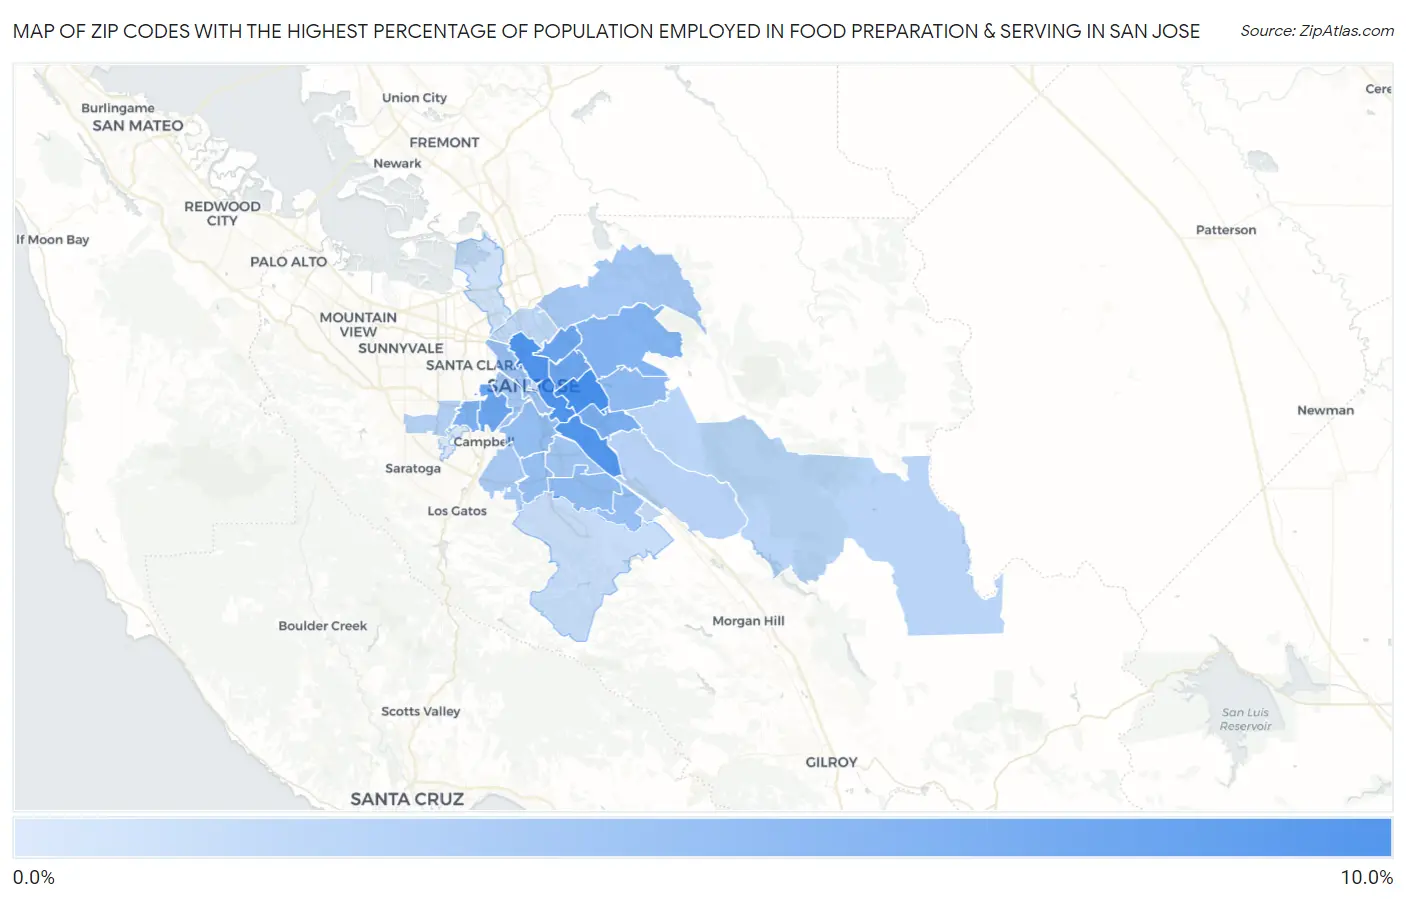
Zip Codes with the Highest Percentage of Population Employed in Food Preparation & Serving in San Jose, CA
RELATED REPORTS & OPTIONS
Food Preparation & Serving
San Jose
Compare Zip Codes
Map of Zip Codes with the Highest Percentage of Population Employed in Food Preparation & Serving in San Jose
1.6%
8.3%
Zip Codes with the Highest Percentage of Population Employed in Food Preparation & Serving in San Jose, CA
| Zip Code | % Employed | vs State | vs National | |
| 1. | 95122 | 8.3% | 5.4%(+2.91)#205 | 5.3%(+3.00)#4,332 |
| 2. | 95112 | 8.0% | 5.4%(+2.60)#229 | 5.3%(+2.70)#4,750 |
| 3. | 95111 | 7.7% | 5.4%(+2.36)#254 | 5.3%(+2.45)#5,155 |
| 4. | 95128 | 6.6% | 5.4%(+1.19)#429 | 5.3%(+1.28)#7,681 |
| 5. | 95133 | 6.6% | 5.4%(+1.18)#430 | 5.3%(+1.28)#7,693 |
| 6. | 95116 | 6.5% | 5.4%(+1.08)#448 | 5.3%(+1.18)#7,965 |
| 7. | 95121 | 5.8% | 5.4%(+0.454)#576 | 5.3%(+0.551)#9,911 |
| 8. | 95117 | 5.7% | 5.4%(+0.332)#600 | 5.3%(+0.428)#10,279 |
| 9. | 95127 | 5.5% | 5.4%(+0.075)#669 | 5.3%(+0.171)#11,194 |
| 10. | 95148 | 4.9% | 5.4%(-0.447)#801 | 5.3%(-0.350)#13,202 |
| 11. | 95123 | 4.9% | 5.4%(-0.463)#808 | 5.3%(-0.366)#13,270 |
| 12. | 95125 | 4.8% | 5.4%(-0.632)#844 | 5.3%(-0.536)#13,949 |
| 13. | 95119 | 4.6% | 5.4%(-0.787)#885 | 5.3%(-0.691)#14,620 |
| 14. | 95118 | 4.6% | 5.4%(-0.798)#889 | 5.3%(-0.702)#14,678 |
| 15. | 95110 | 4.5% | 5.4%(-0.862)#899 | 5.3%(-0.765)#14,932 |
| 16. | 95126 | 4.1% | 5.4%(-1.27)#1,001 | 5.3%(-1.17)#16,654 |
| 17. | 95136 | 4.1% | 5.4%(-1.31)#1,009 | 5.3%(-1.22)#16,837 |
| 18. | 95132 | 4.1% | 5.4%(-1.32)#1,016 | 5.3%(-1.23)#16,902 |
| 19. | 95124 | 3.8% | 5.4%(-1.62)#1,067 | 5.3%(-1.52)#18,077 |
| 20. | 95129 | 3.3% | 5.4%(-2.06)#1,153 | 5.3%(-1.96)#19,965 |
| 21. | 95138 | 3.2% | 5.4%(-2.22)#1,189 | 5.3%(-2.13)#20,628 |
| 22. | 95135 | 3.1% | 5.4%(-2.26)#1,197 | 5.3%(-2.17)#20,802 |
| 23. | 95131 | 2.9% | 5.4%(-2.52)#1,251 | 5.3%(-2.42)#21,802 |
| 24. | 95139 | 2.7% | 5.4%(-2.69)#1,281 | 5.3%(-2.60)#22,454 |
| 25. | 95113 | 2.6% | 5.4%(-2.74)#1,286 | 5.3%(-2.64)#22,613 |
| 26. | 95120 | 2.5% | 5.4%(-2.88)#1,315 | 5.3%(-2.78)#23,147 |
| 27. | 95134 | 2.2% | 5.4%(-3.16)#1,358 | 5.3%(-3.06)#24,035 |
| 28. | 95130 | 1.6% | 5.4%(-3.79)#1,432 | 5.3%(-3.69)#25,766 |
1
Common Questions
What are the Top 10 Zip Codes with the Highest Percentage of Population Employed in Food Preparation & Serving in San Jose, CA?
Top 10 Zip Codes with the Highest Percentage of Population Employed in Food Preparation & Serving in San Jose, CA are:
What zip code has the Highest Percentage of Population Employed in Food Preparation & Serving in San Jose, CA?
95122 has the Highest Percentage of Population Employed in Food Preparation & Serving in San Jose, CA with 8.3%.
What is the Percentage of Population Employed in Food Preparation & Serving in San Jose, CA?
Percentage of Population Employed in Food Preparation & Serving in San Jose is 5.0%.
What is the Percentage of Population Employed in Food Preparation & Serving in California?
Percentage of Population Employed in Food Preparation & Serving in California is 5.4%.
What is the Percentage of Population Employed in Food Preparation & Serving in the United States?
Percentage of Population Employed in Food Preparation & Serving in the United States is 5.3%.