Cities with the Highest Percentage of Population Employed in Food Preparation & Serving in Montana
RELATED REPORTS & OPTIONS
Food Preparation & Serving
Montana
Compare Cities
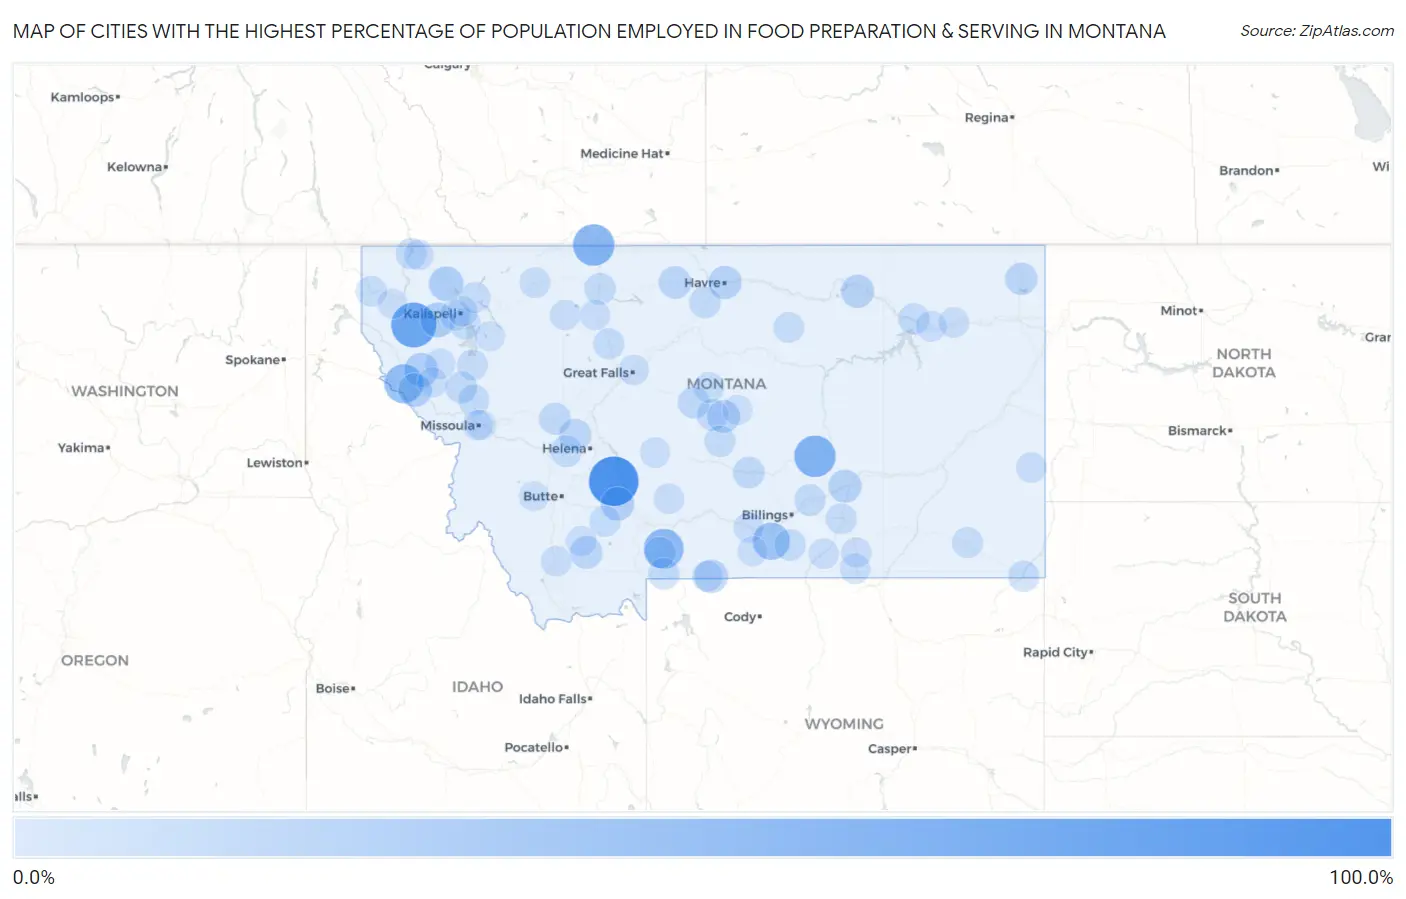
Map of Cities with the Highest Percentage of Population Employed in Food Preparation & Serving in Montana
0.0%
100.0%
Cities with the Highest Percentage of Population Employed in Food Preparation & Serving in Montana
| City | % Employed | vs State | vs National | |
| 1. | Birch Creek Colony | 100.0% | 6.7%(+93.3)#1 | 5.3%(+94.7)#10 |
| 2. | Radersburg | 100.0% | 6.7%(+93.3)#2 | 5.3%(+94.7)#13 |
| 3. | Midway Colony | 100.0% | 6.7%(+93.3)#3 | 5.3%(+94.7)#20 |
| 4. | Moccasin | 100.0% | 6.7%(+93.3)#4 | 5.3%(+94.7)#21 |
| 5. | Landusky | 100.0% | 6.7%(+93.3)#5 | 5.3%(+94.7)#22 |
| 6. | Sage Creek Colony | 100.0% | 6.7%(+93.3)#7 | 5.3%(+94.7)#24 |
| 7. | Cascade Colony | 100.0% | 6.7%(+93.3)#8 | 5.3%(+94.7)#25 |
| 8. | Martinsdale Colony | 100.0% | 6.7%(+93.3)#9 | 5.3%(+94.7)#26 |
| 9. | Haugan | 100.0% | 6.7%(+93.3)#10 | 5.3%(+94.7)#27 |
| 10. | Loring Colony | 100.0% | 6.7%(+93.3)#11 | 5.3%(+94.7)#29 |
| 11. | Racetrack | 100.0% | 6.7%(+93.3)#12 | 5.3%(+94.7)#32 |
| 12. | Happys Inn | 78.2% | 6.7%(+71.5)#13 | 5.3%(+72.9)#43 |
| 13. | Turner Colony | 76.7% | 6.7%(+69.9)#14 | 5.3%(+71.4)#46 |
| 14. | Pleasant Valley Colony | 75.0% | 6.7%(+68.3)#15 | 5.3%(+69.7)#48 |
| 15. | Big Stone Colony | 72.2% | 6.7%(+65.5)#16 | 5.3%(+66.9)#53 |
| 16. | Sweet Grass | 61.5% | 6.7%(+54.8)#17 | 5.3%(+56.3)#68 |
| 17. | Musselshell | 61.5% | 6.7%(+54.8)#18 | 5.3%(+56.3)#70 |
| 18. | Emigrant | 53.8% | 6.7%(+47.1)#19 | 5.3%(+48.5)#94 |
| 19. | De Borgia | 50.0% | 6.7%(+43.3)#20 | 5.3%(+44.7)#109 |
| 20. | Surprise Creek Colony | 50.0% | 6.7%(+43.3)#21 | 5.3%(+44.7)#120 |
| 21. | Acton | 48.6% | 6.7%(+41.9)#22 | 5.3%(+43.4)#124 |
| 22. | Edgar | 41.5% | 6.7%(+34.7)#23 | 5.3%(+36.2)#174 |
| 23. | Lakeview | 40.0% | 6.7%(+33.3)#24 | 5.3%(+34.7)#190 |
| 24. | Little Bitterroot Lake | 30.8% | 6.7%(+24.0)#25 | 5.3%(+25.5)#326 |
| 25. | Olney | 30.0% | 6.7%(+23.3)#26 | 5.3%(+24.7)#346 |
| 26. | Dell | 28.6% | 6.7%(+21.9)#27 | 5.3%(+23.3)#386 |
| 27. | Weeksville | 28.1% | 6.7%(+21.3)#28 | 5.3%(+22.8)#394 |
| 28. | Montaqua | 26.3% | 6.7%(+19.6)#29 | 5.3%(+21.0)#458 |
| 29. | St Regis | 26.2% | 6.7%(+19.4)#30 | 5.3%(+20.9)#462 |
| 30. | Grant | 25.0% | 6.7%(+18.3)#31 | 5.3%(+19.7)#511 |
| 31. | Wheatland | 24.9% | 6.7%(+18.2)#32 | 5.3%(+19.6)#513 |
| 32. | Havre North | 24.5% | 6.7%(+17.7)#33 | 5.3%(+19.2)#527 |
| 33. | Cooke City | 23.9% | 6.7%(+17.2)#34 | 5.3%(+18.6)#554 |
| 34. | Saco | 23.7% | 6.7%(+17.0)#35 | 5.3%(+18.5)#565 |
| 35. | Custer | 23.4% | 6.7%(+16.7)#36 | 5.3%(+18.1)#592 |
| 36. | Homestead | 23.1% | 6.7%(+16.4)#37 | 5.3%(+17.8)#614 |
| 37. | St. Mary | 22.2% | 6.7%(+15.5)#38 | 5.3%(+16.9)#660 |
| 38. | Moore | 21.8% | 6.7%(+15.1)#39 | 5.3%(+16.5)#688 |
| 39. | Alder | 21.1% | 6.7%(+14.3)#40 | 5.3%(+15.8)#730 |
| 40. | Rudyard | 21.0% | 6.7%(+14.3)#41 | 5.3%(+15.7)#735 |
| 41. | Reserve | 20.0% | 6.7%(+13.3)#42 | 5.3%(+14.7)#856 |
| 42. | Marysville | 18.9% | 6.7%(+12.2)#43 | 5.3%(+13.6)#957 |
| 43. | Lincoln | 18.6% | 6.7%(+11.8)#44 | 5.3%(+13.3)#1,003 |
| 44. | Stanford | 18.3% | 6.7%(+11.6)#45 | 5.3%(+13.1)#1,022 |
| 45. | Ryegate | 17.5% | 6.7%(+10.8)#46 | 5.3%(+12.2)#1,127 |
| 46. | Old Agency | 17.4% | 6.7%(+10.7)#47 | 5.3%(+12.1)#1,153 |
| 47. | Essex | 17.2% | 6.7%(+10.5)#48 | 5.3%(+12.0)#1,174 |
| 48. | Elliston | 16.9% | 6.7%(+10.2)#49 | 5.3%(+11.6)#1,214 |
| 49. | Hobson | 16.7% | 6.7%(+9.95)#50 | 5.3%(+11.4)#1,256 |
| 50. | Shelby | 16.5% | 6.7%(+9.81)#51 | 5.3%(+11.2)#1,292 |
| 51. | Gardiner | 16.4% | 6.7%(+9.67)#52 | 5.3%(+11.1)#1,313 |
| 52. | South Glastonbury | 16.4% | 6.7%(+9.64)#53 | 5.3%(+11.1)#1,320 |
| 53. | Pryor | 16.1% | 6.7%(+9.39)#54 | 5.3%(+10.8)#1,383 |
| 54. | Worden | 16.0% | 6.7%(+9.31)#55 | 5.3%(+10.7)#1,401 |
| 55. | Box Elder | 15.8% | 6.7%(+9.07)#56 | 5.3%(+10.5)#1,450 |
| 56. | Judith Gap | 15.3% | 6.7%(+8.53)#57 | 5.3%(+9.97)#1,569 |
| 57. | Somers | 15.1% | 6.7%(+8.34)#58 | 5.3%(+9.78)#1,608 |
| 58. | Nashua | 14.8% | 6.7%(+8.09)#59 | 5.3%(+9.53)#1,684 |
| 59. | Rexford | 14.7% | 6.7%(+7.98)#60 | 5.3%(+9.42)#1,711 |
| 60. | Dutton | 14.5% | 6.7%(+7.80)#61 | 5.3%(+9.23)#1,765 |
| 61. | Arlee | 14.3% | 6.7%(+7.61)#62 | 5.3%(+9.05)#1,805 |
| 62. | Harrison | 14.3% | 6.7%(+7.56)#63 | 5.3%(+9.00)#1,835 |
| 63. | Alzada | 14.3% | 6.7%(+7.56)#64 | 5.3%(+9.00)#1,840 |
| 64. | Batavia | 14.1% | 6.7%(+7.36)#65 | 5.3%(+8.80)#1,887 |
| 65. | Broadus | 14.0% | 6.7%(+7.24)#66 | 5.3%(+8.68)#1,928 |
| 66. | Pablo | 13.8% | 6.7%(+7.06)#67 | 5.3%(+8.50)#1,976 |
| 67. | Silver Gate | 13.7% | 6.7%(+7.00)#68 | 5.3%(+8.44)#1,995 |
| 68. | Troy | 13.7% | 6.7%(+6.95)#69 | 5.3%(+8.38)#2,014 |
| 69. | Hungry Horse | 13.5% | 6.7%(+6.82)#70 | 5.3%(+8.25)#2,056 |
| 70. | Lodge Pole | 13.4% | 6.7%(+6.71)#71 | 5.3%(+8.15)#2,087 |
| 71. | Hardin | 13.4% | 6.7%(+6.66)#72 | 5.3%(+8.09)#2,111 |
| 72. | Golden Valley Colony | 13.3% | 6.7%(+6.61)#73 | 5.3%(+8.05)#2,135 |
| 73. | Denton | 12.9% | 6.7%(+6.23)#74 | 5.3%(+7.66)#2,276 |
| 74. | Browning | 12.7% | 6.7%(+5.95)#75 | 5.3%(+7.38)#2,419 |
| 75. | Frazer | 12.5% | 6.7%(+5.78)#76 | 5.3%(+7.21)#2,493 |
| 76. | Fords Creek Colony | 12.5% | 6.7%(+5.78)#77 | 5.3%(+7.21)#2,514 |
| 77. | Wolf Point | 12.3% | 6.7%(+5.62)#78 | 5.3%(+7.05)#2,589 |
| 78. | White Sulphur Springs | 12.3% | 6.7%(+5.54)#79 | 5.3%(+6.97)#2,613 |
| 79. | Fort Smith | 12.2% | 6.7%(+5.52)#80 | 5.3%(+6.96)#2,623 |
| 80. | Dillon | 12.2% | 6.7%(+5.47)#81 | 5.3%(+6.90)#2,657 |
| 81. | Hot Springs | 12.2% | 6.7%(+5.43)#82 | 5.3%(+6.87)#2,674 |
| 82. | Columbus | 12.1% | 6.7%(+5.36)#83 | 5.3%(+6.80)#2,712 |
| 83. | Dupuyer | 12.0% | 6.7%(+5.28)#84 | 5.3%(+6.71)#2,763 |
| 84. | Black Eagle | 11.9% | 6.7%(+5.22)#85 | 5.3%(+6.66)#2,797 |
| 85. | Wyola | 11.9% | 6.7%(+5.22)#86 | 5.3%(+6.65)#2,802 |
| 86. | Sheridan | 11.9% | 6.7%(+5.21)#87 | 5.3%(+6.64)#2,810 |
| 87. | Wilsall | 11.8% | 6.7%(+5.04)#88 | 5.3%(+6.48)#2,894 |
| 88. | Baker | 11.7% | 6.7%(+5.00)#89 | 5.3%(+6.44)#2,926 |
| 89. | Lodge Grass | 11.5% | 6.7%(+4.75)#90 | 5.3%(+6.19)#3,083 |
| 90. | Conrad | 11.4% | 6.7%(+4.72)#91 | 5.3%(+6.16)#3,094 |
| 91. | Evergreen | 11.3% | 6.7%(+4.62)#92 | 5.3%(+6.05)#3,174 |
| 92. | Eureka | 11.1% | 6.7%(+4.42)#93 | 5.3%(+5.85)#3,297 |
| 93. | East Missoula | 11.1% | 6.7%(+4.41)#94 | 5.3%(+5.85)#3,298 |
| 94. | Lewistown | 10.7% | 6.7%(+3.95)#95 | 5.3%(+5.38)#3,604 |
| 95. | Pioneer Junction | 10.7% | 6.7%(+3.94)#96 | 5.3%(+5.38)#3,609 |
| 96. | Missoula | 10.6% | 6.7%(+3.84)#97 | 5.3%(+5.28)#3,677 |
| 97. | Paradise | 10.5% | 6.7%(+3.81)#98 | 5.3%(+5.24)#3,702 |
| 98. | Anaconda Deer Lodge County | 10.4% | 6.7%(+3.71)#99 | 5.3%(+5.15)#3,771 |
| 99. | Swan Lake | 10.4% | 6.7%(+3.70)#100 | 5.3%(+5.13)#3,783 |
| 100. | Roberts | 10.4% | 6.7%(+3.68)#101 | 5.3%(+5.11)#3,794 |
Common Questions
What are the Top 10 Cities with the Highest Percentage of Population Employed in Food Preparation & Serving in Montana?
Top 10 Cities with the Highest Percentage of Population Employed in Food Preparation & Serving in Montana are:
#1
100.0%
#2
78.2%
#3
61.5%
#4
61.5%
#5
53.8%
#6
50.0%
#7
41.5%
#8
30.8%
#9
30.0%
#10
28.1%
What city has the Highest Percentage of Population Employed in Food Preparation & Serving in Montana?
Radersburg has the Highest Percentage of Population Employed in Food Preparation & Serving in Montana with 100.0%.
What is the Percentage of Population Employed in Food Preparation & Serving in the State of Montana?
Percentage of Population Employed in Food Preparation & Serving in Montana is 6.7%.
What is the Percentage of Population Employed in Food Preparation & Serving in the United States?
Percentage of Population Employed in Food Preparation & Serving in the United States is 5.3%.