Zip Codes with the Highest Percentage of Population Employed in Food Preparation & Serving in La Puente, CA
RELATED REPORTS & OPTIONS
Food Preparation & Serving
La Puente
Compare Zip Codes
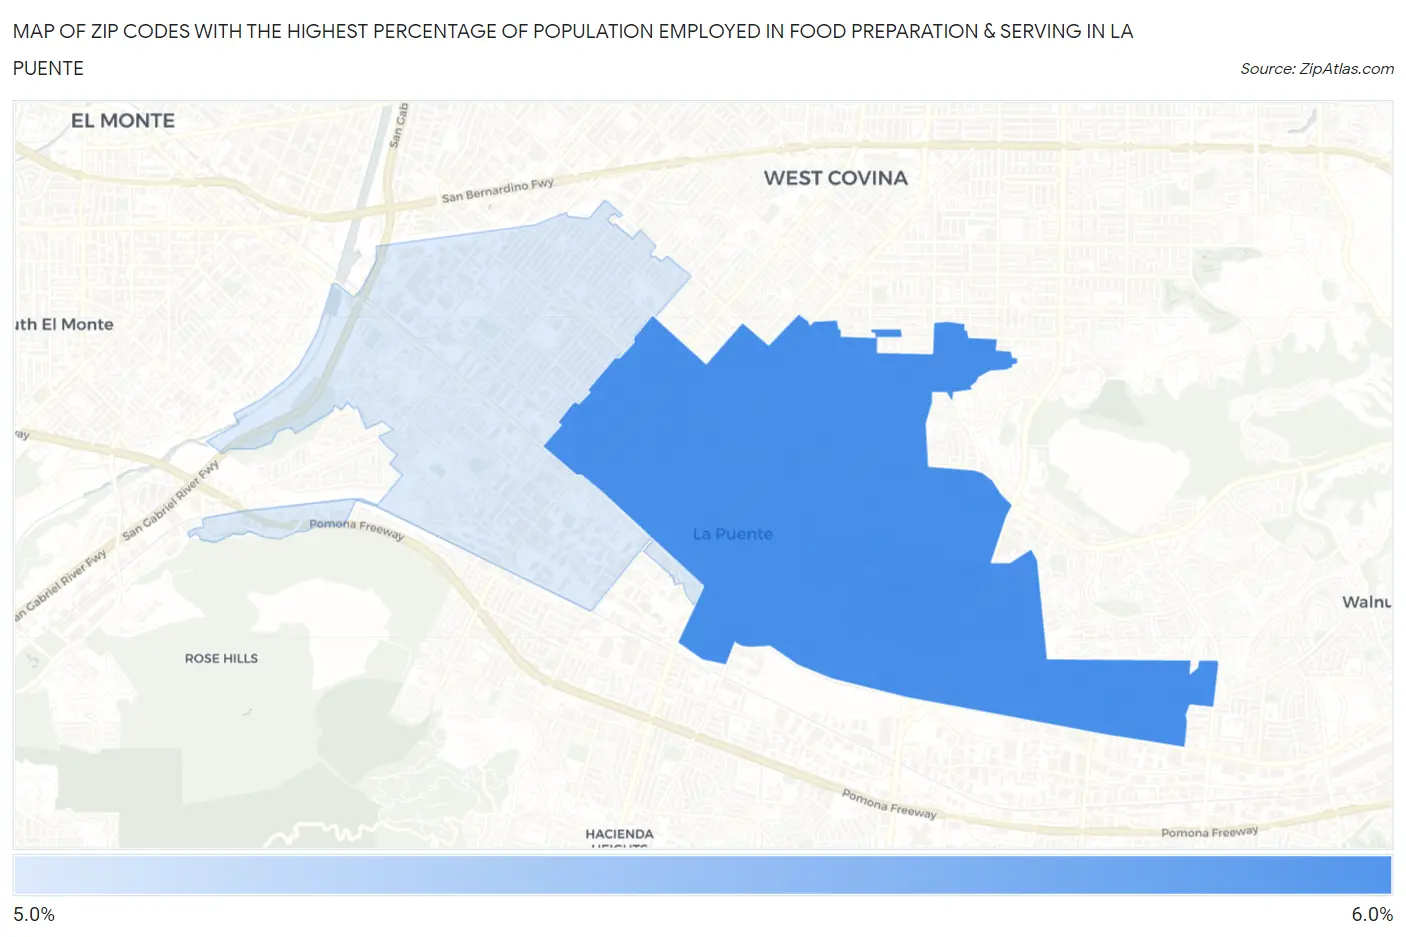
Map of Zip Codes with the Highest Percentage of Population Employed in Food Preparation & Serving in La Puente
5.4%
6.0%
Zip Codes with the Highest Percentage of Population Employed in Food Preparation & Serving in La Puente, CA
| Zip Code | % Employed | vs State | vs National | |
| 1. | 91744 | 6.0% | 5.4%(+0.577)#552 | 5.3%(+0.673)#9,473 |
| 2. | 91746 | 5.4% | 5.4%(-0.020)#691 | 5.3%(+0.076)#11,529 |
1
Common Questions
What are the Top Zip Codes with the Highest Percentage of Population Employed in Food Preparation & Serving in La Puente, CA?
Top Zip Codes with the Highest Percentage of Population Employed in Food Preparation & Serving in La Puente, CA are:
What zip code has the Highest Percentage of Population Employed in Food Preparation & Serving in La Puente, CA?
91744 has the Highest Percentage of Population Employed in Food Preparation & Serving in La Puente, CA with 6.0%.
What is the Percentage of Population Employed in Food Preparation & Serving in La Puente, CA?
Percentage of Population Employed in Food Preparation & Serving in La Puente is 5.3%.
What is the Percentage of Population Employed in Food Preparation & Serving in California?
Percentage of Population Employed in Food Preparation & Serving in California is 5.4%.
What is the Percentage of Population Employed in Food Preparation & Serving in the United States?
Percentage of Population Employed in Food Preparation & Serving in the United States is 5.3%.