Cities with the Highest Percentage of Population Employed in Food Preparation & Serving in Connecticut
RELATED REPORTS & OPTIONS
Food Preparation & Serving
Connecticut
Compare Cities
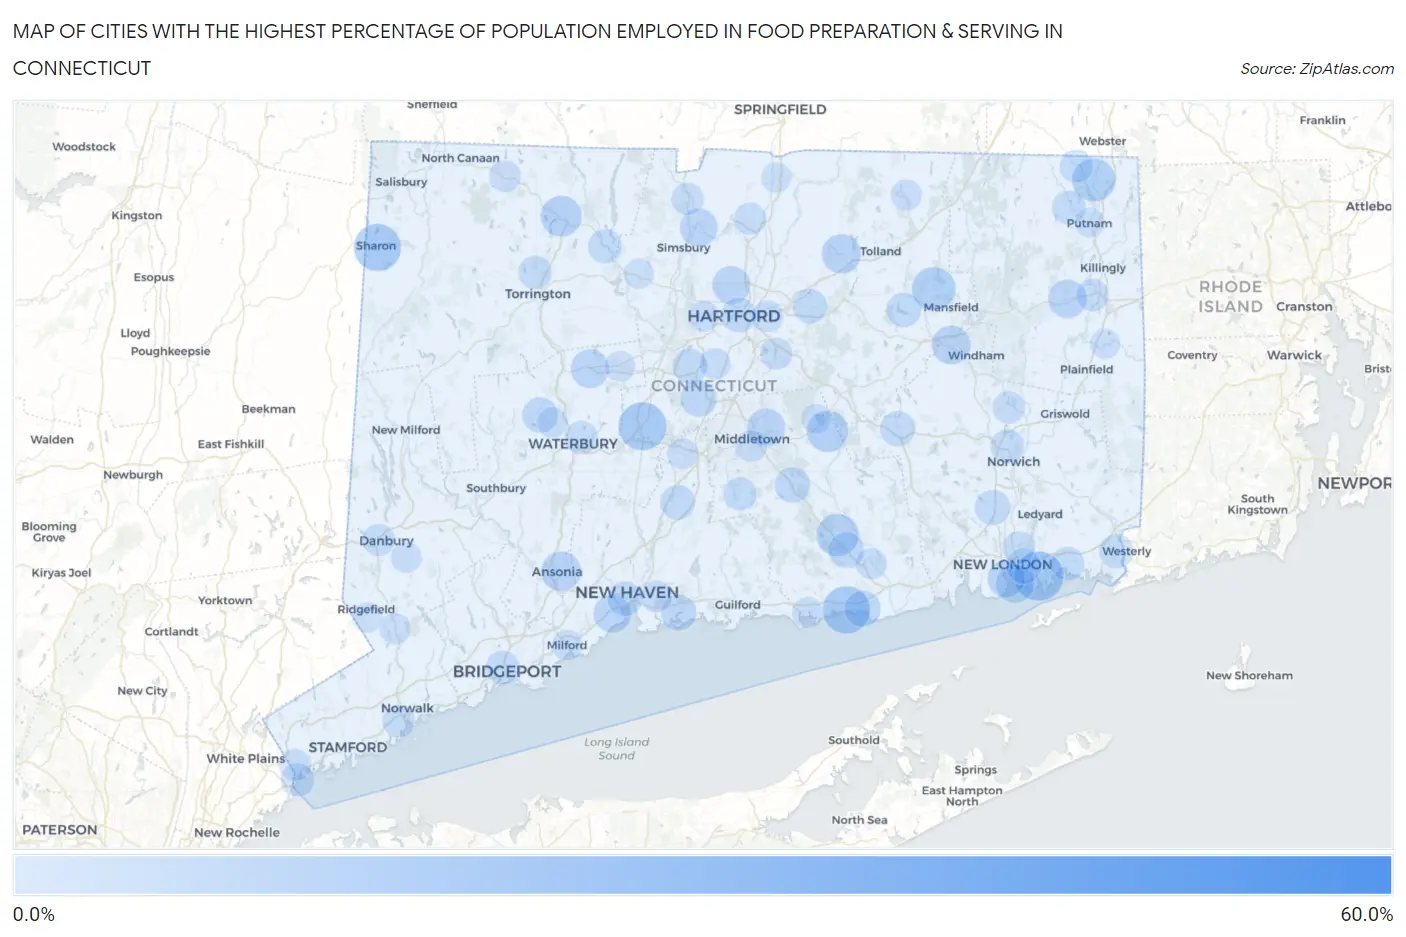
Map of Cities with the Highest Percentage of Population Employed in Food Preparation & Serving in Connecticut
0.0%
60.0%
Cities with the Highest Percentage of Population Employed in Food Preparation & Serving in Connecticut
| City | % Employed | vs State | vs National | |
| 1. | Branchville | 54.3% | 4.7%(+49.7)#1 | 5.3%(+49.1)#90 |
| 2. | Danielson Borough | 21.9% | 4.7%(+17.2)#2 | 5.3%(+16.6)#686 |
| 3. | Sacred Heart University | 20.9% | 4.7%(+16.3)#3 | 5.3%(+15.7)#737 |
| 4. | Poquonock Bridge | 17.7% | 4.7%(+13.0)#4 | 5.3%(+12.4)#1,103 |
| 5. | Taylor Corners | 16.8% | 4.7%(+12.1)#5 | 5.3%(+11.5)#1,224 |
| 6. | Plantsville | 16.7% | 4.7%(+12.0)#6 | 5.3%(+11.4)#1,245 |
| 7. | Fairfield University | 16.6% | 4.7%(+11.9)#7 | 5.3%(+11.3)#1,278 |
| 8. | Westbrook Center | 16.2% | 4.7%(+11.5)#8 | 5.3%(+10.9)#1,355 |
| 9. | Sharon | 16.1% | 4.7%(+11.4)#9 | 5.3%(+10.8)#1,390 |
| 10. | Storrs | 13.3% | 4.7%(+8.61)#10 | 5.3%(+8.01)#2,141 |
| 11. | Candlewood Orchards | 13.3% | 4.7%(+8.60)#11 | 5.3%(+8.00)#2,145 |
| 12. | North Grosvenor Dale | 13.1% | 4.7%(+8.38)#12 | 5.3%(+7.78)#2,228 |
| 13. | Chester Center | 12.5% | 4.7%(+7.82)#13 | 5.3%(+7.21)#2,479 |
| 14. | East Hampton | 11.7% | 4.7%(+7.03)#14 | 5.3%(+6.43)#2,933 |
| 15. | Winsted | 11.6% | 4.7%(+6.94)#15 | 5.3%(+6.34)#2,994 |
| 16. | Bantam Borough | 11.6% | 4.7%(+6.88)#16 | 5.3%(+6.27)#3,031 |
| 17. | Ansonia | 10.6% | 4.7%(+5.88)#17 | 5.3%(+5.27)#3,678 |
| 18. | Rockville | 10.2% | 4.7%(+5.54)#18 | 5.3%(+4.94)#3,919 |
| 19. | Willimantic | 10.0% | 4.7%(+5.31)#19 | 5.3%(+4.71)#4,128 |
| 20. | Jewett City Borough | 9.8% | 4.7%(+5.15)#20 | 5.3%(+4.55)#4,236 |
| 21. | Terryville | 9.8% | 4.7%(+5.09)#21 | 5.3%(+4.49)#4,287 |
| 22. | Brooklyn | 9.8% | 4.7%(+5.09)#22 | 5.3%(+4.49)#4,289 |
| 23. | Candlewood Knolls | 9.7% | 4.7%(+5.04)#23 | 5.3%(+4.44)#4,344 |
| 24. | Groton | 9.6% | 4.7%(+4.95)#24 | 5.3%(+4.35)#4,407 |
| 25. | Portland | 9.4% | 4.7%(+4.75)#25 | 5.3%(+4.14)#4,605 |
| 26. | Blue Hills | 9.4% | 4.7%(+4.72)#26 | 5.3%(+4.12)#4,632 |
| 27. | Tariffville | 9.2% | 4.7%(+4.54)#27 | 5.3%(+3.94)#4,819 |
| 28. | West Haven | 9.2% | 4.7%(+4.52)#28 | 5.3%(+3.92)#4,838 |
| 29. | New London | 8.9% | 4.7%(+4.24)#29 | 5.3%(+3.64)#5,164 |
| 30. | Quinnipiac University | 8.8% | 4.7%(+4.14)#30 | 5.3%(+3.54)#5,280 |
| 31. | Saybrook Manor | 8.2% | 4.7%(+3.47)#31 | 5.3%(+2.87)#6,131 |
| 32. | Kensington | 8.1% | 4.7%(+3.44)#32 | 5.3%(+2.84)#6,169 |
| 33. | Watertown | 7.6% | 4.7%(+2.96)#33 | 5.3%(+2.36)#6,921 |
| 34. | Branford Center | 7.6% | 4.7%(+2.96)#34 | 5.3%(+2.36)#6,924 |
| 35. | Stonington Borough | 7.6% | 4.7%(+2.95)#35 | 5.3%(+2.35)#6,934 |
| 36. | Higganum | 7.6% | 4.7%(+2.93)#36 | 5.3%(+2.33)#6,967 |
| 37. | Deep River Center | 7.6% | 4.7%(+2.87)#37 | 5.3%(+2.27)#7,056 |
| 38. | Colchester | 7.4% | 4.7%(+2.75)#38 | 5.3%(+2.14)#7,233 |
| 39. | Oxoboxo River | 7.4% | 4.7%(+2.68)#39 | 5.3%(+2.08)#7,342 |
| 40. | Long Hill | 7.3% | 4.7%(+2.59)#40 | 5.3%(+1.99)#7,474 |
| 41. | Hartford | 7.1% | 4.7%(+2.41)#41 | 5.3%(+1.80)#7,835 |
| 42. | Wallingford Center | 7.1% | 4.7%(+2.40)#42 | 5.3%(+1.80)#7,848 |
| 43. | New Britain | 7.1% | 4.7%(+2.38)#43 | 5.3%(+1.78)#7,885 |
| 44. | South Coventry | 7.0% | 4.7%(+2.31)#44 | 5.3%(+1.71)#8,018 |
| 45. | New Haven | 6.9% | 4.7%(+2.26)#45 | 5.3%(+1.66)#8,102 |
| 46. | Manchester | 6.9% | 4.7%(+2.20)#46 | 5.3%(+1.60)#8,229 |
| 47. | Newtown Borough | 6.8% | 4.7%(+2.08)#47 | 5.3%(+1.48)#8,473 |
| 48. | Pawcatuck | 6.6% | 4.7%(+1.91)#48 | 5.3%(+1.31)#8,883 |
| 49. | New Hartford Center | 6.5% | 4.7%(+1.85)#49 | 5.3%(+1.24)#9,008 |
| 50. | Bridgeport | 6.5% | 4.7%(+1.77)#50 | 5.3%(+1.17)#9,199 |
| 51. | Mystic | 6.4% | 4.7%(+1.76)#51 | 5.3%(+1.16)#9,240 |
| 52. | Norwich | 6.4% | 4.7%(+1.71)#52 | 5.3%(+1.11)#9,344 |
| 53. | South Woodstock | 6.3% | 4.7%(+1.65)#53 | 5.3%(+1.05)#9,481 |
| 54. | Litchfield Borough | 6.2% | 4.7%(+1.55)#54 | 5.3%(+0.945)#9,724 |
| 55. | Torrington | 6.1% | 4.7%(+1.43)#55 | 5.3%(+0.825)#10,045 |
| 56. | Durham | 6.0% | 4.7%(+1.33)#56 | 5.3%(+0.732)#10,290 |
| 57. | Byram | 6.0% | 4.7%(+1.29)#57 | 5.3%(+0.684)#10,403 |
| 58. | Candlewood Shores | 5.9% | 4.7%(+1.19)#58 | 5.3%(+0.584)#10,636 |
| 59. | Quinebaug | 5.9% | 4.7%(+1.17)#59 | 5.3%(+0.572)#10,669 |
| 60. | Waterbury | 5.7% | 4.7%(+1.04)#60 | 5.3%(+0.436)#11,013 |
| 61. | Norwalk | 5.5% | 4.7%(+0.836)#61 | 5.3%(+0.234)#11,588 |
| 62. | Bigelow Corners | 5.5% | 4.7%(+0.817)#62 | 5.3%(+0.216)#11,634 |
| 63. | East Brooklyn | 5.4% | 4.7%(+0.696)#63 | 5.3%(+0.094)#11,932 |
| 64. | Danbury | 5.3% | 4.7%(+0.653)#64 | 5.3%(+0.051)#12,056 |
| 65. | Salmon Brook | 5.3% | 4.7%(+0.640)#65 | 5.3%(+0.038)#12,095 |
| 66. | Baltic | 5.3% | 4.7%(+0.579)#66 | 5.3%(-0.023)#12,253 |
| 67. | Conning Towers Nautilus Park | 5.2% | 4.7%(+0.550)#67 | 5.3%(-0.051)#12,348 |
| 68. | Windsor Locks | 5.2% | 4.7%(+0.523)#68 | 5.3%(-0.079)#12,413 |
| 69. | Glastonbury Center | 5.1% | 4.7%(+0.429)#69 | 5.3%(-0.173)#12,693 |
| 70. | Pemberwick | 5.0% | 4.7%(+0.316)#70 | 5.3%(-0.286)#13,012 |
| 71. | Middletown | 4.9% | 4.7%(+0.186)#71 | 5.3%(-0.415)#13,411 |
| 72. | Trumbull Center | 4.8% | 4.7%(+0.165)#72 | 5.3%(-0.437)#13,476 |
| 73. | Norfolk | 4.8% | 4.7%(+0.159)#73 | 5.3%(-0.443)#13,497 |
| 74. | East Haven | 4.7% | 4.7%(+0.047)#74 | 5.3%(-0.555)#13,806 |
| 75. | East Hartford | 4.7% | 4.7%(+0.003)#75 | 5.3%(-0.599)#13,946 |
| 76. | Newington | 4.5% | 4.7%(-0.194)#76 | 5.3%(-0.796)#14,481 |
| 77. | Mechanicsville | 4.4% | 4.7%(-0.240)#77 | 5.3%(-0.842)#14,607 |
| 78. | Meriden | 4.4% | 4.7%(-0.248)#78 | 5.3%(-0.850)#14,639 |
| 79. | Tashua | 4.4% | 4.7%(-0.280)#79 | 5.3%(-0.882)#14,732 |
| 80. | Essex Village | 4.4% | 4.7%(-0.316)#80 | 5.3%(-0.918)#14,831 |
| 81. | Georgetown | 4.3% | 4.7%(-0.345)#81 | 5.3%(-0.947)#14,925 |
| 82. | Botsford | 4.3% | 4.7%(-0.361)#82 | 5.3%(-0.963)#14,971 |
| 83. | Clinton | 4.3% | 4.7%(-0.370)#83 | 5.3%(-0.972)#15,004 |
| 84. | Lakeside Woods | 4.3% | 4.7%(-0.387)#84 | 5.3%(-0.989)#15,063 |
| 85. | Inglenook | 4.3% | 4.7%(-0.421)#85 | 5.3%(-1.02)#15,169 |
| 86. | West Hartford | 4.2% | 4.7%(-0.445)#86 | 5.3%(-1.05)#15,242 |
| 87. | Stafford Springs | 4.2% | 4.7%(-0.452)#87 | 5.3%(-1.05)#15,259 |
| 88. | Oakville | 4.2% | 4.7%(-0.534)#88 | 5.3%(-1.14)#15,512 |
| 89. | Bethel | 4.1% | 4.7%(-0.562)#89 | 5.3%(-1.16)#15,596 |
| 90. | Milford City Balance | 4.1% | 4.7%(-0.576)#90 | 5.3%(-1.18)#15,654 |
| 91. | Bristol | 4.1% | 4.7%(-0.624)#91 | 5.3%(-1.23)#15,796 |
| 92. | Naugatuck Borough | 3.9% | 4.7%(-0.756)#92 | 5.3%(-1.36)#16,206 |
| 93. | Northford | 3.8% | 4.7%(-0.894)#93 | 5.3%(-1.50)#16,640 |
| 94. | Mill Plain | 3.7% | 4.7%(-0.940)#94 | 5.3%(-1.54)#16,795 |
| 95. | Canton Valley | 3.7% | 4.7%(-0.975)#95 | 5.3%(-1.58)#16,882 |
| 96. | Moosup | 3.7% | 4.7%(-0.996)#96 | 5.3%(-1.60)#16,952 |
| 97. | Ridgefield | 3.7% | 4.7%(-1.01)#97 | 5.3%(-1.61)#16,983 |
| 98. | Thompsonville | 3.7% | 4.7%(-1.02)#98 | 5.3%(-1.62)#17,012 |
| 99. | Putnam | 3.7% | 4.7%(-1.02)#99 | 5.3%(-1.62)#17,019 |
| 100. | Lake Pocotopaug | 3.6% | 4.7%(-1.03)#100 | 5.3%(-1.64)#17,057 |
Common Questions
What are the Top 10 Cities with the Highest Percentage of Population Employed in Food Preparation & Serving in Connecticut?
Top 10 Cities with the Highest Percentage of Population Employed in Food Preparation & Serving in Connecticut are:
#1
17.7%
#2
16.7%
#3
16.2%
#4
16.1%
#5
13.3%
#6
13.1%
#7
12.5%
#8
11.7%
#9
11.6%
#10
10.6%
What city has the Highest Percentage of Population Employed in Food Preparation & Serving in Connecticut?
Poquonock Bridge has the Highest Percentage of Population Employed in Food Preparation & Serving in Connecticut with 17.7%.
What is the Percentage of Population Employed in Food Preparation & Serving in the State of Connecticut?
Percentage of Population Employed in Food Preparation & Serving in Connecticut is 4.7%.
What is the Percentage of Population Employed in Food Preparation & Serving in the United States?
Percentage of Population Employed in Food Preparation & Serving in the United States is 5.3%.