McClellan Park, CA Map & Demographics
McClellan Park Map
McClellan Park Overview
$13,154
PER CAPITA INCOME
$31,979
AVG FAMILY INCOME
$24,766
AVG HOUSEHOLD INCOME
0.48
INEQUALITY / GINI INDEX
1,193
TOTAL POPULATION
560
MALE POPULATION
633
FEMALE POPULATION
88.47
MALES / 100 FEMALES
113.04
FEMALES / 100 MALES
20.9
MEDIAN AGE
3.6
AVG FAMILY SIZE
3.4
AVG HOUSEHOLD SIZE
465
LABOR FORCE [ PEOPLE ]
58.1%
PERCENT IN LABOR FORCE
2.9%
UNEMPLOYMENT RATE
Income in McClellan Park
Income Overview in McClellan Park
Per Capita Income in McClellan Park is $13,154, while median incomes of families and households are $31,979 and $24,766 respectively.
| Characteristic | Number | Measure |
| Per Capita Income | 1,193 | $13,154 |
| Median Family Income | 304 | $31,979 |
| Mean Family Income | 304 | $47,932 |
| Median Household Income | 345 | $24,766 |
| Mean Household Income | 345 | $44,589 |
| Income Deficit | 304 | $0 |
| Wage / Income Gap (%) | 1,193 | 0.00% |
| Wage / Income Gap ($) | 1,193 | 100.00¢ per $1 |
| Gini / Inequality Index | 1,193 | 0.48 |
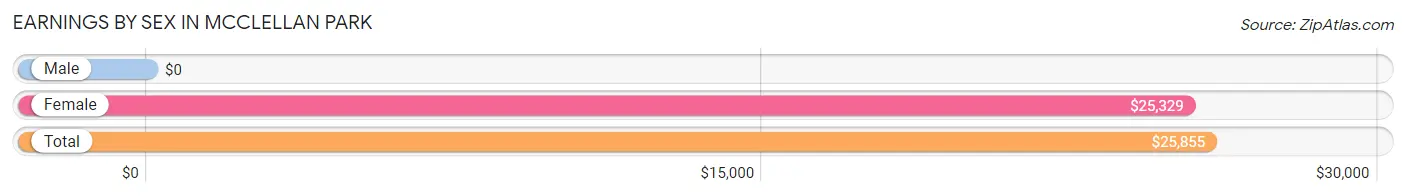
Earnings by Sex in McClellan Park
| Sex | Number | Average Earnings |
| Male | 188 (40.4%) | $0 |
| Female | 277 (59.6%) | $25,329 |
| Total | 465 (100.0%) | $25,855 |
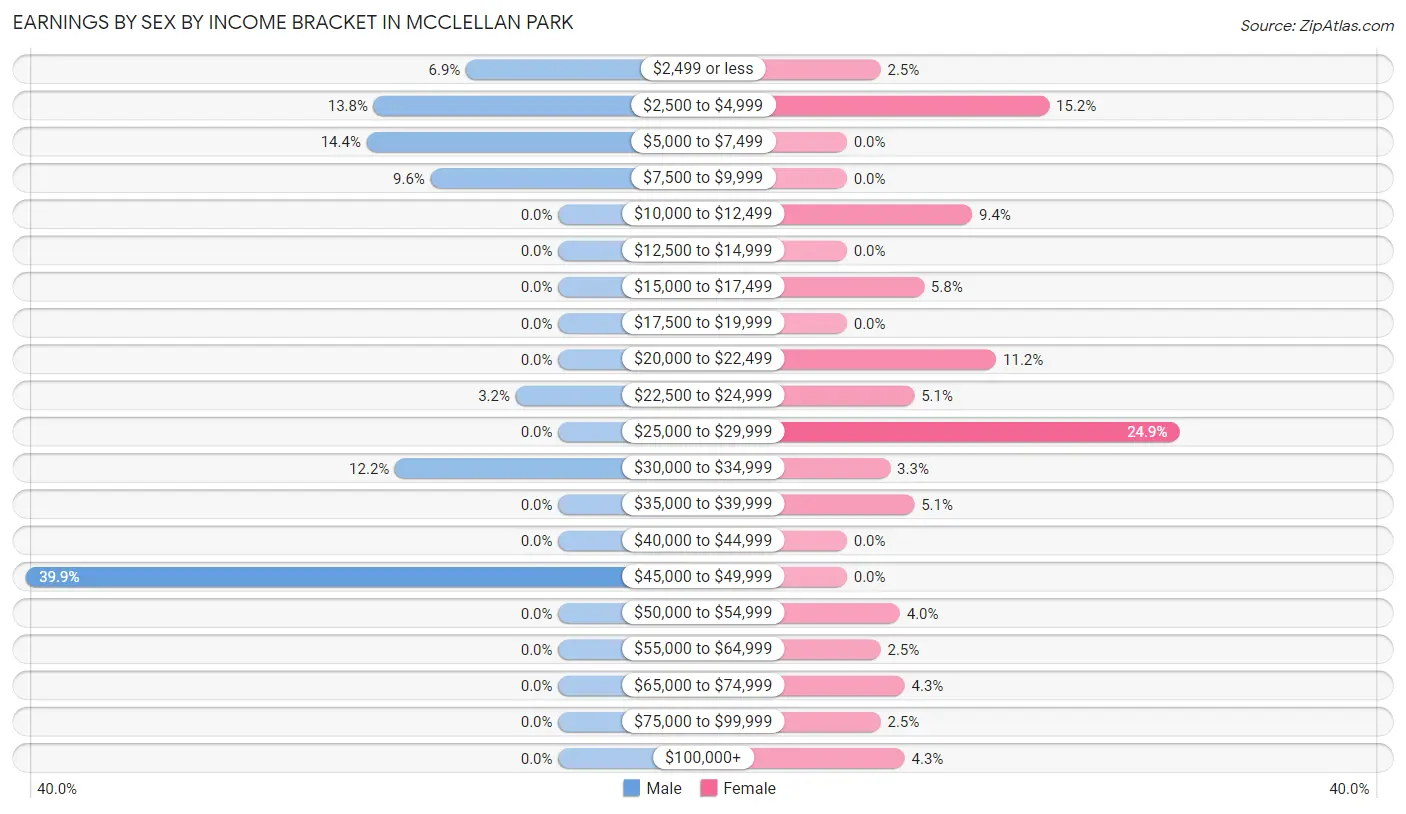
Earnings by Sex by Income Bracket in McClellan Park
The most common earnings brackets in McClellan Park are $45,000 to $49,999 for men (75 | 39.9%) and $25,000 to $29,999 for women (69 | 24.9%).
| Income | Male | Female |
| $2,499 or less | 13 (6.9%) | 7 (2.5%) |
| $2,500 to $4,999 | 26 (13.8%) | 42 (15.2%) |
| $5,000 to $7,499 | 27 (14.4%) | 0 (0.0%) |
| $7,500 to $9,999 | 18 (9.6%) | 0 (0.0%) |
| $10,000 to $12,499 | 0 (0.0%) | 26 (9.4%) |
| $12,500 to $14,999 | 0 (0.0%) | 0 (0.0%) |
| $15,000 to $17,499 | 0 (0.0%) | 16 (5.8%) |
| $17,500 to $19,999 | 0 (0.0%) | 0 (0.0%) |
| $20,000 to $22,499 | 0 (0.0%) | 31 (11.2%) |
| $22,500 to $24,999 | 6 (3.2%) | 14 (5.1%) |
| $25,000 to $29,999 | 0 (0.0%) | 69 (24.9%) |
| $30,000 to $34,999 | 23 (12.2%) | 9 (3.3%) |
| $35,000 to $39,999 | 0 (0.0%) | 14 (5.1%) |
| $40,000 to $44,999 | 0 (0.0%) | 0 (0.0%) |
| $45,000 to $49,999 | 75 (39.9%) | 0 (0.0%) |
| $50,000 to $54,999 | 0 (0.0%) | 11 (4.0%) |
| $55,000 to $64,999 | 0 (0.0%) | 7 (2.5%) |
| $65,000 to $74,999 | 0 (0.0%) | 12 (4.3%) |
| $75,000 to $99,999 | 0 (0.0%) | 7 (2.5%) |
| $100,000+ | 0 (0.0%) | 12 (4.3%) |
| Total | 188 (100.0%) | 277 (100.0%) |
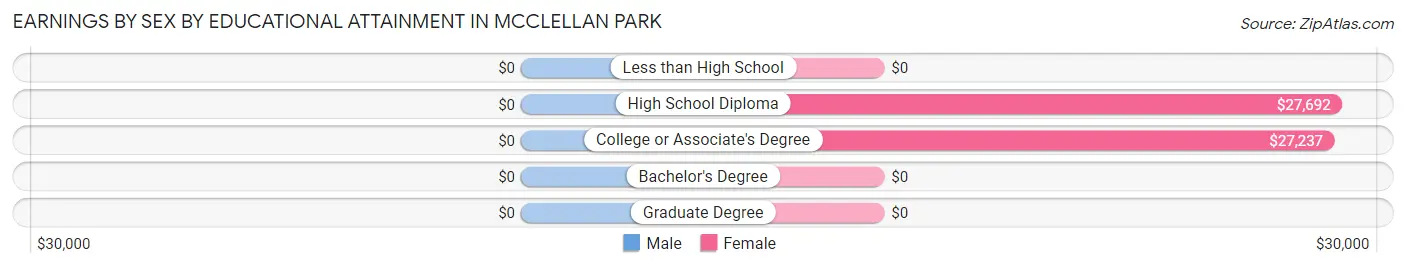
Earnings by Sex by Educational Attainment in McClellan Park
| Educational Attainment | Male Income | Female Income |
| Less than High School | - | - |
| High School Diploma | - | - |
| College or Associate's Degree | - | - |
| Bachelor's Degree | - | - |
| Graduate Degree | - | - |
| Total | $45,673 | $27,900 |
Family Income in McClellan Park
Family Income Brackets in McClellan Park
According to the McClellan Park family income data, there are 84 families falling into the $15,000 to $24,999 income range, which is the most common income bracket and makes up 27.6% of all families.
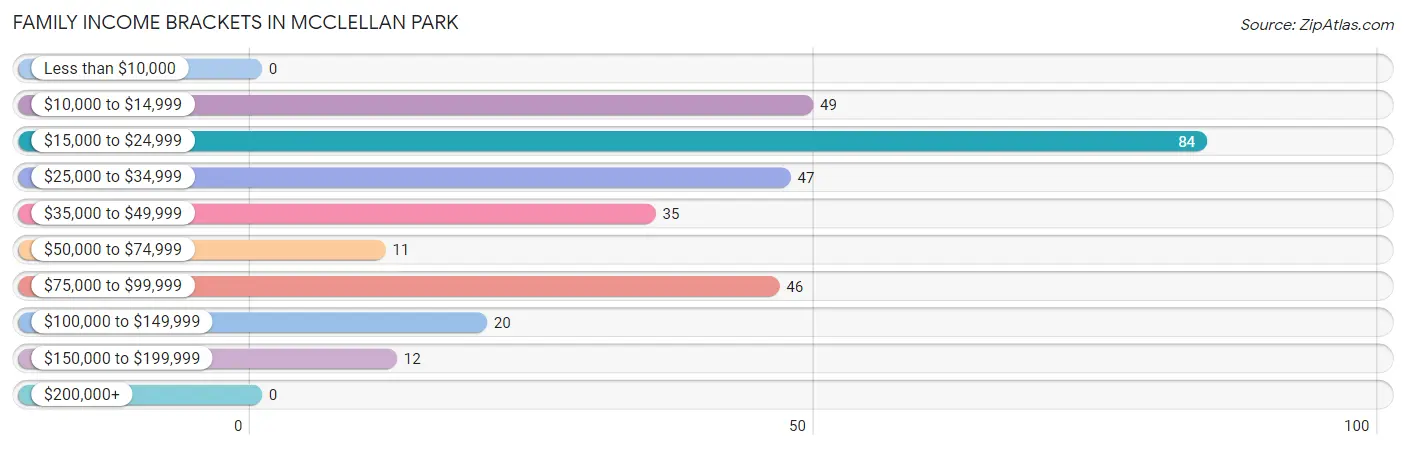
| Income Bracket | # Families | % Families |
| Less than $10,000 | 0 | 0.0% |
| $10,000 to $14,999 | 49 | 16.1% |
| $15,000 to $24,999 | 84 | 27.6% |
| $25,000 to $34,999 | 47 | 15.5% |
| $35,000 to $49,999 | 35 | 11.5% |
| $50,000 to $74,999 | 11 | 3.6% |
| $75,000 to $99,999 | 46 | 15.1% |
| $100,000 to $149,999 | 20 | 6.6% |
| $150,000 to $199,999 | 12 | 3.9% |
| $200,000+ | 0 | 0.0% |
Family Income by Famaliy Size in McClellan Park
2-person families (112 | 36.8%) account for the highest median family income in McClellan Park with $47,619 per family, while 2-person families (112 | 36.8%) have the highest median income of $23,810 per family member.
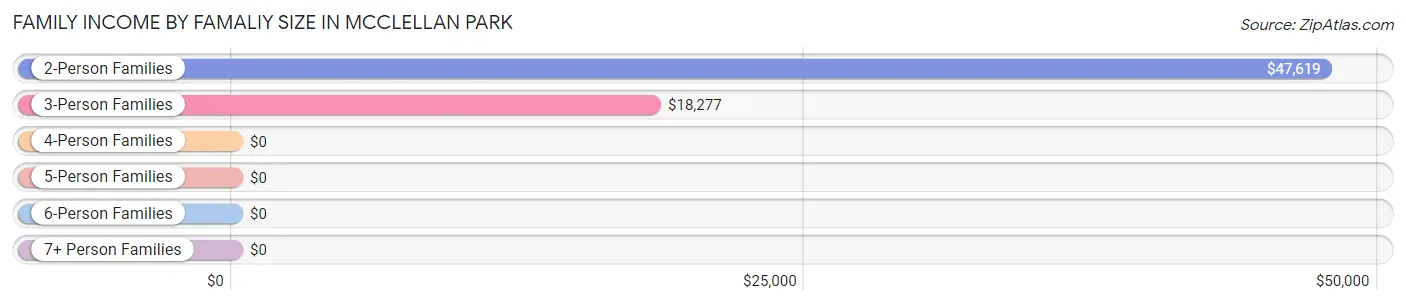
| Income Bracket | # Families | Median Income |
| 2-Person Families | 112 (36.8%) | $47,619 |
| 3-Person Families | 75 (24.7%) | $18,277 |
| 4-Person Families | 66 (21.7%) | $0 |
| 5-Person Families | 23 (7.6%) | $0 |
| 6-Person Families | 0 (0.0%) | $0 |
| 7+ Person Families | 28 (9.2%) | $0 |
| Total | 304 (100.0%) | $31,979 |
Family Income by Number of Earners in McClellan Park
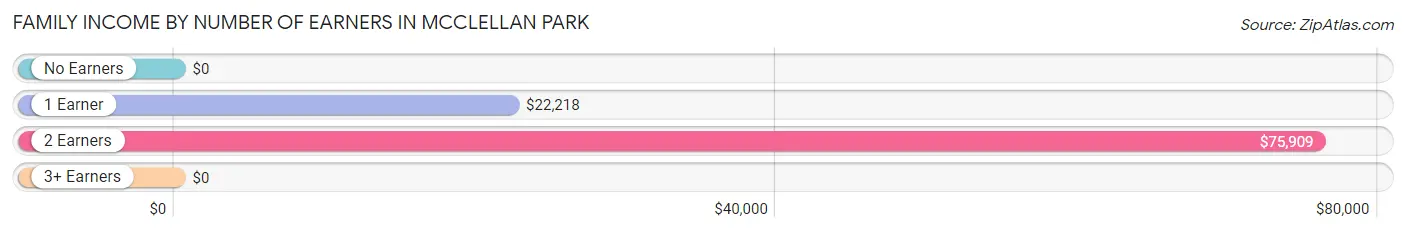
| Number of Earners | # Families | Median Income |
| No Earners | 37 (12.2%) | $0 |
| 1 Earner | 153 (50.3%) | $22,218 |
| 2 Earners | 94 (30.9%) | $75,909 |
| 3+ Earners | 20 (6.6%) | $0 |
| Total | 304 (100.0%) | $31,979 |
Household Income in McClellan Park
Household Income Brackets in McClellan Park
With 84 households falling in the category, the $15,000 to $24,999 income range is the most frequent in McClellan Park, accounting for 24.3% of all households.
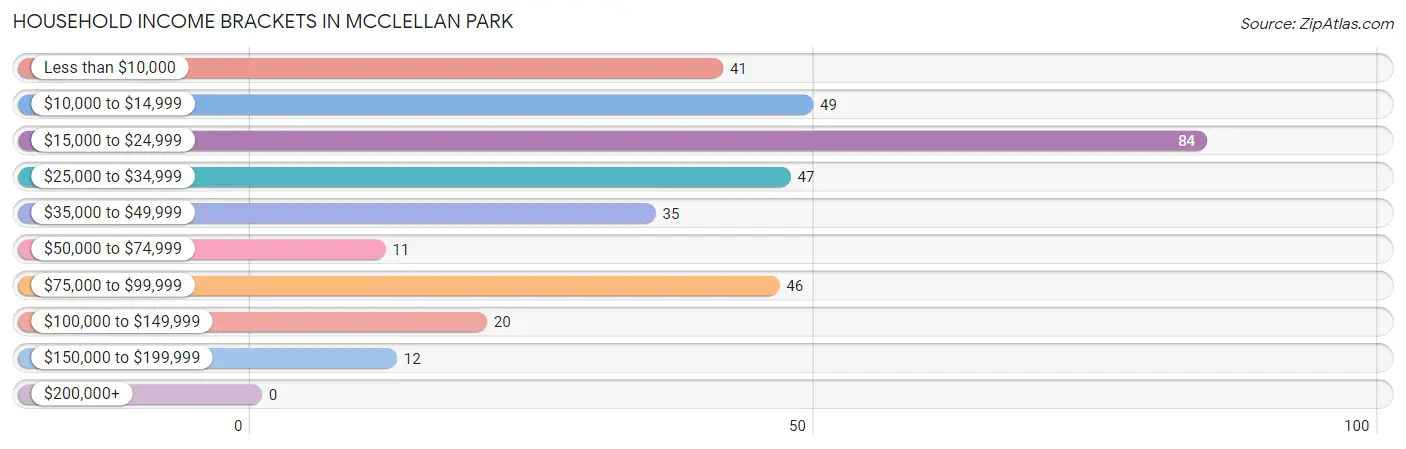
| Income Bracket | # Households | % Households |
| Less than $10,000 | 41 | 11.9% |
| $10,000 to $14,999 | 49 | 14.2% |
| $15,000 to $24,999 | 84 | 24.3% |
| $25,000 to $34,999 | 47 | 13.6% |
| $35,000 to $49,999 | 35 | 10.1% |
| $50,000 to $74,999 | 11 | 3.2% |
| $75,000 to $99,999 | 46 | 13.3% |
| $100,000 to $149,999 | 20 | 5.8% |
| $150,000 to $199,999 | 12 | 3.5% |
| $200,000+ | 0 | 0.0% |
Household Income by Householder Age in McClellan Park
The median household income in McClellan Park is $24,766, with the highest median household income of $33,587 found in the 25 to 44 years age bracket for the primary householder. A total of 122 households (35.4%) fall into this category. Meanwhile, the 15 to 24 years age bracket for the primary householder has the lowest median household income of $0, with 18 households (5.2%) in this group.
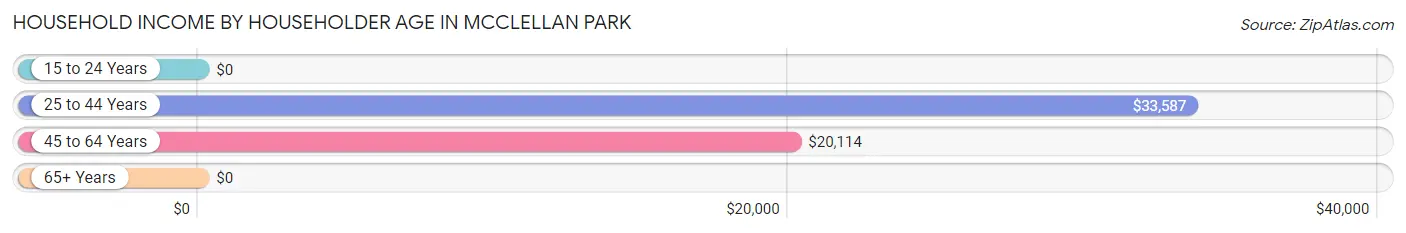
| Income Bracket | # Households | Median Income |
| 15 to 24 Years | 18 (5.2%) | $0 |
| 25 to 44 Years | 122 (35.4%) | $33,587 |
| 45 to 64 Years | 190 (55.1%) | $20,114 |
| 65+ Years | 15 (4.3%) | $0 |
| Total | 345 (100.0%) | $24,766 |
Poverty in McClellan Park
Income Below Poverty by Sex and Age in McClellan Park
With 50.7% poverty level for males and 41.2% for females among the residents of McClellan Park, 16 and 17 year old males and 5 year old females are the most vulnerable to poverty, with 38 males (100.0%) and 26 females (100.0%) in their respective age groups living below the poverty level.
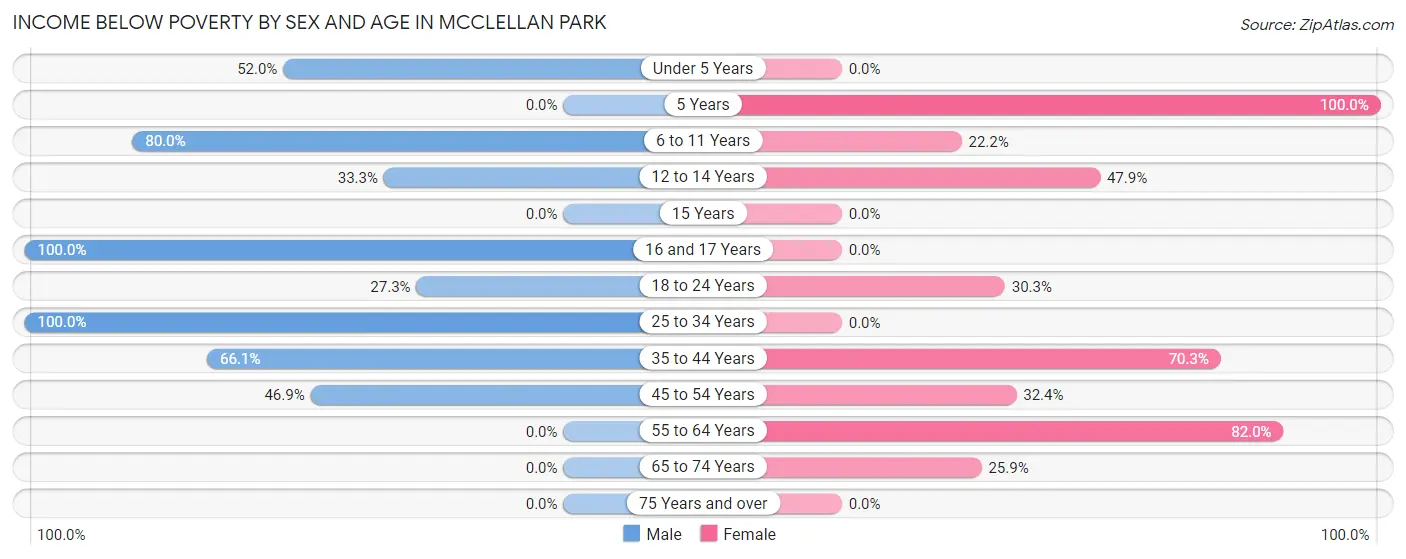
| Age Bracket | Male | Female |
| Under 5 Years | 26 (52.0%) | 0 (0.0%) |
| 5 Years | 0 (0.0%) | 26 (100.0%) |
| 6 to 11 Years | 48 (80.0%) | 22 (22.2%) |
| 12 to 14 Years | 18 (33.3%) | 23 (47.9%) |
| 15 Years | 0 (0.0%) | 0 (0.0%) |
| 16 and 17 Years | 38 (100.0%) | 0 (0.0%) |
| 18 to 24 Years | 42 (27.3%) | 23 (30.3%) |
| 25 to 34 Years | 48 (100.0%) | 0 (0.0%) |
| 35 to 44 Years | 41 (66.1%) | 64 (70.3%) |
| 45 to 54 Years | 23 (46.9%) | 46 (32.4%) |
| 55 to 64 Years | 0 (0.0%) | 50 (82.0%) |
| 65 to 74 Years | 0 (0.0%) | 7 (25.9%) |
| 75 Years and over | 0 (0.0%) | 0 (0.0%) |
| Total | 284 (50.7%) | 261 (41.2%) |
Income Above Poverty by Sex and Age in McClellan Park
According to the poverty statistics in McClellan Park, males aged 5 years and females aged under 5 years are the age groups that are most secure financially, with 100.0% of males and 100.0% of females in these age groups living above the poverty line.
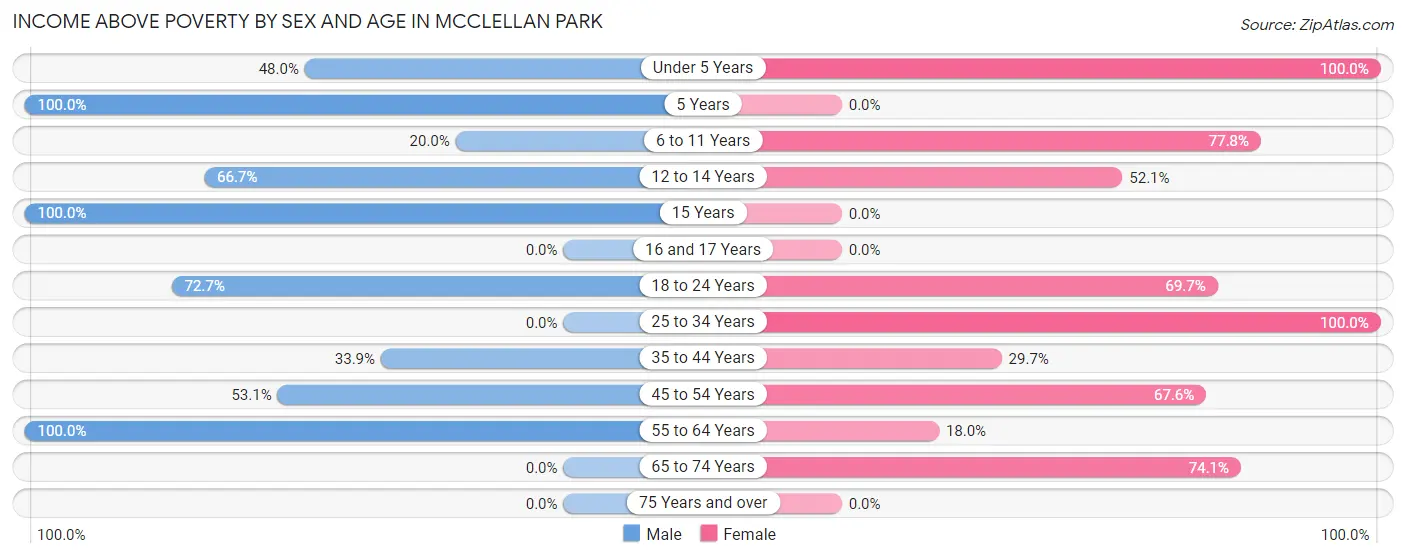
| Age Bracket | Male | Female |
| Under 5 Years | 24 (48.0%) | 21 (100.0%) |
| 5 Years | 12 (100.0%) | 0 (0.0%) |
| 6 to 11 Years | 12 (20.0%) | 77 (77.8%) |
| 12 to 14 Years | 36 (66.7%) | 25 (52.1%) |
| 15 Years | 23 (100.0%) | 0 (0.0%) |
| 16 and 17 Years | 0 (0.0%) | 0 (0.0%) |
| 18 to 24 Years | 112 (72.7%) | 53 (69.7%) |
| 25 to 34 Years | 0 (0.0%) | 42 (100.0%) |
| 35 to 44 Years | 21 (33.9%) | 27 (29.7%) |
| 45 to 54 Years | 26 (53.1%) | 96 (67.6%) |
| 55 to 64 Years | 10 (100.0%) | 11 (18.0%) |
| 65 to 74 Years | 0 (0.0%) | 20 (74.1%) |
| 75 Years and over | 0 (0.0%) | 0 (0.0%) |
| Total | 276 (49.3%) | 372 (58.8%) |
Income Below Poverty Among Married-Couple Families in McClellan Park
The poverty statistics for married-couple families in McClellan Park show that 44.3% or 39 of the total 88 families live below the poverty line. Families with 1 or 2 children have the highest poverty rate of 100.0%, comprising of 16 families. On the other hand, families with no children have the lowest poverty rate of 0.0%, which includes 0 families.
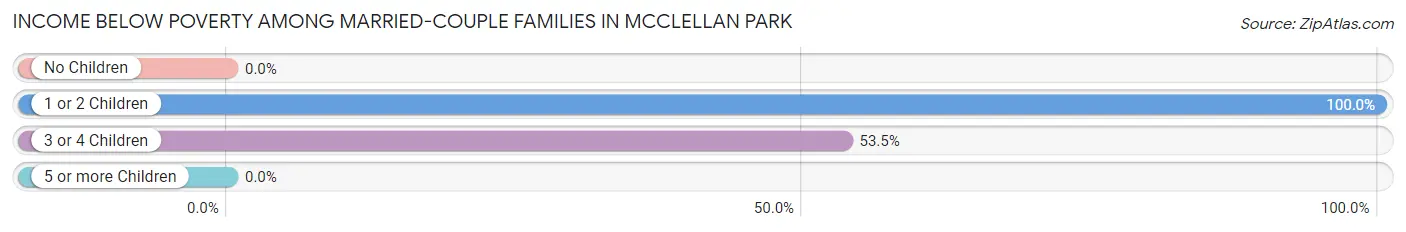
| Children | Above Poverty | Below Poverty |
| No Children | 29 (100.0%) | 0 (0.0%) |
| 1 or 2 Children | 0 (0.0%) | 16 (100.0%) |
| 3 or 4 Children | 20 (46.5%) | 23 (53.5%) |
| 5 or more Children | 0 (0.0%) | 0 (0.0%) |
| Total | 49 (55.7%) | 39 (44.3%) |
Income Below Poverty Among Single-Parent Households in McClellan Park
According to the poverty data in McClellan Park, 52.3% or 23 single-father households and 36.6% or 63 single-mother households are living below the poverty line. Among single-father households, those with 1 or 2 children have the highest poverty rate, with 23 households (52.3%) experiencing poverty. Likewise, among single-mother households, those with no children have the highest poverty rate, with 37 households (50.7%) falling below the poverty line.
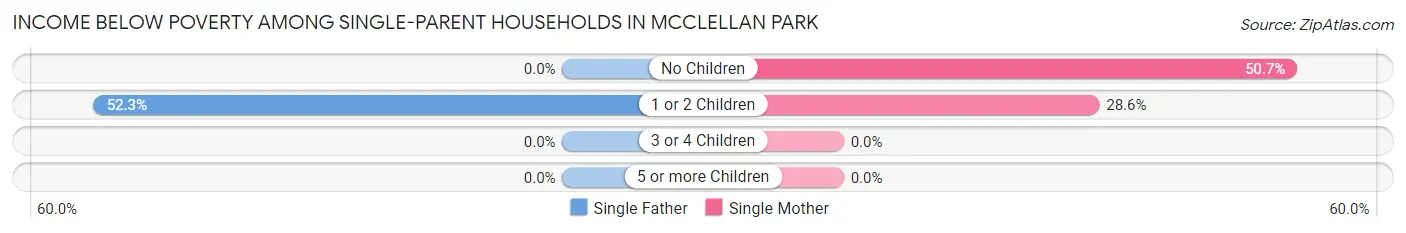
| Children | Single Father | Single Mother |
| No Children | 0 (0.0%) | 37 (50.7%) |
| 1 or 2 Children | 23 (52.3%) | 26 (28.6%) |
| 3 or 4 Children | 0 (0.0%) | 0 (0.0%) |
| 5 or more Children | 0 (0.0%) | 0 (0.0%) |
| Total | 23 (52.3%) | 63 (36.6%) |
Income Below Poverty Among Married-Couple vs Single-Parent Households in McClellan Park
The poverty data for McClellan Park shows that 39 of the married-couple family households (44.3%) and 86 of the single-parent households (39.8%) are living below the poverty level. Within the married-couple family households, those with 1 or 2 children have the highest poverty rate, with 16 households (100.0%) falling below the poverty line. Among the single-parent households, those with no children have the highest poverty rate, with 37 household (50.7%) living below poverty.
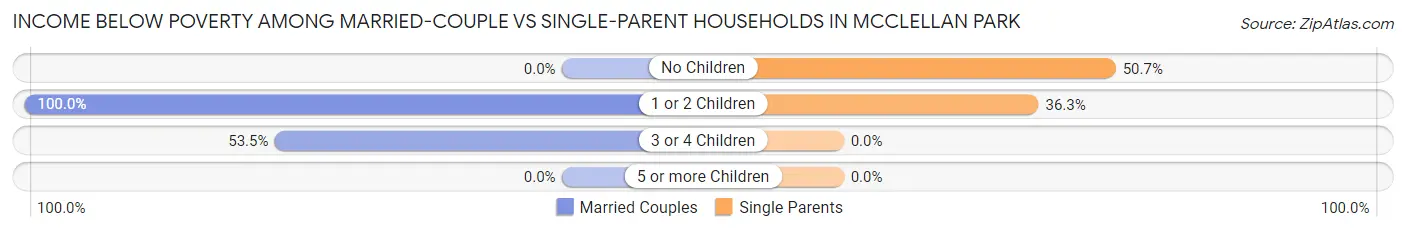
| Children | Married-Couple Families | Single-Parent Households |
| No Children | 0 (0.0%) | 37 (50.7%) |
| 1 or 2 Children | 16 (100.0%) | 49 (36.3%) |
| 3 or 4 Children | 23 (53.5%) | 0 (0.0%) |
| 5 or more Children | 0 (0.0%) | 0 (0.0%) |
| Total | 39 (44.3%) | 86 (39.8%) |
Race in McClellan Park
The most populous races in McClellan Park are White / Caucasian (474 | 39.7%), Two or more Races (329 | 27.6%), and Black / African American (304 | 25.5%).
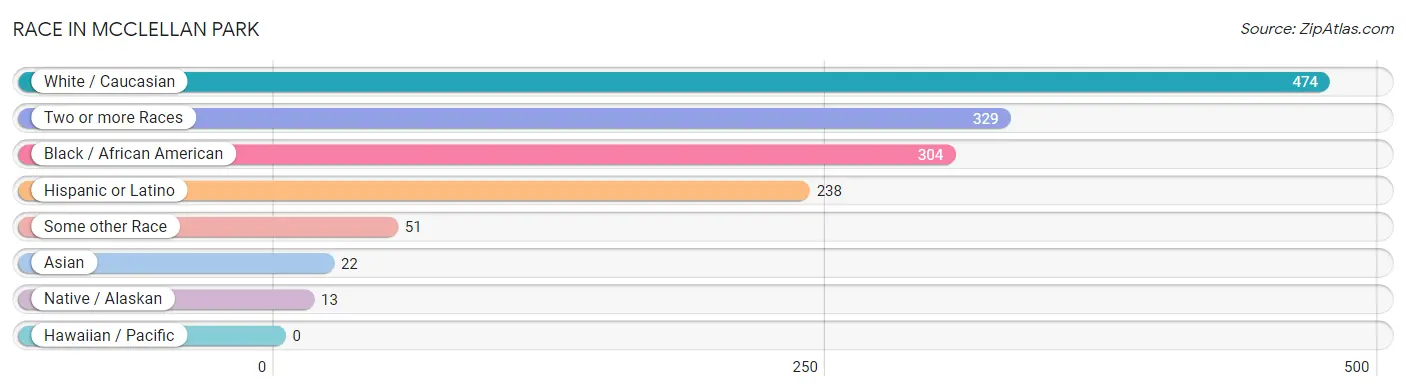
| Race | # Population | % Population |
| Asian | 22 | 1.8% |
| Black / African American | 304 | 25.5% |
| Hawaiian / Pacific | 0 | 0.0% |
| Hispanic or Latino | 238 | 20.0% |
| Native / Alaskan | 13 | 1.1% |
| White / Caucasian | 474 | 39.7% |
| Two or more Races | 329 | 27.6% |
| Some other Race | 51 | 4.3% |
| Total | 1,193 | 100.0% |
Ancestry in McClellan Park
The most populous ancestries reported in McClellan Park are Central American Indian (147 | 12.3%), Mexican (131 | 11.0%), Puerto Rican (107 | 9.0%), Portuguese (78 | 6.5%), and Korean (58 | 4.9%), together accounting for 43.7% of all McClellan Park residents.
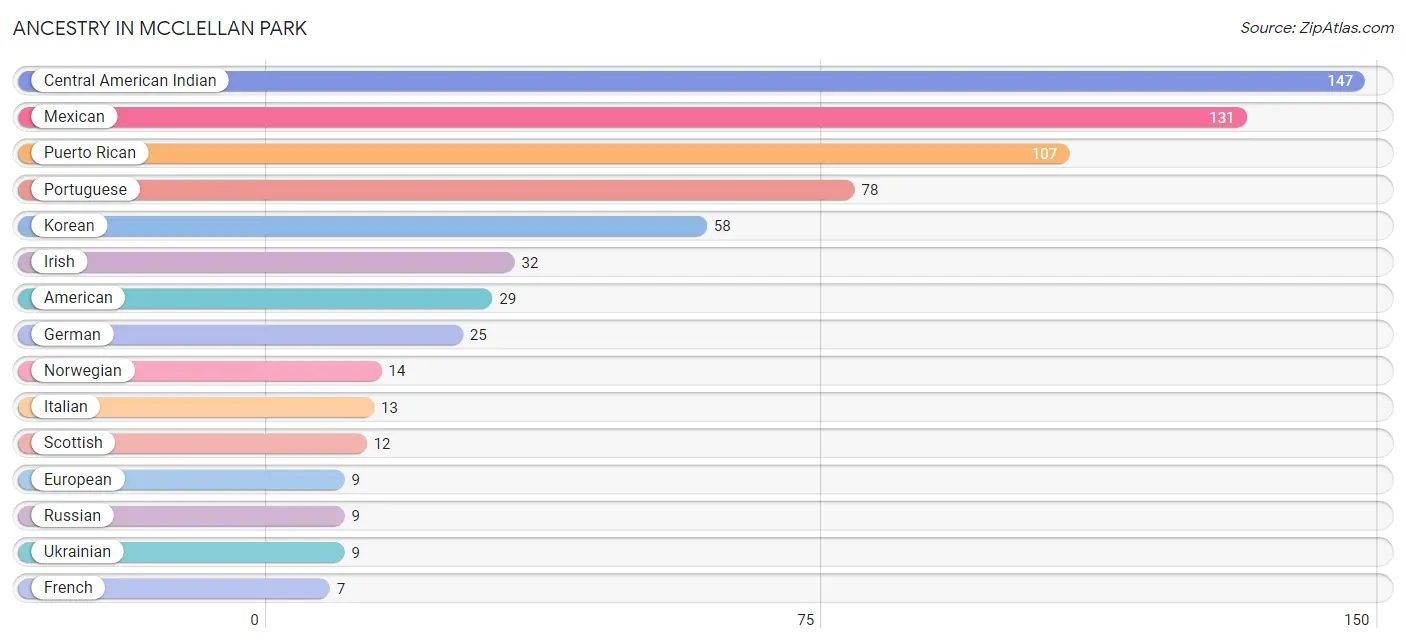
| Ancestry | # Population | % Population |
| American | 29 | 2.4% |
| Central American Indian | 147 | 12.3% |
| European | 9 | 0.7% |
| French | 7 | 0.6% |
| German | 25 | 2.1% |
| Indian (Asian) | 7 | 0.6% |
| Irish | 32 | 2.7% |
| Italian | 13 | 1.1% |
| Korean | 58 | 4.9% |
| Mexican | 131 | 11.0% |
| Norwegian | 14 | 1.2% |
| Portuguese | 78 | 6.5% |
| Puerto Rican | 107 | 9.0% |
| Russian | 9 | 0.7% |
| Scottish | 12 | 1.0% |
| Sri Lankan | 7 | 0.6% |
| Ukrainian | 9 | 0.7% | View All 17 Rows |
Immigrants in McClellan Park
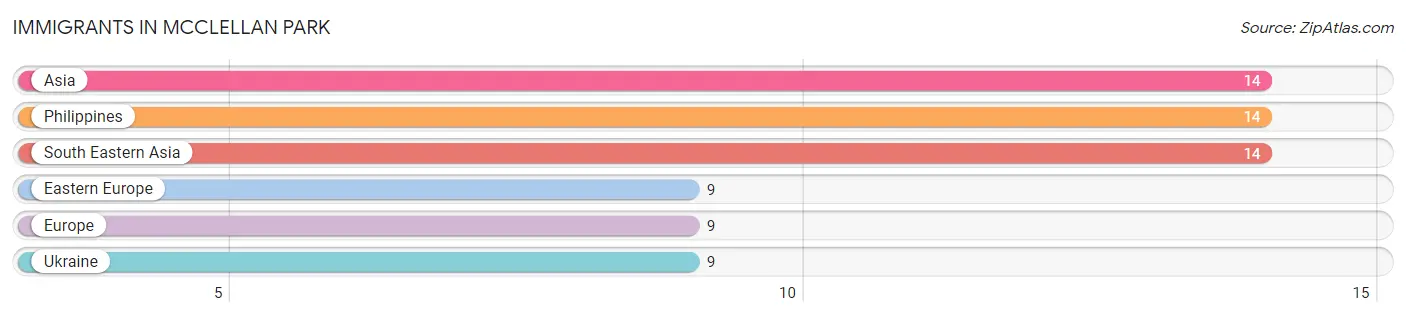
The most numerous immigrant groups reported in McClellan Park came from Asia (14 | 1.2%), Philippines (14 | 1.2%), South Eastern Asia (14 | 1.2%), Eastern Europe (9 | 0.7%), and Europe (9 | 0.7%), together accounting for 5.0% of all McClellan Park residents.
| Immigration Origin | # Population | % Population |
| Asia | 14 | 1.2% |
| Eastern Europe | 9 | 0.7% |
| Europe | 9 | 0.7% |
| Philippines | 14 | 1.2% |
| South Eastern Asia | 14 | 1.2% |
| Ukraine | 9 | 0.7% | View All 6 Rows |
Sex and Age in McClellan Park
Sex and Age in McClellan Park
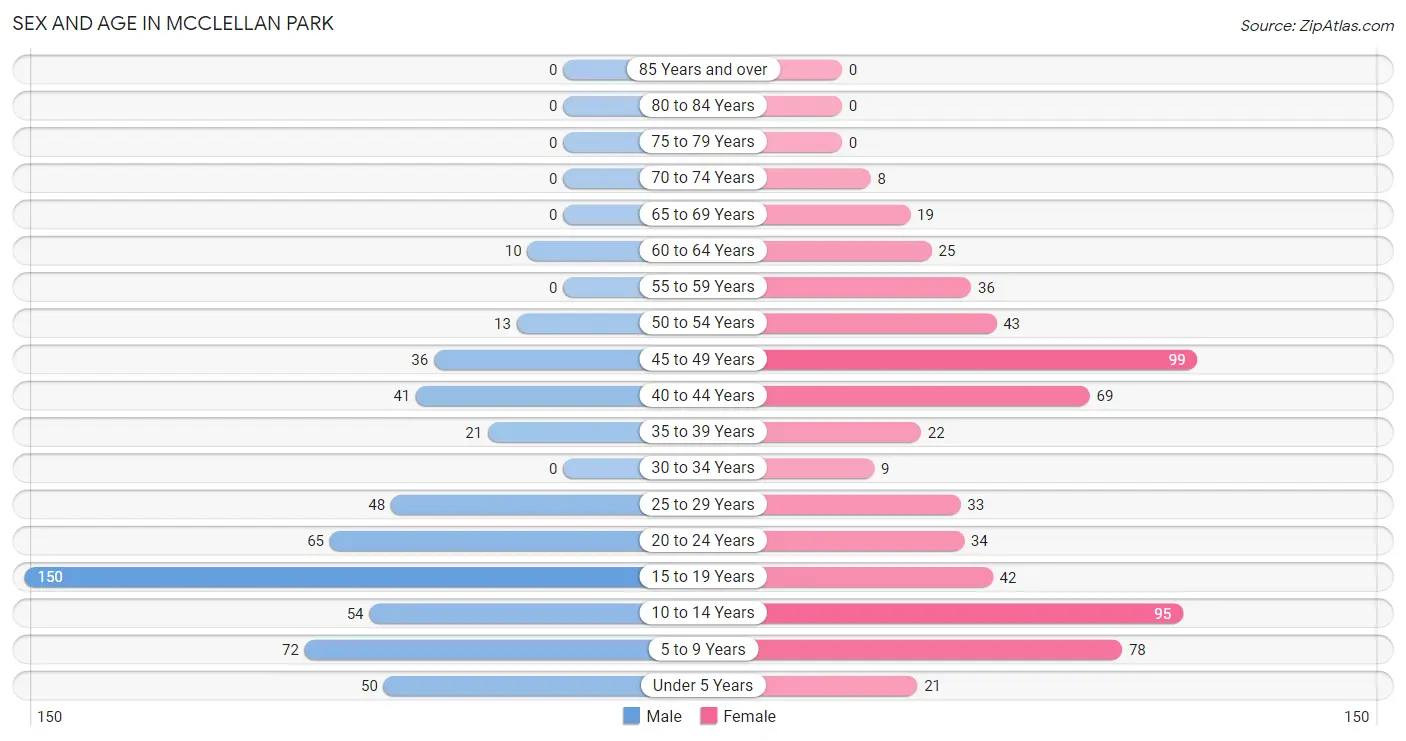
The most populous age groups in McClellan Park are 15 to 19 Years (150 | 26.8%) for men and 45 to 49 Years (99 | 15.6%) for women.
| Age Bracket | Male | Female |
| Under 5 Years | 50 (8.9%) | 21 (3.3%) |
| 5 to 9 Years | 72 (12.9%) | 78 (12.3%) |
| 10 to 14 Years | 54 (9.6%) | 95 (15.0%) |
| 15 to 19 Years | 150 (26.8%) | 42 (6.6%) |
| 20 to 24 Years | 65 (11.6%) | 34 (5.4%) |
| 25 to 29 Years | 48 (8.6%) | 33 (5.2%) |
| 30 to 34 Years | 0 (0.0%) | 9 (1.4%) |
| 35 to 39 Years | 21 (3.7%) | 22 (3.5%) |
| 40 to 44 Years | 41 (7.3%) | 69 (10.9%) |
| 45 to 49 Years | 36 (6.4%) | 99 (15.6%) |
| 50 to 54 Years | 13 (2.3%) | 43 (6.8%) |
| 55 to 59 Years | 0 (0.0%) | 36 (5.7%) |
| 60 to 64 Years | 10 (1.8%) | 25 (4.0%) |
| 65 to 69 Years | 0 (0.0%) | 19 (3.0%) |
| 70 to 74 Years | 0 (0.0%) | 8 (1.3%) |
| 75 to 79 Years | 0 (0.0%) | 0 (0.0%) |
| 80 to 84 Years | 0 (0.0%) | 0 (0.0%) |
| 85 Years and over | 0 (0.0%) | 0 (0.0%) |
| Total | 560 (100.0%) | 633 (100.0%) |
Families and Households in McClellan Park
Median Family Size in McClellan Park
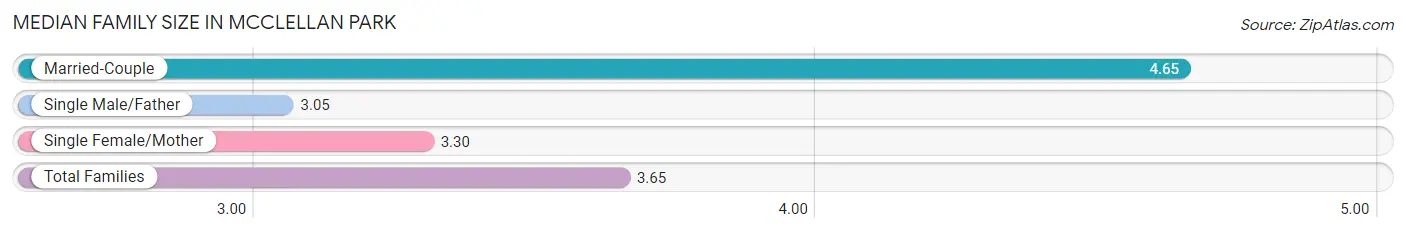
The median family size in McClellan Park is 3.65 persons per family, with married-couple families (88 | 28.9%) accounting for the largest median family size of 4.65 persons per family. On the other hand, single male/father families (44 | 14.5%) represent the smallest median family size with 3.05 persons per family.
| Family Type | # Families | Family Size |
| Married-Couple | 88 (28.9%) | 4.65 |
| Single Male/Father | 44 (14.5%) | 3.05 |
| Single Female/Mother | 172 (56.6%) | 3.30 |
| Total Families | 304 (100.0%) | 3.65 |
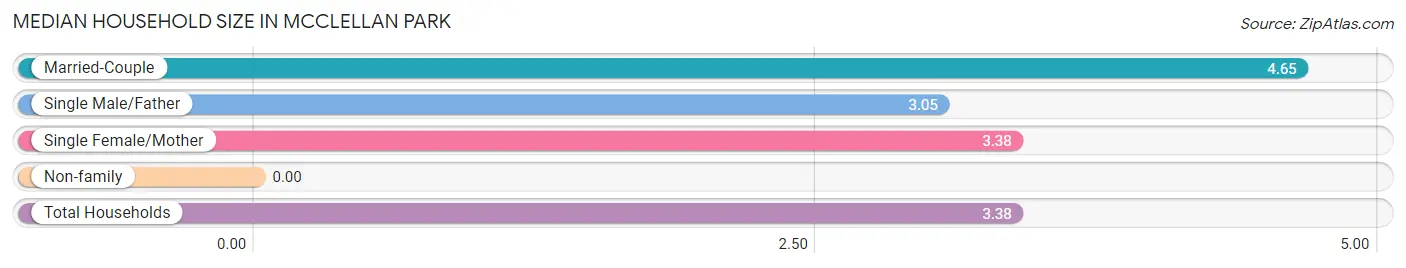
Median Household Size in McClellan Park
| Household Type | # Households | Household Size |
| Married-Couple | 88 (25.5%) | 4.65 |
| Single Male/Father | 44 (12.8%) | 3.05 |
| Single Female/Mother | 172 (49.9%) | 3.38 |
| Non-family | 41 (11.9%) | - |
| Total Households | 345 (100.0%) | 3.38 |
Household Size by Marriage Status in McClellan Park
Out of a total of 345 households in McClellan Park, 304 (88.1%) are family households, while 41 (11.9%) are nonfamily households. The most numerous type of family households are 2-person households, comprising 112, and the most common type of nonfamily households are 1-person households, comprising 41.
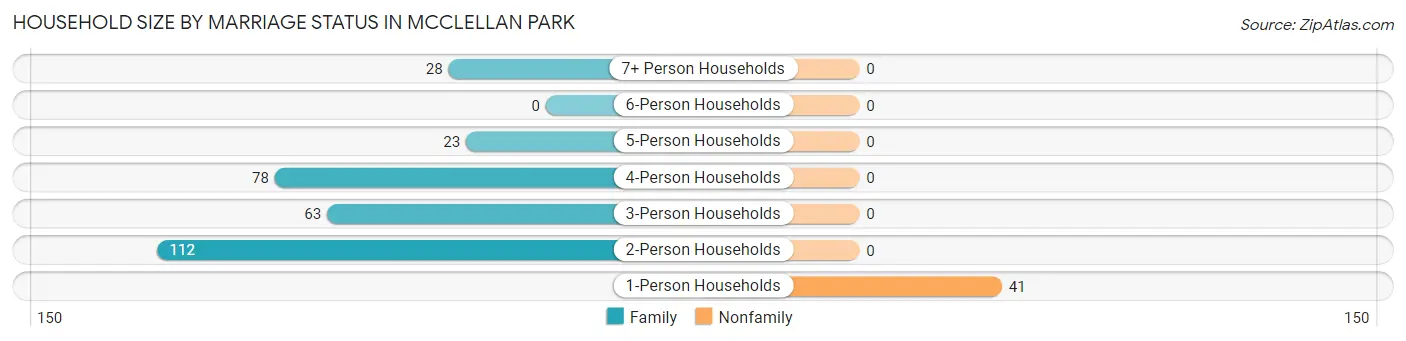
| Household Size | Family Households | Nonfamily Households |
| 1-Person Households | - | 41 (11.9%) |
| 2-Person Households | 112 (32.5%) | 0 (0.0%) |
| 3-Person Households | 63 (18.3%) | 0 (0.0%) |
| 4-Person Households | 78 (22.6%) | 0 (0.0%) |
| 5-Person Households | 23 (6.7%) | 0 (0.0%) |
| 6-Person Households | 0 (0.0%) | 0 (0.0%) |
| 7+ Person Households | 28 (8.1%) | 0 (0.0%) |
| Total | 304 (88.1%) | 41 (11.9%) |
Female Fertility in McClellan Park
Fertility by Age in McClellan Park
| Age Bracket | Women with Births | Births / 1,000 Women |
| 15 to 19 years | 0 (0.0%) | 0.0 |
| 20 to 34 years | 0 (0.0%) | 0.0 |
| 35 to 50 years | 0 (0.0%) | 0.0 |
| Total | 0 (0.0%) | 0.0 |
Fertility by Age by Marriage Status in McClellan Park
| Age Bracket | Married | Unmarried |
| 15 to 19 years | 0 (0.0%) | 0 (0.0%) |
| 20 to 34 years | 0 (0.0%) | 0 (0.0%) |
| 35 to 50 years | 0 (0.0%) | 0 (0.0%) |
| Total | 0 (0.0%) | 0 (0.0%) |
Fertility by Education in McClellan Park
| Educational Attainment | Women with Births | Births / 1,000 Women |
| Less than High School | 0 (0.0%) | 0.0 |
| High School Diploma | 0 (0.0%) | 0.0 |
| College or Associate's Degree | 0 (0.0%) | 0.0 |
| Bachelor's Degree | 0 (0.0%) | 0.0 |
| Graduate Degree | 0 (0.0%) | 0.0 |
| Total | 0 (0.0%) | 0.0 |
Fertility by Education by Marriage Status in McClellan Park
| Educational Attainment | Married | Unmarried |
| Less than High School | 0 (0.0%) | 0 (0.0%) |
| High School Diploma | 0 (0.0%) | 0 (0.0%) |
| College or Associate's Degree | 0 (0.0%) | 0 (0.0%) |
| Bachelor's Degree | 0 (0.0%) | 0 (0.0%) |
| Graduate Degree | 0 (0.0%) | 0 (0.0%) |
| Total | 0 (0.0%) | 0 (0.0%) |
Employment Characteristics in McClellan Park
Employment by Class of Employer in McClellan Park
Among the 404 employed individuals in McClellan Park, private company employees (309 | 76.5%), state government employees (34 | 8.4%), and self-employed (not incorporated) (24 | 5.9%) make up the most common classes of employment.
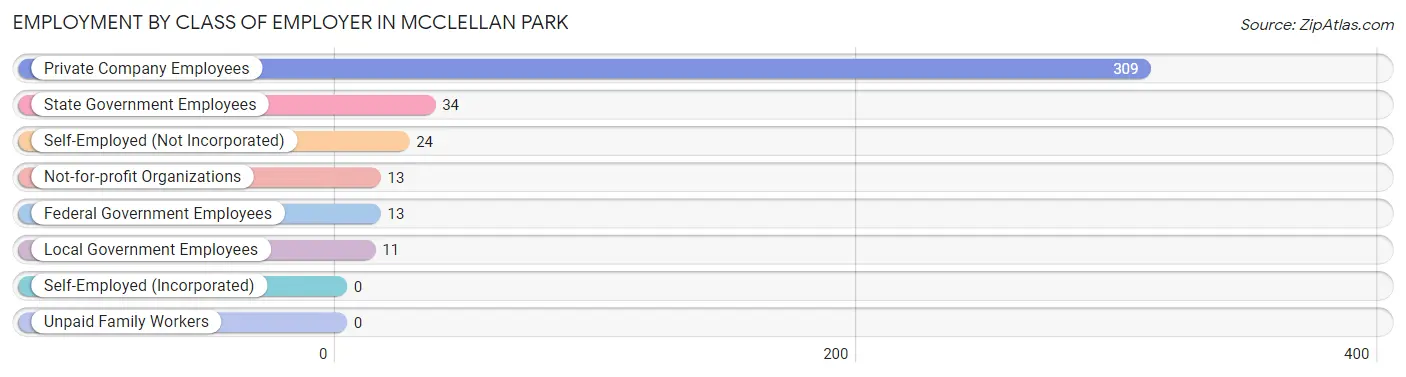
| Employer Class | # Employees | % Employees |
| Private Company Employees | 309 | 76.5% |
| Self-Employed (Incorporated) | 0 | 0.0% |
| Self-Employed (Not Incorporated) | 24 | 5.9% |
| Not-for-profit Organizations | 13 | 3.2% |
| Local Government Employees | 11 | 2.7% |
| State Government Employees | 34 | 8.4% |
| Federal Government Employees | 13 | 3.2% |
| Unpaid Family Workers | 0 | 0.0% |
| Total | 404 | 100.0% |
Employment Status by Age in McClellan Park
According to the labor force statistics for McClellan Park, out of the total population over 16 years of age (800), 58.1% or 465 individuals are in the labor force, with 2.9% or 13 of them unemployed. The age group with the highest labor force participation rate is 30 to 34 years, with 100.0% or 9 individuals in the labor force. Within the labor force, the 16 to 19 years age range has the highest percentage of unemployed individuals, with 15.6% or 12 of them being unemployed.
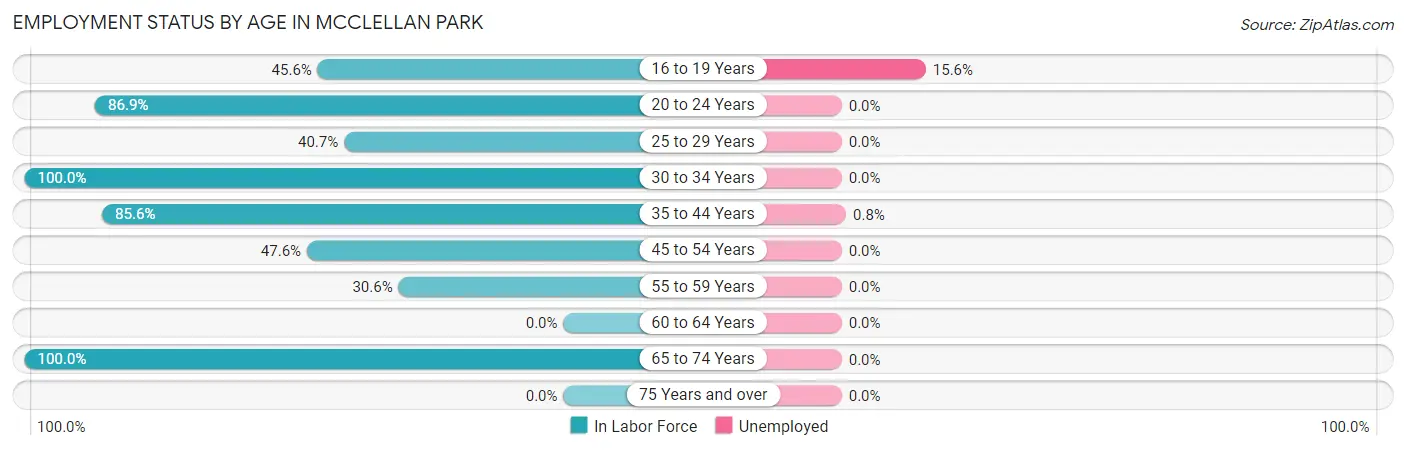
| Age Bracket | In Labor Force | Unemployed |
| 16 to 19 Years | 77 (45.6%) | 12 (15.6%) |
| 20 to 24 Years | 86 (86.9%) | 0 (0.0%) |
| 25 to 29 Years | 33 (40.7%) | 0 (0.0%) |
| 30 to 34 Years | 9 (100.0%) | 0 (0.0%) |
| 35 to 44 Years | 131 (85.6%) | 1 (0.8%) |
| 45 to 54 Years | 91 (47.6%) | 0 (0.0%) |
| 55 to 59 Years | 11 (30.6%) | 0 (0.0%) |
| 60 to 64 Years | 0 (0.0%) | 0 (0.0%) |
| 65 to 74 Years | 27 (100.0%) | 0 (0.0%) |
| 75 Years and over | 0 (0.0%) | 0 (0.0%) |
| Total | 465 (58.1%) | 13 (2.9%) |
Employment Status by Educational Attainment in McClellan Park
According to labor force statistics for McClellan Park, 54.5% of individuals (275) out of the total population between 25 and 64 years of age (505) are in the labor force, with 0.4% or 1 of them being unemployed. The group with the highest labor force participation rate are those with the educational attainment of college / associate degree, with 67.9% or 133 individuals in the labor force. Within the labor force, individuals with high school diploma education have the highest percentage of unemployment, with 1.4% or 1 of them being unemployed.
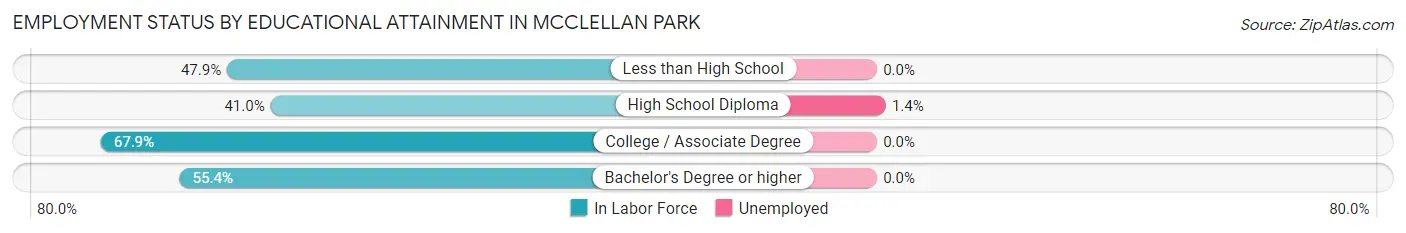
| Educational Attainment | In Labor Force | Unemployed |
| Less than High School | 23 (47.9%) | 0 (0.0%) |
| High School Diploma | 73 (41.0%) | 2 (1.4%) |
| College / Associate Degree | 133 (67.9%) | 0 (0.0%) |
| Bachelor's Degree or higher | 46 (55.4%) | 0 (0.0%) |
| Total | 275 (54.5%) | 2 (0.4%) |
Employment Occupations by Sex in McClellan Park
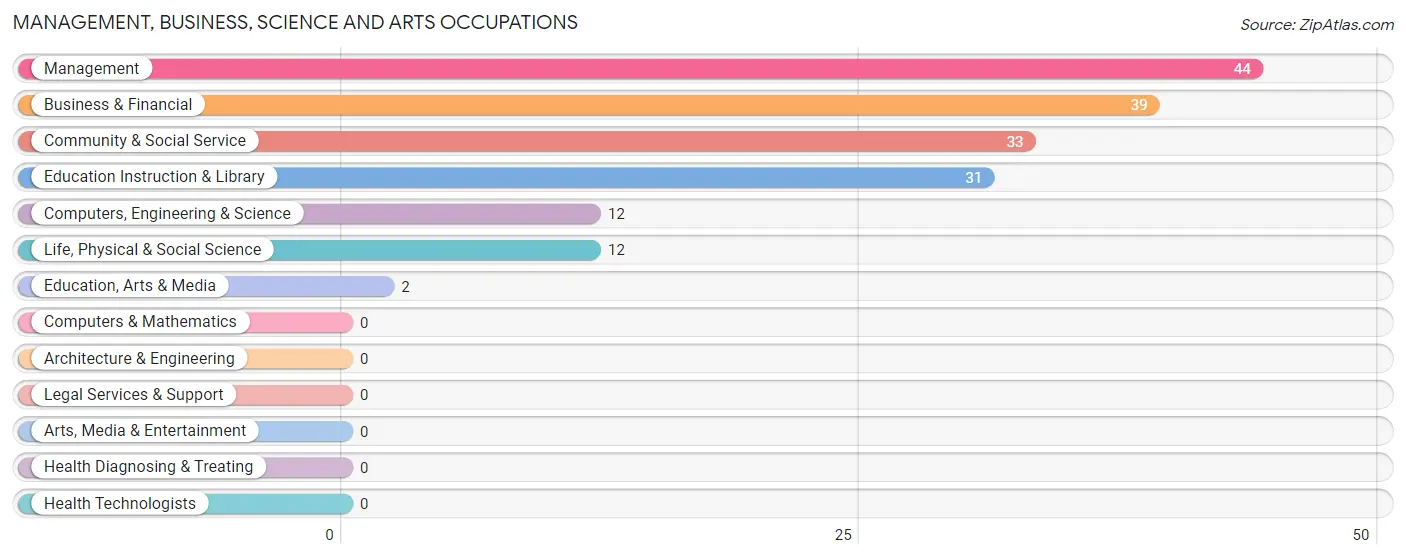
Management, Business, Science and Arts Occupations
The most common Management, Business, Science and Arts occupations in McClellan Park are Management (44 | 10.0%), Business & Financial (39 | 8.8%), Community & Social Service (33 | 7.5%), Education Instruction & Library (31 | 7.0%), and Computers, Engineering & Science (12 | 2.7%).
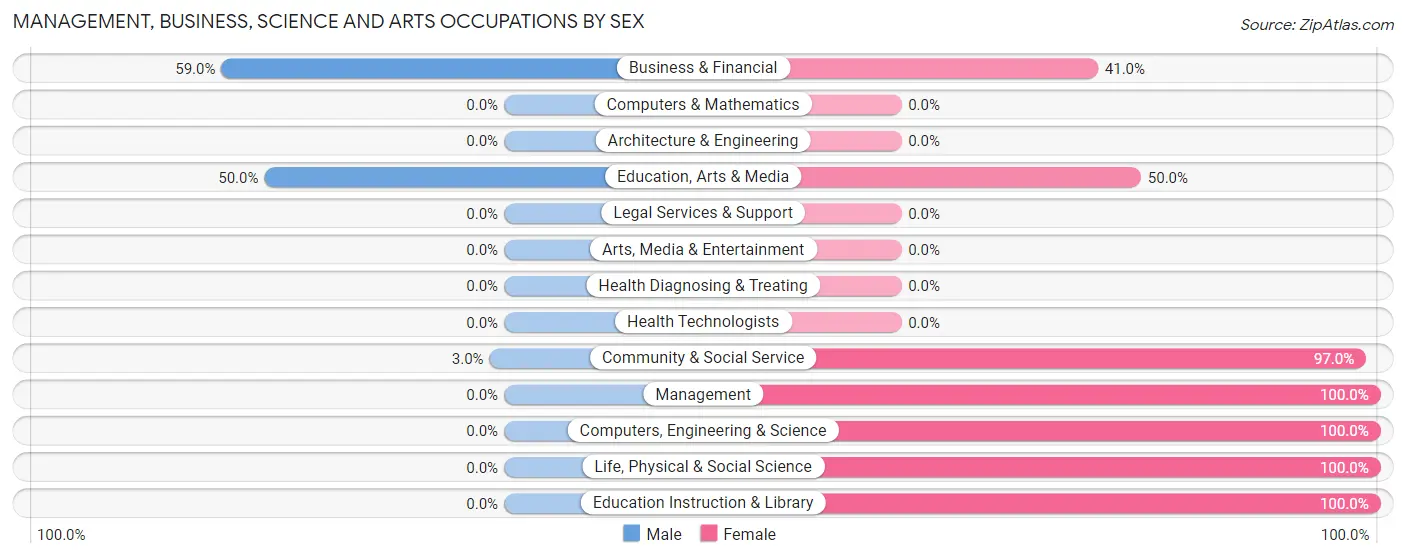
Management, Business, Science and Arts Occupations by Sex
Within the Management, Business, Science and Arts occupations in McClellan Park, the most male-oriented occupations are Business & Financial (59.0%), Education, Arts & Media (50.0%), and Community & Social Service (3.0%), while the most female-oriented occupations are Management (100.0%), Computers, Engineering & Science (100.0%), and Life, Physical & Social Science (100.0%).
| Occupation | Male | Female |
| Management | 0 (0.0%) | 44 (100.0%) |
| Business & Financial | 23 (59.0%) | 16 (41.0%) |
| Computers, Engineering & Science | 0 (0.0%) | 12 (100.0%) |
| Computers & Mathematics | 0 (0.0%) | 0 (0.0%) |
| Architecture & Engineering | 0 (0.0%) | 0 (0.0%) |
| Life, Physical & Social Science | 0 (0.0%) | 12 (100.0%) |
| Community & Social Service | 1 (3.0%) | 32 (97.0%) |
| Education, Arts & Media | 1 (50.0%) | 1 (50.0%) |
| Legal Services & Support | 0 (0.0%) | 0 (0.0%) |
| Education Instruction & Library | 0 (0.0%) | 31 (100.0%) |
| Arts, Media & Entertainment | 0 (0.0%) | 0 (0.0%) |
| Health Diagnosing & Treating | 0 (0.0%) | 0 (0.0%) |
| Health Technologists | 0 (0.0%) | 0 (0.0%) |
| Total (Category) | 24 (18.8%) | 104 (81.2%) |
| Total (Overall) | 164 (37.2%) | 277 (62.8%) |
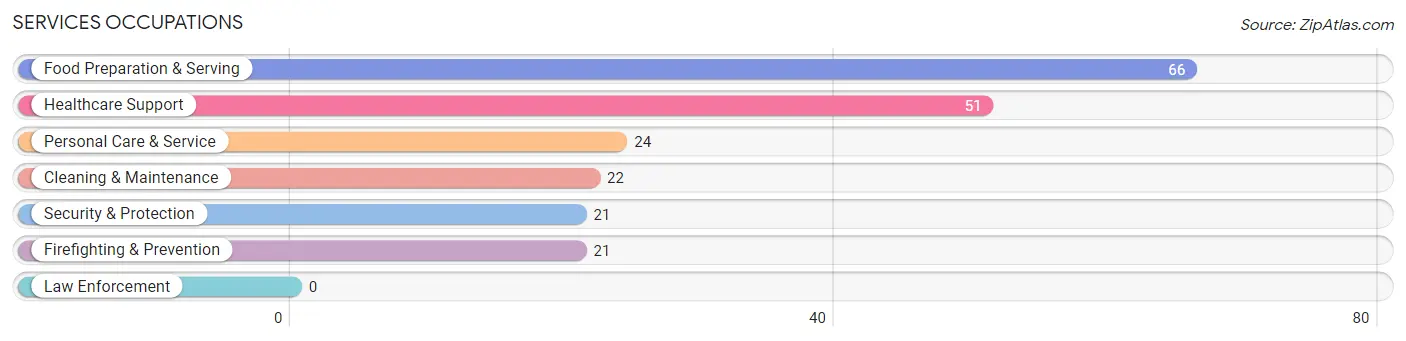
Services Occupations
The most common Services occupations in McClellan Park are Food Preparation & Serving (66 | 15.0%), Healthcare Support (51 | 11.6%), Personal Care & Service (24 | 5.4%), Cleaning & Maintenance (22 | 5.0%), and Security & Protection (21 | 4.8%).
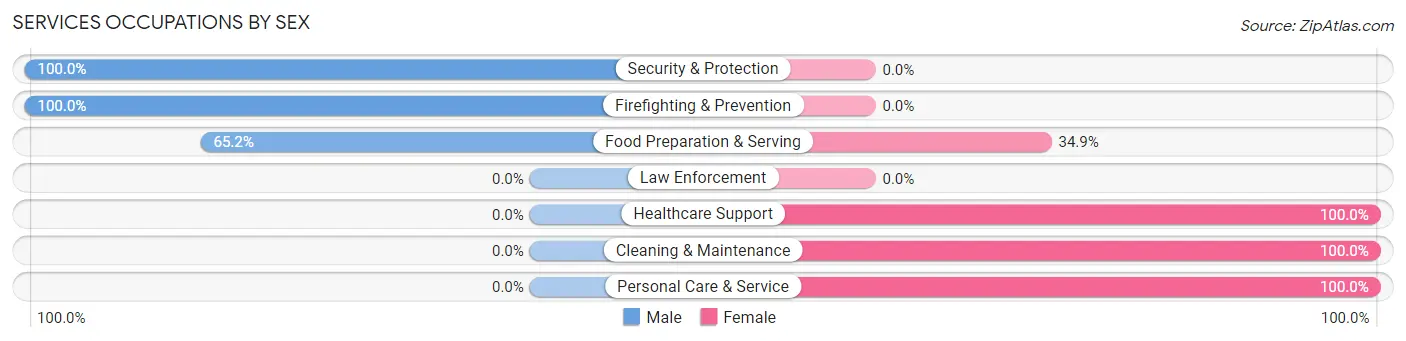
Services Occupations by Sex
Within the Services occupations in McClellan Park, the most male-oriented occupations are Security & Protection (100.0%), Firefighting & Prevention (100.0%), and Food Preparation & Serving (65.1%), while the most female-oriented occupations are Healthcare Support (100.0%), Cleaning & Maintenance (100.0%), and Personal Care & Service (100.0%).
| Occupation | Male | Female |
| Healthcare Support | 0 (0.0%) | 51 (100.0%) |
| Security & Protection | 21 (100.0%) | 0 (0.0%) |
| Firefighting & Prevention | 21 (100.0%) | 0 (0.0%) |
| Law Enforcement | 0 (0.0%) | 0 (0.0%) |
| Food Preparation & Serving | 43 (65.1%) | 23 (34.8%) |
| Cleaning & Maintenance | 0 (0.0%) | 22 (100.0%) |
| Personal Care & Service | 0 (0.0%) | 24 (100.0%) |
| Total (Category) | 64 (34.8%) | 120 (65.2%) |
| Total (Overall) | 164 (37.2%) | 277 (62.8%) |
Sales and Office Occupations
The most common Sales and Office occupations in McClellan Park are Sales & Related (53 | 12.0%), and Office & Administration (27 | 6.1%).
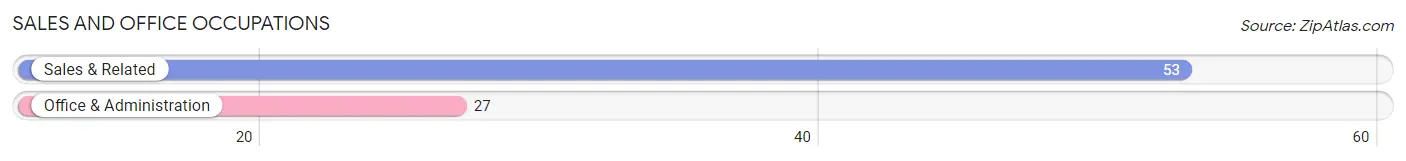
Sales and Office Occupations by Sex
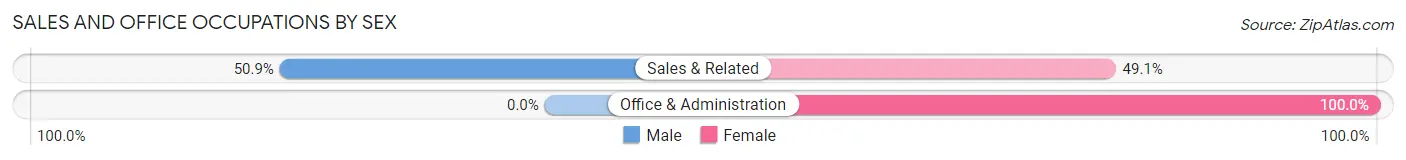
| Occupation | Male | Female |
| Sales & Related | 27 (50.9%) | 26 (49.1%) |
| Office & Administration | 0 (0.0%) | 27 (100.0%) |
| Total (Category) | 27 (33.8%) | 53 (66.2%) |
| Total (Overall) | 164 (37.2%) | 277 (62.8%) |
Natural Resources, Construction and Maintenance Occupations
The most common Natural Resources, Construction and Maintenance occupations in McClellan Park are , and Installation, Maintenance & Repair (13 | 2.9%).
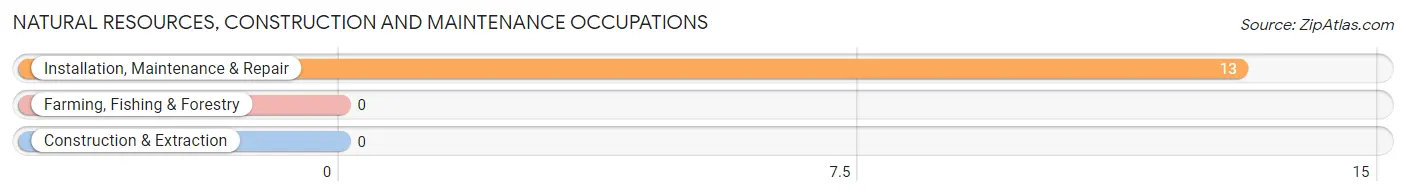
Natural Resources, Construction and Maintenance Occupations by Sex
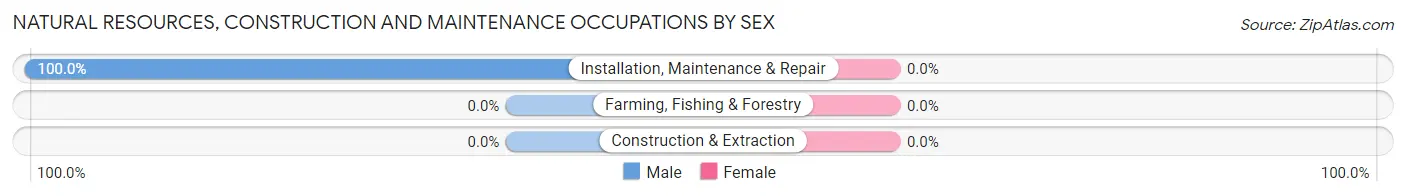
| Occupation | Male | Female |
| Farming, Fishing & Forestry | 0 (0.0%) | 0 (0.0%) |
| Construction & Extraction | 0 (0.0%) | 0 (0.0%) |
| Installation, Maintenance & Repair | 13 (100.0%) | 0 (0.0%) |
| Total (Category) | 13 (100.0%) | 0 (0.0%) |
| Total (Overall) | 164 (37.2%) | 277 (62.8%) |
Production, Transportation and Moving Occupations
The most common Production, Transportation and Moving occupations in McClellan Park are Production (17 | 3.8%), Transportation (13 | 2.9%), and Material Moving (6 | 1.4%).
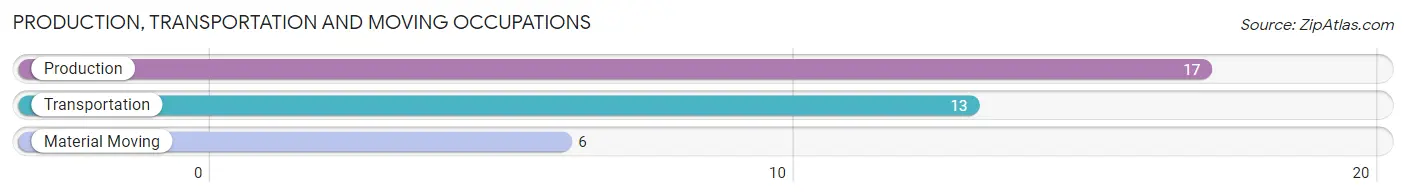
Production, Transportation and Moving Occupations by Sex
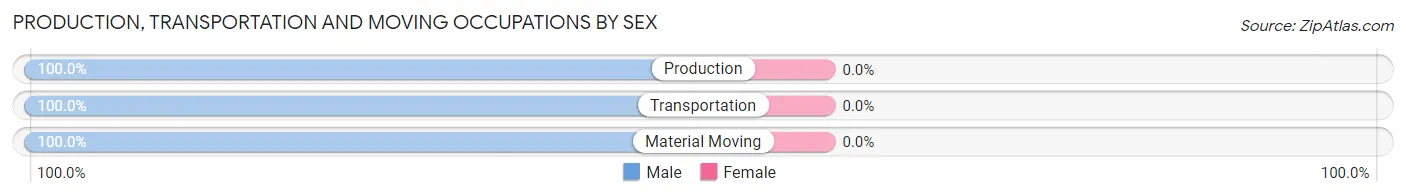
| Occupation | Male | Female |
| Production | 17 (100.0%) | 0 (0.0%) |
| Transportation | 13 (100.0%) | 0 (0.0%) |
| Material Moving | 6 (100.0%) | 0 (0.0%) |
| Total (Category) | 36 (100.0%) | 0 (0.0%) |
| Total (Overall) | 164 (37.2%) | 277 (62.8%) |
Employment Industries by Sex in McClellan Park
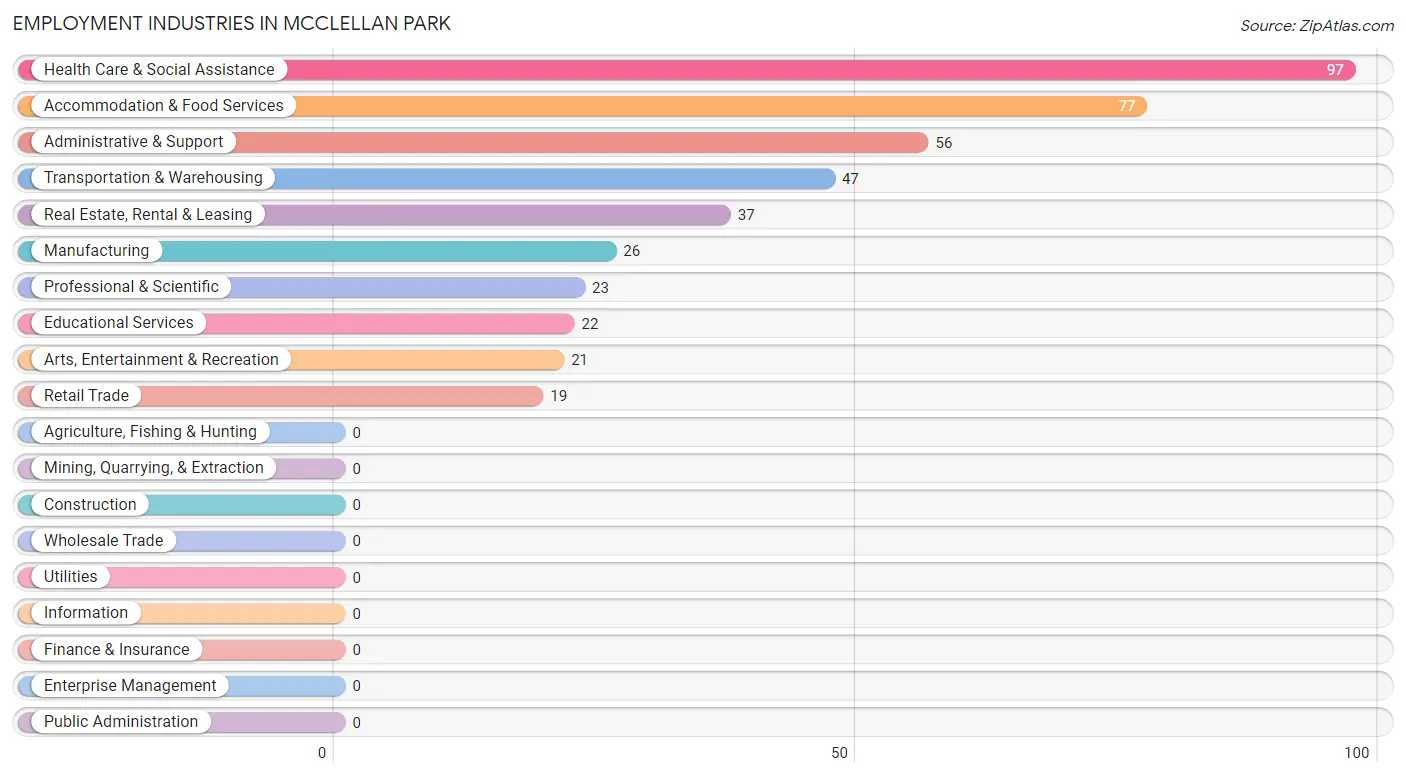
Employment Industries in McClellan Park
The major employment industries in McClellan Park include Health Care & Social Assistance (97 | 22.0%), Accommodation & Food Services (77 | 17.5%), Administrative & Support (56 | 12.7%), Transportation & Warehousing (47 | 10.7%), and Real Estate, Rental & Leasing (37 | 8.4%).
Employment Industries by Sex in McClellan Park
The McClellan Park industries that see more men than women are Professional & Scientific (100.0%), Arts, Entertainment & Recreation (100.0%), and Transportation & Warehousing (76.6%), whereas the industries that tend to have a higher number of women are Manufacturing (100.0%), Retail Trade (100.0%), and Educational Services (100.0%).
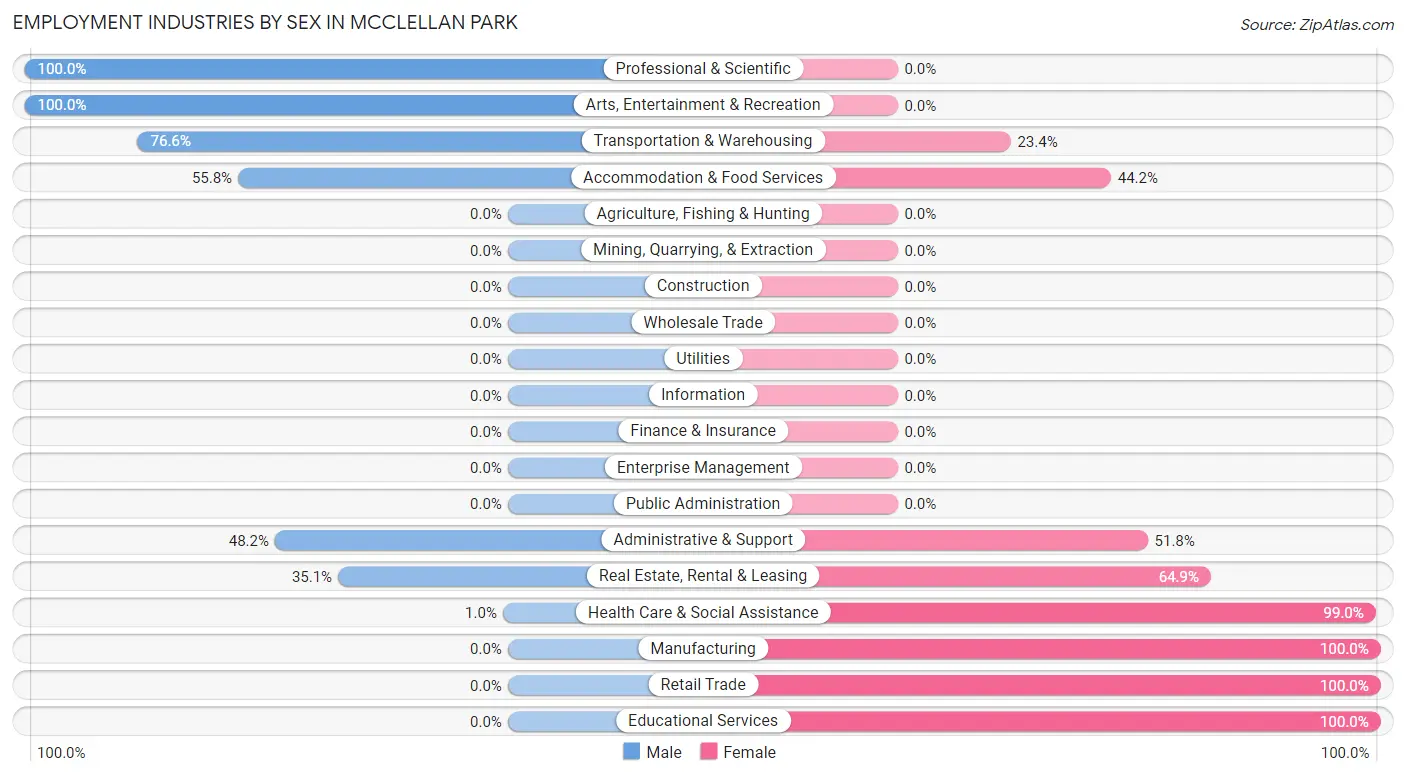
| Industry | Male | Female |
| Agriculture, Fishing & Hunting | 0 (0.0%) | 0 (0.0%) |
| Mining, Quarrying, & Extraction | 0 (0.0%) | 0 (0.0%) |
| Construction | 0 (0.0%) | 0 (0.0%) |
| Manufacturing | 0 (0.0%) | 26 (100.0%) |
| Wholesale Trade | 0 (0.0%) | 0 (0.0%) |
| Retail Trade | 0 (0.0%) | 19 (100.0%) |
| Transportation & Warehousing | 36 (76.6%) | 11 (23.4%) |
| Utilities | 0 (0.0%) | 0 (0.0%) |
| Information | 0 (0.0%) | 0 (0.0%) |
| Finance & Insurance | 0 (0.0%) | 0 (0.0%) |
| Real Estate, Rental & Leasing | 13 (35.1%) | 24 (64.9%) |
| Professional & Scientific | 23 (100.0%) | 0 (0.0%) |
| Enterprise Management | 0 (0.0%) | 0 (0.0%) |
| Administrative & Support | 27 (48.2%) | 29 (51.8%) |
| Educational Services | 0 (0.0%) | 22 (100.0%) |
| Health Care & Social Assistance | 1 (1.0%) | 96 (99.0%) |
| Arts, Entertainment & Recreation | 21 (100.0%) | 0 (0.0%) |
| Accommodation & Food Services | 43 (55.8%) | 34 (44.2%) |
| Public Administration | 0 (0.0%) | 0 (0.0%) |
| Total | 164 (37.2%) | 277 (62.8%) |
Education in McClellan Park
School Enrollment in McClellan Park
The most common levels of schooling among the 542 students in McClellan Park are elementary school (137 | 25.3%), high school (126 | 23.3%), and college / undergraduate (94 | 17.3%).
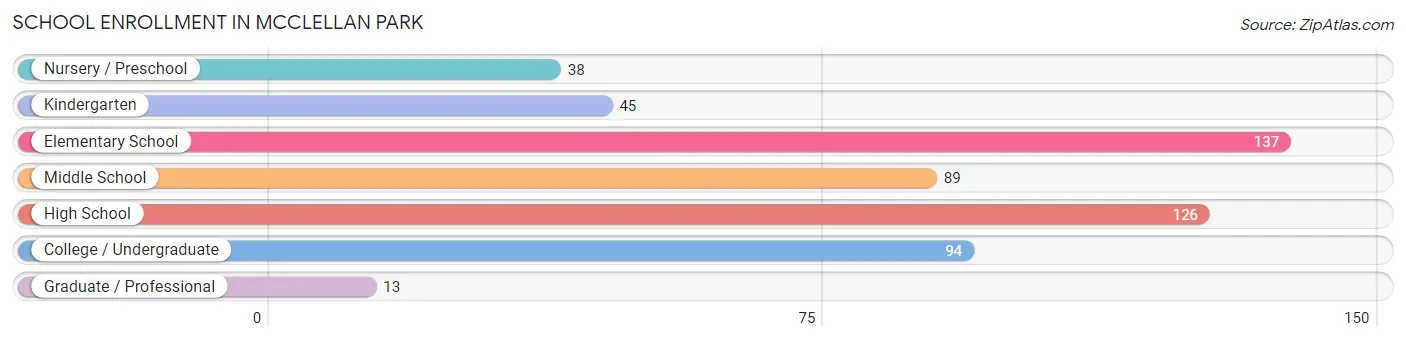
| School Level | # Students | % Students |
| Nursery / Preschool | 38 | 7.0% |
| Kindergarten | 45 | 8.3% |
| Elementary School | 137 | 25.3% |
| Middle School | 89 | 16.4% |
| High School | 126 | 23.3% |
| College / Undergraduate | 94 | 17.3% |
| Graduate / Professional | 13 | 2.4% |
| Total | 542 | 100.0% |
School Enrollment by Age by Funding Source in McClellan Park
Out of a total of 542 students who are enrolled in schools in McClellan Park, 60 (11.1%) attend a private institution, while the remaining 482 (88.9%) are enrolled in public schools. The age group of 25 to 34 year olds has the highest likelihood of being enrolled in private schools, with 9 (100.0% in the age bracket) enrolled. Conversely, the age group of 3 to 4 year olds has the lowest likelihood of being enrolled in a private school, with 33 (100.0% in the age bracket) attending a public institution.
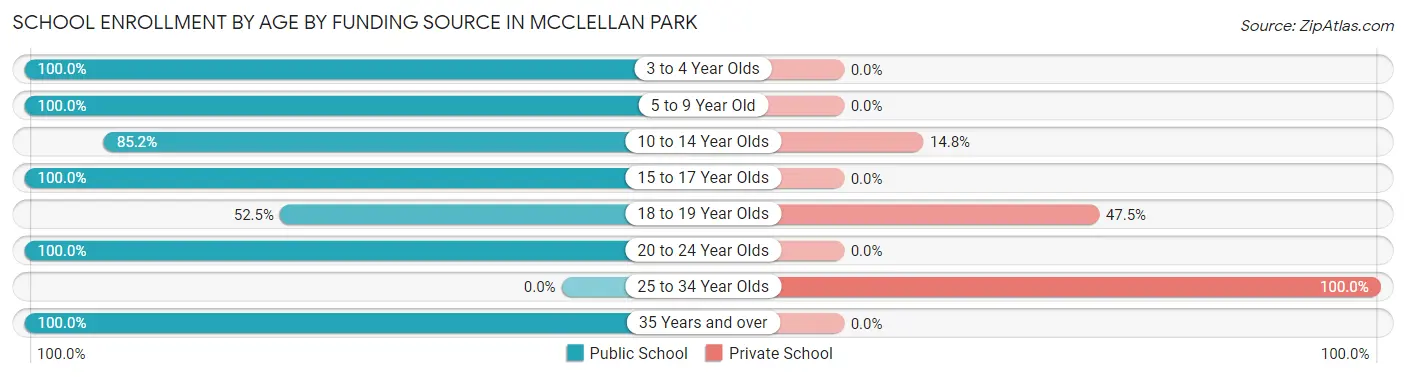
| Age Bracket | Public School | Private School |
| 3 to 4 Year Olds | 33 (100.0%) | 0 (0.0%) |
| 5 to 9 Year Old | 150 (100.0%) | 0 (0.0%) |
| 10 to 14 Year Olds | 127 (85.2%) | 22 (14.8%) |
| 15 to 17 Year Olds | 61 (100.0%) | 0 (0.0%) |
| 18 to 19 Year Olds | 32 (52.5%) | 29 (47.5%) |
| 20 to 24 Year Olds | 66 (100.0%) | 0 (0.0%) |
| 25 to 34 Year Olds | 0 (0.0%) | 9 (100.0%) |
| 35 Years and over | 13 (100.0%) | 0 (0.0%) |
| Total | 482 (88.9%) | 60 (11.1%) |
Educational Attainment by Field of Study in McClellan Park
Business (37 | 44.6%), psychology (21 | 25.3%), literature & languages (13 | 15.7%), and bio, nature & agricultural (12 | 14.5%) are the most common fields of study among 83 individuals in McClellan Park who have obtained a bachelor's degree or higher.
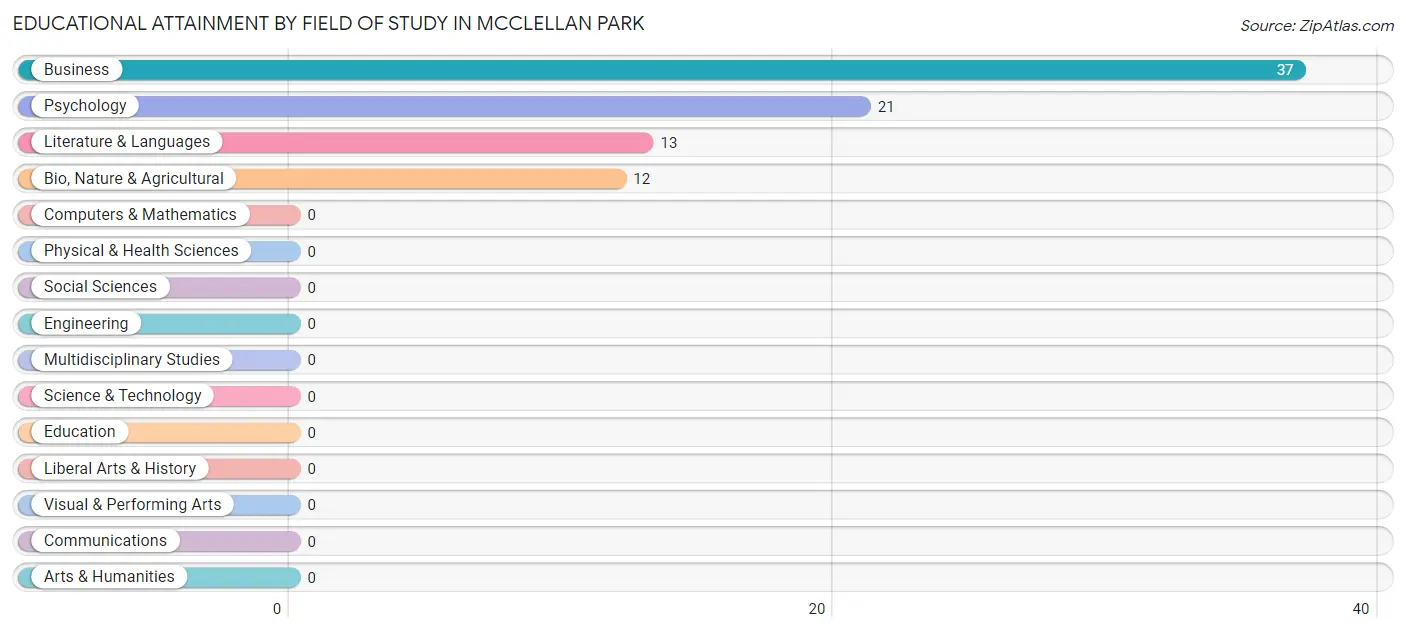
| Field of Study | # Graduates | % Graduates |
| Computers & Mathematics | 0 | 0.0% |
| Bio, Nature & Agricultural | 12 | 14.5% |
| Physical & Health Sciences | 0 | 0.0% |
| Psychology | 21 | 25.3% |
| Social Sciences | 0 | 0.0% |
| Engineering | 0 | 0.0% |
| Multidisciplinary Studies | 0 | 0.0% |
| Science & Technology | 0 | 0.0% |
| Business | 37 | 44.6% |
| Education | 0 | 0.0% |
| Literature & Languages | 13 | 15.7% |
| Liberal Arts & History | 0 | 0.0% |
| Visual & Performing Arts | 0 | 0.0% |
| Communications | 0 | 0.0% |
| Arts & Humanities | 0 | 0.0% |
| Total | 83 | 100.0% |
Transportation & Commute in McClellan Park
Vehicle Availability by Sex in McClellan Park
The most prevalent vehicle ownership categories in McClellan Park are males with 5 or more vehicles (66, accounting for 37.9%) and females with 5 or more vehicles (24, making up 28.9%).
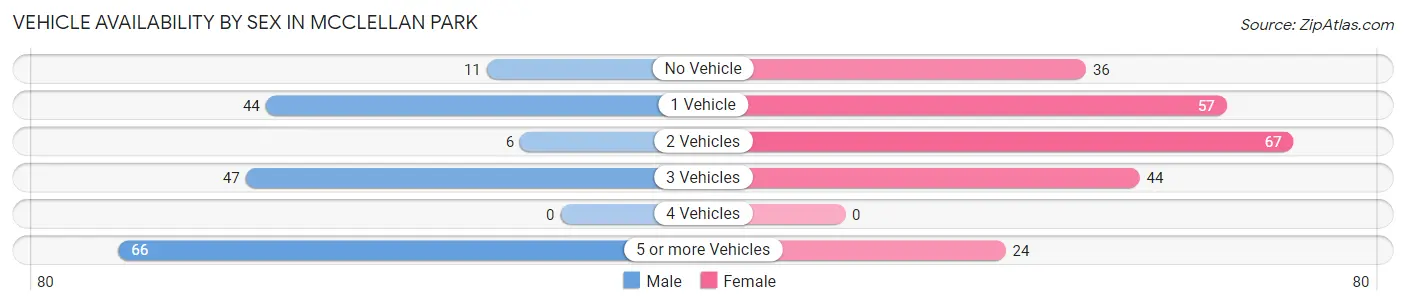
| Vehicles Available | Male | Female |
| No Vehicle | 11 (6.3%) | 36 (15.8%) |
| 1 Vehicle | 44 (25.3%) | 57 (25.0%) |
| 2 Vehicles | 6 (3.5%) | 67 (29.4%) |
| 3 Vehicles | 47 (27.0%) | 44 (19.3%) |
| 4 Vehicles | 0 (0.0%) | 0 (0.0%) |
| 5 or more Vehicles | 66 (37.9%) | 24 (10.5%) |
| Total | 174 (100.0%) | 228 (100.0%) |
Commute Time in McClellan Park
The most frequently occuring commute durations in McClellan Park are 30 to 34 minutes (103 commuters, 28.3%), 15 to 19 minutes (74 commuters, 20.3%), and 20 to 24 minutes (66 commuters, 18.1%).
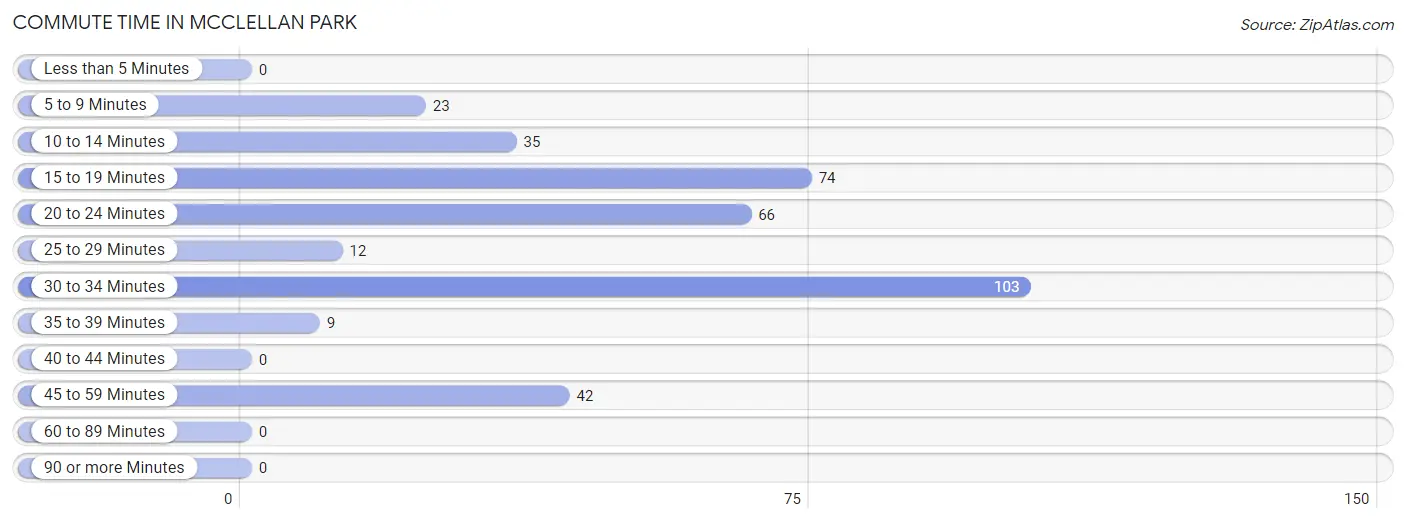
| Commute Time | # Commuters | % Commuters |
| Less than 5 Minutes | 0 | 0.0% |
| 5 to 9 Minutes | 23 | 6.3% |
| 10 to 14 Minutes | 35 | 9.6% |
| 15 to 19 Minutes | 74 | 20.3% |
| 20 to 24 Minutes | 66 | 18.1% |
| 25 to 29 Minutes | 12 | 3.3% |
| 30 to 34 Minutes | 103 | 28.3% |
| 35 to 39 Minutes | 9 | 2.5% |
| 40 to 44 Minutes | 0 | 0.0% |
| 45 to 59 Minutes | 42 | 11.5% |
| 60 to 89 Minutes | 0 | 0.0% |
| 90 or more Minutes | 0 | 0.0% |
Commute Time by Sex in McClellan Park
The most common commute times in McClellan Park are 30 to 34 minutes (57 commuters, 32.8%) for males and 15 to 19 minutes (55 commuters, 28.9%) for females.
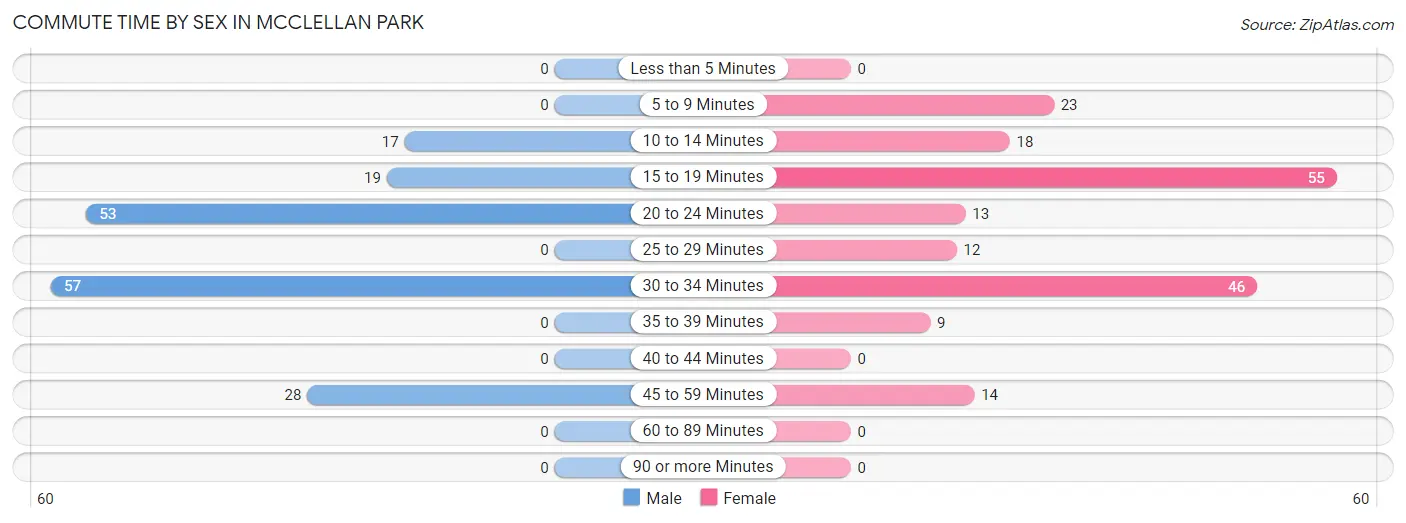
| Commute Time | Male | Female |
| Less than 5 Minutes | 0 (0.0%) | 0 (0.0%) |
| 5 to 9 Minutes | 0 (0.0%) | 23 (12.1%) |
| 10 to 14 Minutes | 17 (9.8%) | 18 (9.5%) |
| 15 to 19 Minutes | 19 (10.9%) | 55 (28.9%) |
| 20 to 24 Minutes | 53 (30.5%) | 13 (6.8%) |
| 25 to 29 Minutes | 0 (0.0%) | 12 (6.3%) |
| 30 to 34 Minutes | 57 (32.8%) | 46 (24.2%) |
| 35 to 39 Minutes | 0 (0.0%) | 9 (4.7%) |
| 40 to 44 Minutes | 0 (0.0%) | 0 (0.0%) |
| 45 to 59 Minutes | 28 (16.1%) | 14 (7.4%) |
| 60 to 89 Minutes | 0 (0.0%) | 0 (0.0%) |
| 90 or more Minutes | 0 (0.0%) | 0 (0.0%) |
Time of Departure to Work by Sex in McClellan Park
The most frequent times of departure to work in McClellan Park are 8:00 AM to 8:29 AM (66, 37.9%) for males and 8:00 AM to 8:29 AM (70, 36.8%) for females.
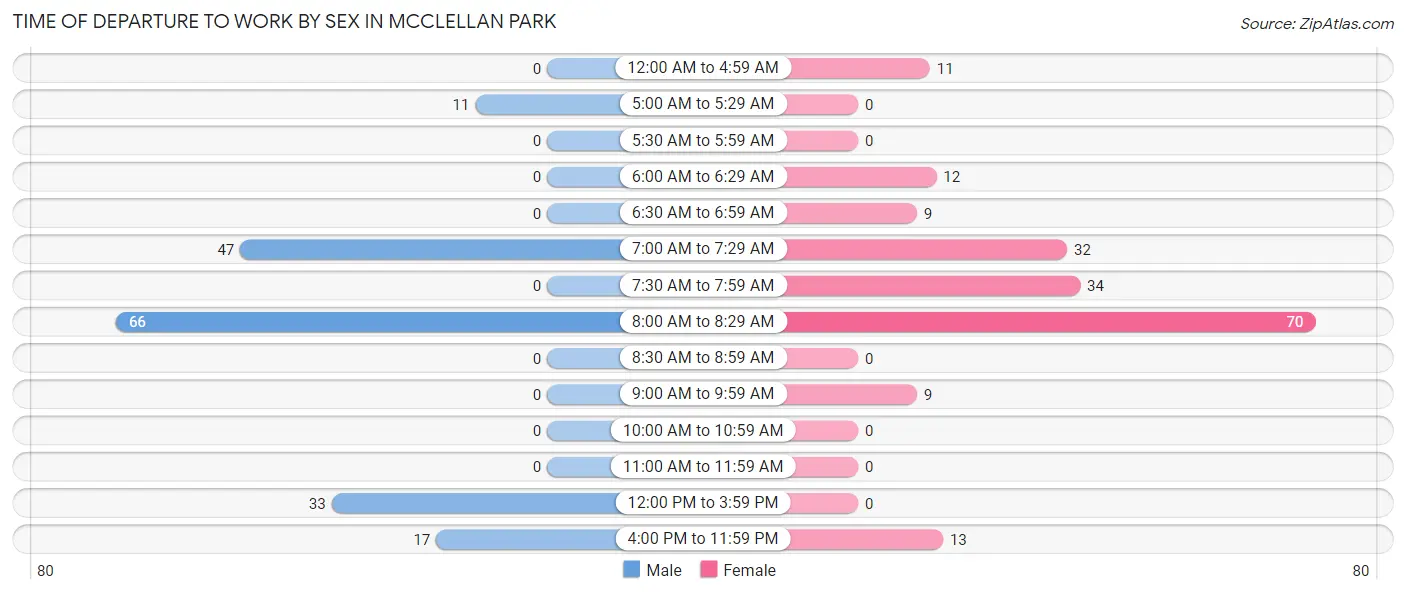
| Time of Departure | Male | Female |
| 12:00 AM to 4:59 AM | 0 (0.0%) | 11 (5.8%) |
| 5:00 AM to 5:29 AM | 11 (6.3%) | 0 (0.0%) |
| 5:30 AM to 5:59 AM | 0 (0.0%) | 0 (0.0%) |
| 6:00 AM to 6:29 AM | 0 (0.0%) | 12 (6.3%) |
| 6:30 AM to 6:59 AM | 0 (0.0%) | 9 (4.7%) |
| 7:00 AM to 7:29 AM | 47 (27.0%) | 32 (16.8%) |
| 7:30 AM to 7:59 AM | 0 (0.0%) | 34 (17.9%) |
| 8:00 AM to 8:29 AM | 66 (37.9%) | 70 (36.8%) |
| 8:30 AM to 8:59 AM | 0 (0.0%) | 0 (0.0%) |
| 9:00 AM to 9:59 AM | 0 (0.0%) | 9 (4.7%) |
| 10:00 AM to 10:59 AM | 0 (0.0%) | 0 (0.0%) |
| 11:00 AM to 11:59 AM | 0 (0.0%) | 0 (0.0%) |
| 12:00 PM to 3:59 PM | 33 (19.0%) | 0 (0.0%) |
| 4:00 PM to 11:59 PM | 17 (9.8%) | 13 (6.8%) |
| Total | 174 (100.0%) | 190 (100.0%) |
Housing Occupancy in McClellan Park
Occupancy by Ownership in McClellan Park
Of the total 345 dwellings in McClellan Park, owner-occupied units account for 0 (0.0%), while renter-occupied units make up 345 (100.0%).
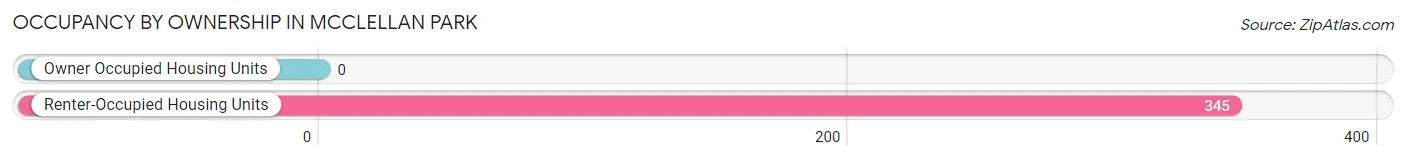
| Occupancy | # Housing Units | % Housing Units |
| Owner Occupied Housing Units | 0 | 0.0% |
| Renter-Occupied Housing Units | 345 | 100.0% |
| Total Occupied Housing Units | 345 | 100.0% |
Occupancy by Household Size in McClellan Park
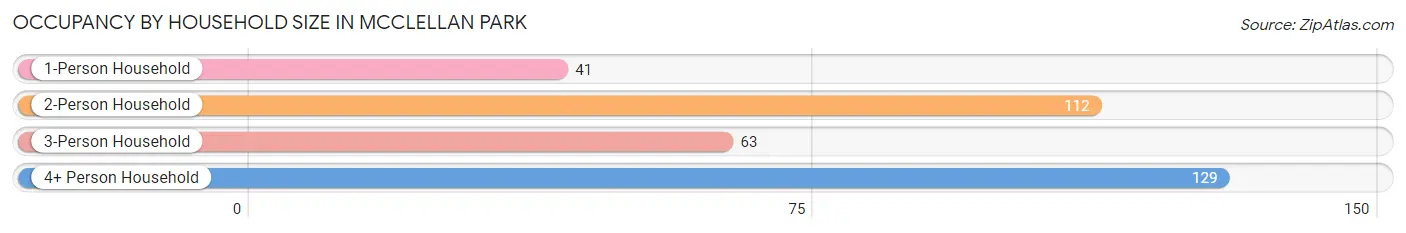
| Household Size | # Housing Units | % Housing Units |
| 1-Person Household | 41 | 11.9% |
| 2-Person Household | 112 | 32.5% |
| 3-Person Household | 63 | 18.3% |
| 4+ Person Household | 129 | 37.4% |
| Total Housing Units | 345 | 100.0% |
Occupancy by Ownership by Household Size in McClellan Park
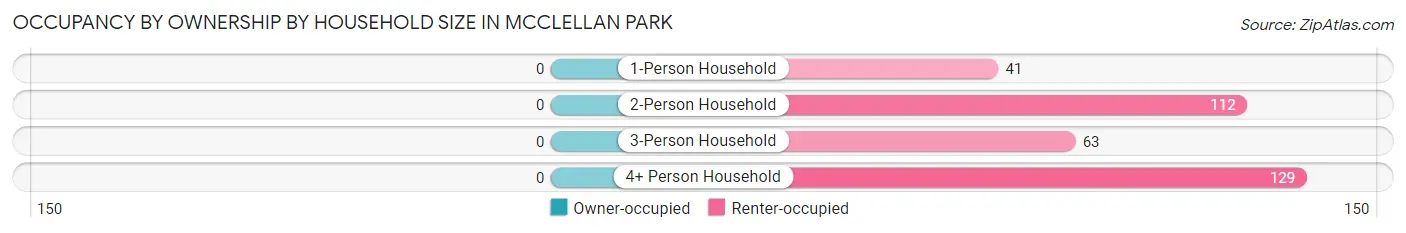
| Household Size | Owner-occupied | Renter-occupied |
| 1-Person Household | 0 (0.0%) | 41 (100.0%) |
| 2-Person Household | 0 (0.0%) | 112 (100.0%) |
| 3-Person Household | 0 (0.0%) | 63 (100.0%) |
| 4+ Person Household | 0 (0.0%) | 129 (100.0%) |
| Total Housing Units | 0 (0.0%) | 345 (100.0%) |
Occupancy by Educational Attainment in McClellan Park
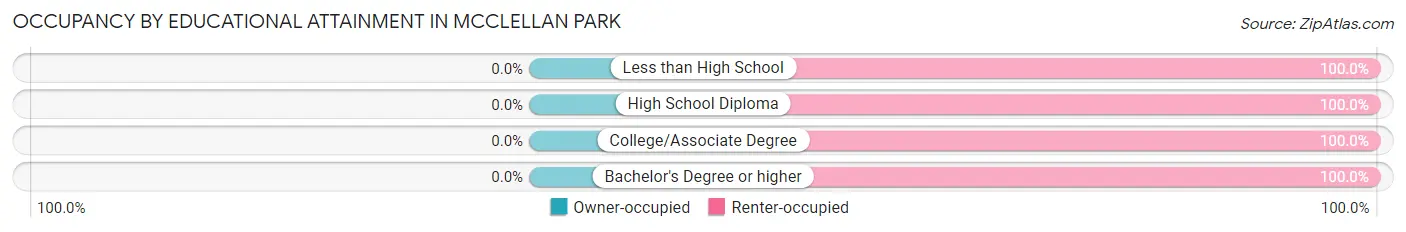
| Household Size | Owner-occupied | Renter-occupied |
| Less than High School | 0 (0.0%) | 55 (100.0%) |
| High School Diploma | 0 (0.0%) | 46 (100.0%) |
| College/Associate Degree | 0 (0.0%) | 154 (100.0%) |
| Bachelor's Degree or higher | 0 (0.0%) | 90 (100.0%) |
Occupancy by Age of Householder in McClellan Park
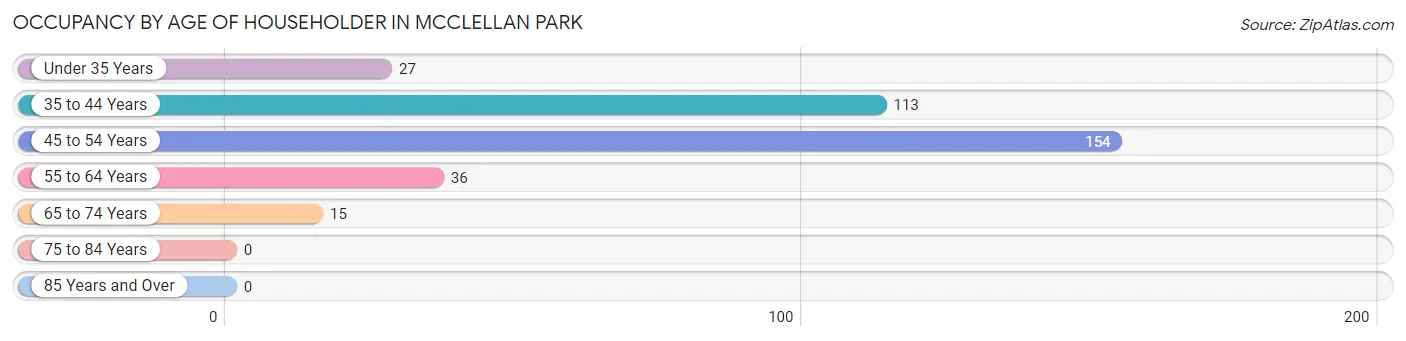
| Age Bracket | # Households | % Households |
| Under 35 Years | 27 | 7.8% |
| 35 to 44 Years | 113 | 32.8% |
| 45 to 54 Years | 154 | 44.6% |
| 55 to 64 Years | 36 | 10.4% |
| 65 to 74 Years | 15 | 4.3% |
| 75 to 84 Years | 0 | 0.0% |
| 85 Years and Over | 0 | 0.0% |
| Total | 345 | 100.0% |
Housing Finances in McClellan Park
Median Income by Occupancy in McClellan Park
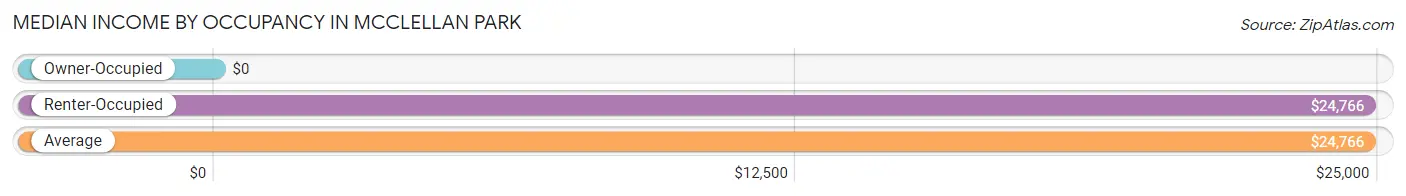
| Occupancy Type | # Households | Median Income |
| Owner-Occupied | 0 (0.0%) | $0 |
| Renter-Occupied | 345 (100.0%) | $24,766 |
| Average | 345 (100.0%) | $24,766 |
Occupancy by Householder Income Bracket in McClellan Park
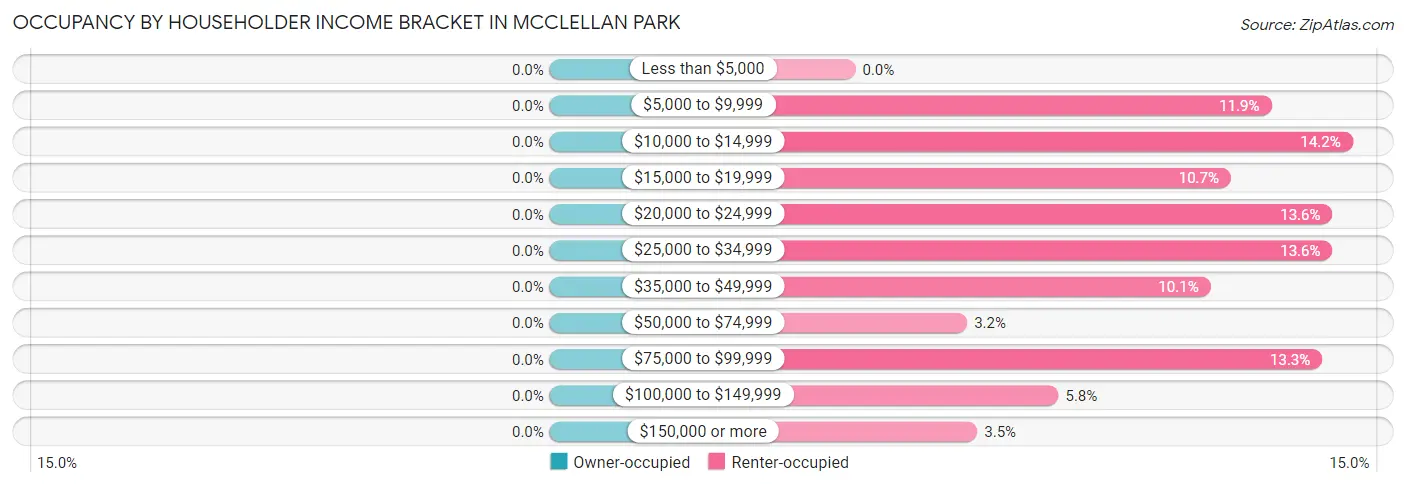
| Income Bracket | Owner-occupied | Renter-occupied |
| Less than $5,000 | 0 (0.0%) | 0 (0.0%) |
| $5,000 to $9,999 | 0 (0.0%) | 41 (11.9%) |
| $10,000 to $14,999 | 0 (0.0%) | 49 (14.2%) |
| $15,000 to $19,999 | 0 (0.0%) | 37 (10.7%) |
| $20,000 to $24,999 | 0 (0.0%) | 47 (13.6%) |
| $25,000 to $34,999 | 0 (0.0%) | 47 (13.6%) |
| $35,000 to $49,999 | 0 (0.0%) | 35 (10.1%) |
| $50,000 to $74,999 | 0 (0.0%) | 11 (3.2%) |
| $75,000 to $99,999 | 0 (0.0%) | 46 (13.3%) |
| $100,000 to $149,999 | 0 (0.0%) | 20 (5.8%) |
| $150,000 or more | 0 (0.0%) | 12 (3.5%) |
| Total | 0 (0.0%) | 345 (100.0%) |
Monthly Housing Cost Tiers in McClellan Park
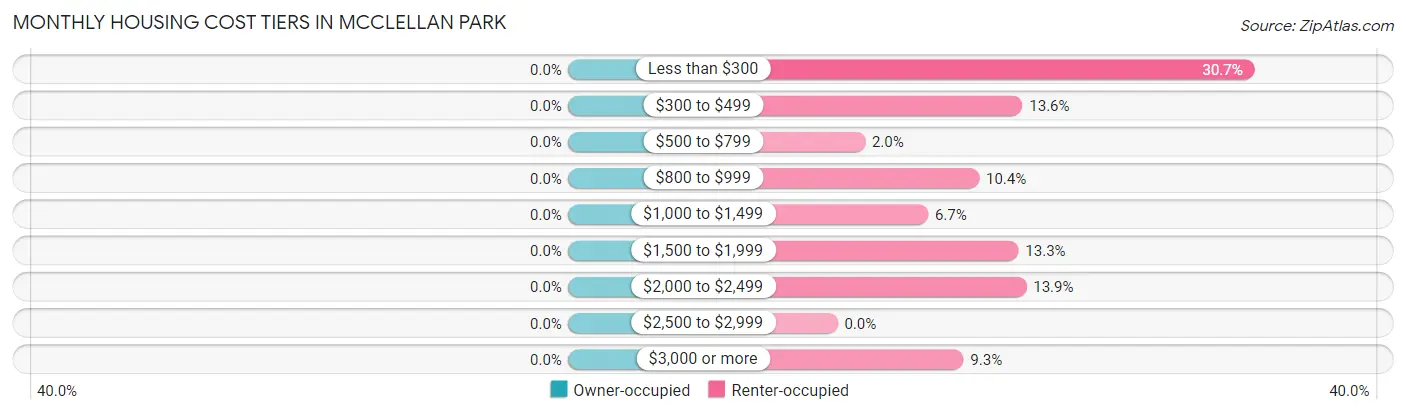
| Monthly Cost | Owner-occupied | Renter-occupied |
| Less than $300 | 0 (0.0%) | 106 (30.7%) |
| $300 to $499 | 0 (0.0%) | 47 (13.6%) |
| $500 to $799 | 0 (0.0%) | 7 (2.0%) |
| $800 to $999 | 0 (0.0%) | 36 (10.4%) |
| $1,000 to $1,499 | 0 (0.0%) | 23 (6.7%) |
| $1,500 to $1,999 | 0 (0.0%) | 46 (13.3%) |
| $2,000 to $2,499 | 0 (0.0%) | 48 (13.9%) |
| $2,500 to $2,999 | 0 (0.0%) | 0 (0.0%) |
| $3,000 or more | 0 (0.0%) | 32 (9.3%) |
| Total | 0 (0.0%) | 345 (100.0%) |
Physical Housing Characteristics in McClellan Park
Housing Structures in McClellan Park
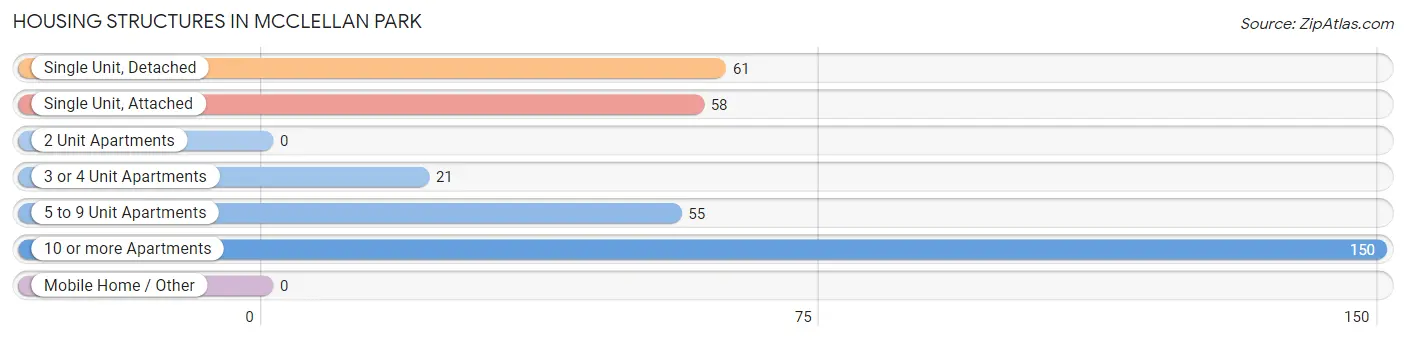
| Structure Type | # Housing Units | % Housing Units |
| Single Unit, Detached | 61 | 17.7% |
| Single Unit, Attached | 58 | 16.8% |
| 2 Unit Apartments | 0 | 0.0% |
| 3 or 4 Unit Apartments | 21 | 6.1% |
| 5 to 9 Unit Apartments | 55 | 15.9% |
| 10 or more Apartments | 150 | 43.5% |
| Mobile Home / Other | 0 | 0.0% |
| Total | 345 | 100.0% |
Housing Structures by Occupancy in McClellan Park
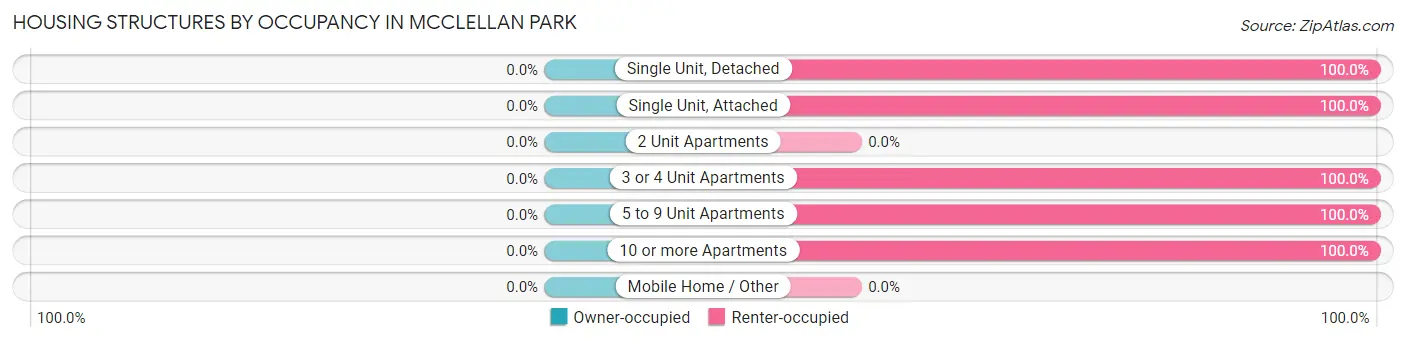
| Structure Type | Owner-occupied | Renter-occupied |
| Single Unit, Detached | 0 (0.0%) | 61 (100.0%) |
| Single Unit, Attached | 0 (0.0%) | 58 (100.0%) |
| 2 Unit Apartments | 0 (0.0%) | 0 (0.0%) |
| 3 or 4 Unit Apartments | 0 (0.0%) | 21 (100.0%) |
| 5 to 9 Unit Apartments | 0 (0.0%) | 55 (100.0%) |
| 10 or more Apartments | 0 (0.0%) | 150 (100.0%) |
| Mobile Home / Other | 0 (0.0%) | 0 (0.0%) |
| Total | 0 (0.0%) | 345 (100.0%) |
Housing Structures by Number of Rooms in McClellan Park
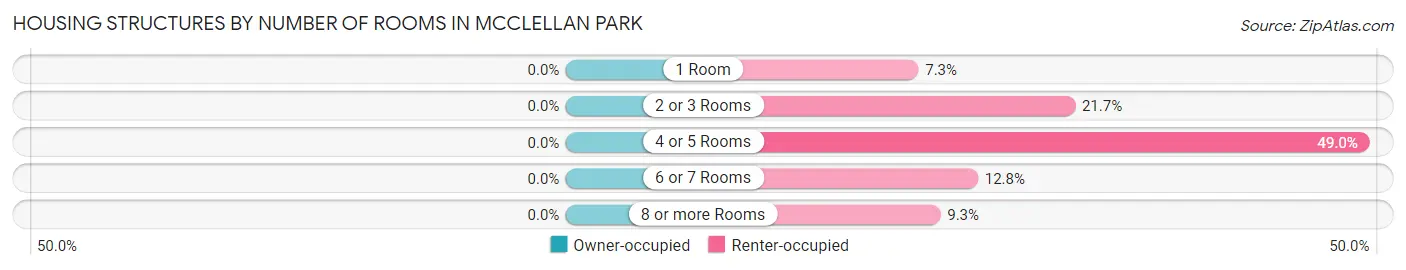
| Number of Rooms | Owner-occupied | Renter-occupied |
| 1 Room | 0 (0.0%) | 25 (7.2%) |
| 2 or 3 Rooms | 0 (0.0%) | 75 (21.7%) |
| 4 or 5 Rooms | 0 (0.0%) | 169 (49.0%) |
| 6 or 7 Rooms | 0 (0.0%) | 44 (12.8%) |
| 8 or more Rooms | 0 (0.0%) | 32 (9.3%) |
| Total | 0 (0.0%) | 345 (100.0%) |
Housing Structure by Heating Type in McClellan Park
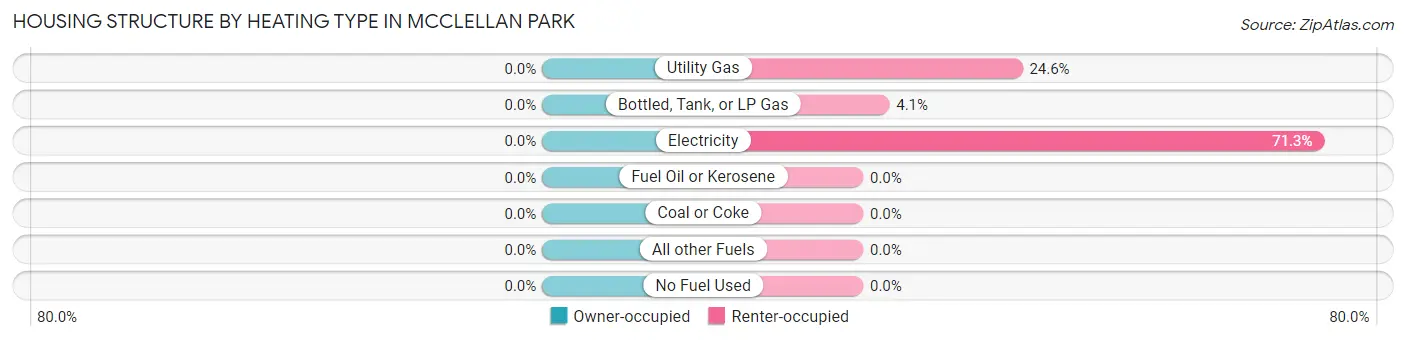
| Heating Type | Owner-occupied | Renter-occupied |
| Utility Gas | 0 (0.0%) | 85 (24.6%) |
| Bottled, Tank, or LP Gas | 0 (0.0%) | 14 (4.1%) |
| Electricity | 0 (0.0%) | 246 (71.3%) |
| Fuel Oil or Kerosene | 0 (0.0%) | 0 (0.0%) |
| Coal or Coke | 0 (0.0%) | 0 (0.0%) |
| All other Fuels | 0 (0.0%) | 0 (0.0%) |
| No Fuel Used | 0 (0.0%) | 0 (0.0%) |
| Total | 0 (0.0%) | 345 (100.0%) |
Household Vehicle Usage in McClellan Park
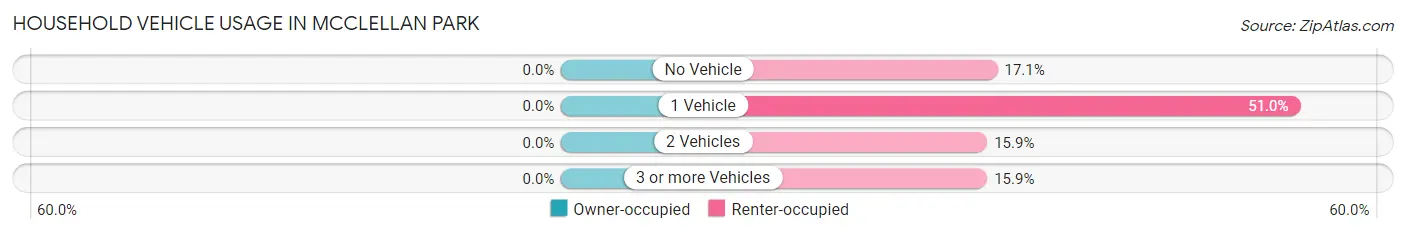
| Vehicles per Household | Owner-occupied | Renter-occupied |
| No Vehicle | 0 (0.0%) | 59 (17.1%) |
| 1 Vehicle | 0 (0.0%) | 176 (51.0%) |
| 2 Vehicles | 0 (0.0%) | 55 (15.9%) |
| 3 or more Vehicles | 0 (0.0%) | 55 (15.9%) |
| Total | 0 (0.0%) | 345 (100.0%) |
Real Estate & Mortgages in McClellan Park
Real Estate and Mortgage Overview in McClellan Park
| Characteristic | Without Mortgage | With Mortgage |
| Housing Units | 0 | 0 |
| Median Property Value | - | - |
| Median Household Income | - | - |
| Monthly Housing Costs | - | - |
| Real Estate Taxes | - | - |
Property Value by Mortgage Status in McClellan Park
| Property Value | Without Mortgage | With Mortgage |
| Less than $50,000 | 0 (0.0%) | 0 (0.0%) |
| $50,000 to $99,999 | 0 (0.0%) | 0 (0.0%) |
| $100,000 to $299,999 | 0 (0.0%) | 0 (0.0%) |
| $300,000 to $499,999 | 0 (0.0%) | 0 (0.0%) |
| $500,000 to $749,999 | 0 (0.0%) | 0 (0.0%) |
| $750,000 to $999,999 | 0 (0.0%) | 0 (0.0%) |
| $1,000,000 or more | 0 (0.0%) | 0 (0.0%) |
| Total | 0 (0.0%) | 0 (0.0%) |
Household Income by Mortgage Status in McClellan Park
| Household Income | Without Mortgage | With Mortgage |
| Less than $10,000 | 0 (0.0%) | 0 (0.0%) |
| $10,000 to $24,999 | 0 (0.0%) | 0 (0.0%) |
| $25,000 to $34,999 | 0 (0.0%) | 0 (0.0%) |
| $35,000 to $49,999 | 0 (0.0%) | 0 (0.0%) |
| $50,000 to $74,999 | 0 (0.0%) | 0 (0.0%) |
| $75,000 to $99,999 | 0 (0.0%) | 0 (0.0%) |
| $100,000 to $149,999 | 0 (0.0%) | 0 (0.0%) |
| $150,000 or more | 0 (0.0%) | 0 (0.0%) |
| Total | 0 (0.0%) | 0 (0.0%) |
Property Value to Household Income Ratio in McClellan Park
| Value-to-Income Ratio | Without Mortgage | With Mortgage |
| Less than 2.0x | 0 (0.0%) | 0 (0.0%) |
| 2.0x to 2.9x | 0 (0.0%) | 0 (0.0%) |
| 3.0x to 3.9x | 0 (0.0%) | 0 (0.0%) |
| 4.0x or more | 0 (0.0%) | 0 (0.0%) |
| Total | 0 (0.0%) | 0 (0.0%) |
Real Estate Taxes by Mortgage Status in McClellan Park
| Property Taxes | Without Mortgage | With Mortgage |
| Less than $800 | 0 (0.0%) | 0 (0.0%) |
| $800 to $1,499 | 0 (0.0%) | 0 (0.0%) |
| $800 to $1,499 | 0 (0.0%) | 0 (0.0%) |
| Total | 0 (0.0%) | 0 (0.0%) |
Health & Disability in McClellan Park
Health Insurance Coverage by Age in McClellan Park
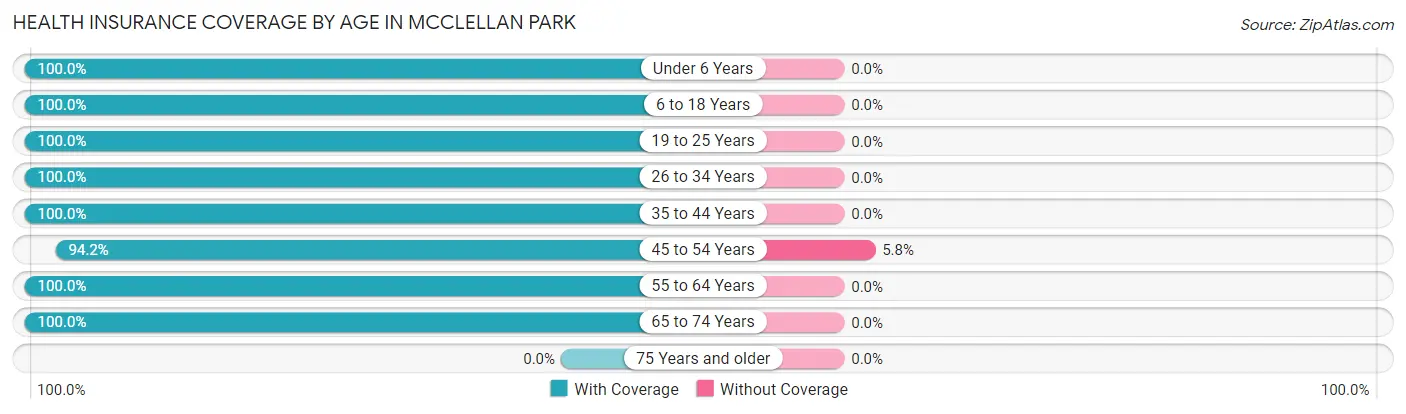
| Age Bracket | With Coverage | Without Coverage |
| Under 6 Years | 109 (100.0%) | 0 (0.0%) |
| 6 to 18 Years | 364 (100.0%) | 0 (0.0%) |
| 19 to 25 Years | 201 (100.0%) | 0 (0.0%) |
| 26 to 34 Years | 66 (100.0%) | 0 (0.0%) |
| 35 to 44 Years | 153 (100.0%) | 0 (0.0%) |
| 45 to 54 Years | 180 (94.2%) | 11 (5.8%) |
| 55 to 64 Years | 71 (100.0%) | 0 (0.0%) |
| 65 to 74 Years | 27 (100.0%) | 0 (0.0%) |
| 75 Years and older | 0 (0.0%) | 0 (0.0%) |
| Total | 1,171 (99.1%) | 11 (0.9%) |
Health Insurance Coverage by Citizenship Status in McClellan Park
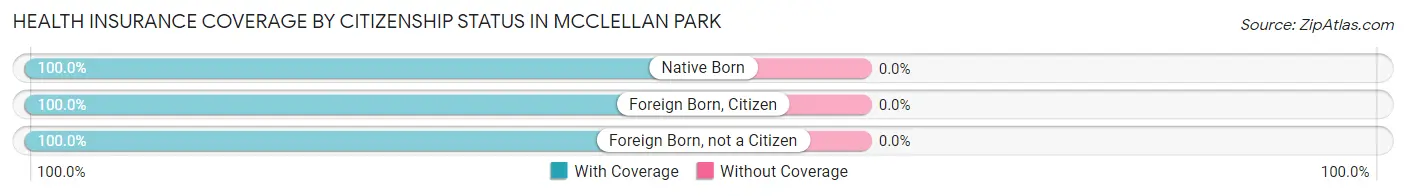
| Citizenship Status | With Coverage | Without Coverage |
| Native Born | 109 (100.0%) | 0 (0.0%) |
| Foreign Born, Citizen | 364 (100.0%) | 0 (0.0%) |
| Foreign Born, not a Citizen | 201 (100.0%) | 0 (0.0%) |
Health Insurance Coverage by Household Income in McClellan Park
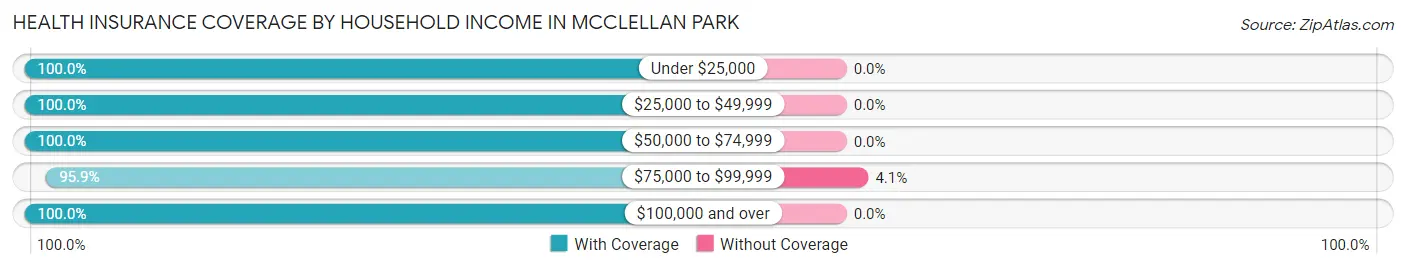
| Household Income | With Coverage | Without Coverage |
| Under $25,000 | 469 (100.0%) | 0 (0.0%) |
| $25,000 to $49,999 | 263 (100.0%) | 0 (0.0%) |
| $50,000 to $74,999 | 21 (100.0%) | 0 (0.0%) |
| $75,000 to $99,999 | 260 (95.9%) | 11 (4.1%) |
| $100,000 and over | 130 (100.0%) | 0 (0.0%) |
Public vs Private Health Insurance Coverage by Age in McClellan Park
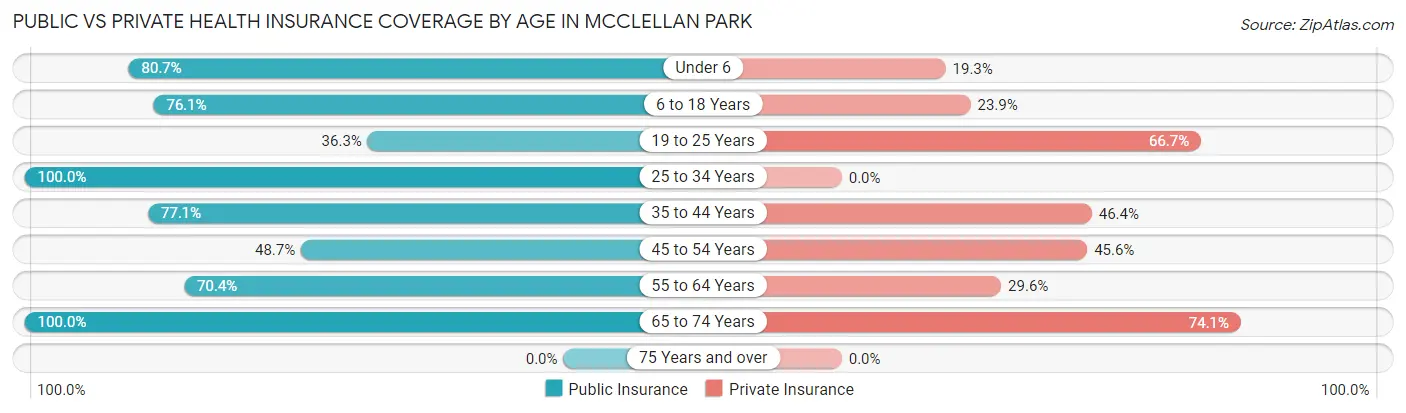
| Age Bracket | Public Insurance | Private Insurance |
| Under 6 | 88 (80.7%) | 21 (19.3%) |
| 6 to 18 Years | 277 (76.1%) | 87 (23.9%) |
| 19 to 25 Years | 73 (36.3%) | 134 (66.7%) |
| 25 to 34 Years | 66 (100.0%) | 0 (0.0%) |
| 35 to 44 Years | 118 (77.1%) | 71 (46.4%) |
| 45 to 54 Years | 93 (48.7%) | 87 (45.6%) |
| 55 to 64 Years | 50 (70.4%) | 21 (29.6%) |
| 65 to 74 Years | 27 (100.0%) | 20 (74.1%) |
| 75 Years and over | 0 (0.0%) | 0 (0.0%) |
| Total | 792 (67.0%) | 441 (37.3%) |
Disability Status by Sex by Age in McClellan Park
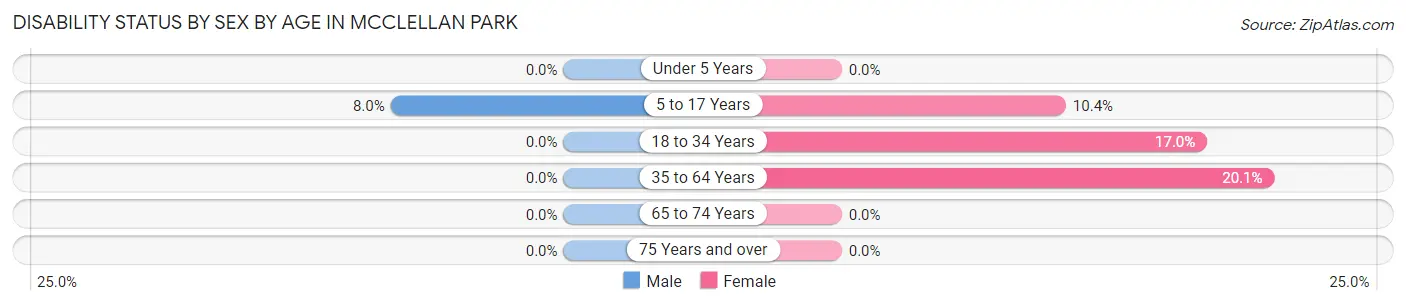
| Age Bracket | Male | Female |
| Under 5 Years | 0 (0.0%) | 0 (0.0%) |
| 5 to 17 Years | 15 (8.0%) | 18 (10.4%) |
| 18 to 34 Years | 0 (0.0%) | 20 (17.0%) |
| 35 to 64 Years | 0 (0.0%) | 59 (20.1%) |
| 65 to 74 Years | 0 (0.0%) | 0 (0.0%) |
| 75 Years and over | 0 (0.0%) | 0 (0.0%) |
Disability Class by Sex by Age in McClellan Park
Disability Class: Hearing Difficulty
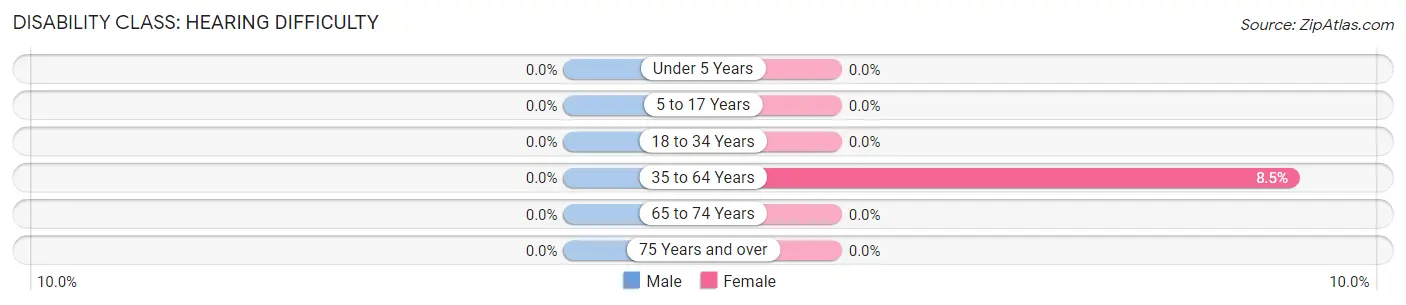
| Age Bracket | Male | Female |
| Under 5 Years | 0 (0.0%) | 0 (0.0%) |
| 5 to 17 Years | 0 (0.0%) | 0 (0.0%) |
| 18 to 34 Years | 0 (0.0%) | 0 (0.0%) |
| 35 to 64 Years | 0 (0.0%) | 25 (8.5%) |
| 65 to 74 Years | 0 (0.0%) | 0 (0.0%) |
| 75 Years and over | 0 (0.0%) | 0 (0.0%) |
Disability Class: Vision Difficulty
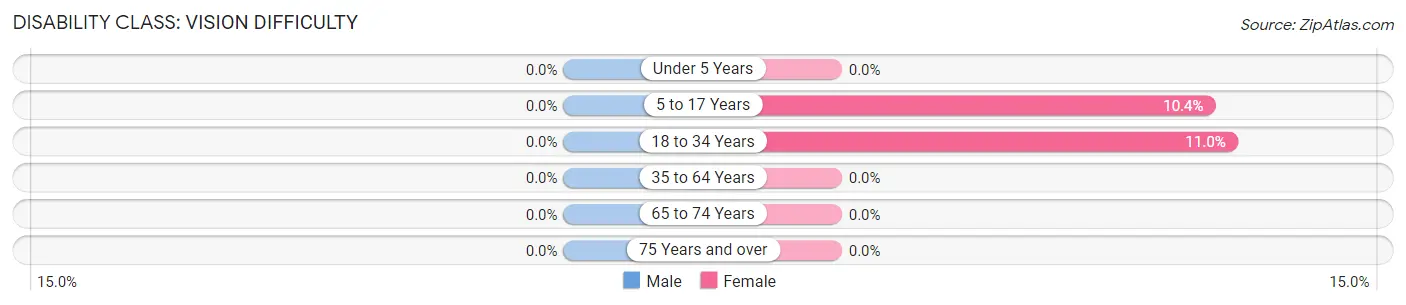
| Age Bracket | Male | Female |
| Under 5 Years | 0 (0.0%) | 0 (0.0%) |
| 5 to 17 Years | 0 (0.0%) | 18 (10.4%) |
| 18 to 34 Years | 0 (0.0%) | 13 (11.0%) |
| 35 to 64 Years | 0 (0.0%) | 0 (0.0%) |
| 65 to 74 Years | 0 (0.0%) | 0 (0.0%) |
| 75 Years and over | 0 (0.0%) | 0 (0.0%) |
Disability Class: Cognitive Difficulty
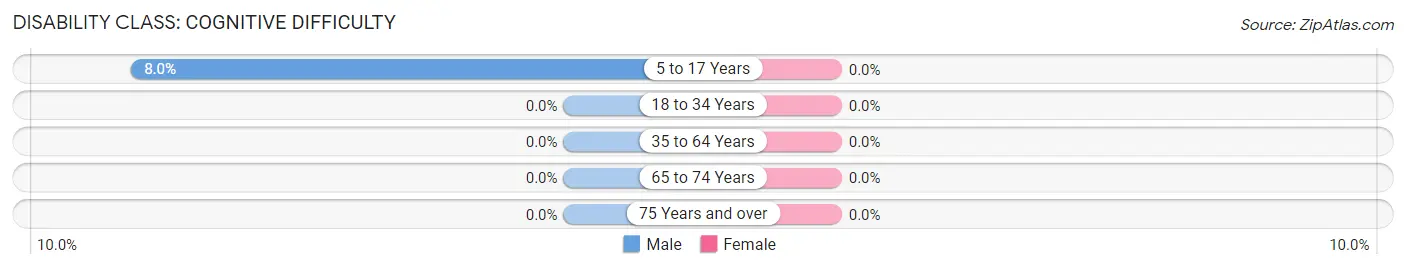
| Age Bracket | Male | Female |
| 5 to 17 Years | 15 (8.0%) | 0 (0.0%) |
| 18 to 34 Years | 0 (0.0%) | 0 (0.0%) |
| 35 to 64 Years | 0 (0.0%) | 0 (0.0%) |
| 65 to 74 Years | 0 (0.0%) | 0 (0.0%) |
| 75 Years and over | 0 (0.0%) | 0 (0.0%) |
Disability Class: Ambulatory Difficulty
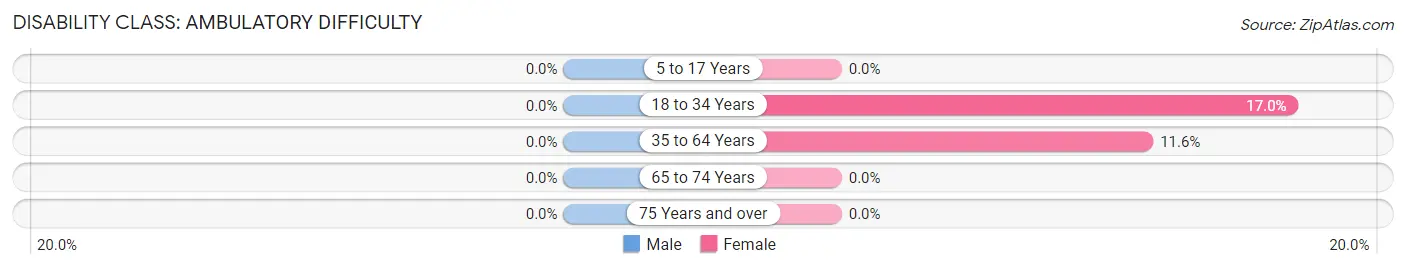
| Age Bracket | Male | Female |
| 5 to 17 Years | 0 (0.0%) | 0 (0.0%) |
| 18 to 34 Years | 0 (0.0%) | 20 (17.0%) |
| 35 to 64 Years | 0 (0.0%) | 34 (11.6%) |
| 65 to 74 Years | 0 (0.0%) | 0 (0.0%) |
| 75 Years and over | 0 (0.0%) | 0 (0.0%) |
Disability Class: Self-Care Difficulty
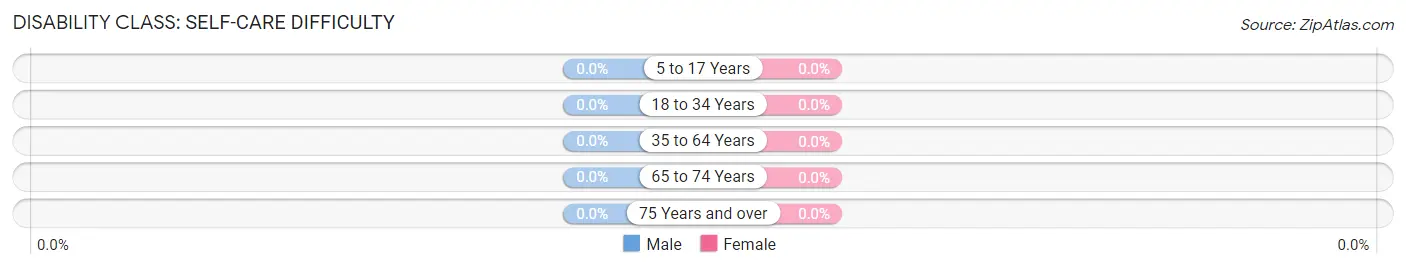
| Age Bracket | Male | Female |
| 5 to 17 Years | 0 (0.0%) | 0 (0.0%) |
| 18 to 34 Years | 0 (0.0%) | 0 (0.0%) |
| 35 to 64 Years | 0 (0.0%) | 0 (0.0%) |
| 65 to 74 Years | 0 (0.0%) | 0 (0.0%) |
| 75 Years and over | 0 (0.0%) | 0 (0.0%) |
Technology Access in McClellan Park
Computing Device Access in McClellan Park
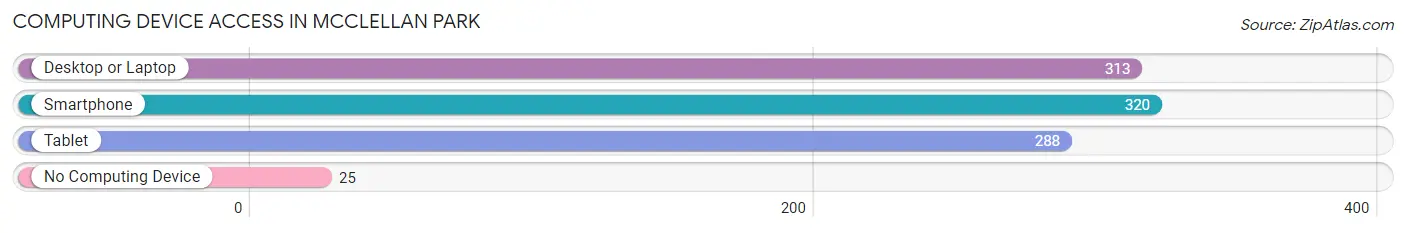
| Device Type | # Households | % Households |
| Desktop or Laptop | 313 | 90.7% |
| Smartphone | 320 | 92.7% |
| Tablet | 288 | 83.5% |
| No Computing Device | 25 | 7.2% |
| Total | 345 | 100.0% |
Internet Access in McClellan Park
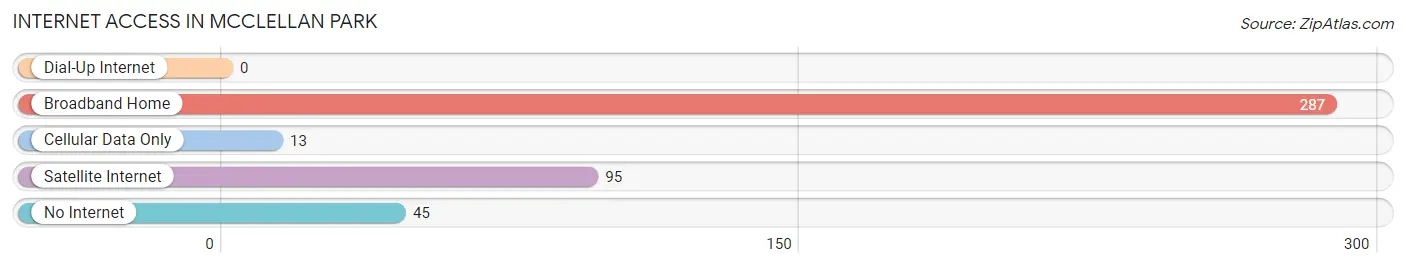
| Internet Type | # Households | % Households |
| Dial-Up Internet | 0 | 0.0% |
| Broadband Home | 287 | 83.2% |
| Cellular Data Only | 13 | 3.8% |
| Satellite Internet | 95 | 27.5% |
| No Internet | 45 | 13.0% |
| Total | 345 | 100.0% |
McClellan Park Summary
Mcclellan Park is a census-designated place (CDP) located in Sacramento County, California. It is located approximately 10 miles northeast of downtown Sacramento and is part of the Sacramento–Arden-Arcade–Roseville Metropolitan Statistical Area. The population was 2,945 at the 2010 census.
History
Mcclellan Park was originally part of the Rancho Del Paso Mexican land grant. The area was first settled in the 1850s by the Mcclellan family, who established a large ranch in the area. The Mcclellan family was one of the first settlers in the area and their ranch was one of the largest in the region. The Mcclellan family was also instrumental in the development of the area, helping to build roads, schools, and other infrastructure.
In the early 1900s, the Mcclellan family sold the ranch to the United States Army, which established the McClellan Air Force Base in 1935. The base was used as a training facility for the United States Air Force and was home to the Air Force Logistics Command until its closure in 2001.
Geography
Mcclellan Park is located at 38°41'17" North, 121°20'45" West (38.688, -121.346). It is situated in the Sacramento Valley, approximately 10 miles northeast of downtown Sacramento. The CDP has a total area of 2.3 square miles, all of which is land.
Economy
Mcclellan Park is primarily a residential community, with most of its residents employed in the nearby cities of Sacramento and Roseville. The former McClellan Air Force Base is now home to the McClellan Business Park, which is home to a variety of businesses, including a number of technology companies. The business park also houses the McClellan Conference Center, which hosts a variety of events, including conferences, trade shows, and conventions.
Demographics
As of the 2010 census, there were 2,945 people, 1,093 households, and 745 families residing in the CDP. The population density was 1,279.3 people per square mile. The racial makeup of the CDP was 68.2% White, 11.2% African American, 0.7% Native American, 8.2% Asian, 0.2% Pacific Islander, 6.3% from other races, and 5.4% from two or more races. Hispanic or Latino of any race were 15.2% of the population.
The median income for a household in the CDP was $50,938, and the median income for a family was $60,938. Males had a median income of $45,000 versus $35,000 for females. The per capita income for the CDP was $25,938. About 6.2% of families and 8.2% of the population were below the poverty line, including 11.2% of those under age 18 and 4.2% of those age 65 or over.
Common Questions
What is Per Capita Income in McClellan Park?
Per Capita income in McClellan Park is $13,154.
What is the Median Family Income in McClellan Park?
Median Family Income in McClellan Park is $31,979.
What is the Median Household income in McClellan Park?
Median Household Income in McClellan Park is $24,766.
What is Inequality or Gini Index in McClellan Park?
Inequality or Gini Index in McClellan Park is 0.48.
What is the Total Population of McClellan Park?
Total Population of McClellan Park is 1,193.
What is the Total Male Population of McClellan Park?
Total Male Population of McClellan Park is 560.
What is the Total Female Population of McClellan Park?
Total Female Population of McClellan Park is 633.
What is the Ratio of Males per 100 Females in McClellan Park?
There are 88.47 Males per 100 Females in McClellan Park.
What is the Ratio of Females per 100 Males in McClellan Park?
There are 113.04 Females per 100 Males in McClellan Park.
What is the Median Population Age in McClellan Park?
Median Population Age in McClellan Park is 20.9 Years.
What is the Average Family Size in McClellan Park
Average Family Size in McClellan Park is 3.6 People.
What is the Average Household Size in McClellan Park
Average Household Size in McClellan Park is 3.4 People.
How Large is the Labor Force in McClellan Park?
There are 465 People in the Labor Forcein in McClellan Park.
What is the Percentage of People in the Labor Force in McClellan Park?
58.1% of People are in the Labor Force in McClellan Park.
What is the Unemployment Rate in McClellan Park?
Unemployment Rate in McClellan Park is 2.9%.