Auberry, CA Map & Demographics
Auberry Map
Auberry Overview
$35,547
PER CAPITA INCOME
$73,220
AVG FAMILY INCOME
$68,320
AVG HOUSEHOLD INCOME
8.9%
WAGE / INCOME GAP [ % ]
91.1¢/ $1
WAGE / INCOME GAP [ $ ]
$5,486
FAMILY INCOME DEFICIT
0.44
INEQUALITY / GINI INDEX
3,032
TOTAL POPULATION
1,629
MALE POPULATION
1,403
FEMALE POPULATION
116.11
MALES / 100 FEMALES
86.13
FEMALES / 100 MALES
48.4
MEDIAN AGE
3.0
AVG FAMILY SIZE
2.7
AVG HOUSEHOLD SIZE
1,353
LABOR FORCE [ PEOPLE ]
52.2%
PERCENT IN LABOR FORCE
6.7%
UNEMPLOYMENT RATE
Auberry Zip Codes
Auberry Area Codes
Income in Auberry
Income Overview in Auberry
Per Capita Income in Auberry is $35,547, while median incomes of families and households are $73,220 and $68,320 respectively.
| Characteristic | Number | Measure |
| Per Capita Income | 3,032 | $35,547 |
| Median Family Income | 886 | $73,220 |
| Mean Family Income | 886 | $101,044 |
| Median Household Income | 1,137 | $68,320 |
| Mean Household Income | 1,137 | $91,873 |
| Income Deficit | 886 | $5,486 |
| Wage / Income Gap (%) | 3,032 | 8.87% |
| Wage / Income Gap ($) | 3,032 | 91.13¢ per $1 |
| Gini / Inequality Index | 3,032 | 0.44 |
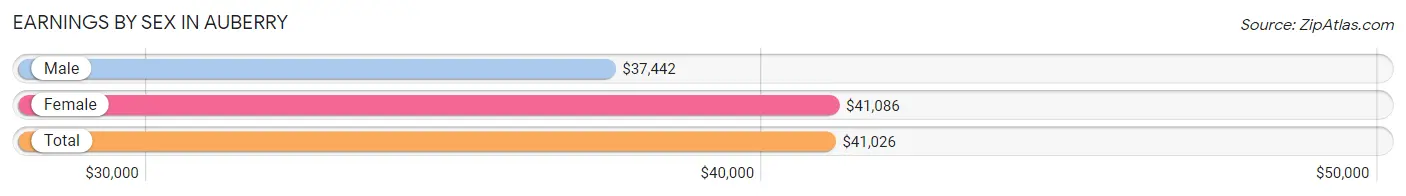
Earnings by Sex in Auberry
Average Earnings in Auberry are $41,026, $37,442 for men and $41,086 for women, a difference of 8.9%.
| Sex | Number | Average Earnings |
| Male | 794 (56.6%) | $37,442 |
| Female | 609 (43.4%) | $41,086 |
| Total | 1,403 (100.0%) | $41,026 |
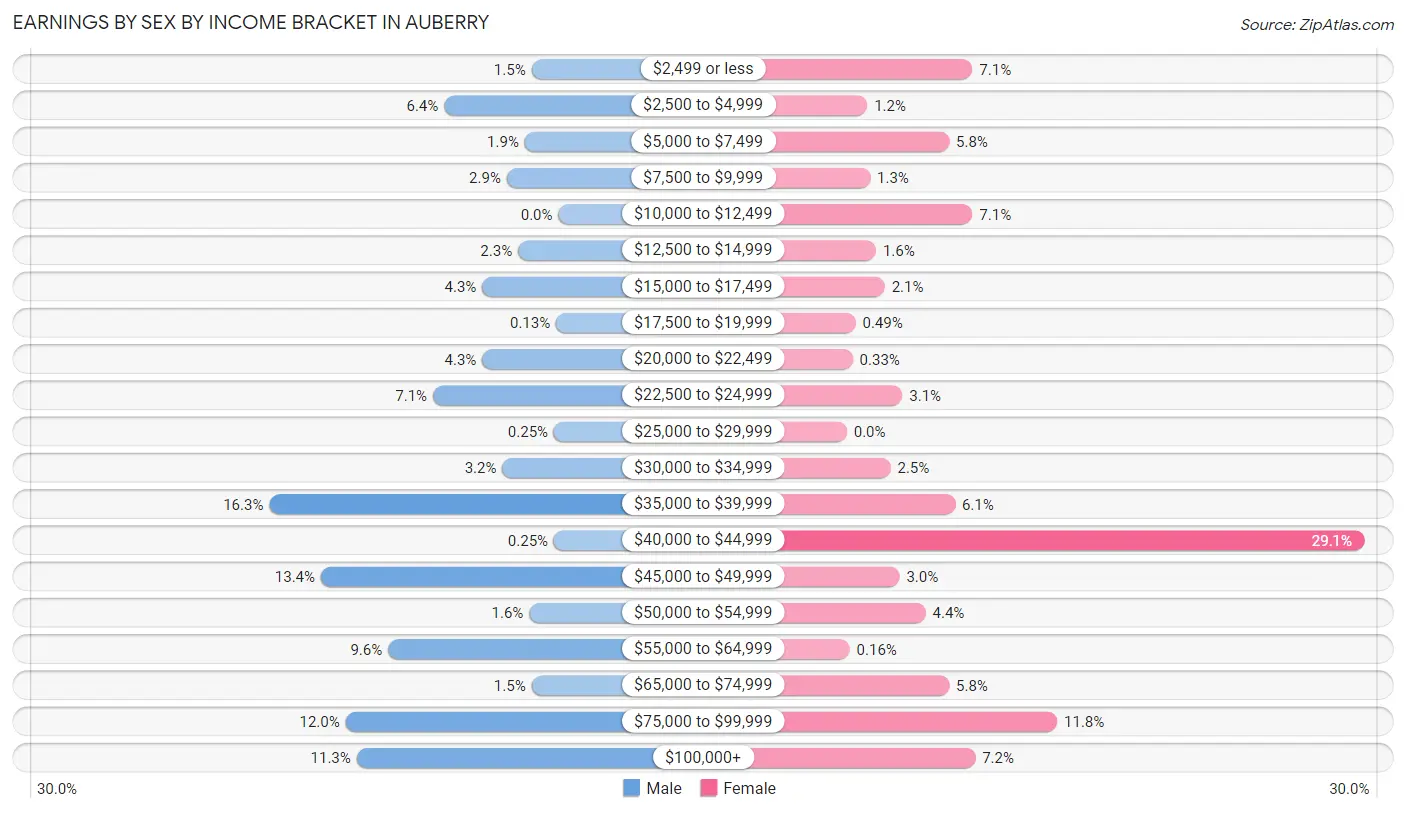
Earnings by Sex by Income Bracket in Auberry
The most common earnings brackets in Auberry are $35,000 to $39,999 for men (129 | 16.3%) and $40,000 to $44,999 for women (177 | 29.1%).
| Income | Male | Female |
| $2,499 or less | 12 (1.5%) | 43 (7.1%) |
| $2,500 to $4,999 | 51 (6.4%) | 7 (1.1%) |
| $5,000 to $7,499 | 15 (1.9%) | 35 (5.8%) |
| $7,500 to $9,999 | 23 (2.9%) | 8 (1.3%) |
| $10,000 to $12,499 | 0 (0.0%) | 43 (7.1%) |
| $12,500 to $14,999 | 18 (2.3%) | 10 (1.6%) |
| $15,000 to $17,499 | 34 (4.3%) | 13 (2.1%) |
| $17,500 to $19,999 | 1 (0.1%) | 3 (0.5%) |
| $20,000 to $22,499 | 34 (4.3%) | 2 (0.3%) |
| $22,500 to $24,999 | 56 (7.0%) | 19 (3.1%) |
| $25,000 to $29,999 | 2 (0.3%) | 0 (0.0%) |
| $30,000 to $34,999 | 25 (3.2%) | 15 (2.5%) |
| $35,000 to $39,999 | 129 (16.3%) | 37 (6.1%) |
| $40,000 to $44,999 | 2 (0.3%) | 177 (29.1%) |
| $45,000 to $49,999 | 106 (13.4%) | 18 (3.0%) |
| $50,000 to $54,999 | 13 (1.6%) | 27 (4.4%) |
| $55,000 to $64,999 | 76 (9.6%) | 1 (0.2%) |
| $65,000 to $74,999 | 12 (1.5%) | 35 (5.8%) |
| $75,000 to $99,999 | 95 (12.0%) | 72 (11.8%) |
| $100,000+ | 90 (11.3%) | 44 (7.2%) |
| Total | 794 (100.0%) | 609 (100.0%) |
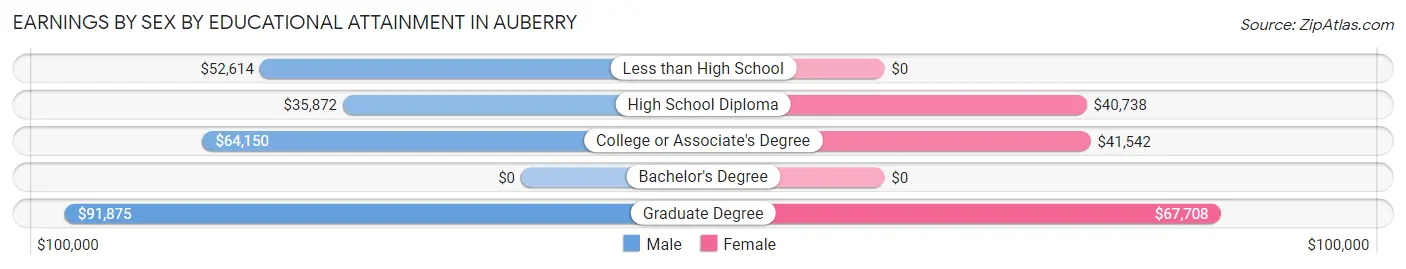
Earnings by Sex by Educational Attainment in Auberry
Average earnings in Auberry are $37,277 for men and $41,242 for women, a difference of 9.6%. Men with an educational attainment of graduate degree enjoy the highest average annual earnings of $91,875, while those with high school diploma education earn the least with $35,872. Women with an educational attainment of graduate degree earn the most with the average annual earnings of $67,708, while those with high school diploma education have the smallest earnings of $40,738.
| Educational Attainment | Male Income | Female Income |
| Less than High School | $52,614 | $0 |
| High School Diploma | $35,872 | $40,738 |
| College or Associate's Degree | $64,150 | $41,542 |
| Bachelor's Degree | - | - |
| Graduate Degree | $91,875 | $67,708 |
| Total | $37,277 | $41,242 |
Family Income in Auberry
Family Income Brackets in Auberry
According to the Auberry family income data, there are 234 families falling into the $50,000 to $74,999 income range, which is the most common income bracket and makes up 26.4% of all families. Conversely, the $10,000 to $14,999 income bracket is the least frequent group with only 13 families (1.5%) belonging to this category.
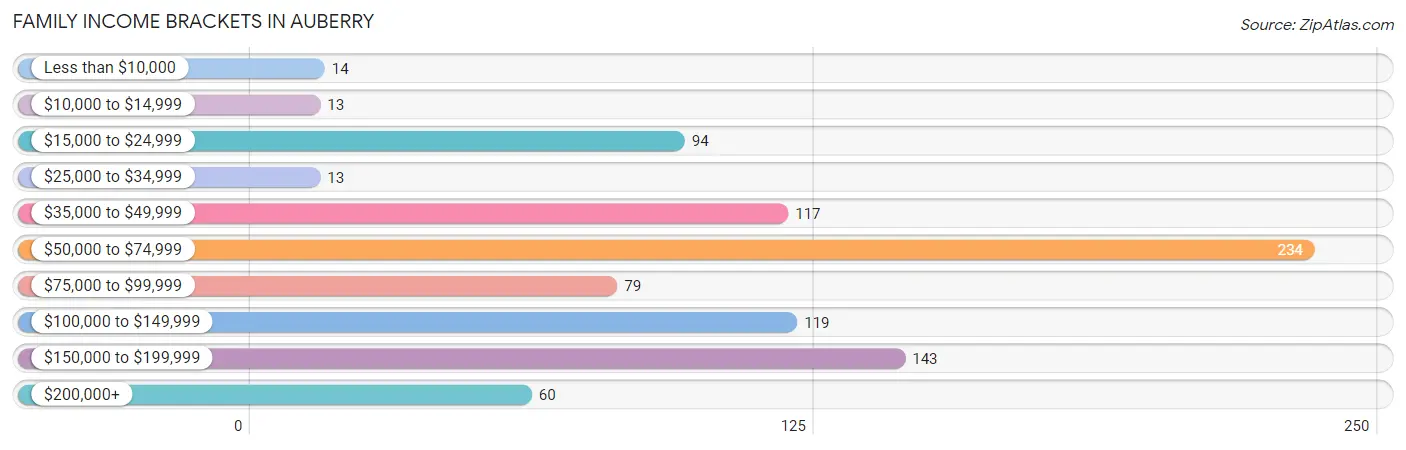
| Income Bracket | # Families | % Families |
| Less than $10,000 | 14 | 1.6% |
| $10,000 to $14,999 | 13 | 1.5% |
| $15,000 to $24,999 | 94 | 10.6% |
| $25,000 to $34,999 | 13 | 1.5% |
| $35,000 to $49,999 | 117 | 13.2% |
| $50,000 to $74,999 | 234 | 26.4% |
| $75,000 to $99,999 | 79 | 8.9% |
| $100,000 to $149,999 | 119 | 13.4% |
| $150,000 to $199,999 | 143 | 16.1% |
| $200,000+ | 60 | 6.8% |
Family Income by Famaliy Size in Auberry
5-person families (130 | 14.7%) account for the highest median family income in Auberry with $180,075 per family, while 3-person families (120 | 13.5%) have the highest median income of $42,745 per family member.
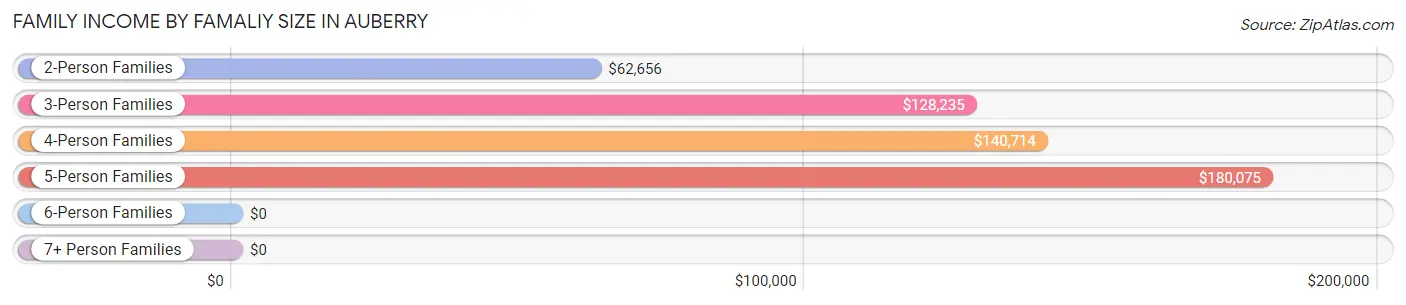
| Income Bracket | # Families | Median Income |
| 2-Person Families | 507 (57.2%) | $62,656 |
| 3-Person Families | 120 (13.5%) | $128,235 |
| 4-Person Families | 106 (12.0%) | $140,714 |
| 5-Person Families | 130 (14.7%) | $180,075 |
| 6-Person Families | 7 (0.8%) | $0 |
| 7+ Person Families | 16 (1.8%) | $0 |
| Total | 886 (100.0%) | $73,220 |
Family Income by Number of Earners in Auberry
The median family income in Auberry is $73,220, with families comprising 3+ earners (112) having the highest median family income of $181,119, while families with no earners (261) have the lowest median family income of $49,639, accounting for 12.6% and 29.5% of families, respectively.
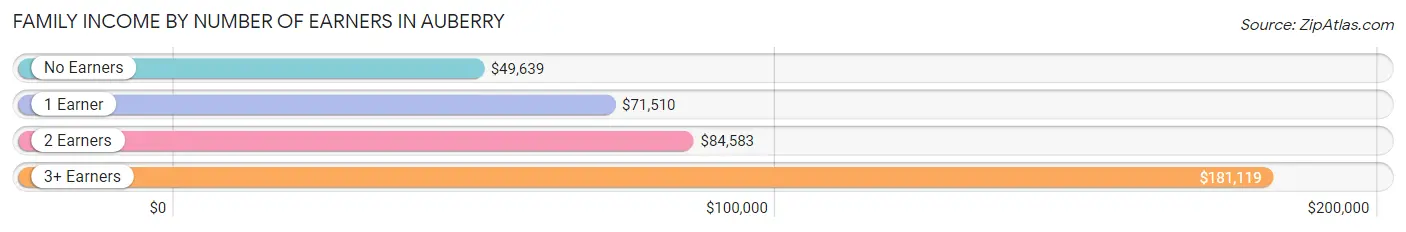
| Number of Earners | # Families | Median Income |
| No Earners | 261 (29.5%) | $49,639 |
| 1 Earner | 315 (35.5%) | $71,510 |
| 2 Earners | 198 (22.4%) | $84,583 |
| 3+ Earners | 112 (12.6%) | $181,119 |
| Total | 886 (100.0%) | $73,220 |
Household Income in Auberry
Household Income Brackets in Auberry
With 319 households falling in the category, the $50,000 to $74,999 income range is the most frequent in Auberry, accounting for 28.1% of all households. In contrast, only 25 households (2.2%) fall into the less than $10,000 income bracket, making it the least populous group.
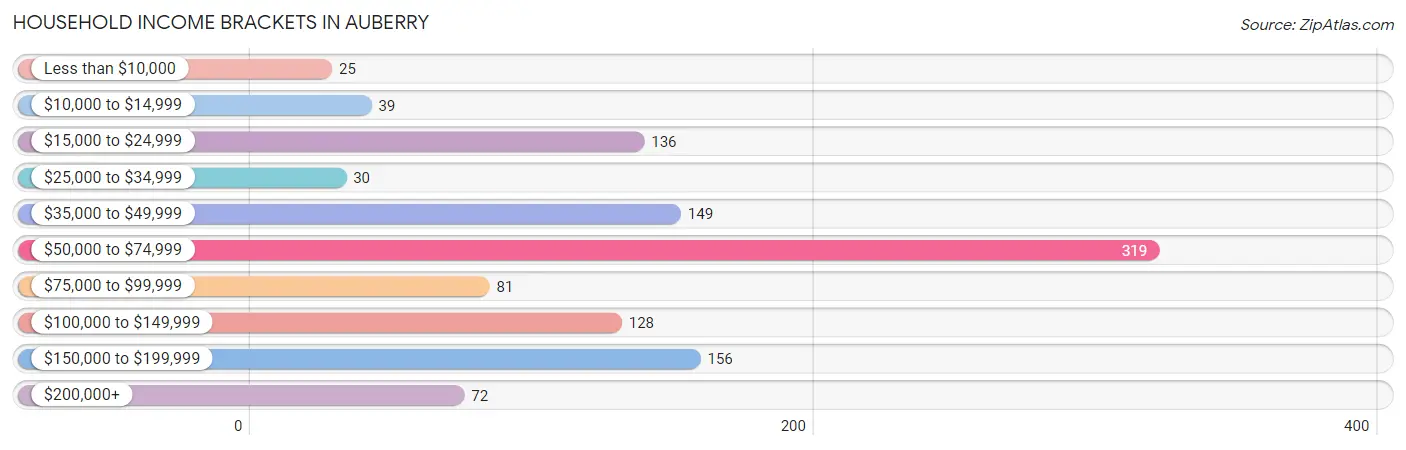
| Income Bracket | # Households | % Households |
| Less than $10,000 | 25 | 2.2% |
| $10,000 to $14,999 | 39 | 3.4% |
| $15,000 to $24,999 | 136 | 12.0% |
| $25,000 to $34,999 | 30 | 2.6% |
| $35,000 to $49,999 | 149 | 13.1% |
| $50,000 to $74,999 | 319 | 28.1% |
| $75,000 to $99,999 | 81 | 7.1% |
| $100,000 to $149,999 | 128 | 11.3% |
| $150,000 to $199,999 | 156 | 13.7% |
| $200,000+ | 72 | 6.3% |
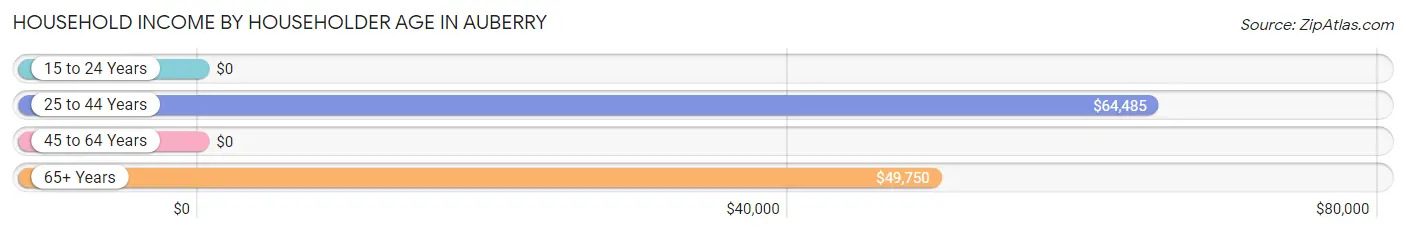
Household Income by Householder Age in Auberry
The median household income in Auberry is $68,320, with the highest median household income of $64,485 found in the 25 to 44 years age bracket for the primary householder. A total of 247 households (21.7%) fall into this category. Meanwhile, the 15 to 24 years age bracket for the primary householder has the lowest median household income of $0, with 5 households (0.4%) in this group.
| Income Bracket | # Households | Median Income |
| 15 to 24 Years | 5 (0.4%) | $0 |
| 25 to 44 Years | 247 (21.7%) | $64,485 |
| 45 to 64 Years | 368 (32.4%) | $0 |
| 65+ Years | 517 (45.5%) | $49,750 |
| Total | 1,137 (100.0%) | $68,320 |
Poverty in Auberry
Income Below Poverty by Sex and Age in Auberry
With 10.8% poverty level for males and 8.7% for females among the residents of Auberry, 75 year old and over males and 15 year old females are the most vulnerable to poverty, with 74 males (31.5%) and 2 females (33.3%) in their respective age groups living below the poverty level.
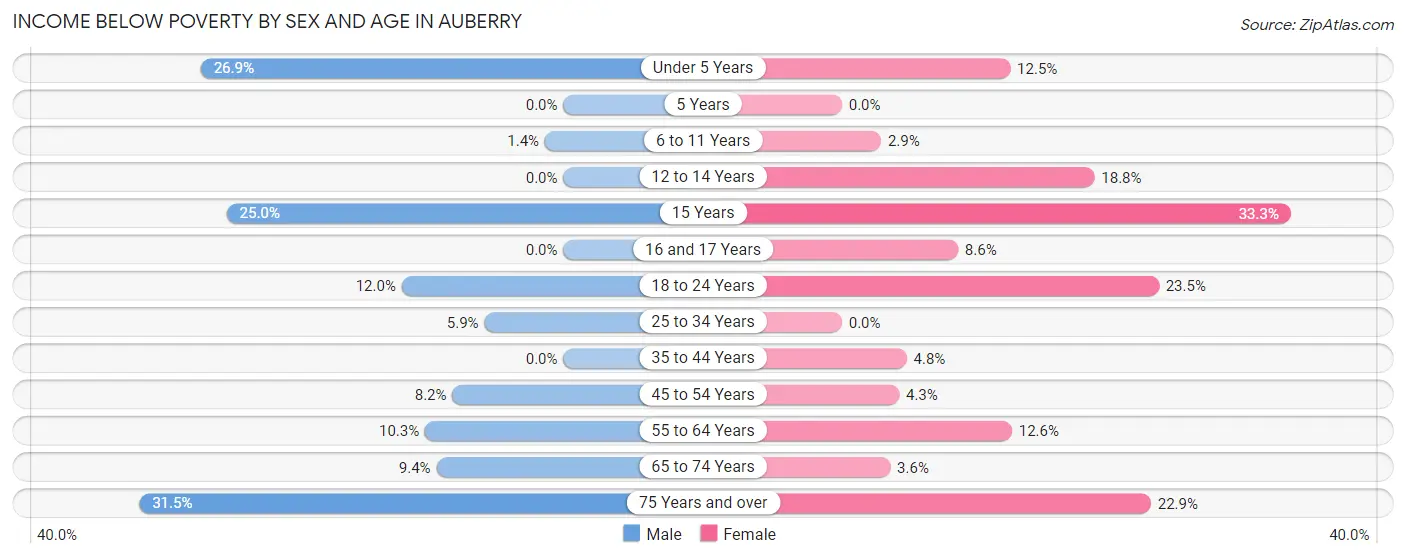
| Age Bracket | Male | Female |
| Under 5 Years | 14 (26.9%) | 4 (12.5%) |
| 5 Years | 0 (0.0%) | 0 (0.0%) |
| 6 to 11 Years | 2 (1.4%) | 3 (2.9%) |
| 12 to 14 Years | 0 (0.0%) | 6 (18.8%) |
| 15 Years | 1 (25.0%) | 2 (33.3%) |
| 16 and 17 Years | 0 (0.0%) | 5 (8.6%) |
| 18 to 24 Years | 18 (12.0%) | 4 (23.5%) |
| 25 to 34 Years | 16 (5.9%) | 0 (0.0%) |
| 35 to 44 Years | 0 (0.0%) | 5 (4.8%) |
| 45 to 54 Years | 15 (8.2%) | 9 (4.3%) |
| 55 to 64 Years | 15 (10.3%) | 27 (12.6%) |
| 65 to 74 Years | 21 (9.4%) | 6 (3.6%) |
| 75 Years and over | 74 (31.5%) | 50 (22.9%) |
| Total | 176 (10.8%) | 121 (8.7%) |
Income Above Poverty by Sex and Age in Auberry
According to the poverty statistics in Auberry, males aged 5 years and females aged 5 years are the age groups that are most secure financially, with 100.0% of males and 100.0% of females in these age groups living above the poverty line.
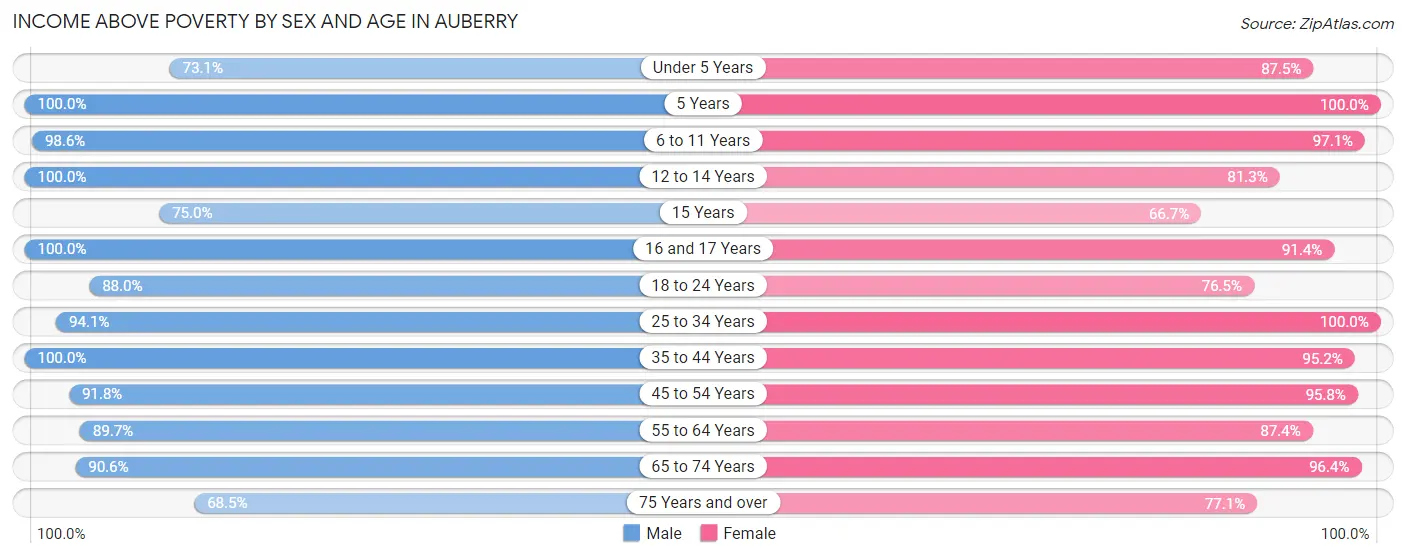
| Age Bracket | Male | Female |
| Under 5 Years | 38 (73.1%) | 28 (87.5%) |
| 5 Years | 5 (100.0%) | 28 (100.0%) |
| 6 to 11 Years | 144 (98.6%) | 100 (97.1%) |
| 12 to 14 Years | 30 (100.0%) | 26 (81.2%) |
| 15 Years | 3 (75.0%) | 4 (66.7%) |
| 16 and 17 Years | 34 (100.0%) | 53 (91.4%) |
| 18 to 24 Years | 132 (88.0%) | 13 (76.5%) |
| 25 to 34 Years | 257 (94.1%) | 203 (100.0%) |
| 35 to 44 Years | 145 (100.0%) | 99 (95.2%) |
| 45 to 54 Years | 167 (91.8%) | 203 (95.8%) |
| 55 to 64 Years | 131 (89.7%) | 187 (87.4%) |
| 65 to 74 Years | 202 (90.6%) | 161 (96.4%) |
| 75 Years and over | 161 (68.5%) | 168 (77.1%) |
| Total | 1,449 (89.2%) | 1,273 (91.3%) |
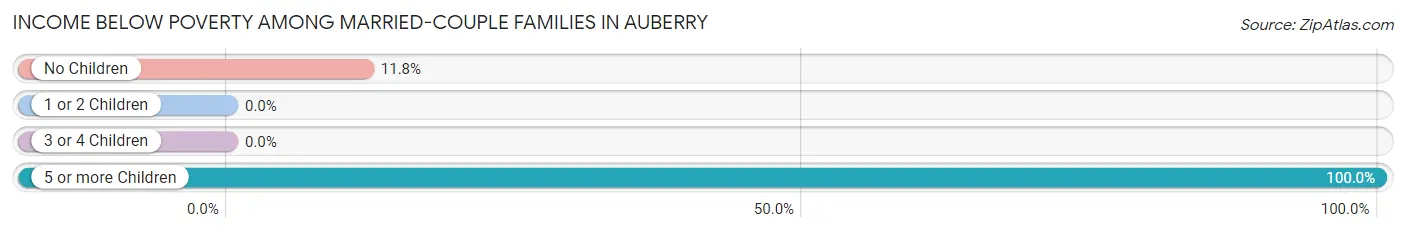
Income Below Poverty Among Married-Couple Families in Auberry
The poverty statistics for married-couple families in Auberry show that 8.7% or 68 of the total 777 families live below the poverty line. Families with 5 or more children have the highest poverty rate of 100.0%, comprising of 5 families. On the other hand, families with 1 or 2 children have the lowest poverty rate of 0.0%, which includes 0 families.
| Children | Above Poverty | Below Poverty |
| No Children | 470 (88.2%) | 63 (11.8%) |
| 1 or 2 Children | 191 (100.0%) | 0 (0.0%) |
| 3 or 4 Children | 48 (100.0%) | 0 (0.0%) |
| 5 or more Children | 0 (0.0%) | 5 (100.0%) |
| Total | 709 (91.2%) | 68 (8.7%) |
Income Below Poverty Among Single-Parent Households in Auberry
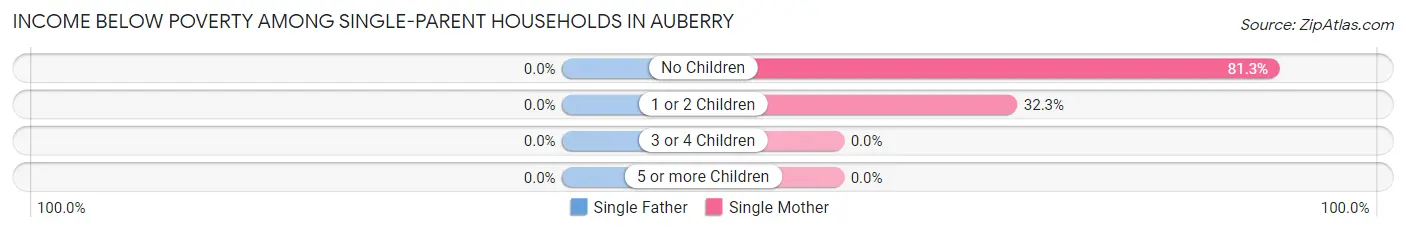
| Children | Single Father | Single Mother |
| No Children | 0 (0.0%) | 13 (81.2%) |
| 1 or 2 Children | 0 (0.0%) | 10 (32.3%) |
| 3 or 4 Children | 0 (0.0%) | 0 (0.0%) |
| 5 or more Children | 0 (0.0%) | 0 (0.0%) |
| Total | 0 (0.0%) | 23 (44.2%) |
Income Below Poverty Among Married-Couple vs Single-Parent Households in Auberry
The poverty data for Auberry shows that 68 of the married-couple family households (8.7%) and 23 of the single-parent households (21.1%) are living below the poverty level. Within the married-couple family households, those with 5 or more children have the highest poverty rate, with 5 households (100.0%) falling below the poverty line. Among the single-parent households, those with no children have the highest poverty rate, with 13 household (32.5%) living below poverty.
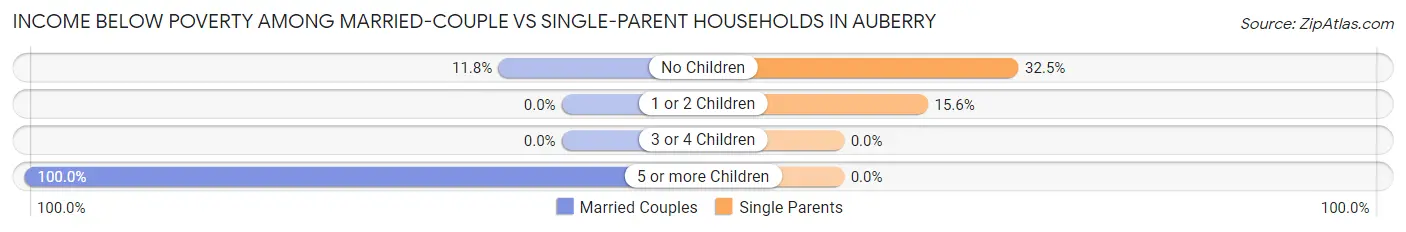
| Children | Married-Couple Families | Single-Parent Households |
| No Children | 63 (11.8%) | 13 (32.5%) |
| 1 or 2 Children | 0 (0.0%) | 10 (15.6%) |
| 3 or 4 Children | 0 (0.0%) | 0 (0.0%) |
| 5 or more Children | 5 (100.0%) | 0 (0.0%) |
| Total | 68 (8.7%) | 23 (21.1%) |
Race in Auberry
The most populous races in Auberry are White / Caucasian (2,504 | 82.6%), Native / Alaskan (268 | 8.8%), and Hispanic or Latino (251 | 8.3%).
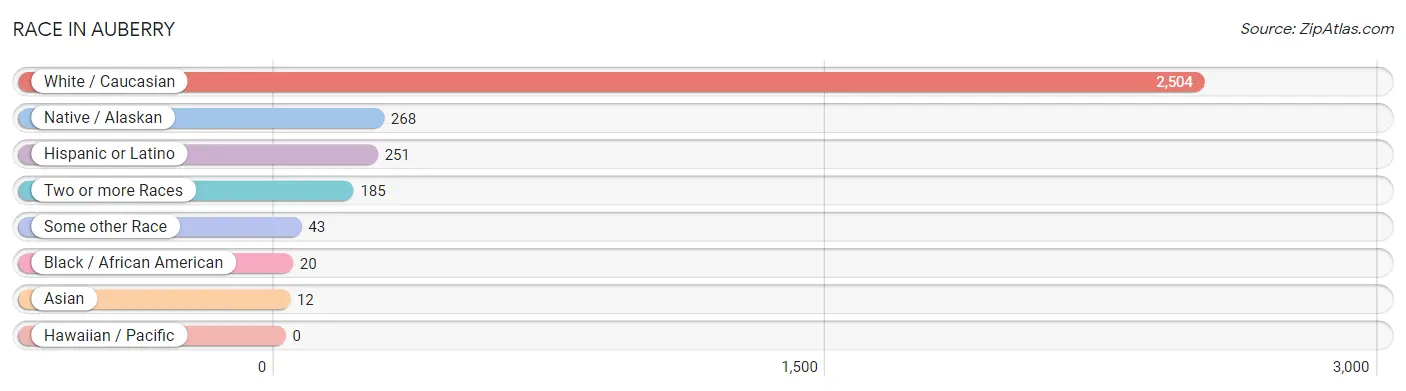
| Race | # Population | % Population |
| Asian | 12 | 0.4% |
| Black / African American | 20 | 0.7% |
| Hawaiian / Pacific | 0 | 0.0% |
| Hispanic or Latino | 251 | 8.3% |
| Native / Alaskan | 268 | 8.8% |
| White / Caucasian | 2,504 | 82.6% |
| Two or more Races | 185 | 6.1% |
| Some other Race | 43 | 1.4% |
| Total | 3,032 | 100.0% |
Ancestry in Auberry
The most populous ancestries reported in Auberry are German (537 | 17.7%), American (455 | 15.0%), English (342 | 11.3%), Irish (246 | 8.1%), and Mexican (244 | 8.1%), together accounting for 60.2% of all Auberry residents.
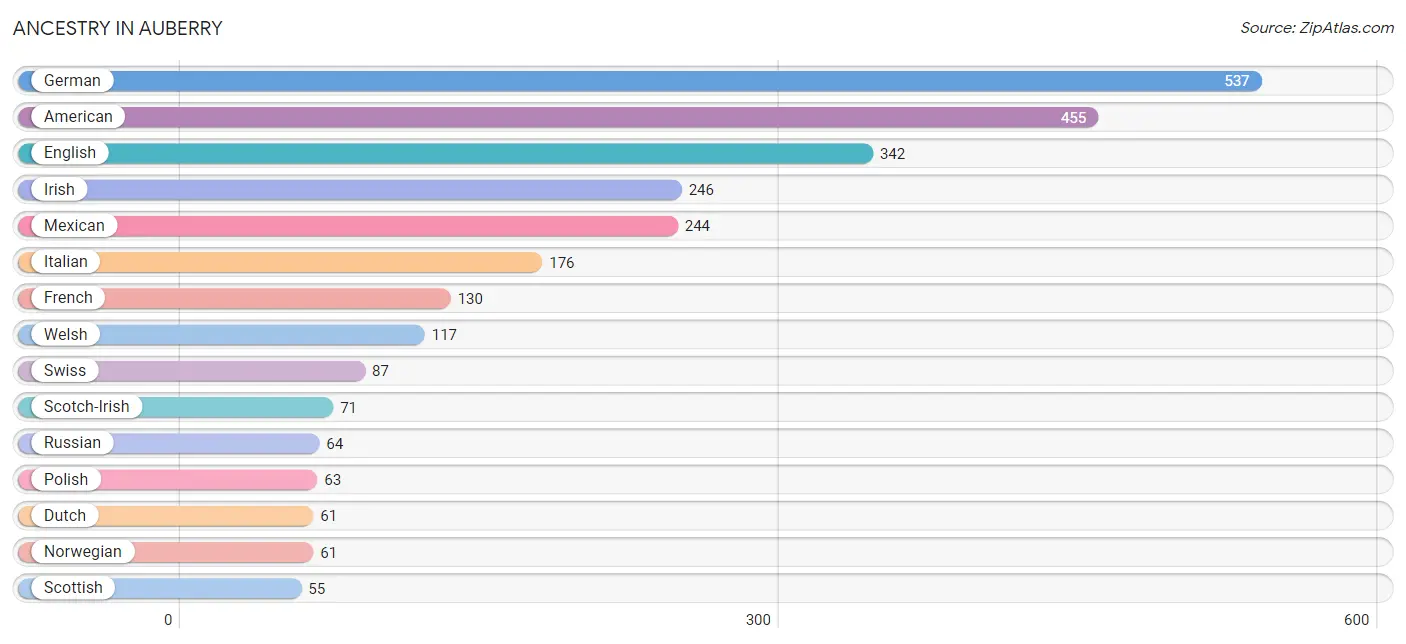
| Ancestry | # Population | % Population |
| American | 455 | 15.0% |
| Armenian | 5 | 0.2% |
| Austrian | 23 | 0.8% |
| Bhutanese | 30 | 1.0% |
| Cherokee | 53 | 1.8% |
| Czechoslovakian | 1 | 0.0% |
| Danish | 19 | 0.6% |
| Dutch | 61 | 2.0% |
| English | 342 | 11.3% |
| European | 44 | 1.5% |
| French | 130 | 4.3% |
| French Canadian | 8 | 0.3% |
| German | 537 | 17.7% |
| Hopi | 34 | 1.1% |
| Irish | 246 | 8.1% |
| Israeli | 8 | 0.3% |
| Italian | 176 | 5.8% |
| Mexican | 244 | 8.1% |
| Mexican American Indian | 18 | 0.6% |
| Nigerian | 3 | 0.1% |
| Northern European | 6 | 0.2% |
| Norwegian | 61 | 2.0% |
| Paiute | 11 | 0.4% |
| Polish | 63 | 2.1% |
| Portuguese | 38 | 1.3% |
| Russian | 64 | 2.1% |
| Scotch-Irish | 71 | 2.3% |
| Scottish | 55 | 1.8% |
| Slavic | 21 | 0.7% |
| Spaniard | 4 | 0.1% |
| Subsaharan African | 3 | 0.1% |
| Swedish | 34 | 1.1% |
| Swiss | 87 | 2.9% |
| Welsh | 117 | 3.9% | View All 34 Rows |
Immigrants in Auberry
The most numerous immigrant groups reported in Auberry came from Europe (7 | 0.2%), Western Europe (7 | 0.2%), Canada (5 | 0.2%), Switzerland (4 | 0.1%), and Asia (3 | 0.1%), together accounting for 0.9% of all Auberry residents.
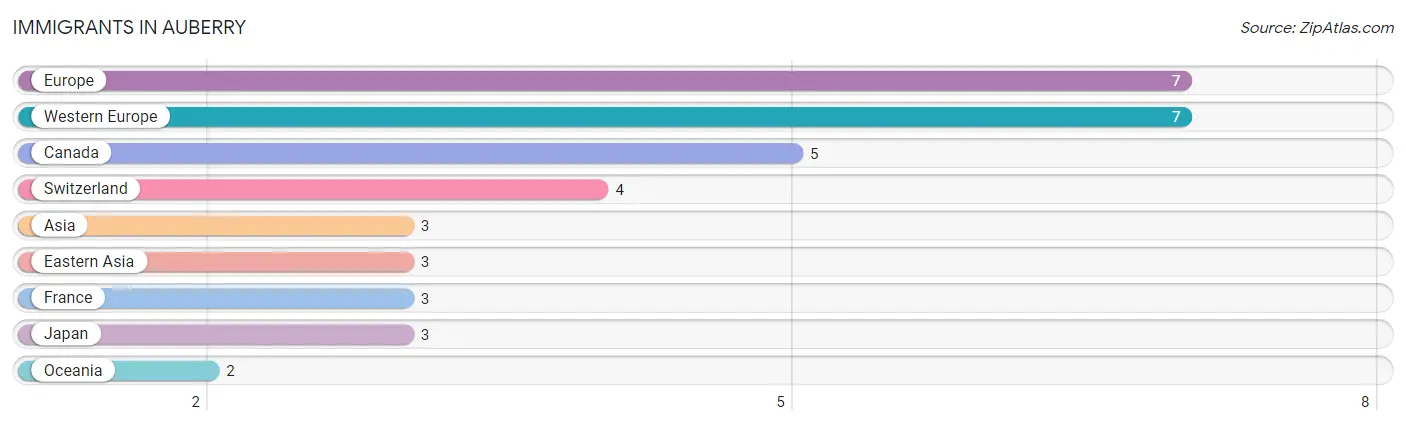
| Immigration Origin | # Population | % Population |
| Asia | 3 | 0.1% |
| Canada | 5 | 0.2% |
| Eastern Asia | 3 | 0.1% |
| Europe | 7 | 0.2% |
| France | 3 | 0.1% |
| Japan | 3 | 0.1% |
| Oceania | 2 | 0.1% |
| Switzerland | 4 | 0.1% |
| Western Europe | 7 | 0.2% | View All 9 Rows |
Sex and Age in Auberry
Sex and Age in Auberry
The most populous age groups in Auberry are 65 to 69 Years (147 | 9.0%) for men and 60 to 64 Years (152 | 10.8%) for women.
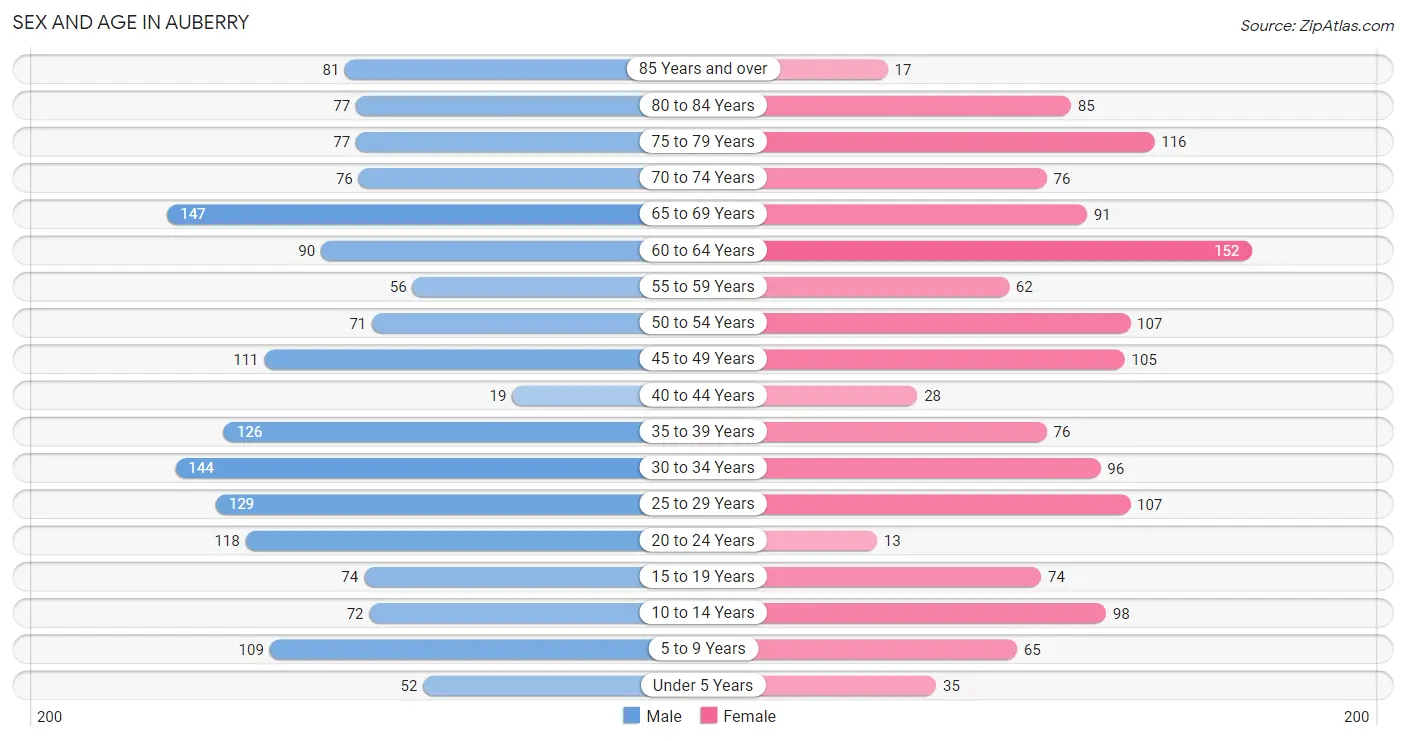
| Age Bracket | Male | Female |
| Under 5 Years | 52 (3.2%) | 35 (2.5%) |
| 5 to 9 Years | 109 (6.7%) | 65 (4.6%) |
| 10 to 14 Years | 72 (4.4%) | 98 (7.0%) |
| 15 to 19 Years | 74 (4.5%) | 74 (5.3%) |
| 20 to 24 Years | 118 (7.2%) | 13 (0.9%) |
| 25 to 29 Years | 129 (7.9%) | 107 (7.6%) |
| 30 to 34 Years | 144 (8.8%) | 96 (6.8%) |
| 35 to 39 Years | 126 (7.7%) | 76 (5.4%) |
| 40 to 44 Years | 19 (1.2%) | 28 (2.0%) |
| 45 to 49 Years | 111 (6.8%) | 105 (7.5%) |
| 50 to 54 Years | 71 (4.4%) | 107 (7.6%) |
| 55 to 59 Years | 56 (3.4%) | 62 (4.4%) |
| 60 to 64 Years | 90 (5.5%) | 152 (10.8%) |
| 65 to 69 Years | 147 (9.0%) | 91 (6.5%) |
| 70 to 74 Years | 76 (4.7%) | 76 (5.4%) |
| 75 to 79 Years | 77 (4.7%) | 116 (8.3%) |
| 80 to 84 Years | 77 (4.7%) | 85 (6.1%) |
| 85 Years and over | 81 (5.0%) | 17 (1.2%) |
| Total | 1,629 (100.0%) | 1,403 (100.0%) |
Families and Households in Auberry
Median Family Size in Auberry
The median family size in Auberry is 3.05 persons per family, with married-couple families (777 | 87.7%) accounting for the largest median family size of 3.11 persons per family. On the other hand, single male/father families (57 | 6.4%) represent the smallest median family size with 2.19 persons per family.
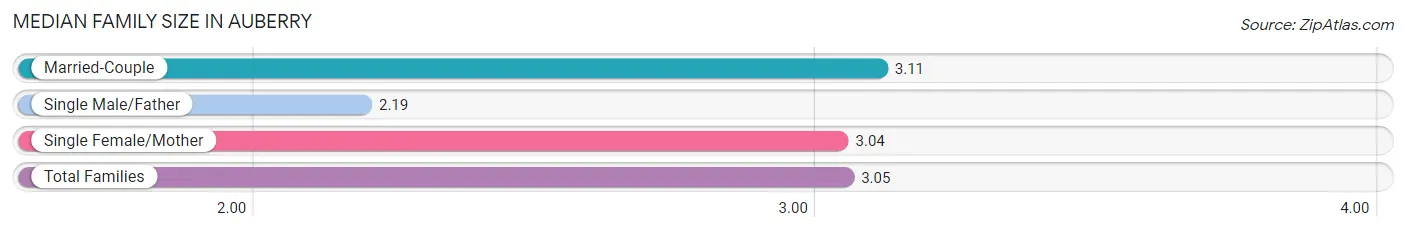
| Family Type | # Families | Family Size |
| Married-Couple | 777 (87.7%) | 3.11 |
| Single Male/Father | 57 (6.4%) | 2.19 |
| Single Female/Mother | 52 (5.9%) | 3.04 |
| Total Families | 886 (100.0%) | 3.05 |
Median Household Size in Auberry
The median household size in Auberry is 2.66 persons per household, with married-couple households (777 | 68.3%) accounting for the largest median household size of 3.14 persons per household. non-family households (251 | 22.1%) represent the smallest median household size with 1.17 persons per household.
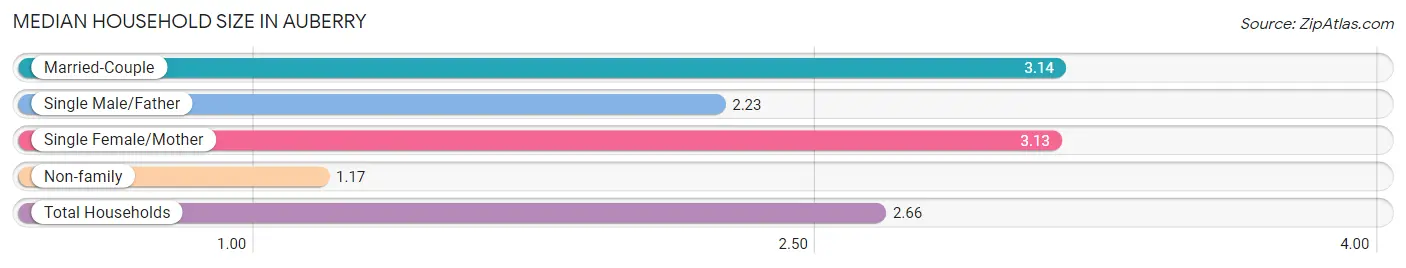
| Household Type | # Households | Household Size |
| Married-Couple | 777 (68.3%) | 3.14 |
| Single Male/Father | 57 (5.0%) | 2.23 |
| Single Female/Mother | 52 (4.6%) | 3.13 |
| Non-family | 251 (22.1%) | 1.17 |
| Total Households | 1,137 (100.0%) | 2.66 |
Household Size by Marriage Status in Auberry
Out of a total of 1,137 households in Auberry, 886 (77.9%) are family households, while 251 (22.1%) are nonfamily households. The most numerous type of family households are 2-person households, comprising 507, and the most common type of nonfamily households are 1-person households, comprising 225.
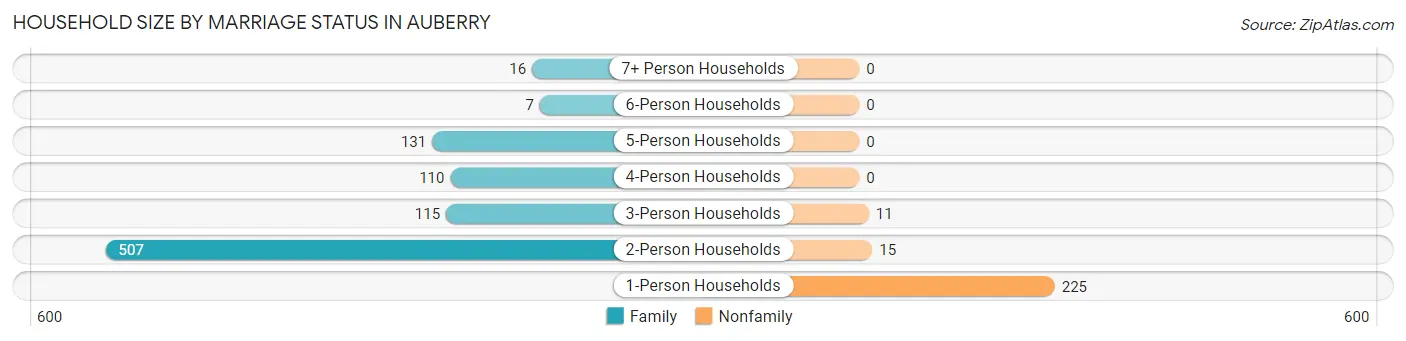
| Household Size | Family Households | Nonfamily Households |
| 1-Person Households | - | 225 (19.8%) |
| 2-Person Households | 507 (44.6%) | 15 (1.3%) |
| 3-Person Households | 115 (10.1%) | 11 (1.0%) |
| 4-Person Households | 110 (9.7%) | 0 (0.0%) |
| 5-Person Households | 131 (11.5%) | 0 (0.0%) |
| 6-Person Households | 7 (0.6%) | 0 (0.0%) |
| 7+ Person Households | 16 (1.4%) | 0 (0.0%) |
| Total | 886 (77.9%) | 251 (22.1%) |
Female Fertility in Auberry
Fertility by Age in Auberry
Average fertility rate in Auberry is 16.0 births per 1,000 women. Women in the age bracket of 20 to 34 years have the highest fertility rate with 23.0 births per 1,000 women. Women in the age bracket of 20 to 34 years acount for 55.6% of all women with births.
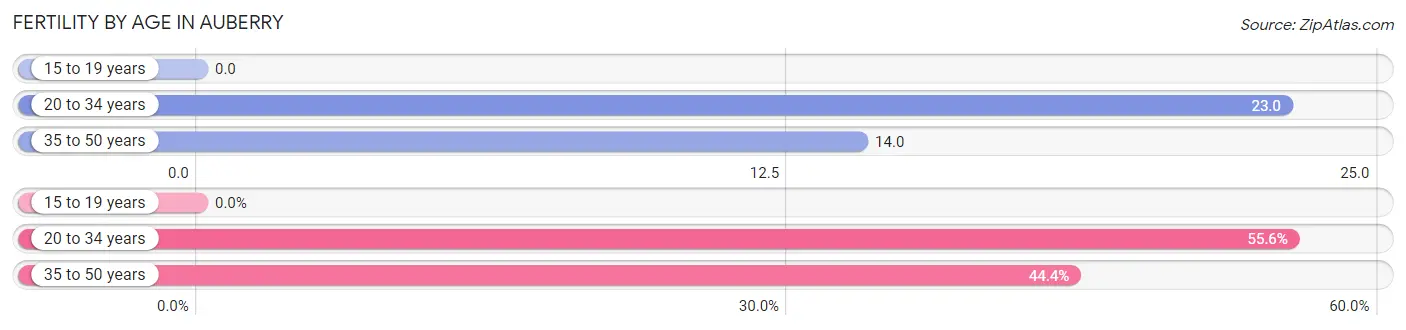
| Age Bracket | Women with Births | Births / 1,000 Women |
| 15 to 19 years | 0 (0.0%) | 0.0 |
| 20 to 34 years | 5 (55.6%) | 23.0 |
| 35 to 50 years | 4 (44.4%) | 14.0 |
| Total | 9 (100.0%) | 16.0 |
Fertility by Age by Marriage Status in Auberry
55.6% of women with births (9) in Auberry are married. The highest percentage of unmarried women with births falls into 35 to 50 years age bracket with 100.0% of them unmarried at the time of birth, while the lowest percentage of unmarried women with births belong to 20 to 34 years age bracket with 0.0% of them unmarried.
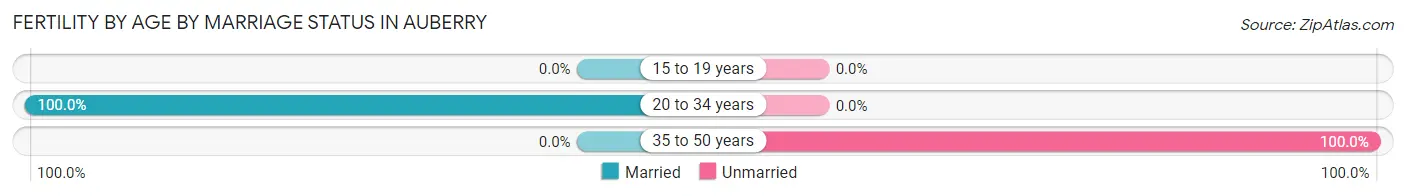
| Age Bracket | Married | Unmarried |
| 15 to 19 years | 0 (0.0%) | 0 (0.0%) |
| 20 to 34 years | 5 (100.0%) | 0 (0.0%) |
| 35 to 50 years | 0 (0.0%) | 4 (100.0%) |
| Total | 5 (55.6%) | 4 (44.4%) |
Fertility by Education in Auberry
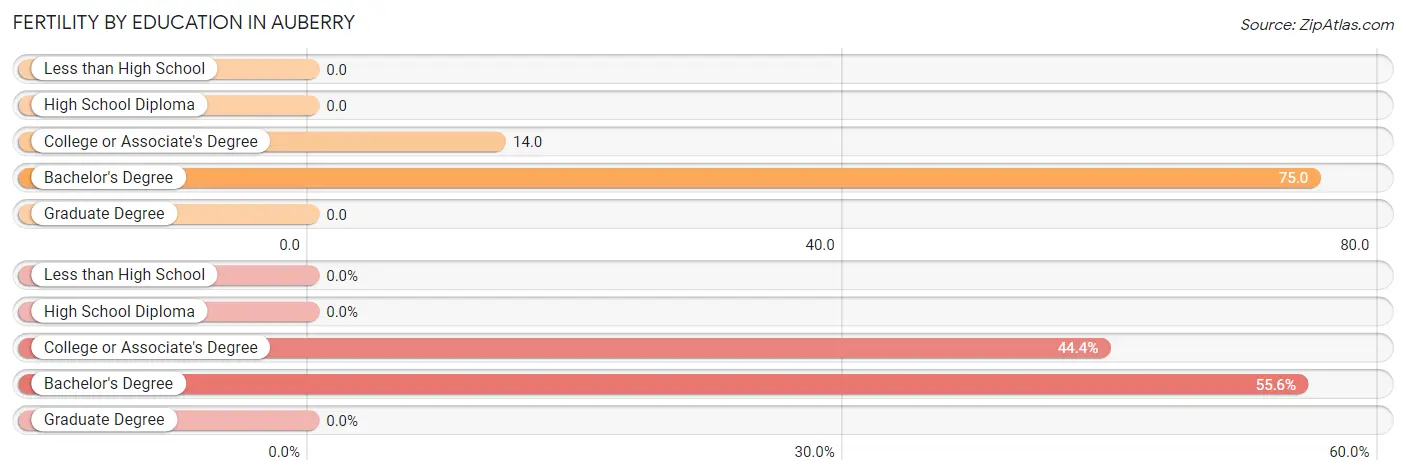
| Educational Attainment | Women with Births | Births / 1,000 Women |
| Less than High School | 0 (0.0%) | 0.0 |
| High School Diploma | 0 (0.0%) | 0.0 |
| College or Associate's Degree | 4 (44.4%) | 14.0 |
| Bachelor's Degree | 5 (55.6%) | 75.0 |
| Graduate Degree | 0 (0.0%) | 0.0 |
| Total | 9 (100.0%) | 16.0 |
Fertility by Education by Marriage Status in Auberry
44.4% of women with births in Auberry are unmarried. Women with the educational attainment of bachelor's degree are most likely to be married with 100.0% of them married at childbirth, while women with the educational attainment of college or associate's degree are least likely to be married with 100.0% of them unmarried at childbirth.
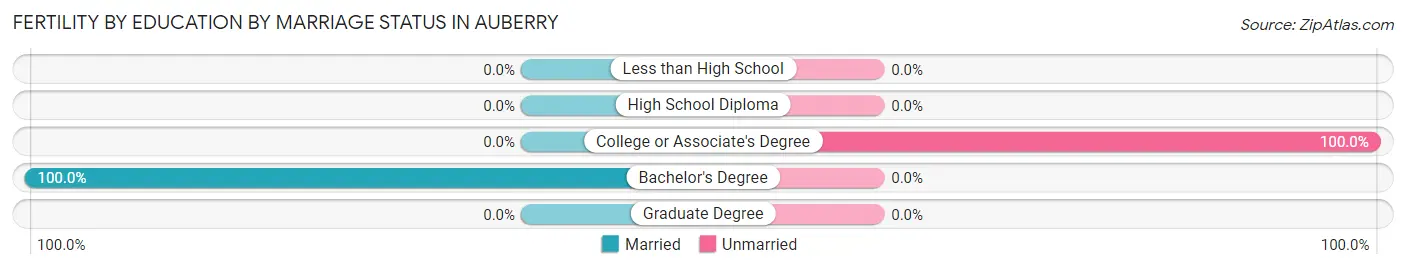
| Educational Attainment | Married | Unmarried |
| Less than High School | 0 (0.0%) | 0 (0.0%) |
| High School Diploma | 0 (0.0%) | 0 (0.0%) |
| College or Associate's Degree | 0 (0.0%) | 4 (100.0%) |
| Bachelor's Degree | 5 (100.0%) | 0 (0.0%) |
| Graduate Degree | 0 (0.0%) | 0 (0.0%) |
| Total | 5 (55.6%) | 4 (44.4%) |
Employment Characteristics in Auberry
Employment by Class of Employer in Auberry
Among the 1,256 employed individuals in Auberry, private company employees (787 | 62.7%), state government employees (117 | 9.3%), and self-employed (not incorporated) (97 | 7.7%) make up the most common classes of employment.
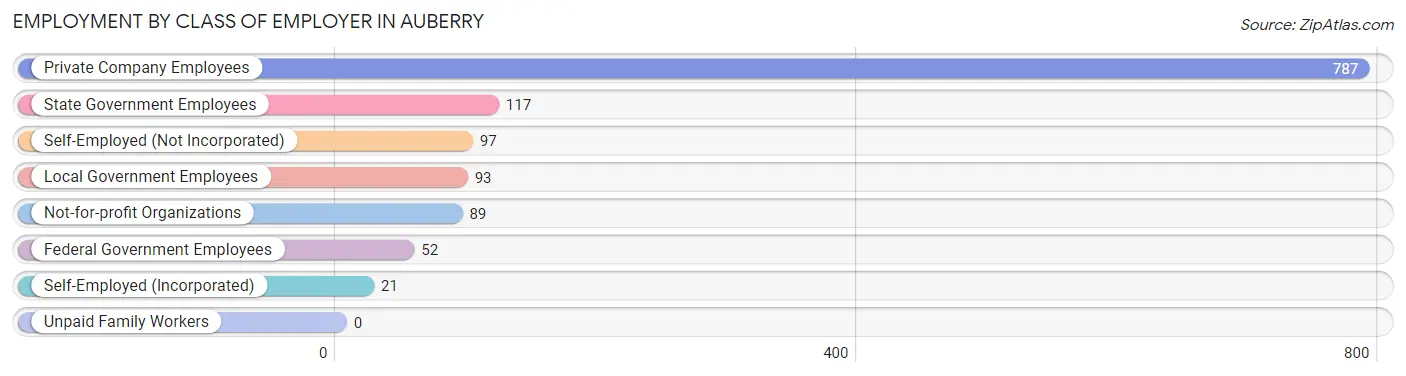
| Employer Class | # Employees | % Employees |
| Private Company Employees | 787 | 62.7% |
| Self-Employed (Incorporated) | 21 | 1.7% |
| Self-Employed (Not Incorporated) | 97 | 7.7% |
| Not-for-profit Organizations | 89 | 7.1% |
| Local Government Employees | 93 | 7.4% |
| State Government Employees | 117 | 9.3% |
| Federal Government Employees | 52 | 4.1% |
| Unpaid Family Workers | 0 | 0.0% |
| Total | 1,256 | 100.0% |
Employment Status by Age in Auberry
According to the labor force statistics for Auberry, out of the total population over 16 years of age (2,591), 52.2% or 1,353 individuals are in the labor force, with 6.7% or 91 of them unemployed. The age group with the highest labor force participation rate is 25 to 29 years, with 93.2% or 220 individuals in the labor force. Within the labor force, the 16 to 19 years age range has the highest percentage of unemployed individuals, with 39.5% or 17 of them being unemployed.
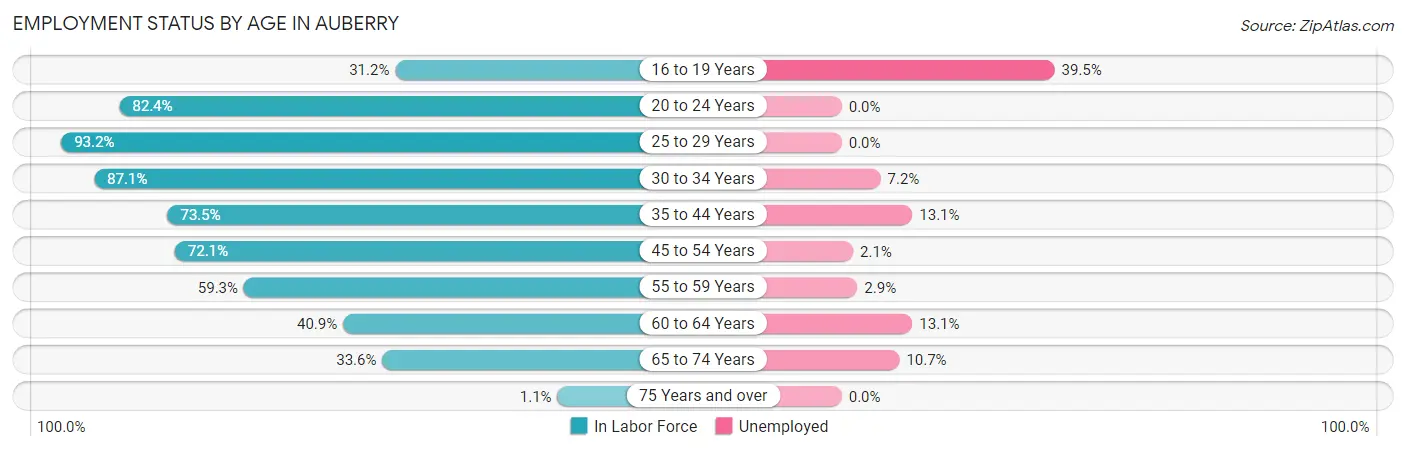
| Age Bracket | In Labor Force | Unemployed |
| 16 to 19 Years | 43 (31.2%) | 17 (39.5%) |
| 20 to 24 Years | 108 (82.4%) | 0 (0.0%) |
| 25 to 29 Years | 220 (93.2%) | 0 (0.0%) |
| 30 to 34 Years | 209 (87.1%) | 15 (7.2%) |
| 35 to 44 Years | 183 (73.5%) | 24 (13.1%) |
| 45 to 54 Years | 284 (72.1%) | 6 (2.1%) |
| 55 to 59 Years | 70 (59.3%) | 2 (2.9%) |
| 60 to 64 Years | 99 (40.9%) | 13 (13.1%) |
| 65 to 74 Years | 131 (33.6%) | 14 (10.7%) |
| 75 Years and over | 5 (1.1%) | 0 (0.0%) |
| Total | 1,353 (52.2%) | 91 (6.7%) |
Employment Status by Educational Attainment in Auberry
According to labor force statistics for Auberry, 72.0% of individuals (1,065) out of the total population between 25 and 64 years of age (1,479) are in the labor force, with 5.6% or 60 of them being unemployed. The group with the highest labor force participation rate are those with the educational attainment of less than high school, with 94.1% or 48 individuals in the labor force. Within the labor force, individuals with bachelor's degree or higher education have the highest percentage of unemployment, with 11.2% or 20 of them being unemployed.
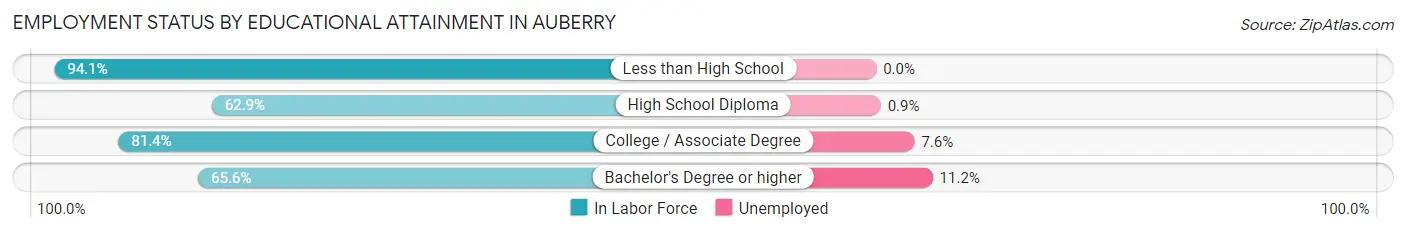
| Educational Attainment | In Labor Force | Unemployed |
| Less than High School | 48 (94.1%) | 0 (0.0%) |
| High School Diploma | 348 (62.9%) | 5 (0.9%) |
| College / Associate Degree | 490 (81.4%) | 46 (7.6%) |
| Bachelor's Degree or higher | 179 (65.6%) | 31 (11.2%) |
| Total | 1,065 (72.0%) | 83 (5.6%) |
Employment Occupations by Sex in Auberry
Management, Business, Science and Arts Occupations
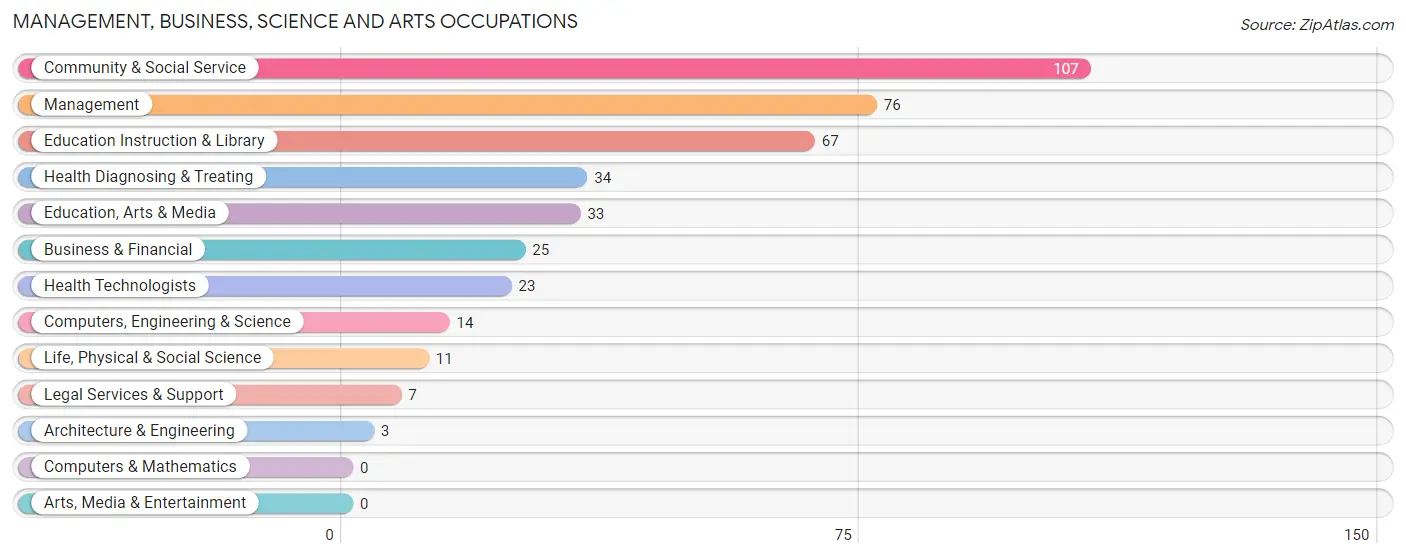
The most common Management, Business, Science and Arts occupations in Auberry are Community & Social Service (107 | 8.5%), Management (76 | 6.0%), Education Instruction & Library (67 | 5.3%), Health Diagnosing & Treating (34 | 2.7%), and Education, Arts & Media (33 | 2.6%).
Management, Business, Science and Arts Occupations by Sex
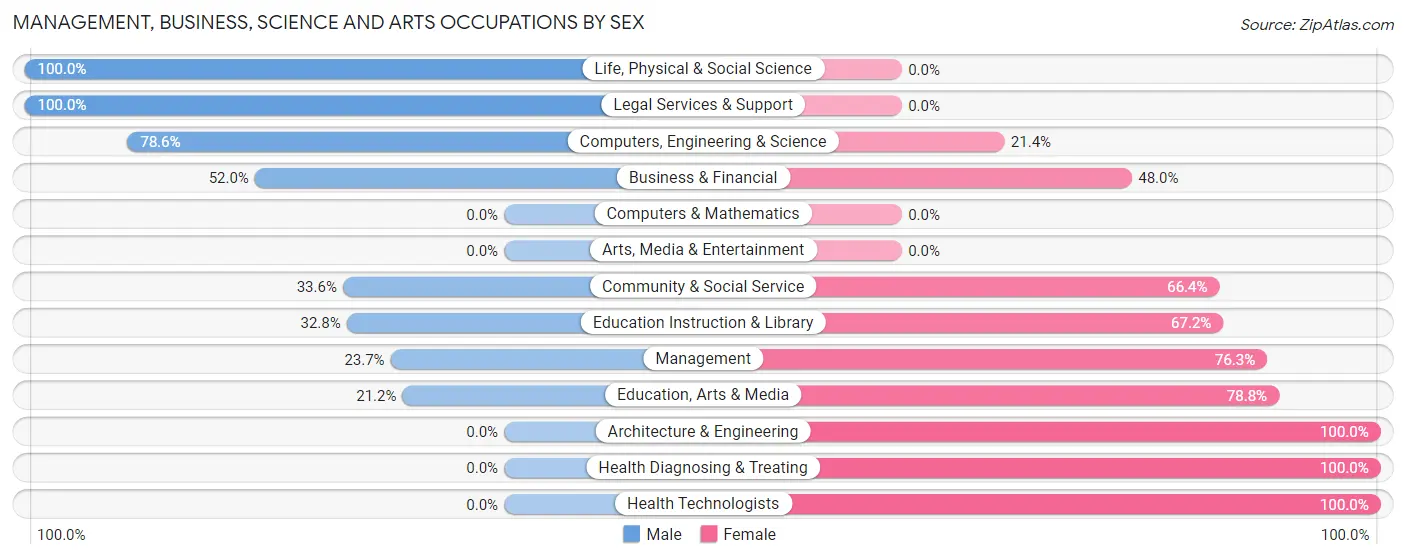
Within the Management, Business, Science and Arts occupations in Auberry, the most male-oriented occupations are Life, Physical & Social Science (100.0%), Legal Services & Support (100.0%), and Computers, Engineering & Science (78.6%), while the most female-oriented occupations are Architecture & Engineering (100.0%), Health Diagnosing & Treating (100.0%), and Health Technologists (100.0%).
| Occupation | Male | Female |
| Management | 18 (23.7%) | 58 (76.3%) |
| Business & Financial | 13 (52.0%) | 12 (48.0%) |
| Computers, Engineering & Science | 11 (78.6%) | 3 (21.4%) |
| Computers & Mathematics | 0 (0.0%) | 0 (0.0%) |
| Architecture & Engineering | 0 (0.0%) | 3 (100.0%) |
| Life, Physical & Social Science | 11 (100.0%) | 0 (0.0%) |
| Community & Social Service | 36 (33.6%) | 71 (66.4%) |
| Education, Arts & Media | 7 (21.2%) | 26 (78.8%) |
| Legal Services & Support | 7 (100.0%) | 0 (0.0%) |
| Education Instruction & Library | 22 (32.8%) | 45 (67.2%) |
| Arts, Media & Entertainment | 0 (0.0%) | 0 (0.0%) |
| Health Diagnosing & Treating | 0 (0.0%) | 34 (100.0%) |
| Health Technologists | 0 (0.0%) | 23 (100.0%) |
| Total (Category) | 78 (30.5%) | 178 (69.5%) |
| Total (Overall) | 717 (56.9%) | 544 (43.1%) |
Services Occupations
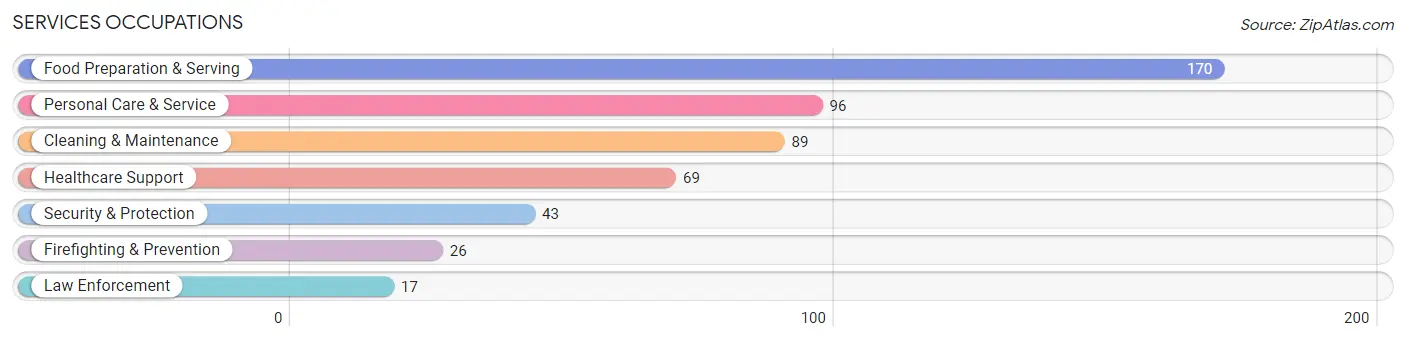
The most common Services occupations in Auberry are Food Preparation & Serving (170 | 13.5%), Personal Care & Service (96 | 7.6%), Cleaning & Maintenance (89 | 7.1%), Healthcare Support (69 | 5.5%), and Security & Protection (43 | 3.4%).
Services Occupations by Sex
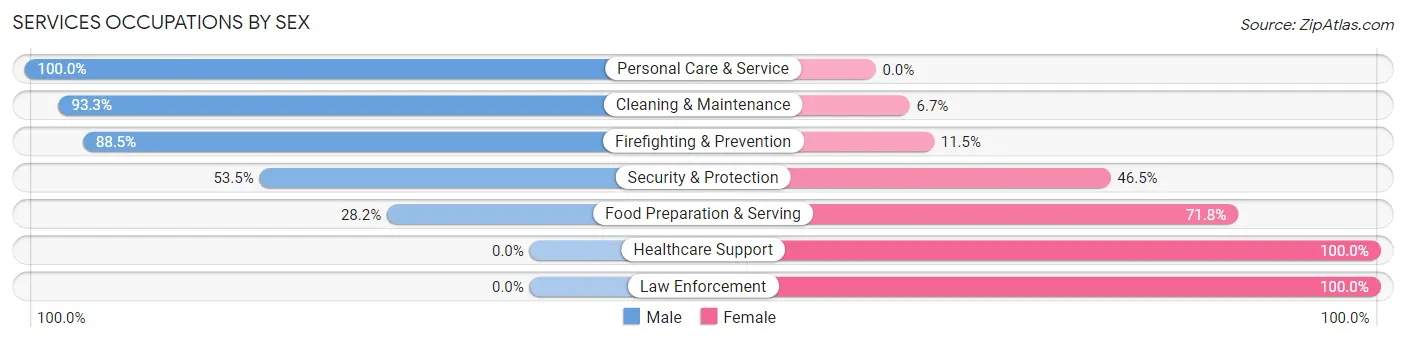
Within the Services occupations in Auberry, the most male-oriented occupations are Personal Care & Service (100.0%), Cleaning & Maintenance (93.3%), and Firefighting & Prevention (88.5%), while the most female-oriented occupations are Healthcare Support (100.0%), Law Enforcement (100.0%), and Food Preparation & Serving (71.8%).
| Occupation | Male | Female |
| Healthcare Support | 0 (0.0%) | 69 (100.0%) |
| Security & Protection | 23 (53.5%) | 20 (46.5%) |
| Firefighting & Prevention | 23 (88.5%) | 3 (11.5%) |
| Law Enforcement | 0 (0.0%) | 17 (100.0%) |
| Food Preparation & Serving | 48 (28.2%) | 122 (71.8%) |
| Cleaning & Maintenance | 83 (93.3%) | 6 (6.7%) |
| Personal Care & Service | 96 (100.0%) | 0 (0.0%) |
| Total (Category) | 250 (53.5%) | 217 (46.5%) |
| Total (Overall) | 717 (56.9%) | 544 (43.1%) |
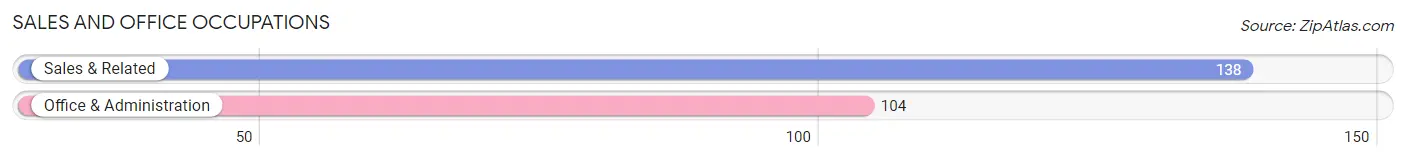
Sales and Office Occupations
The most common Sales and Office occupations in Auberry are Sales & Related (138 | 10.9%), and Office & Administration (104 | 8.3%).
Sales and Office Occupations by Sex
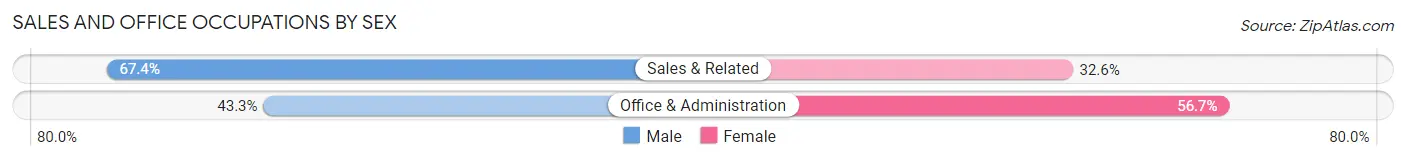
| Occupation | Male | Female |
| Sales & Related | 93 (67.4%) | 45 (32.6%) |
| Office & Administration | 45 (43.3%) | 59 (56.7%) |
| Total (Category) | 138 (57.0%) | 104 (43.0%) |
| Total (Overall) | 717 (56.9%) | 544 (43.1%) |
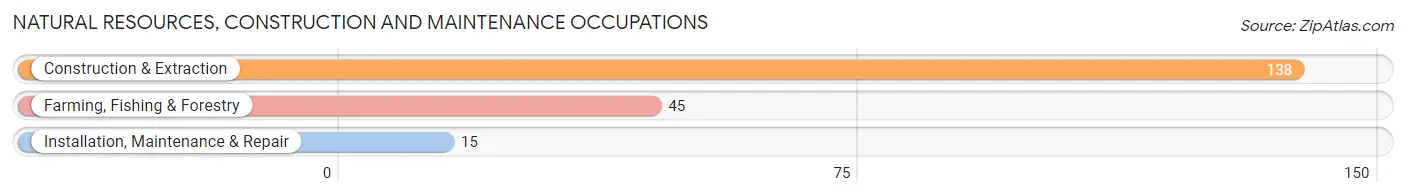
Natural Resources, Construction and Maintenance Occupations
The most common Natural Resources, Construction and Maintenance occupations in Auberry are Construction & Extraction (138 | 10.9%), Farming, Fishing & Forestry (45 | 3.6%), and Installation, Maintenance & Repair (15 | 1.2%).
Natural Resources, Construction and Maintenance Occupations by Sex
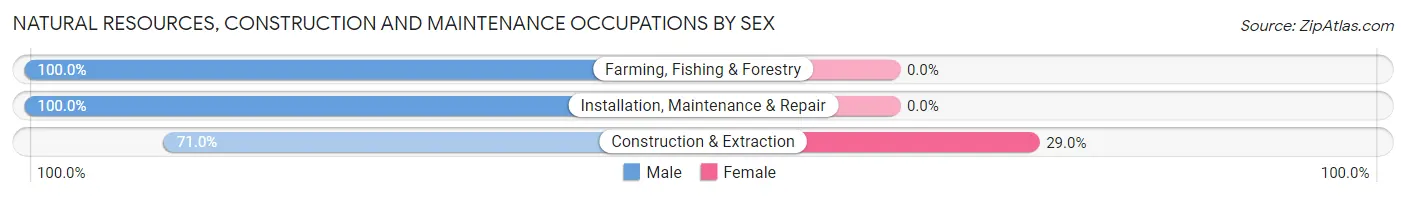
| Occupation | Male | Female |
| Farming, Fishing & Forestry | 45 (100.0%) | 0 (0.0%) |
| Construction & Extraction | 98 (71.0%) | 40 (29.0%) |
| Installation, Maintenance & Repair | 15 (100.0%) | 0 (0.0%) |
| Total (Category) | 158 (79.8%) | 40 (20.2%) |
| Total (Overall) | 717 (56.9%) | 544 (43.1%) |
Production, Transportation and Moving Occupations
The most common Production, Transportation and Moving occupations in Auberry are Production (59 | 4.7%), and Transportation (39 | 3.1%).
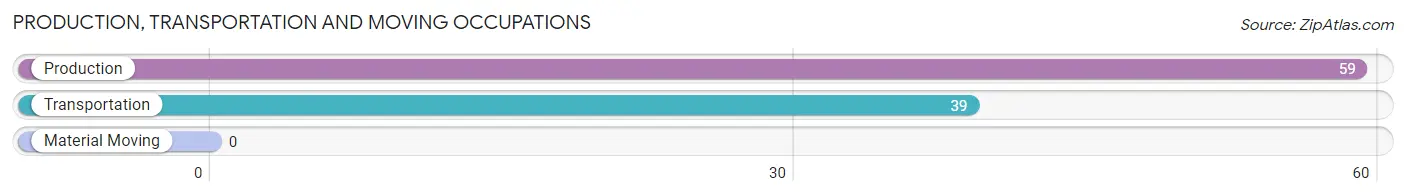
Production, Transportation and Moving Occupations by Sex
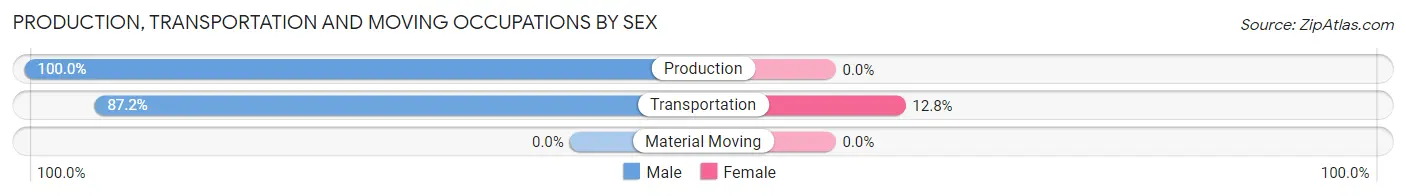
| Occupation | Male | Female |
| Production | 59 (100.0%) | 0 (0.0%) |
| Transportation | 34 (87.2%) | 5 (12.8%) |
| Material Moving | 0 (0.0%) | 0 (0.0%) |
| Total (Category) | 93 (94.9%) | 5 (5.1%) |
| Total (Overall) | 717 (56.9%) | 544 (43.1%) |
Employment Industries by Sex in Auberry
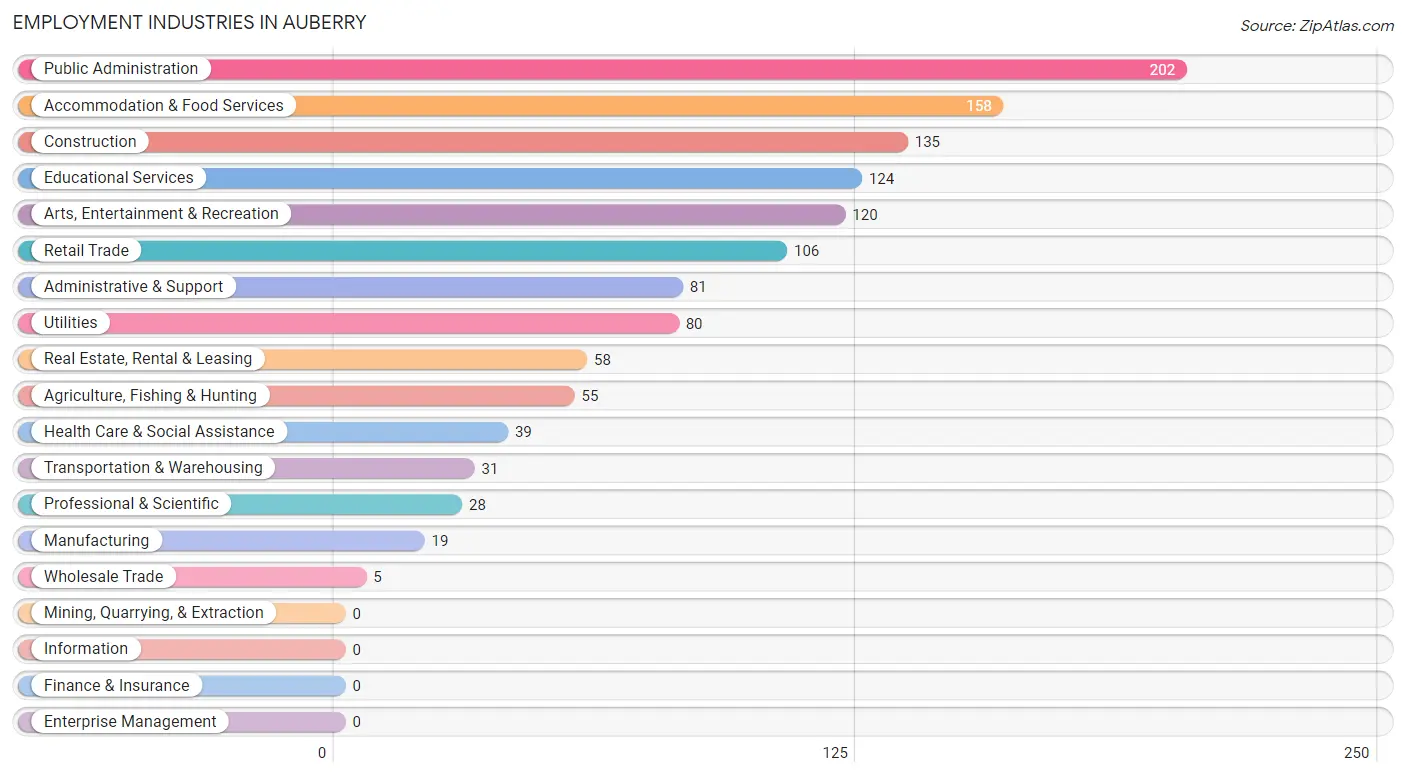
Employment Industries in Auberry
The major employment industries in Auberry include Public Administration (202 | 16.0%), Accommodation & Food Services (158 | 12.5%), Construction (135 | 10.7%), Educational Services (124 | 9.8%), and Arts, Entertainment & Recreation (120 | 9.5%).
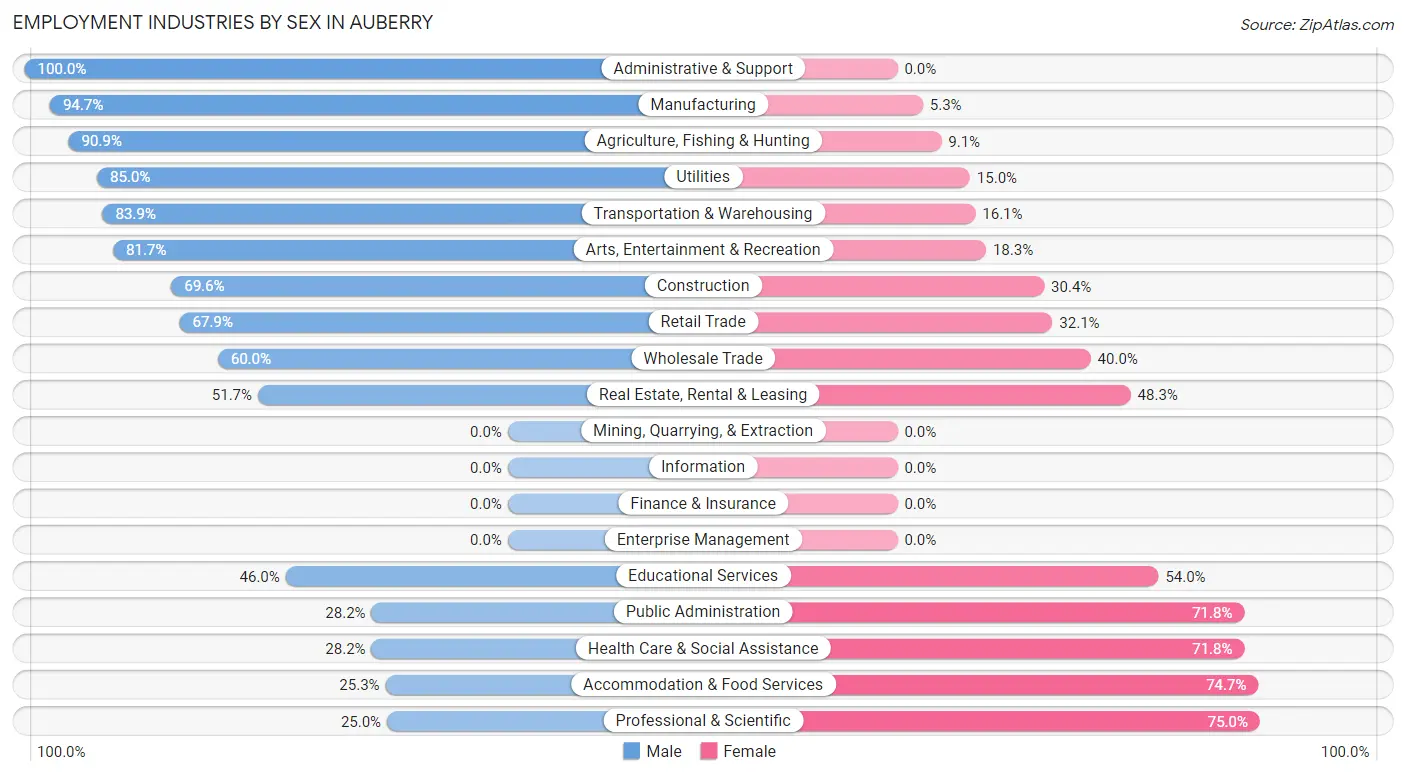
Employment Industries by Sex in Auberry
The Auberry industries that see more men than women are Administrative & Support (100.0%), Manufacturing (94.7%), and Agriculture, Fishing & Hunting (90.9%), whereas the industries that tend to have a higher number of women are Professional & Scientific (75.0%), Accommodation & Food Services (74.7%), and Health Care & Social Assistance (71.8%).
| Industry | Male | Female |
| Agriculture, Fishing & Hunting | 50 (90.9%) | 5 (9.1%) |
| Mining, Quarrying, & Extraction | 0 (0.0%) | 0 (0.0%) |
| Construction | 94 (69.6%) | 41 (30.4%) |
| Manufacturing | 18 (94.7%) | 1 (5.3%) |
| Wholesale Trade | 3 (60.0%) | 2 (40.0%) |
| Retail Trade | 72 (67.9%) | 34 (32.1%) |
| Transportation & Warehousing | 26 (83.9%) | 5 (16.1%) |
| Utilities | 68 (85.0%) | 12 (15.0%) |
| Information | 0 (0.0%) | 0 (0.0%) |
| Finance & Insurance | 0 (0.0%) | 0 (0.0%) |
| Real Estate, Rental & Leasing | 30 (51.7%) | 28 (48.3%) |
| Professional & Scientific | 7 (25.0%) | 21 (75.0%) |
| Enterprise Management | 0 (0.0%) | 0 (0.0%) |
| Administrative & Support | 81 (100.0%) | 0 (0.0%) |
| Educational Services | 57 (46.0%) | 67 (54.0%) |
| Health Care & Social Assistance | 11 (28.2%) | 28 (71.8%) |
| Arts, Entertainment & Recreation | 98 (81.7%) | 22 (18.3%) |
| Accommodation & Food Services | 40 (25.3%) | 118 (74.7%) |
| Public Administration | 57 (28.2%) | 145 (71.8%) |
| Total | 717 (56.9%) | 544 (43.1%) |
Education in Auberry
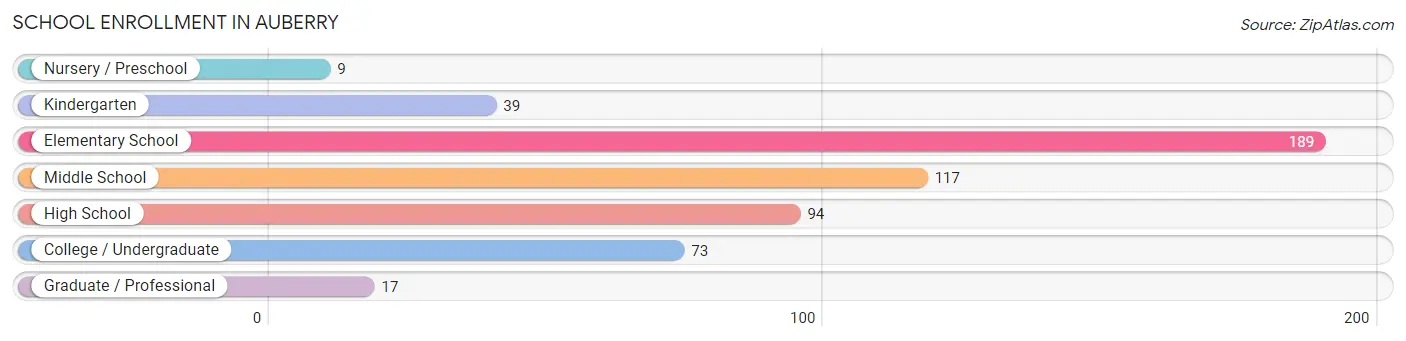
School Enrollment in Auberry
The most common levels of schooling among the 538 students in Auberry are elementary school (189 | 35.1%), middle school (117 | 21.7%), and high school (94 | 17.5%).
| School Level | # Students | % Students |
| Nursery / Preschool | 9 | 1.7% |
| Kindergarten | 39 | 7.2% |
| Elementary School | 189 | 35.1% |
| Middle School | 117 | 21.7% |
| High School | 94 | 17.5% |
| College / Undergraduate | 73 | 13.6% |
| Graduate / Professional | 17 | 3.2% |
| Total | 538 | 100.0% |
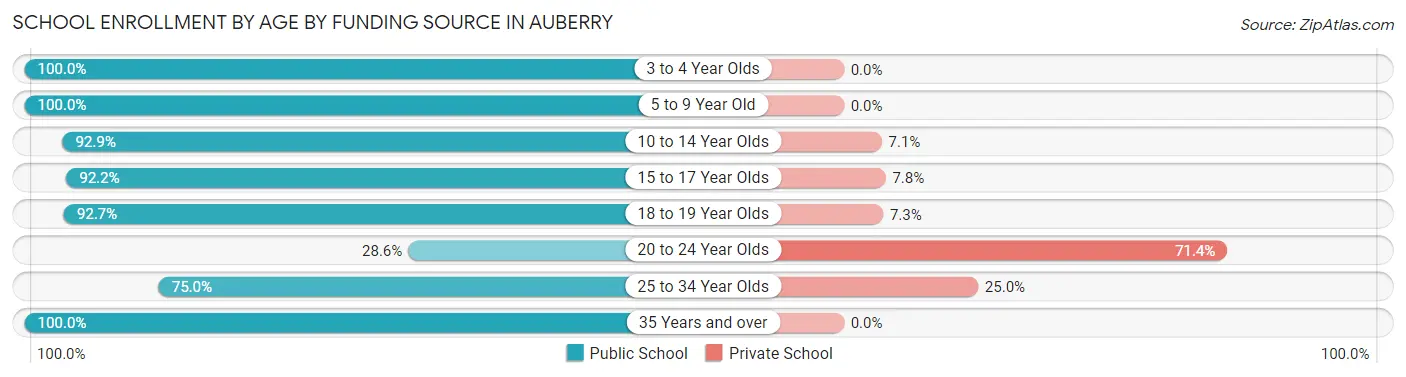
School Enrollment by Age by Funding Source in Auberry
Out of a total of 538 students who are enrolled in schools in Auberry, 44 (8.2%) attend a private institution, while the remaining 494 (91.8%) are enrolled in public schools. The age group of 20 to 24 year olds has the highest likelihood of being enrolled in private schools, with 20 (71.4% in the age bracket) enrolled. Conversely, the age group of 3 to 4 year olds has the lowest likelihood of being enrolled in a private school, with 9 (100.0% in the age bracket) attending a public institution.
| Age Bracket | Public School | Private School |
| 3 to 4 Year Olds | 9 (100.0%) | 0 (0.0%) |
| 5 to 9 Year Old | 174 (100.0%) | 0 (0.0%) |
| 10 to 14 Year Olds | 158 (92.9%) | 12 (7.1%) |
| 15 to 17 Year Olds | 83 (92.2%) | 7 (7.8%) |
| 18 to 19 Year Olds | 38 (92.7%) | 3 (7.3%) |
| 20 to 24 Year Olds | 8 (28.6%) | 20 (71.4%) |
| 25 to 34 Year Olds | 6 (75.0%) | 2 (25.0%) |
| 35 Years and over | 18 (100.0%) | 0 (0.0%) |
| Total | 494 (91.8%) | 44 (8.2%) |
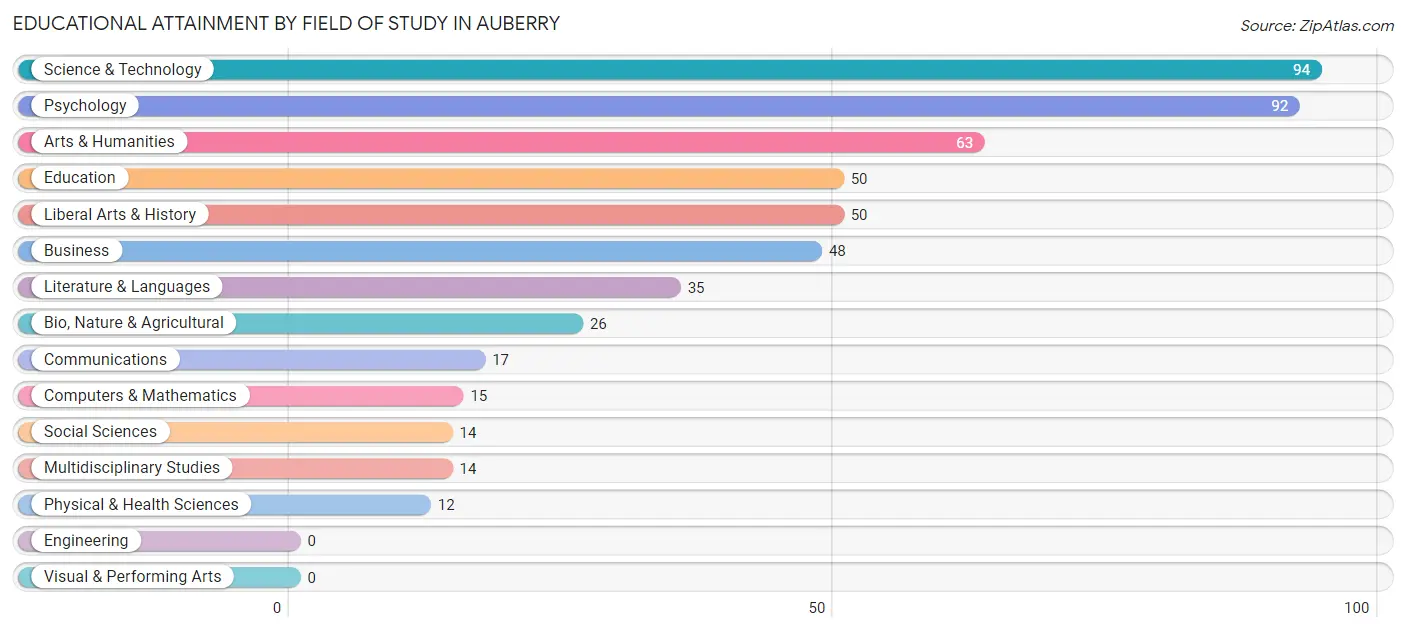
Educational Attainment by Field of Study in Auberry
Science & technology (94 | 17.7%), psychology (92 | 17.4%), arts & humanities (63 | 11.9%), education (50 | 9.4%), and liberal arts & history (50 | 9.4%) are the most common fields of study among 530 individuals in Auberry who have obtained a bachelor's degree or higher.
| Field of Study | # Graduates | % Graduates |
| Computers & Mathematics | 15 | 2.8% |
| Bio, Nature & Agricultural | 26 | 4.9% |
| Physical & Health Sciences | 12 | 2.3% |
| Psychology | 92 | 17.4% |
| Social Sciences | 14 | 2.6% |
| Engineering | 0 | 0.0% |
| Multidisciplinary Studies | 14 | 2.6% |
| Science & Technology | 94 | 17.7% |
| Business | 48 | 9.1% |
| Education | 50 | 9.4% |
| Literature & Languages | 35 | 6.6% |
| Liberal Arts & History | 50 | 9.4% |
| Visual & Performing Arts | 0 | 0.0% |
| Communications | 17 | 3.2% |
| Arts & Humanities | 63 | 11.9% |
| Total | 530 | 100.0% |
Transportation & Commute in Auberry
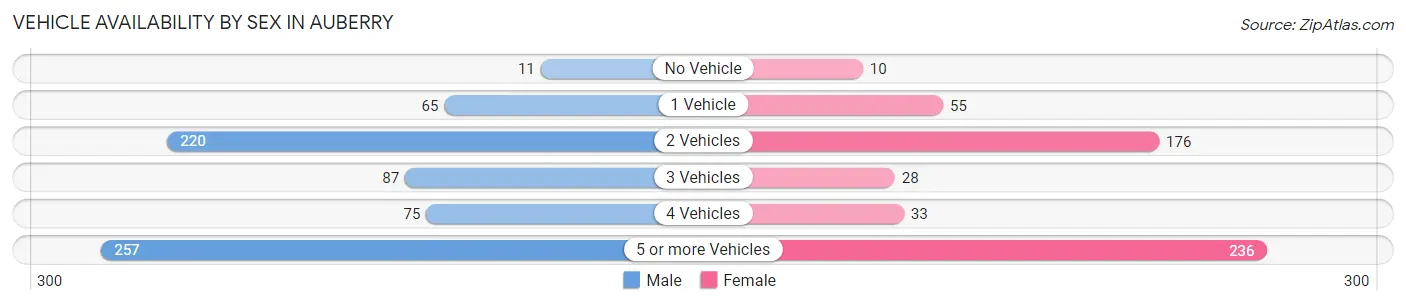
Vehicle Availability by Sex in Auberry
The most prevalent vehicle ownership categories in Auberry are males with 5 or more vehicles (257, accounting for 35.9%) and females with 5 or more vehicles (236, making up 47.8%).
| Vehicles Available | Male | Female |
| No Vehicle | 11 (1.5%) | 10 (1.9%) |
| 1 Vehicle | 65 (9.1%) | 55 (10.2%) |
| 2 Vehicles | 220 (30.8%) | 176 (32.7%) |
| 3 Vehicles | 87 (12.2%) | 28 (5.2%) |
| 4 Vehicles | 75 (10.5%) | 33 (6.1%) |
| 5 or more Vehicles | 257 (35.9%) | 236 (43.9%) |
| Total | 715 (100.0%) | 538 (100.0%) |
Commute Time in Auberry
The most frequently occuring commute durations in Auberry are 10 to 14 minutes (244 commuters, 20.8%), 5 to 9 minutes (202 commuters, 17.2%), and 60 to 89 minutes (153 commuters, 13.0%).
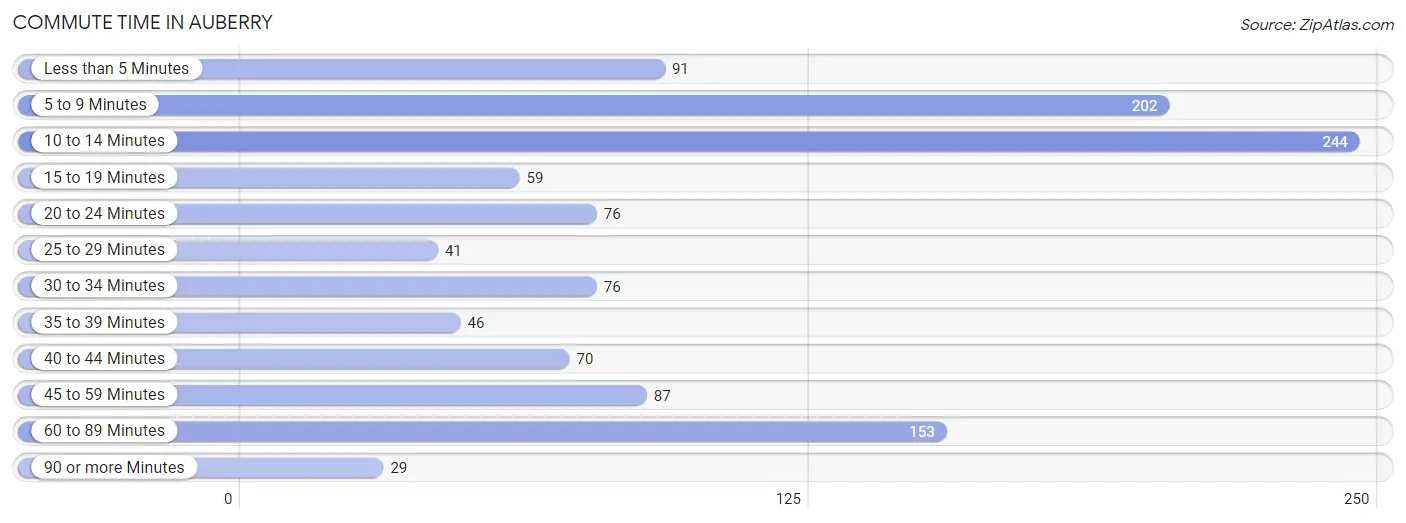
| Commute Time | # Commuters | % Commuters |
| Less than 5 Minutes | 91 | 7.7% |
| 5 to 9 Minutes | 202 | 17.2% |
| 10 to 14 Minutes | 244 | 20.8% |
| 15 to 19 Minutes | 59 | 5.0% |
| 20 to 24 Minutes | 76 | 6.5% |
| 25 to 29 Minutes | 41 | 3.5% |
| 30 to 34 Minutes | 76 | 6.5% |
| 35 to 39 Minutes | 46 | 3.9% |
| 40 to 44 Minutes | 70 | 6.0% |
| 45 to 59 Minutes | 87 | 7.4% |
| 60 to 89 Minutes | 153 | 13.0% |
| 90 or more Minutes | 29 | 2.5% |
Commute Time by Sex in Auberry
The most common commute times in Auberry are 60 to 89 minutes (140 commuters, 20.5%) for males and 5 to 9 minutes (151 commuters, 30.7%) for females.
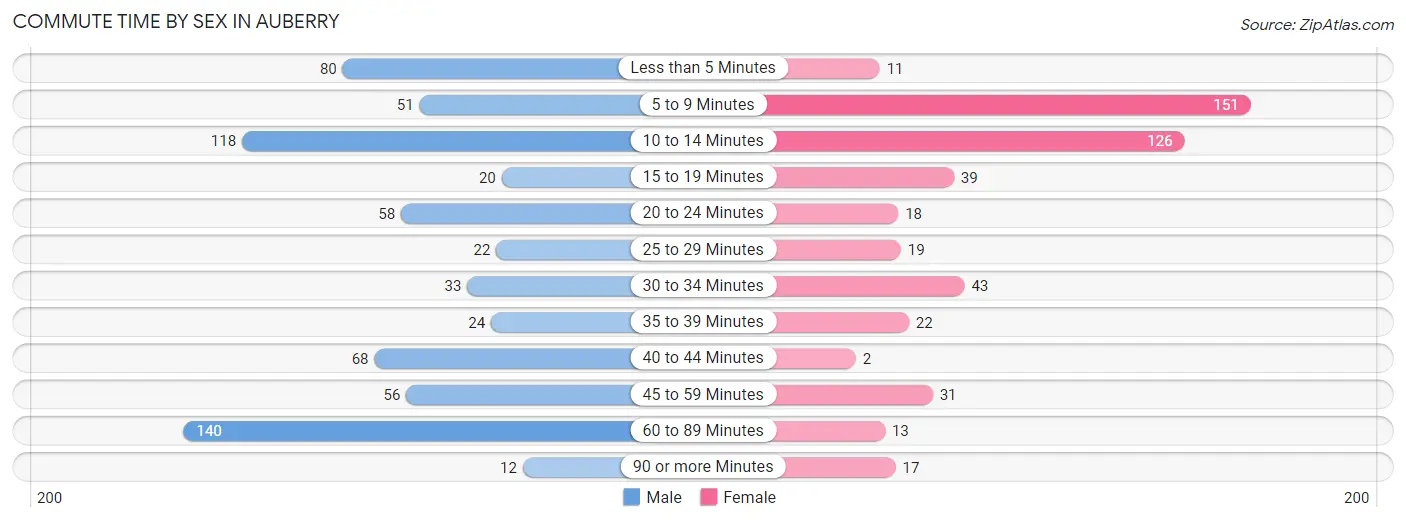
| Commute Time | Male | Female |
| Less than 5 Minutes | 80 (11.7%) | 11 (2.2%) |
| 5 to 9 Minutes | 51 (7.5%) | 151 (30.7%) |
| 10 to 14 Minutes | 118 (17.3%) | 126 (25.6%) |
| 15 to 19 Minutes | 20 (2.9%) | 39 (7.9%) |
| 20 to 24 Minutes | 58 (8.5%) | 18 (3.7%) |
| 25 to 29 Minutes | 22 (3.2%) | 19 (3.9%) |
| 30 to 34 Minutes | 33 (4.8%) | 43 (8.7%) |
| 35 to 39 Minutes | 24 (3.5%) | 22 (4.5%) |
| 40 to 44 Minutes | 68 (10.0%) | 2 (0.4%) |
| 45 to 59 Minutes | 56 (8.2%) | 31 (6.3%) |
| 60 to 89 Minutes | 140 (20.5%) | 13 (2.6%) |
| 90 or more Minutes | 12 (1.8%) | 17 (3.5%) |
Time of Departure to Work by Sex in Auberry
The most frequent times of departure to work in Auberry are 5:00 AM to 5:29 AM (198, 29.0%) for males and 7:00 AM to 7:29 AM (143, 29.1%) for females.
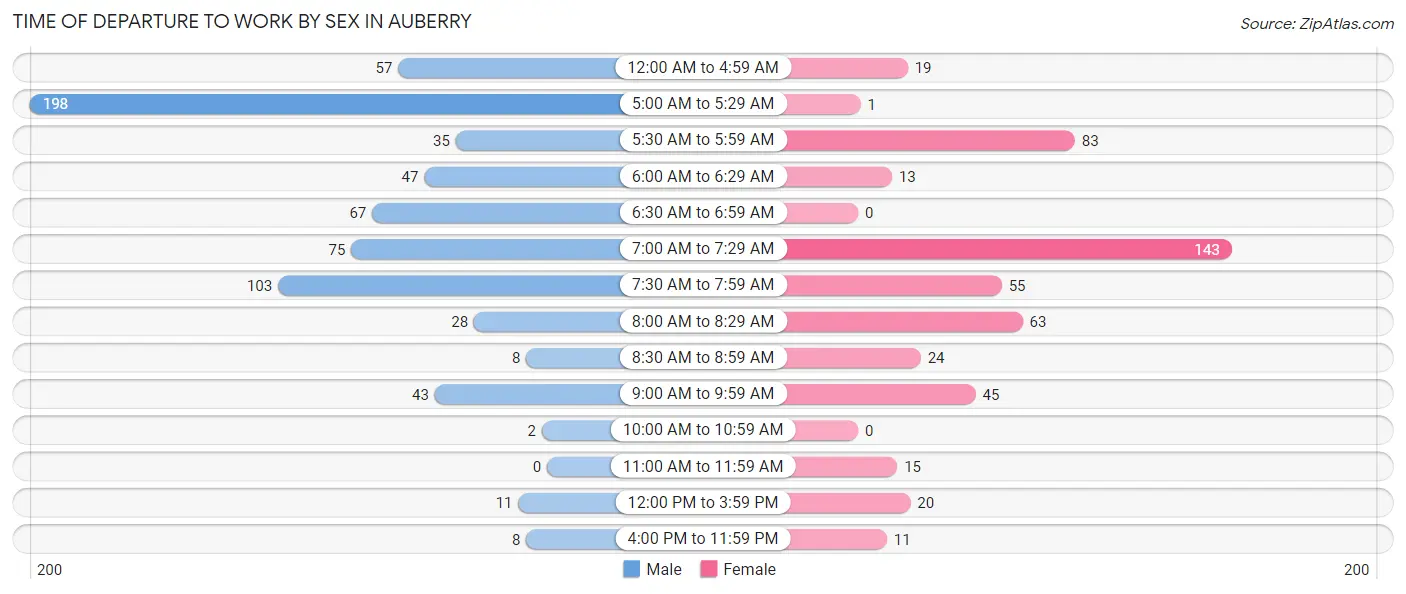
| Time of Departure | Male | Female |
| 12:00 AM to 4:59 AM | 57 (8.4%) | 19 (3.9%) |
| 5:00 AM to 5:29 AM | 198 (29.0%) | 1 (0.2%) |
| 5:30 AM to 5:59 AM | 35 (5.1%) | 83 (16.9%) |
| 6:00 AM to 6:29 AM | 47 (6.9%) | 13 (2.6%) |
| 6:30 AM to 6:59 AM | 67 (9.8%) | 0 (0.0%) |
| 7:00 AM to 7:29 AM | 75 (11.0%) | 143 (29.1%) |
| 7:30 AM to 7:59 AM | 103 (15.1%) | 55 (11.2%) |
| 8:00 AM to 8:29 AM | 28 (4.1%) | 63 (12.8%) |
| 8:30 AM to 8:59 AM | 8 (1.2%) | 24 (4.9%) |
| 9:00 AM to 9:59 AM | 43 (6.3%) | 45 (9.1%) |
| 10:00 AM to 10:59 AM | 2 (0.3%) | 0 (0.0%) |
| 11:00 AM to 11:59 AM | 0 (0.0%) | 15 (3.0%) |
| 12:00 PM to 3:59 PM | 11 (1.6%) | 20 (4.1%) |
| 4:00 PM to 11:59 PM | 8 (1.2%) | 11 (2.2%) |
| Total | 682 (100.0%) | 492 (100.0%) |
Housing Occupancy in Auberry
Occupancy by Ownership in Auberry
Of the total 1,137 dwellings in Auberry, owner-occupied units account for 890 (78.3%), while renter-occupied units make up 247 (21.7%).
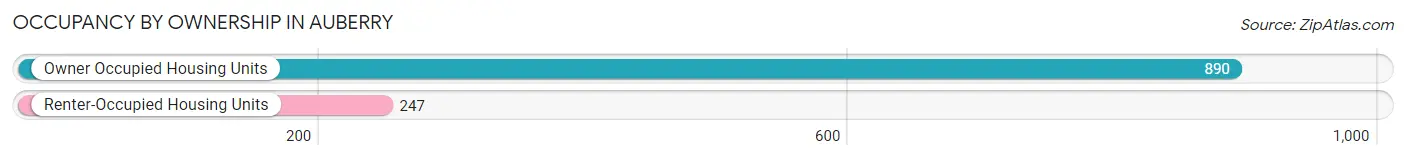
| Occupancy | # Housing Units | % Housing Units |
| Owner Occupied Housing Units | 890 | 78.3% |
| Renter-Occupied Housing Units | 247 | 21.7% |
| Total Occupied Housing Units | 1,137 | 100.0% |
Occupancy by Household Size in Auberry
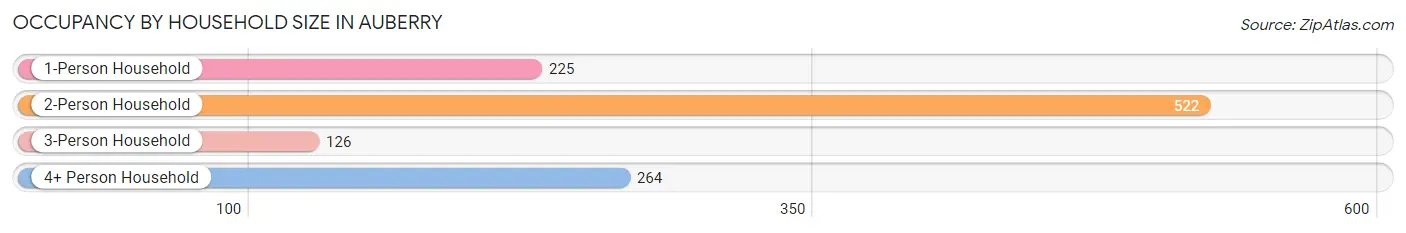
| Household Size | # Housing Units | % Housing Units |
| 1-Person Household | 225 | 19.8% |
| 2-Person Household | 522 | 45.9% |
| 3-Person Household | 126 | 11.1% |
| 4+ Person Household | 264 | 23.2% |
| Total Housing Units | 1,137 | 100.0% |
Occupancy by Ownership by Household Size in Auberry
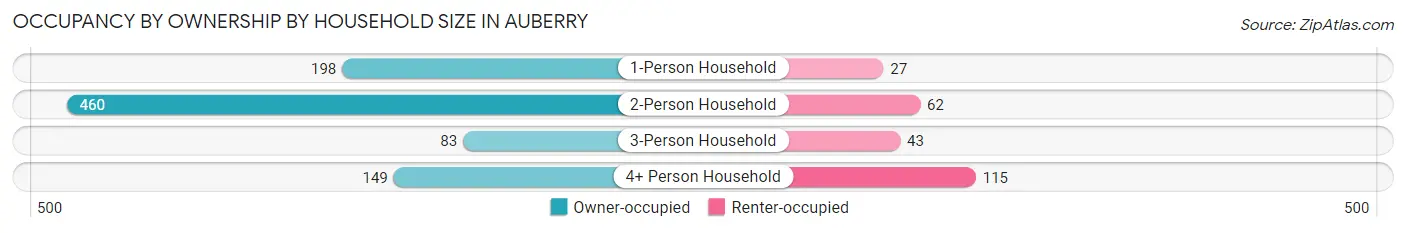
| Household Size | Owner-occupied | Renter-occupied |
| 1-Person Household | 198 (88.0%) | 27 (12.0%) |
| 2-Person Household | 460 (88.1%) | 62 (11.9%) |
| 3-Person Household | 83 (65.9%) | 43 (34.1%) |
| 4+ Person Household | 149 (56.4%) | 115 (43.6%) |
| Total Housing Units | 890 (78.3%) | 247 (21.7%) |
Occupancy by Educational Attainment in Auberry
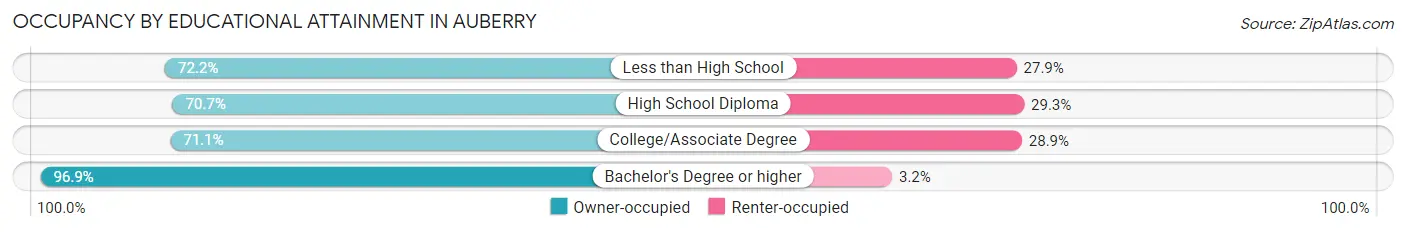
| Household Size | Owner-occupied | Renter-occupied |
| Less than High School | 57 (72.2%) | 22 (27.9%) |
| High School Diploma | 147 (70.7%) | 61 (29.3%) |
| College/Associate Degree | 379 (71.1%) | 154 (28.9%) |
| Bachelor's Degree or higher | 307 (96.9%) | 10 (3.2%) |
Occupancy by Age of Householder in Auberry
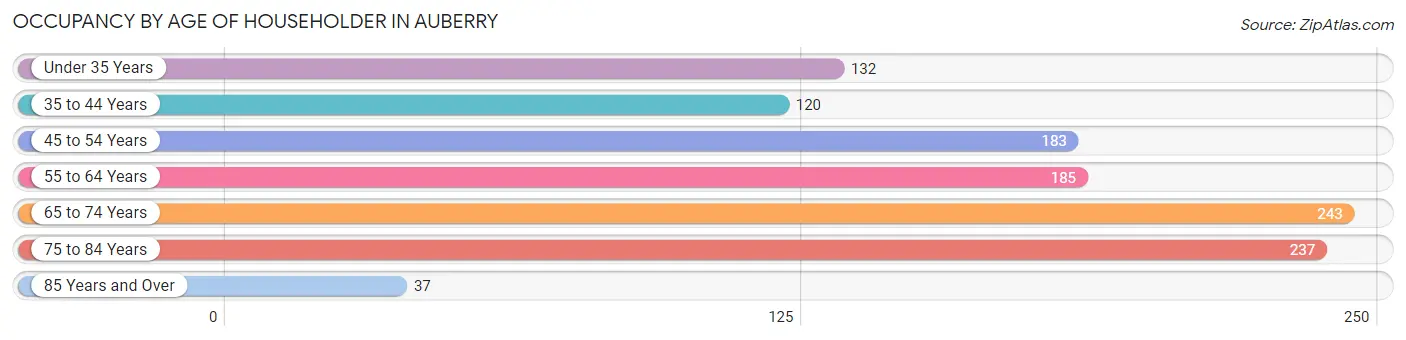
| Age Bracket | # Households | % Households |
| Under 35 Years | 132 | 11.6% |
| 35 to 44 Years | 120 | 10.5% |
| 45 to 54 Years | 183 | 16.1% |
| 55 to 64 Years | 185 | 16.3% |
| 65 to 74 Years | 243 | 21.4% |
| 75 to 84 Years | 237 | 20.8% |
| 85 Years and Over | 37 | 3.3% |
| Total | 1,137 | 100.0% |
Housing Finances in Auberry
Median Income by Occupancy in Auberry
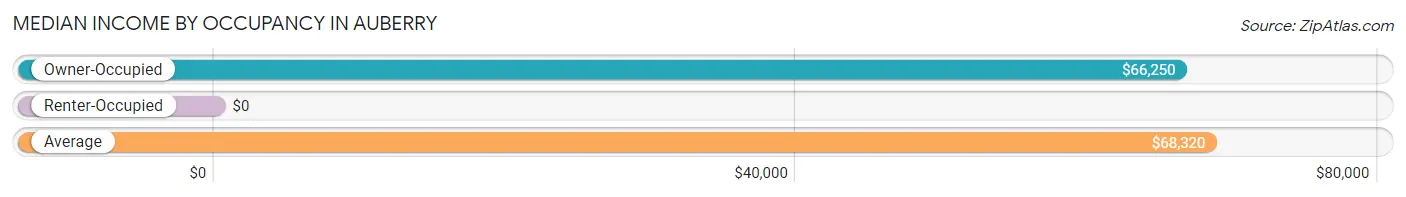
| Occupancy Type | # Households | Median Income |
| Owner-Occupied | 890 (78.3%) | $66,250 |
| Renter-Occupied | 247 (21.7%) | $0 |
| Average | 1,137 (100.0%) | $68,320 |
Occupancy by Householder Income Bracket in Auberry
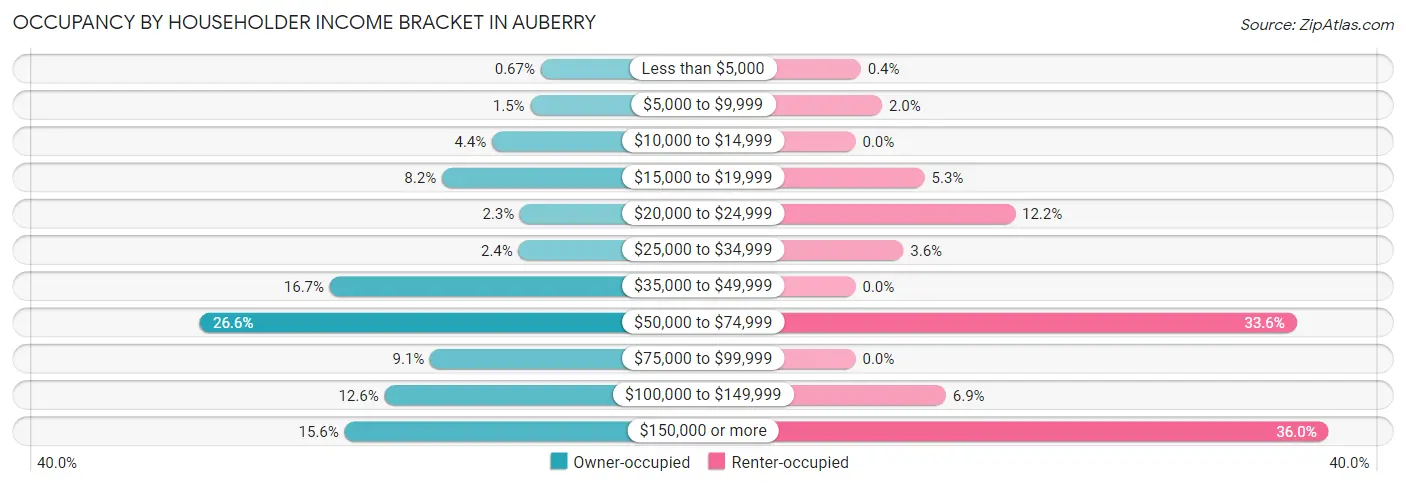
| Income Bracket | Owner-occupied | Renter-occupied |
| Less than $5,000 | 6 (0.7%) | 1 (0.4%) |
| $5,000 to $9,999 | 13 (1.5%) | 5 (2.0%) |
| $10,000 to $14,999 | 39 (4.4%) | 0 (0.0%) |
| $15,000 to $19,999 | 73 (8.2%) | 13 (5.3%) |
| $20,000 to $24,999 | 20 (2.2%) | 30 (12.1%) |
| $25,000 to $34,999 | 21 (2.4%) | 9 (3.6%) |
| $35,000 to $49,999 | 149 (16.7%) | 0 (0.0%) |
| $50,000 to $74,999 | 237 (26.6%) | 83 (33.6%) |
| $75,000 to $99,999 | 81 (9.1%) | 0 (0.0%) |
| $100,000 to $149,999 | 112 (12.6%) | 17 (6.9%) |
| $150,000 or more | 139 (15.6%) | 89 (36.0%) |
| Total | 890 (100.0%) | 247 (100.0%) |
Monthly Housing Cost Tiers in Auberry
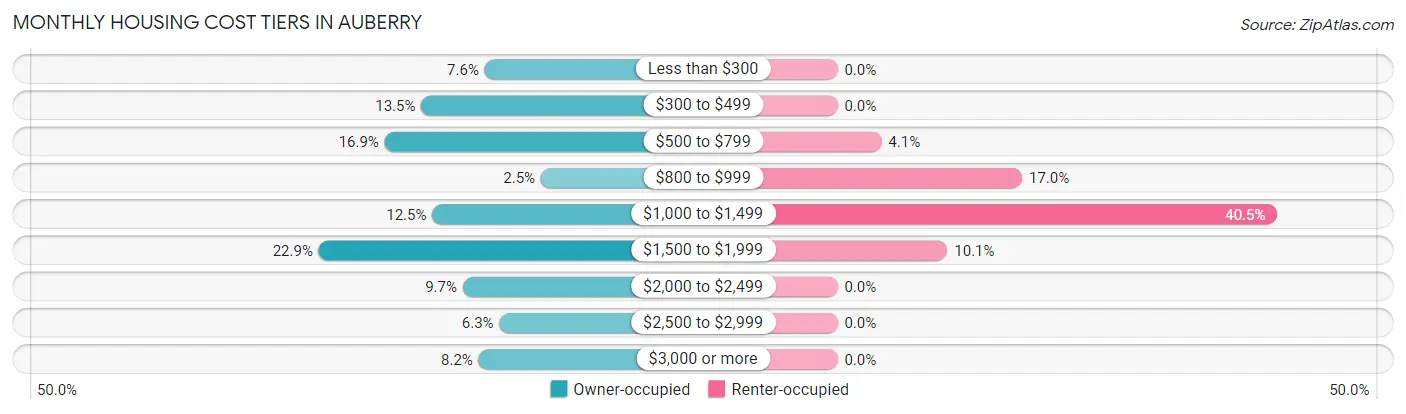
| Monthly Cost | Owner-occupied | Renter-occupied |
| Less than $300 | 68 (7.6%) | 0 (0.0%) |
| $300 to $499 | 120 (13.5%) | 0 (0.0%) |
| $500 to $799 | 150 (16.9%) | 10 (4.1%) |
| $800 to $999 | 22 (2.5%) | 42 (17.0%) |
| $1,000 to $1,499 | 111 (12.5%) | 100 (40.5%) |
| $1,500 to $1,999 | 204 (22.9%) | 25 (10.1%) |
| $2,000 to $2,499 | 86 (9.7%) | 0 (0.0%) |
| $2,500 to $2,999 | 56 (6.3%) | 0 (0.0%) |
| $3,000 or more | 73 (8.2%) | 0 (0.0%) |
| Total | 890 (100.0%) | 247 (100.0%) |
Physical Housing Characteristics in Auberry
Housing Structures in Auberry
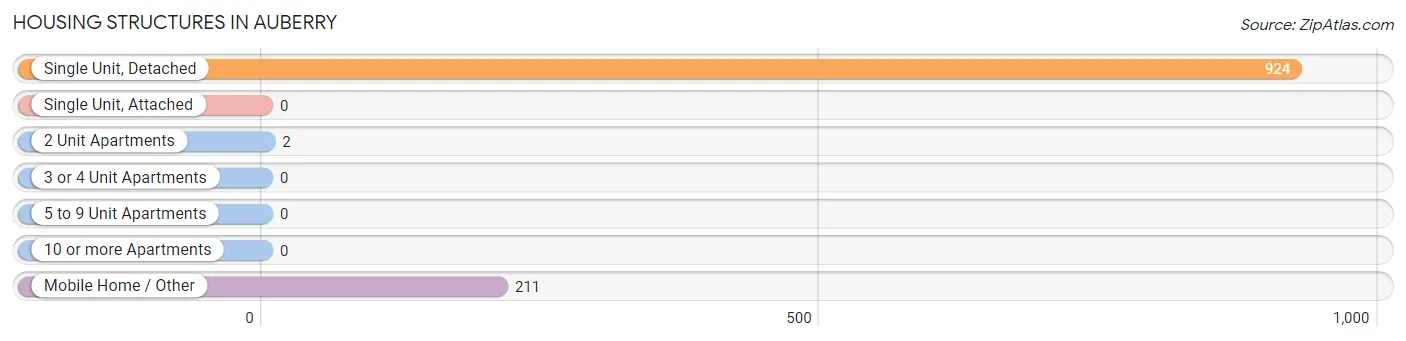
| Structure Type | # Housing Units | % Housing Units |
| Single Unit, Detached | 924 | 81.3% |
| Single Unit, Attached | 0 | 0.0% |
| 2 Unit Apartments | 2 | 0.2% |
| 3 or 4 Unit Apartments | 0 | 0.0% |
| 5 to 9 Unit Apartments | 0 | 0.0% |
| 10 or more Apartments | 0 | 0.0% |
| Mobile Home / Other | 211 | 18.6% |
| Total | 1,137 | 100.0% |
Housing Structures by Occupancy in Auberry
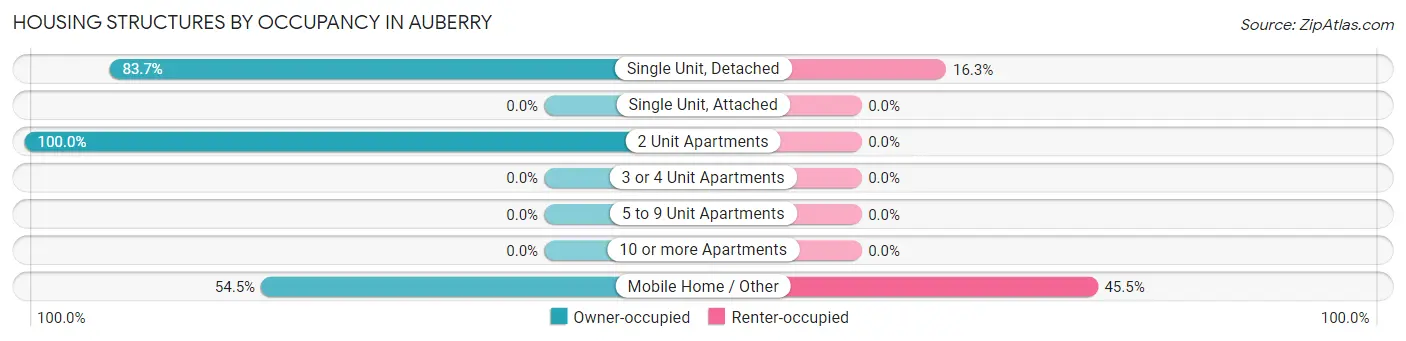
| Structure Type | Owner-occupied | Renter-occupied |
| Single Unit, Detached | 773 (83.7%) | 151 (16.3%) |
| Single Unit, Attached | 0 (0.0%) | 0 (0.0%) |
| 2 Unit Apartments | 2 (100.0%) | 0 (0.0%) |
| 3 or 4 Unit Apartments | 0 (0.0%) | 0 (0.0%) |
| 5 to 9 Unit Apartments | 0 (0.0%) | 0 (0.0%) |
| 10 or more Apartments | 0 (0.0%) | 0 (0.0%) |
| Mobile Home / Other | 115 (54.5%) | 96 (45.5%) |
| Total | 890 (78.3%) | 247 (21.7%) |
Housing Structures by Number of Rooms in Auberry
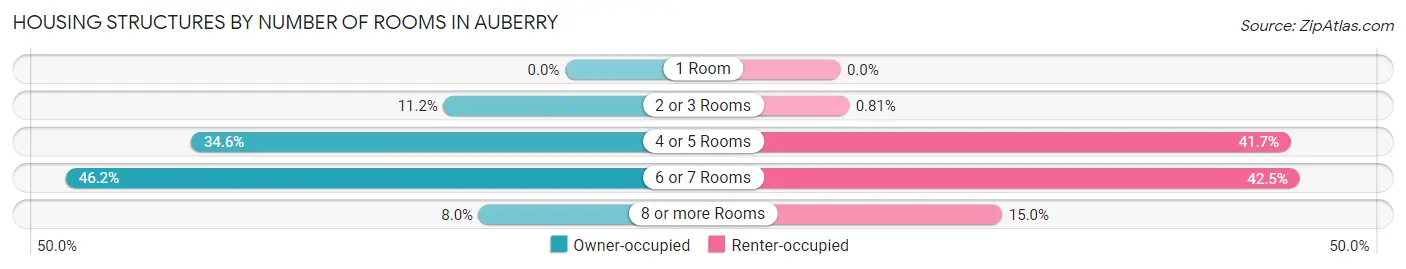
| Number of Rooms | Owner-occupied | Renter-occupied |
| 1 Room | 0 (0.0%) | 0 (0.0%) |
| 2 or 3 Rooms | 100 (11.2%) | 2 (0.8%) |
| 4 or 5 Rooms | 308 (34.6%) | 103 (41.7%) |
| 6 or 7 Rooms | 411 (46.2%) | 105 (42.5%) |
| 8 or more Rooms | 71 (8.0%) | 37 (15.0%) |
| Total | 890 (100.0%) | 247 (100.0%) |
Housing Structure by Heating Type in Auberry
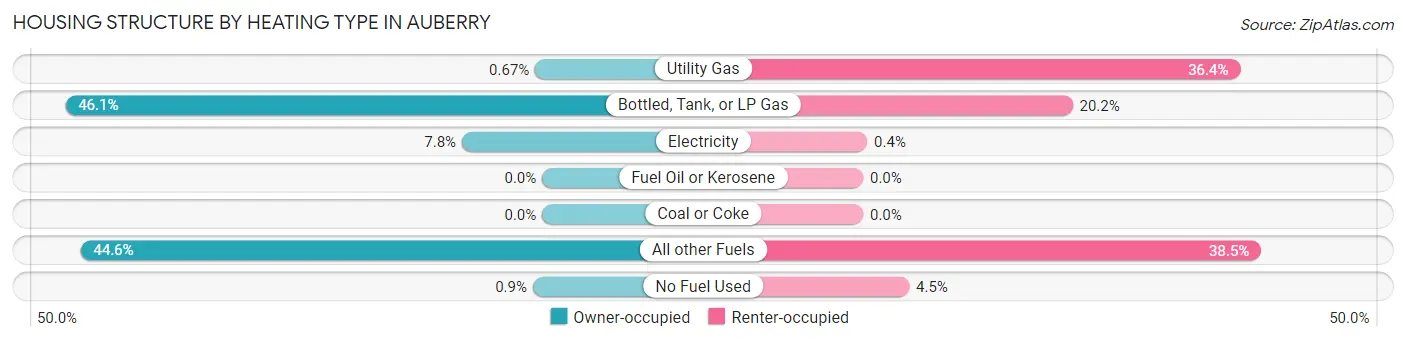
| Heating Type | Owner-occupied | Renter-occupied |
| Utility Gas | 6 (0.7%) | 90 (36.4%) |
| Bottled, Tank, or LP Gas | 410 (46.1%) | 50 (20.2%) |
| Electricity | 69 (7.7%) | 1 (0.4%) |
| Fuel Oil or Kerosene | 0 (0.0%) | 0 (0.0%) |
| Coal or Coke | 0 (0.0%) | 0 (0.0%) |
| All other Fuels | 397 (44.6%) | 95 (38.5%) |
| No Fuel Used | 8 (0.9%) | 11 (4.4%) |
| Total | 890 (100.0%) | 247 (100.0%) |
Household Vehicle Usage in Auberry
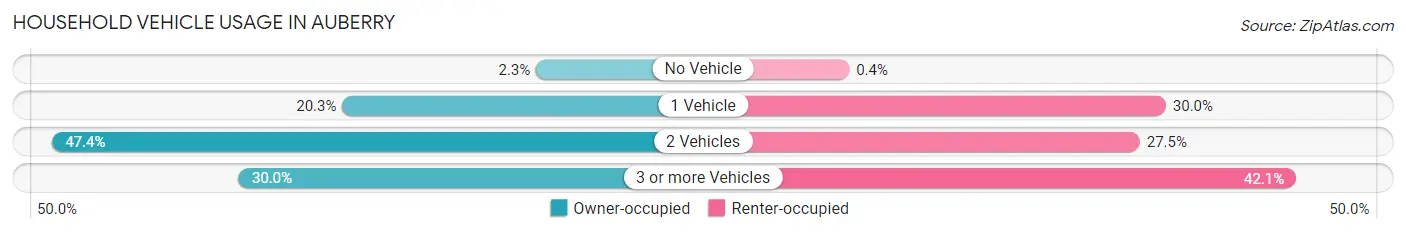
| Vehicles per Household | Owner-occupied | Renter-occupied |
| No Vehicle | 20 (2.2%) | 1 (0.4%) |
| 1 Vehicle | 181 (20.3%) | 74 (30.0%) |
| 2 Vehicles | 422 (47.4%) | 68 (27.5%) |
| 3 or more Vehicles | 267 (30.0%) | 104 (42.1%) |
| Total | 890 (100.0%) | 247 (100.0%) |
Real Estate & Mortgages in Auberry
Real Estate and Mortgage Overview in Auberry
| Characteristic | Without Mortgage | With Mortgage |
| Housing Units | 405 | 485 |
| Median Property Value | $349,200 | $328,700 |
| Median Household Income | $38,482 | $108 |
| Monthly Housing Costs | $533 | $73 |
| Real Estate Taxes | $2,262 | $6 |
Property Value by Mortgage Status in Auberry
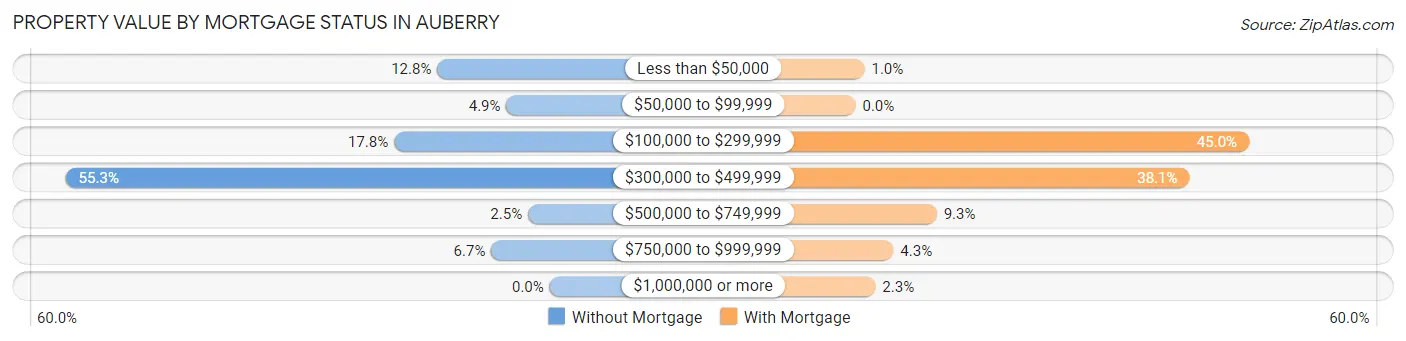
| Property Value | Without Mortgage | With Mortgage |
| Less than $50,000 | 52 (12.8%) | 5 (1.0%) |
| $50,000 to $99,999 | 20 (4.9%) | 0 (0.0%) |
| $100,000 to $299,999 | 72 (17.8%) | 218 (45.0%) |
| $300,000 to $499,999 | 224 (55.3%) | 185 (38.1%) |
| $500,000 to $749,999 | 10 (2.5%) | 45 (9.3%) |
| $750,000 to $999,999 | 27 (6.7%) | 21 (4.3%) |
| $1,000,000 or more | 0 (0.0%) | 11 (2.3%) |
| Total | 405 (100.0%) | 485 (100.0%) |
Household Income by Mortgage Status in Auberry
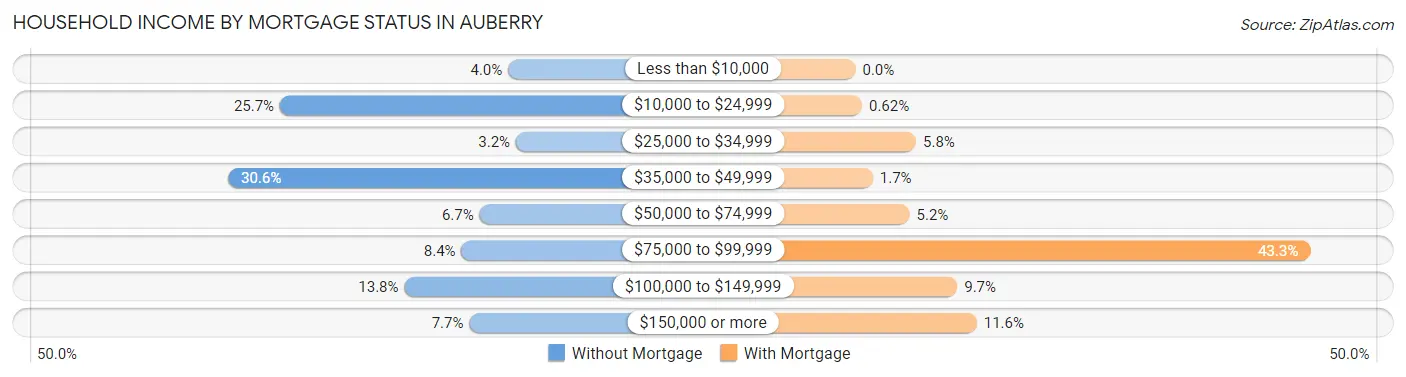
| Household Income | Without Mortgage | With Mortgage |
| Less than $10,000 | 16 (4.0%) | 0 (0.0%) |
| $10,000 to $24,999 | 104 (25.7%) | 3 (0.6%) |
| $25,000 to $34,999 | 13 (3.2%) | 28 (5.8%) |
| $35,000 to $49,999 | 124 (30.6%) | 8 (1.7%) |
| $50,000 to $74,999 | 27 (6.7%) | 25 (5.1%) |
| $75,000 to $99,999 | 34 (8.4%) | 210 (43.3%) |
| $100,000 to $149,999 | 56 (13.8%) | 47 (9.7%) |
| $150,000 or more | 31 (7.6%) | 56 (11.6%) |
| Total | 405 (100.0%) | 485 (100.0%) |
Property Value to Household Income Ratio in Auberry
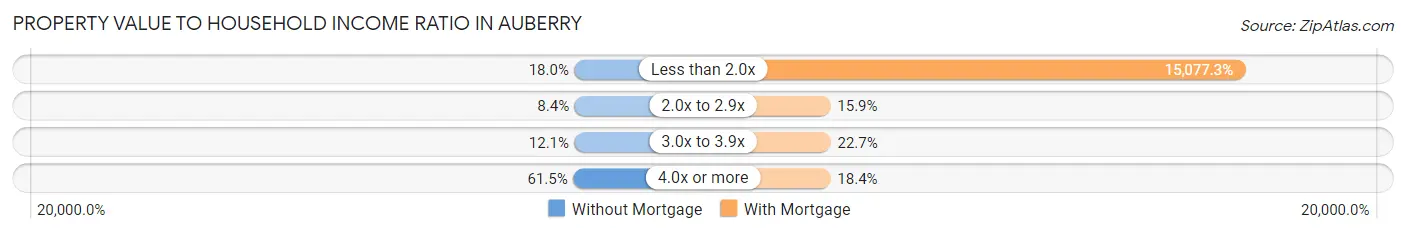
| Value-to-Income Ratio | Without Mortgage | With Mortgage |
| Less than 2.0x | 73 (18.0%) | 73,125 (15,077.3%) |
| 2.0x to 2.9x | 34 (8.4%) | 77 (15.9%) |
| 3.0x to 3.9x | 49 (12.1%) | 110 (22.7%) |
| 4.0x or more | 249 (61.5%) | 89 (18.3%) |
| Total | 405 (100.0%) | 485 (100.0%) |
Real Estate Taxes by Mortgage Status in Auberry
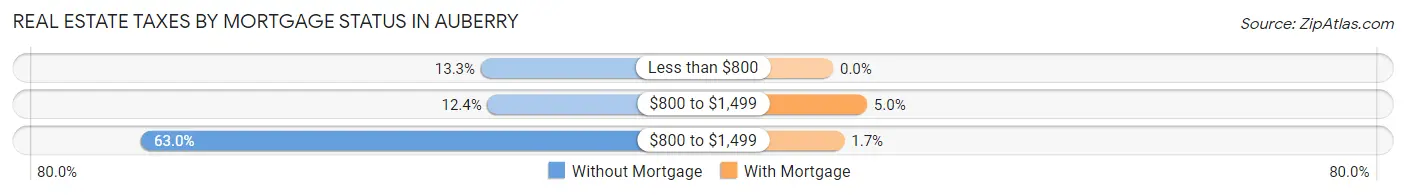
| Property Taxes | Without Mortgage | With Mortgage |
| Less than $800 | 54 (13.3%) | 0 (0.0%) |
| $800 to $1,499 | 50 (12.3%) | 24 (5.0%) |
| $800 to $1,499 | 255 (63.0%) | 8 (1.7%) |
| Total | 405 (100.0%) | 485 (100.0%) |
Health & Disability in Auberry
Health Insurance Coverage by Age in Auberry
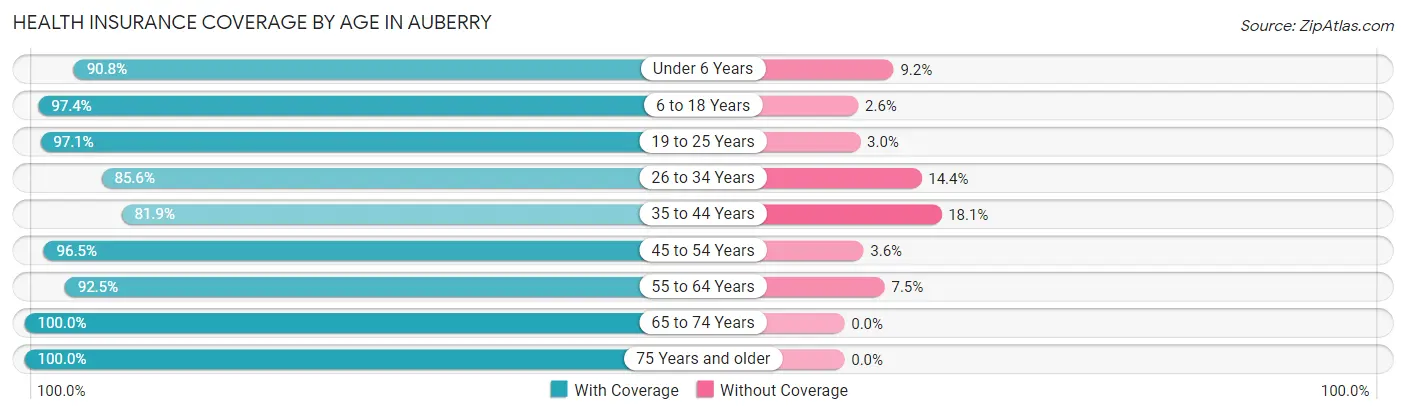
| Age Bracket | With Coverage | Without Coverage |
| Under 6 Years | 109 (90.8%) | 11 (9.2%) |
| 6 to 18 Years | 415 (97.4%) | 11 (2.6%) |
| 19 to 25 Years | 263 (97.1%) | 8 (2.9%) |
| 26 to 34 Years | 316 (85.6%) | 53 (14.4%) |
| 35 to 44 Years | 204 (81.9%) | 45 (18.1%) |
| 45 to 54 Years | 380 (96.5%) | 14 (3.5%) |
| 55 to 64 Years | 333 (92.5%) | 27 (7.5%) |
| 65 to 74 Years | 390 (100.0%) | 0 (0.0%) |
| 75 Years and older | 453 (100.0%) | 0 (0.0%) |
| Total | 2,863 (94.4%) | 169 (5.6%) |
Health Insurance Coverage by Citizenship Status in Auberry
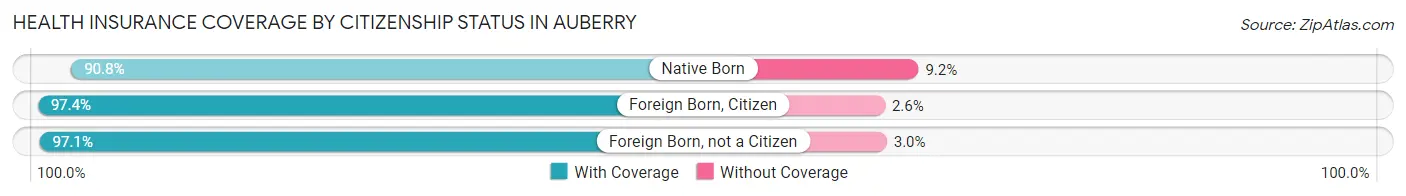
| Citizenship Status | With Coverage | Without Coverage |
| Native Born | 109 (90.8%) | 11 (9.2%) |
| Foreign Born, Citizen | 415 (97.4%) | 11 (2.6%) |
| Foreign Born, not a Citizen | 263 (97.1%) | 8 (2.9%) |
Health Insurance Coverage by Household Income in Auberry
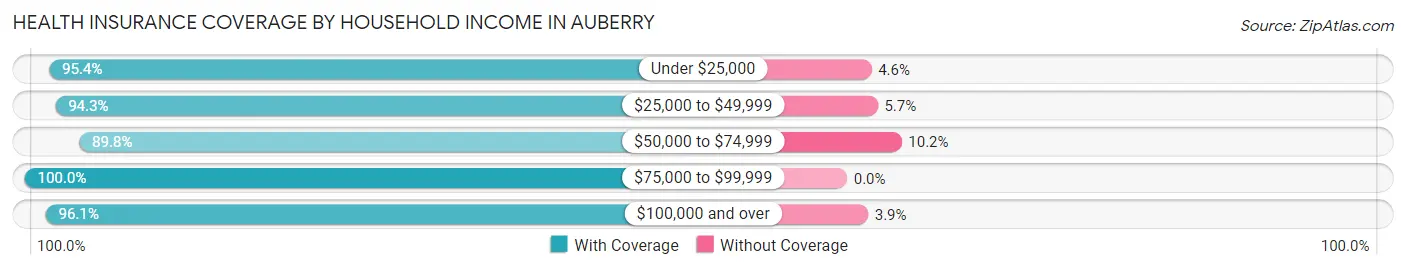
| Household Income | With Coverage | Without Coverage |
| Under $25,000 | 333 (95.4%) | 16 (4.6%) |
| $25,000 to $49,999 | 345 (94.3%) | 21 (5.7%) |
| $50,000 to $74,999 | 694 (89.8%) | 79 (10.2%) |
| $75,000 to $99,999 | 210 (100.0%) | 0 (0.0%) |
| $100,000 and over | 1,272 (96.1%) | 52 (3.9%) |
Public vs Private Health Insurance Coverage by Age in Auberry
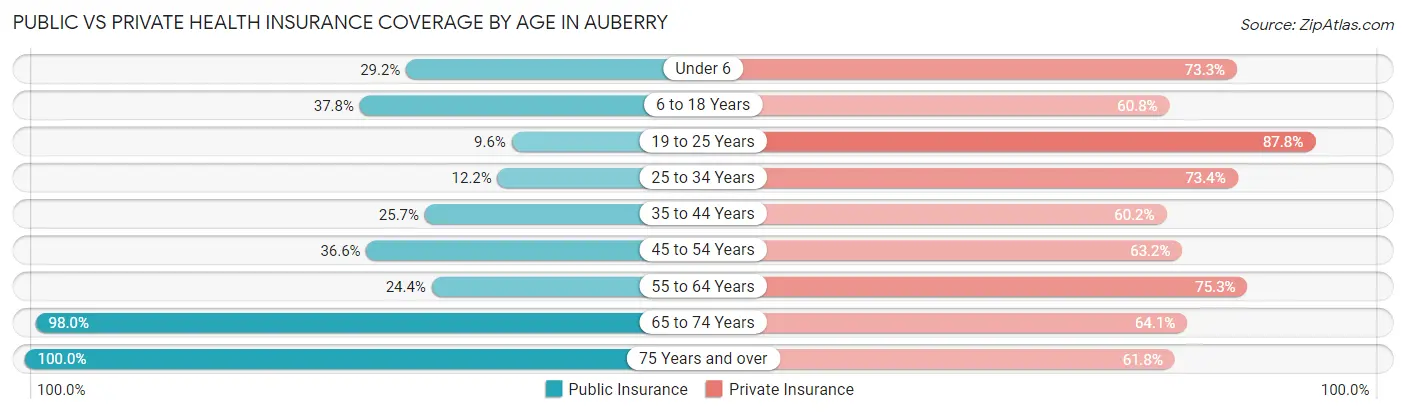
| Age Bracket | Public Insurance | Private Insurance |
| Under 6 | 35 (29.2%) | 88 (73.3%) |
| 6 to 18 Years | 161 (37.8%) | 259 (60.8%) |
| 19 to 25 Years | 26 (9.6%) | 238 (87.8%) |
| 25 to 34 Years | 45 (12.2%) | 271 (73.4%) |
| 35 to 44 Years | 64 (25.7%) | 150 (60.2%) |
| 45 to 54 Years | 144 (36.5%) | 249 (63.2%) |
| 55 to 64 Years | 88 (24.4%) | 271 (75.3%) |
| 65 to 74 Years | 382 (98.0%) | 250 (64.1%) |
| 75 Years and over | 453 (100.0%) | 280 (61.8%) |
| Total | 1,398 (46.1%) | 2,056 (67.8%) |
Disability Status by Sex by Age in Auberry
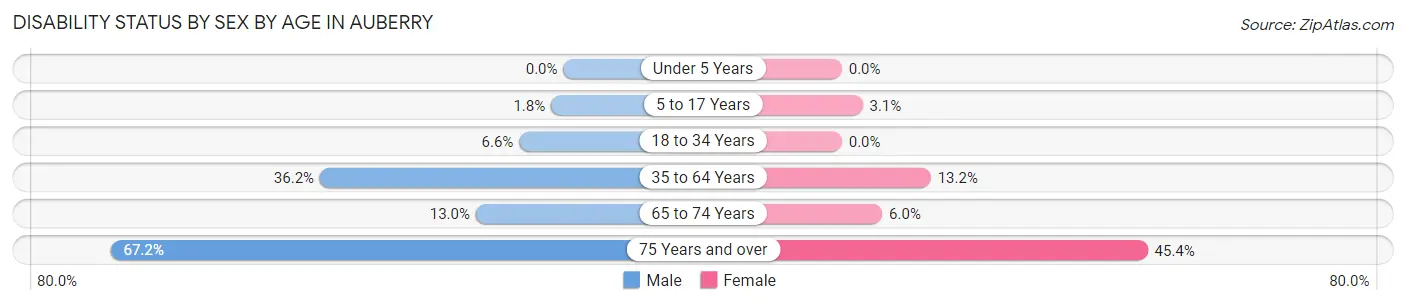
| Age Bracket | Male | Female |
| Under 5 Years | 0 (0.0%) | 0 (0.0%) |
| 5 to 17 Years | 4 (1.8%) | 7 (3.1%) |
| 18 to 34 Years | 28 (6.6%) | 0 (0.0%) |
| 35 to 64 Years | 171 (36.1%) | 70 (13.2%) |
| 65 to 74 Years | 29 (13.0%) | 10 (6.0%) |
| 75 Years and over | 158 (67.2%) | 99 (45.4%) |
Disability Class by Sex by Age in Auberry
Disability Class: Hearing Difficulty
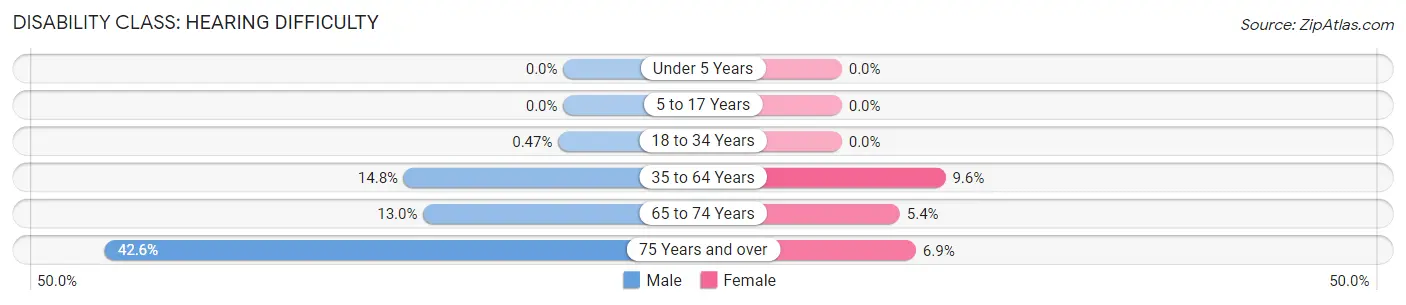
| Age Bracket | Male | Female |
| Under 5 Years | 0 (0.0%) | 0 (0.0%) |
| 5 to 17 Years | 0 (0.0%) | 0 (0.0%) |
| 18 to 34 Years | 2 (0.5%) | 0 (0.0%) |
| 35 to 64 Years | 70 (14.8%) | 51 (9.6%) |
| 65 to 74 Years | 29 (13.0%) | 9 (5.4%) |
| 75 Years and over | 100 (42.5%) | 15 (6.9%) |
Disability Class: Vision Difficulty
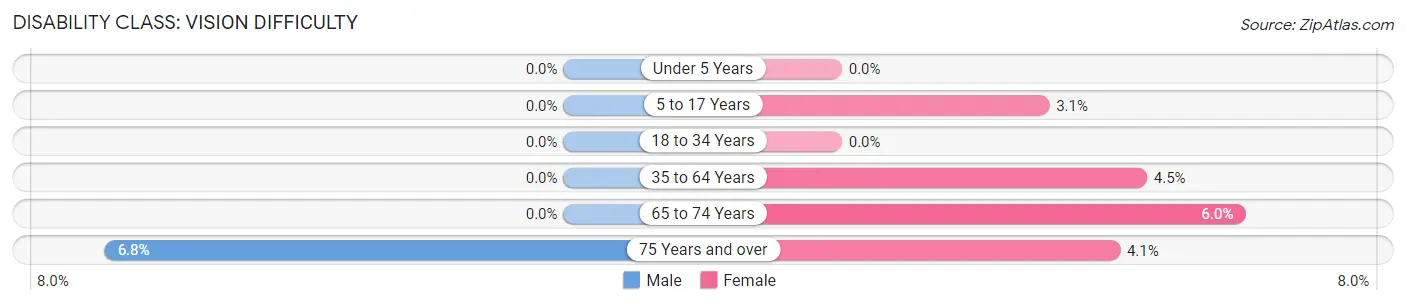
| Age Bracket | Male | Female |
| Under 5 Years | 0 (0.0%) | 0 (0.0%) |
| 5 to 17 Years | 0 (0.0%) | 7 (3.1%) |
| 18 to 34 Years | 0 (0.0%) | 0 (0.0%) |
| 35 to 64 Years | 0 (0.0%) | 24 (4.5%) |
| 65 to 74 Years | 0 (0.0%) | 10 (6.0%) |
| 75 Years and over | 16 (6.8%) | 9 (4.1%) |
Disability Class: Cognitive Difficulty

| Age Bracket | Male | Female |
| 5 to 17 Years | 4 (1.8%) | 2 (0.9%) |
| 18 to 34 Years | 18 (4.2%) | 0 (0.0%) |
| 35 to 64 Years | 109 (23.0%) | 4 (0.7%) |
| 65 to 74 Years | 0 (0.0%) | 0 (0.0%) |
| 75 Years and over | 15 (6.4%) | 5 (2.3%) |
Disability Class: Ambulatory Difficulty
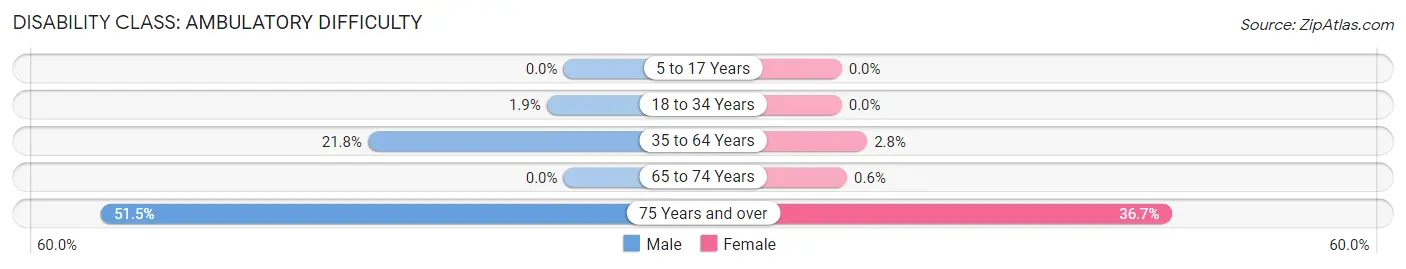
| Age Bracket | Male | Female |
| 5 to 17 Years | 0 (0.0%) | 0 (0.0%) |
| 18 to 34 Years | 8 (1.9%) | 0 (0.0%) |
| 35 to 64 Years | 103 (21.8%) | 15 (2.8%) |
| 65 to 74 Years | 0 (0.0%) | 1 (0.6%) |
| 75 Years and over | 121 (51.5%) | 80 (36.7%) |
Disability Class: Self-Care Difficulty
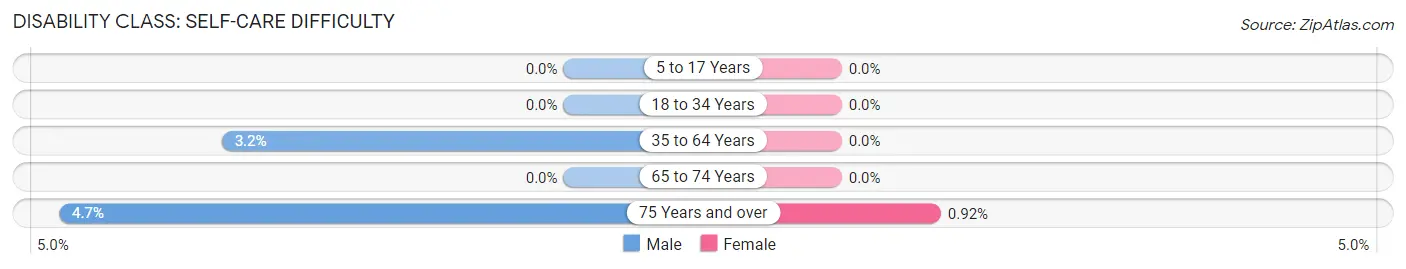
| Age Bracket | Male | Female |
| 5 to 17 Years | 0 (0.0%) | 0 (0.0%) |
| 18 to 34 Years | 0 (0.0%) | 0 (0.0%) |
| 35 to 64 Years | 15 (3.2%) | 0 (0.0%) |
| 65 to 74 Years | 0 (0.0%) | 0 (0.0%) |
| 75 Years and over | 11 (4.7%) | 2 (0.9%) |
Technology Access in Auberry
Computing Device Access in Auberry
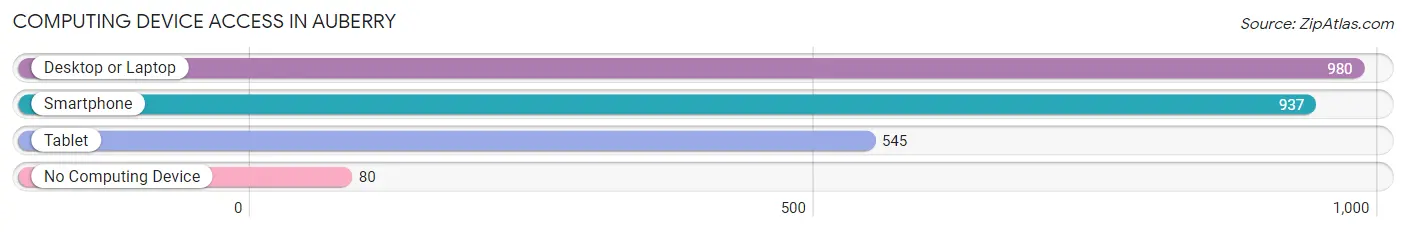
| Device Type | # Households | % Households |
| Desktop or Laptop | 980 | 86.2% |
| Smartphone | 937 | 82.4% |
| Tablet | 545 | 47.9% |
| No Computing Device | 80 | 7.0% |
| Total | 1,137 | 100.0% |
Internet Access in Auberry
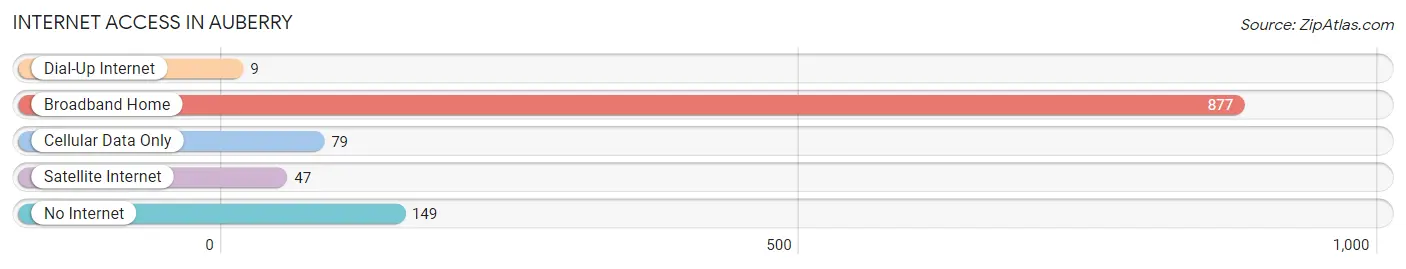
| Internet Type | # Households | % Households |
| Dial-Up Internet | 9 | 0.8% |
| Broadband Home | 877 | 77.1% |
| Cellular Data Only | 79 | 7.0% |
| Satellite Internet | 47 | 4.1% |
| No Internet | 149 | 13.1% |
| Total | 1,137 | 100.0% |
Auberry Summary
Auberry is a census-designated place located in Fresno County, California, United States. It is situated in the Sierra Nevada foothills, approximately 25 miles northeast of Fresno. The population was 2,945 at the 2010 census, up from 2,717 at the 2000 census.
History
The area now known as Auberry was originally inhabited by the Mono people, who were later displaced by the Yokuts. The first European settlers arrived in the area in the late 1800s, and the town was officially founded in 1891. The town was named after the Auberry family, who were among the first settlers.
The town was initially a farming community, with the main crops being wheat, barley, and hay. In the early 1900s, the town began to grow as a logging and lumber center. The lumber industry was the main source of employment for the town until the 1950s, when the industry began to decline.
In the late 1950s, the town began to experience a population boom as people moved to the area from the San Joaquin Valley. This growth was largely due to the construction of the nearby Shaver Lake, which provided recreational opportunities for the residents.
Geography
Auberry is located at an elevation of 2,717 feet (828 m). It is situated in the Sierra Nevada foothills, approximately 25 miles northeast of Fresno. The town is located in the San Joaquin Valley, and is surrounded by the Sierra National Forest.
The climate in Auberry is semi-arid, with hot summers and mild winters. The average annual precipitation is approximately 15 inches (380 mm).
Economy
The economy of Auberry is largely based on tourism and recreation. The town is home to several resorts and campgrounds, as well as a number of restaurants and other businesses catering to tourists.
The town is also home to several wineries, which produce a variety of wines. The nearby Shaver Lake is a popular destination for fishing, boating, and other recreational activities.
Demographics
As of the 2010 census, there were 2,945 people, 1,093 households, and 790 families residing in Auberry. The population density was 545.3 people per square mile (210.9/km2). The racial makeup of Auberry was 81.2% White, 0.7% African American, 1.3% Native American, 0.7% Asian, 0.1% Pacific Islander, 13.2% from other races, and 3.0% from two or more races. Hispanic or Latino of any race were 24.2% of the population.
The median income for a household in Auberry was $41,944, and the median income for a family was $50,000. Males had a median income of $37,500 versus $27,500 for females. The per capita income for the town was $19,945. About 11.2% of families and 14.2% of the population were below the poverty line, including 19.2% of those under age 18 and 8.2% of those age 65 or over.
Common Questions
What is Per Capita Income in Auberry?
Per Capita income in Auberry is $35,547.
What is the Median Family Income in Auberry?
Median Family Income in Auberry is $73,220.
What is the Median Household income in Auberry?
Median Household Income in Auberry is $68,320.
What is Income or Wage Gap in Auberry?
Income or Wage Gap in Auberry is 8.9%.
Women in Auberry earn 91.1 cents for every dollar earned by a man.
What is Family Income Deficit in Auberry?
Family Income Deficit in Auberry is $5,486.
Families that are below poverty line in Auberry earn $5,486 less on average than the poverty threshold level.
What is Inequality or Gini Index in Auberry?
Inequality or Gini Index in Auberry is 0.44.
What is the Total Population of Auberry?
Total Population of Auberry is 3,032.
What is the Total Male Population of Auberry?
Total Male Population of Auberry is 1,629.
What is the Total Female Population of Auberry?
Total Female Population of Auberry is 1,403.
What is the Ratio of Males per 100 Females in Auberry?
There are 116.11 Males per 100 Females in Auberry.
What is the Ratio of Females per 100 Males in Auberry?
There are 86.13 Females per 100 Males in Auberry.
What is the Median Population Age in Auberry?
Median Population Age in Auberry is 48.4 Years.
What is the Average Family Size in Auberry
Average Family Size in Auberry is 3.0 People.
What is the Average Household Size in Auberry
Average Household Size in Auberry is 2.7 People.
How Large is the Labor Force in Auberry?
There are 1,353 People in the Labor Forcein in Auberry.
What is the Percentage of People in the Labor Force in Auberry?
52.2% of People are in the Labor Force in Auberry.
What is the Unemployment Rate in Auberry?
Unemployment Rate in Auberry is 6.7%.