Chilcoot Vinton, CA Map & Demographics
Chilcoot Vinton Map
Chilcoot Vinton Overview
$33,024
PER CAPITA INCOME
0.41
INEQUALITY / GINI INDEX
374
TOTAL POPULATION
152
MALE POPULATION
222
FEMALE POPULATION
68.47
MALES / 100 FEMALES
146.05
FEMALES / 100 MALES
43.6
MEDIAN AGE
2.7
AVG FAMILY SIZE
2.5
AVG HOUSEHOLD SIZE
152
LABOR FORCE [ PEOPLE ]
49.8%
PERCENT IN LABOR FORCE
Income in Chilcoot Vinton
Income Overview in Chilcoot Vinton
| Characteristic | Number | Measure |
| Per Capita Income | 374 | $33,024 |
| Median Family Income | 109 | $0 |
| Mean Family Income | 109 | $0 |
| Median Household Income | 149 | $0 |
| Mean Household Income | 149 | $95,428 |
| Income Deficit | 109 | $0 |
| Wage / Income Gap (%) | 374 | 0.00% |
| Wage / Income Gap ($) | 374 | 100.00¢ per $1 |
| Gini / Inequality Index | 374 | 0.41 |
Earnings by Sex in Chilcoot Vinton
| Sex | Number | Average Earnings |
| Male | 112 (73.7%) | $0 |
| Female | 40 (26.3%) | $0 |
| Total | 152 (100.0%) | $0 |
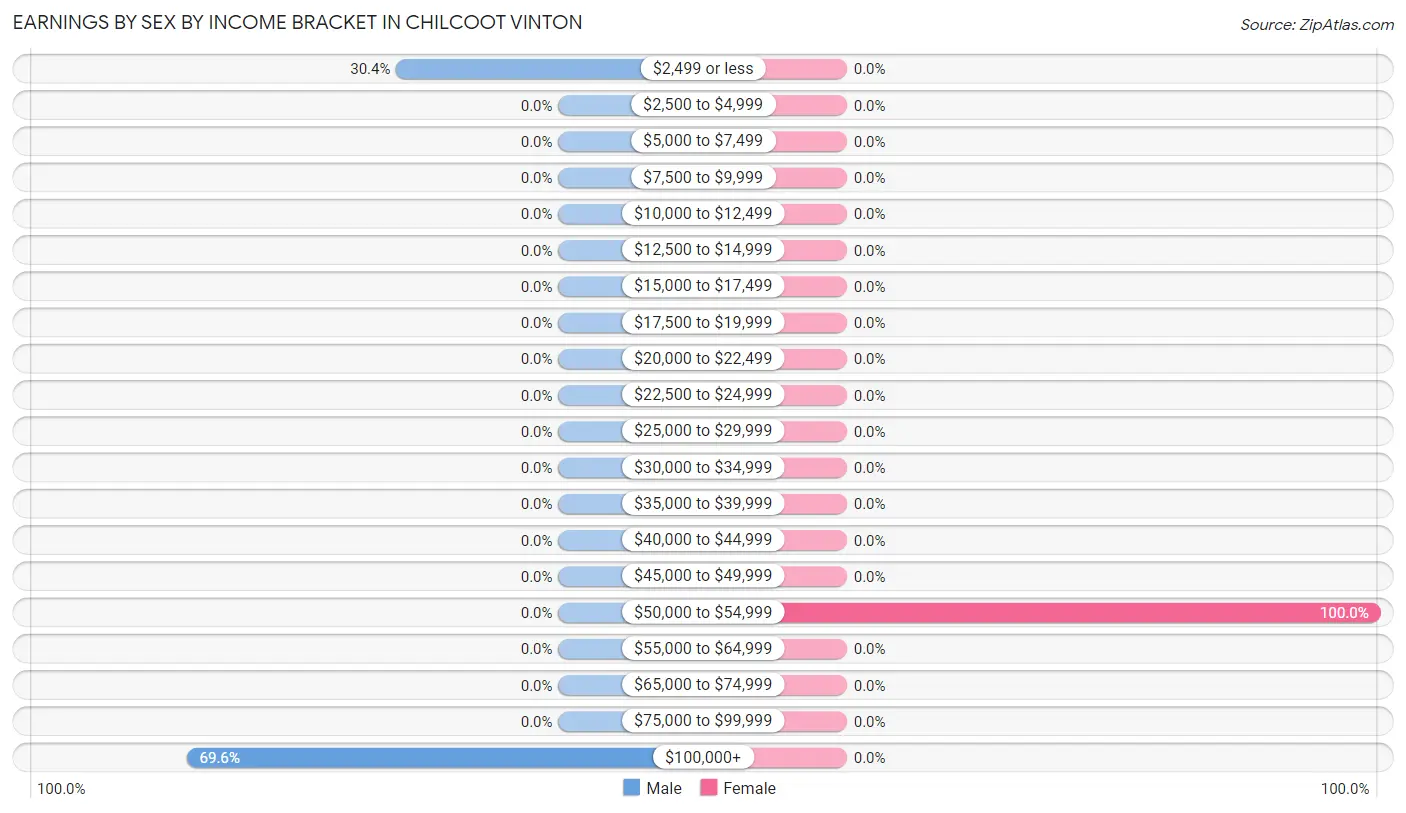
Earnings by Sex by Income Bracket in Chilcoot Vinton
The most common earnings brackets in Chilcoot Vinton are $100,000+ for men (78 | 69.6%) and $50,000 to $54,999 for women (40 | 100.0%).
| Income | Male | Female |
| $2,499 or less | 34 (30.4%) | 0 (0.0%) |
| $2,500 to $4,999 | 0 (0.0%) | 0 (0.0%) |
| $5,000 to $7,499 | 0 (0.0%) | 0 (0.0%) |
| $7,500 to $9,999 | 0 (0.0%) | 0 (0.0%) |
| $10,000 to $12,499 | 0 (0.0%) | 0 (0.0%) |
| $12,500 to $14,999 | 0 (0.0%) | 0 (0.0%) |
| $15,000 to $17,499 | 0 (0.0%) | 0 (0.0%) |
| $17,500 to $19,999 | 0 (0.0%) | 0 (0.0%) |
| $20,000 to $22,499 | 0 (0.0%) | 0 (0.0%) |
| $22,500 to $24,999 | 0 (0.0%) | 0 (0.0%) |
| $25,000 to $29,999 | 0 (0.0%) | 0 (0.0%) |
| $30,000 to $34,999 | 0 (0.0%) | 0 (0.0%) |
| $35,000 to $39,999 | 0 (0.0%) | 0 (0.0%) |
| $40,000 to $44,999 | 0 (0.0%) | 0 (0.0%) |
| $45,000 to $49,999 | 0 (0.0%) | 0 (0.0%) |
| $50,000 to $54,999 | 0 (0.0%) | 40 (100.0%) |
| $55,000 to $64,999 | 0 (0.0%) | 0 (0.0%) |
| $65,000 to $74,999 | 0 (0.0%) | 0 (0.0%) |
| $75,000 to $99,999 | 0 (0.0%) | 0 (0.0%) |
| $100,000+ | 78 (69.6%) | 0 (0.0%) |
| Total | 112 (100.0%) | 40 (100.0%) |
Earnings by Sex by Educational Attainment in Chilcoot Vinton
| Educational Attainment | Male Income | Female Income |
| Less than High School | - | - |
| High School Diploma | - | - |
| College or Associate's Degree | - | - |
| Bachelor's Degree | - | - |
| Graduate Degree | - | - |
| Total | - | - |
Family Income in Chilcoot Vinton
Family Income Brackets in Chilcoot Vinton
According to the Chilcoot Vinton family income data, there are 78 families falling into the $100,000 to $149,999 income range, which is the most common income bracket and makes up 71.6% of all families.
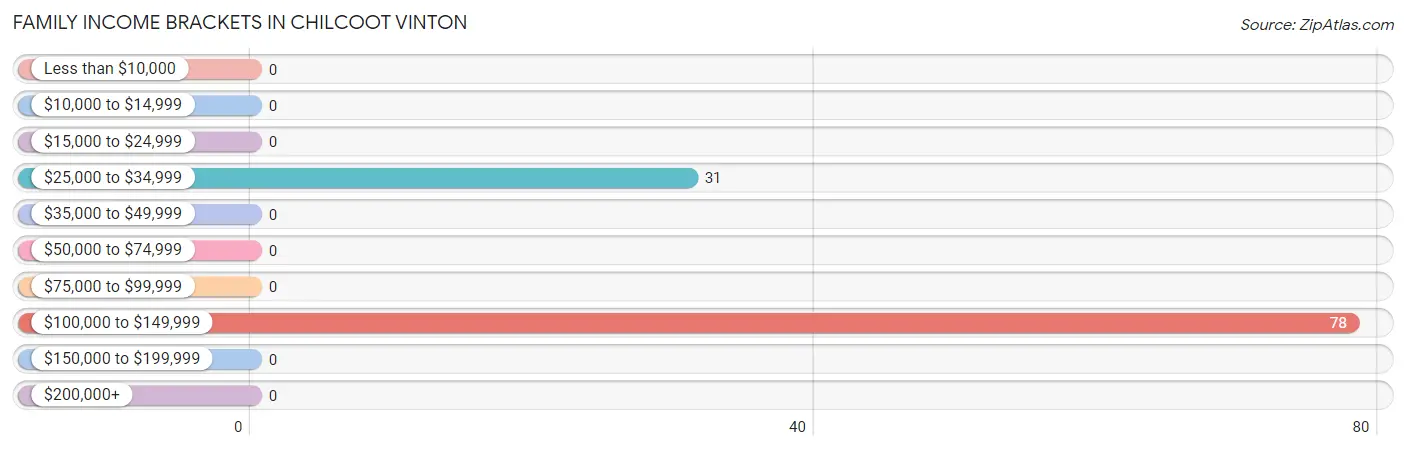
| Income Bracket | # Families | % Families |
| Less than $10,000 | 0 | 0.0% |
| $10,000 to $14,999 | 0 | 0.0% |
| $15,000 to $24,999 | 0 | 0.0% |
| $25,000 to $34,999 | 31 | 28.4% |
| $35,000 to $49,999 | 0 | 0.0% |
| $50,000 to $74,999 | 0 | 0.0% |
| $75,000 to $99,999 | 0 | 0.0% |
| $100,000 to $149,999 | 78 | 71.6% |
| $150,000 to $199,999 | 0 | 0.0% |
| $200,000+ | 0 | 0.0% |
Family Income by Famaliy Size in Chilcoot Vinton
| Income Bracket | # Families | Median Income |
| 2-Person Families | 31 (28.4%) | $0 |
| 3-Person Families | 0 (0.0%) | $0 |
| 4-Person Families | 78 (71.6%) | $0 |
| 5-Person Families | 0 (0.0%) | $0 |
| 6-Person Families | 0 (0.0%) | $0 |
| 7+ Person Families | 0 (0.0%) | $0 |
| Total | 109 (100.0%) | $0 |
Family Income by Number of Earners in Chilcoot Vinton
| Number of Earners | # Families | Median Income |
| No Earners | 31 (28.4%) | $0 |
| 1 Earner | 0 (0.0%) | $0 |
| 2 Earners | 78 (71.6%) | $0 |
| 3+ Earners | 0 (0.0%) | $0 |
| Total | 109 (100.0%) | $0 |
Household Income in Chilcoot Vinton
Household Income Brackets in Chilcoot Vinton
With 78 households falling in the category, the $150,000 to $199,999 income range is the most frequent in Chilcoot Vinton, accounting for 52.3% of all households.
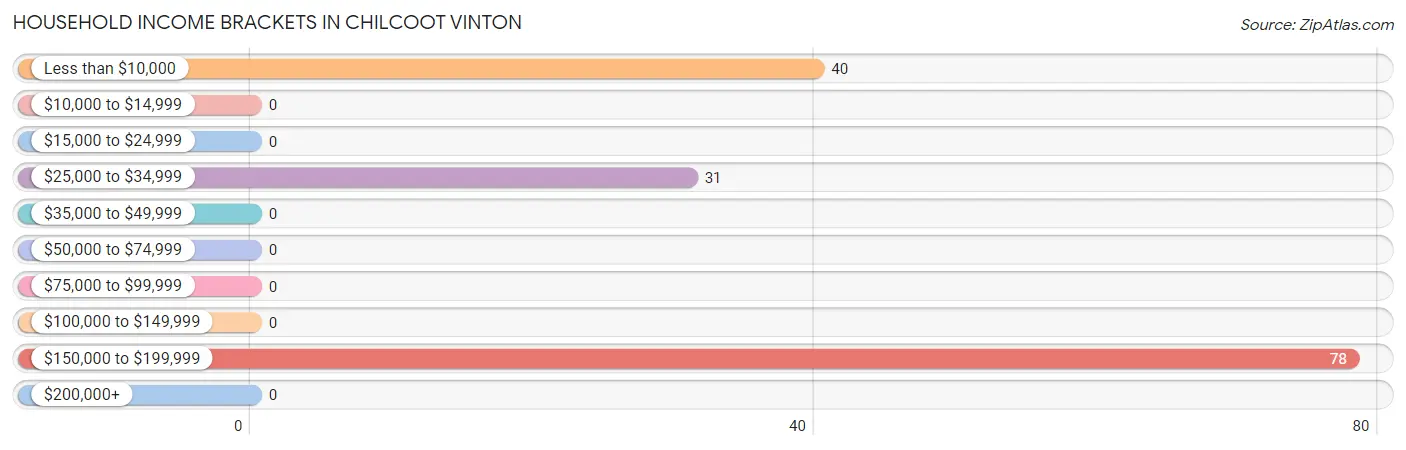
| Income Bracket | # Households | % Households |
| Less than $10,000 | 40 | 26.8% |
| $10,000 to $14,999 | 0 | 0.0% |
| $15,000 to $24,999 | 0 | 0.0% |
| $25,000 to $34,999 | 31 | 20.8% |
| $35,000 to $49,999 | 0 | 0.0% |
| $50,000 to $74,999 | 0 | 0.0% |
| $75,000 to $99,999 | 0 | 0.0% |
| $100,000 to $149,999 | 0 | 0.0% |
| $150,000 to $199,999 | 78 | 52.3% |
| $200,000+ | 0 | 0.0% |
Household Income by Householder Age in Chilcoot Vinton
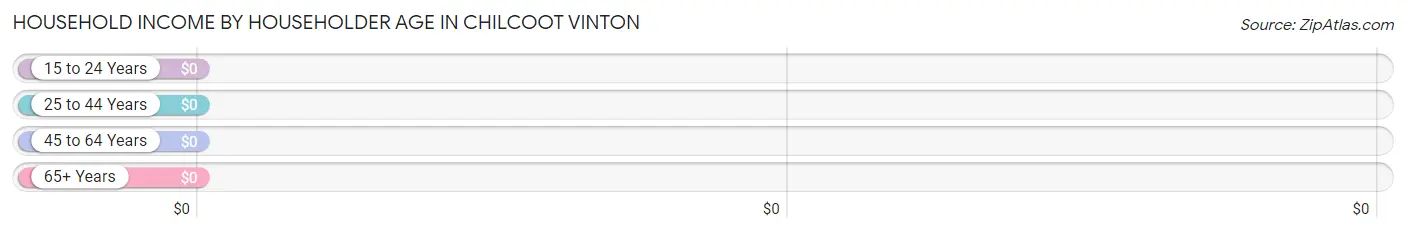
| Income Bracket | # Households | Median Income |
| 15 to 24 Years | 0 (0.0%) | $0 |
| 25 to 44 Years | 78 (52.3%) | $0 |
| 45 to 64 Years | 40 (26.9%) | $0 |
| 65+ Years | 31 (20.8%) | $0 |
| Total | 149 (100.0%) | $0 |
Poverty in Chilcoot Vinton
Income Below Poverty by Sex and Age in Chilcoot Vinton
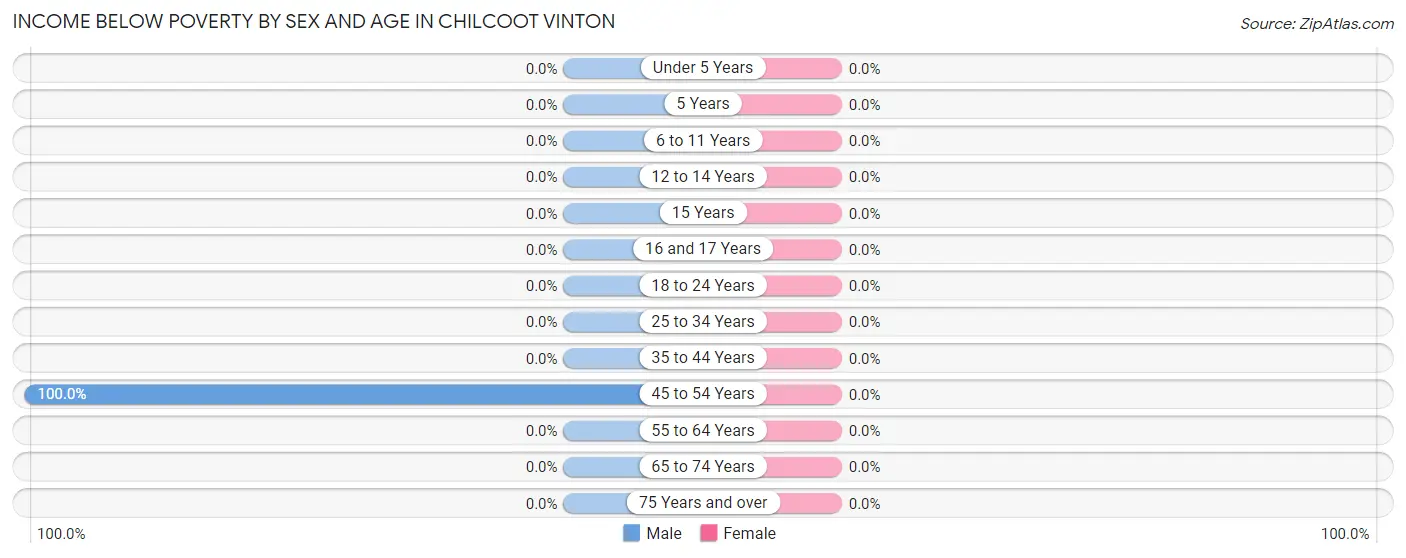
| Age Bracket | Male | Female |
| Under 5 Years | 0 (0.0%) | 0 (0.0%) |
| 5 Years | 0 (0.0%) | 0 (0.0%) |
| 6 to 11 Years | 0 (0.0%) | 0 (0.0%) |
| 12 to 14 Years | 0 (0.0%) | 0 (0.0%) |
| 15 Years | 0 (0.0%) | 0 (0.0%) |
| 16 and 17 Years | 0 (0.0%) | 0 (0.0%) |
| 18 to 24 Years | 0 (0.0%) | 0 (0.0%) |
| 25 to 34 Years | 0 (0.0%) | 0 (0.0%) |
| 35 to 44 Years | 0 (0.0%) | 0 (0.0%) |
| 45 to 54 Years | 40 (100.0%) | 0 (0.0%) |
| 55 to 64 Years | 0 (0.0%) | 0 (0.0%) |
| 65 to 74 Years | 0 (0.0%) | 0 (0.0%) |
| 75 Years and over | 0 (0.0%) | 0 (0.0%) |
| Total | 40 (26.3%) | 0 (0.0%) |
Income Above Poverty by Sex and Age in Chilcoot Vinton
According to the poverty statistics in Chilcoot Vinton, males aged 16 and 17 years and females aged 6 to 11 years are the age groups that are most secure financially, with 100.0% of males and 100.0% of females in these age groups living above the poverty line.
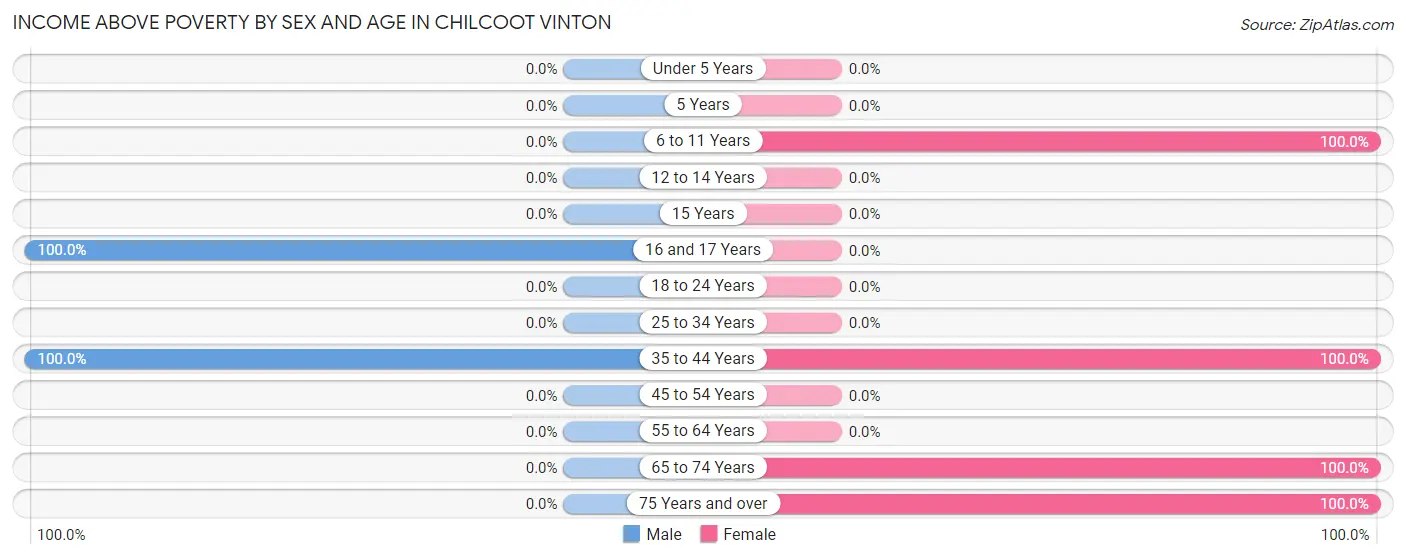
| Age Bracket | Male | Female |
| Under 5 Years | 0 (0.0%) | 0 (0.0%) |
| 5 Years | 0 (0.0%) | 0 (0.0%) |
| 6 to 11 Years | 0 (0.0%) | 69 (100.0%) |
| 12 to 14 Years | 0 (0.0%) | 0 (0.0%) |
| 15 Years | 0 (0.0%) | 0 (0.0%) |
| 16 and 17 Years | 34 (100.0%) | 0 (0.0%) |
| 18 to 24 Years | 0 (0.0%) | 0 (0.0%) |
| 25 to 34 Years | 0 (0.0%) | 0 (0.0%) |
| 35 to 44 Years | 78 (100.0%) | 40 (100.0%) |
| 45 to 54 Years | 0 (0.0%) | 0 (0.0%) |
| 55 to 64 Years | 0 (0.0%) | 0 (0.0%) |
| 65 to 74 Years | 0 (0.0%) | 82 (100.0%) |
| 75 Years and over | 0 (0.0%) | 31 (100.0%) |
| Total | 112 (73.7%) | 222 (100.0%) |
Income Below Poverty Among Married-Couple Families in Chilcoot Vinton

| Children | Above Poverty | Below Poverty |
| No Children | 0 (0.0%) | 0 (0.0%) |
| 1 or 2 Children | 0 (0.0%) | 0 (0.0%) |
| 3 or 4 Children | 0 (0.0%) | 0 (0.0%) |
| 5 or more Children | 0 (0.0%) | 0 (0.0%) |
| Total | 0 (0.0%) | 0 (0.0%) |
Income Below Poverty Among Single-Parent Households in Chilcoot Vinton
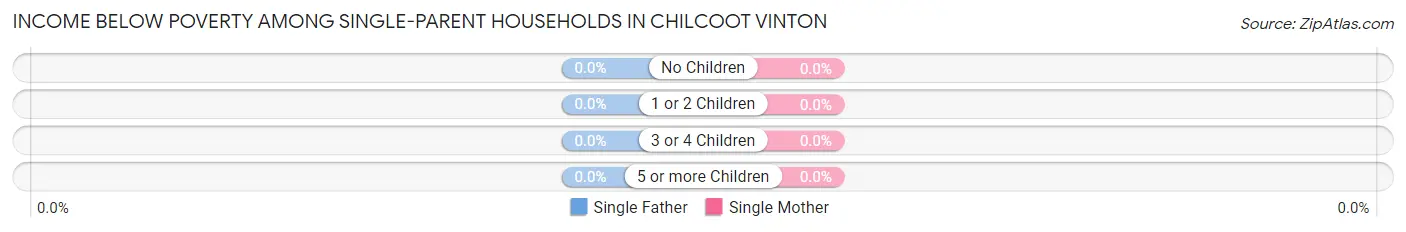
| Children | Single Father | Single Mother |
| No Children | 0 (0.0%) | 0 (0.0%) |
| 1 or 2 Children | 0 (0.0%) | 0 (0.0%) |
| 3 or 4 Children | 0 (0.0%) | 0 (0.0%) |
| 5 or more Children | 0 (0.0%) | 0 (0.0%) |
| Total | 0 (0.0%) | 0 (0.0%) |
Income Below Poverty Among Married-Couple vs Single-Parent Households in Chilcoot Vinton
| Children | Married-Couple Families | Single-Parent Households |
| No Children | 0 (0.0%) | 0 (0.0%) |
| 1 or 2 Children | 0 (0.0%) | 0 (0.0%) |
| 3 or 4 Children | 0 (0.0%) | 0 (0.0%) |
| 5 or more Children | 0 (0.0%) | 0 (0.0%) |
| Total | 0 (0.0%) | 0 (0.0%) |
Race in Chilcoot Vinton
The most populous races in Chilcoot Vinton are White / Caucasian (191 | 51.1%), Two or more Races (103 | 27.5%), and Hawaiian / Pacific (40 | 10.7%).
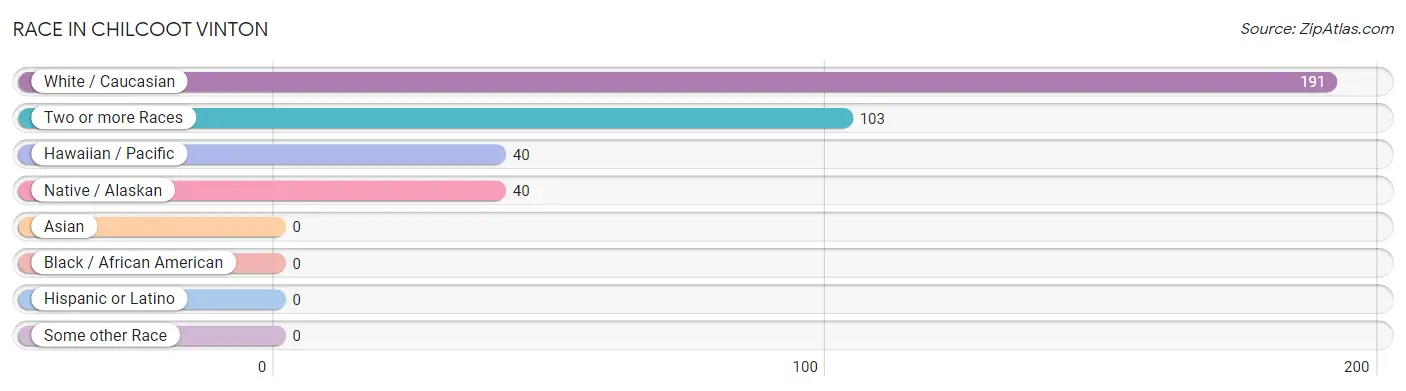
| Race | # Population | % Population |
| Asian | 0 | 0.0% |
| Black / African American | 0 | 0.0% |
| Hawaiian / Pacific | 40 | 10.7% |
| Hispanic or Latino | 0 | 0.0% |
| Native / Alaskan | 40 | 10.7% |
| White / Caucasian | 191 | 51.1% |
| Two or more Races | 103 | 27.5% |
| Some other Race | 0 | 0.0% |
| Total | 374 | 100.0% |
Ancestry in Chilcoot Vinton
The most populous ancestries reported in Chilcoot Vinton are Swedish (181 | 48.4%), English (113 | 30.2%), Irish (113 | 30.2%), Scandinavian (78 | 20.9%), and Choctaw (40 | 10.7%), together accounting for 140.4% of all Chilcoot Vinton residents.
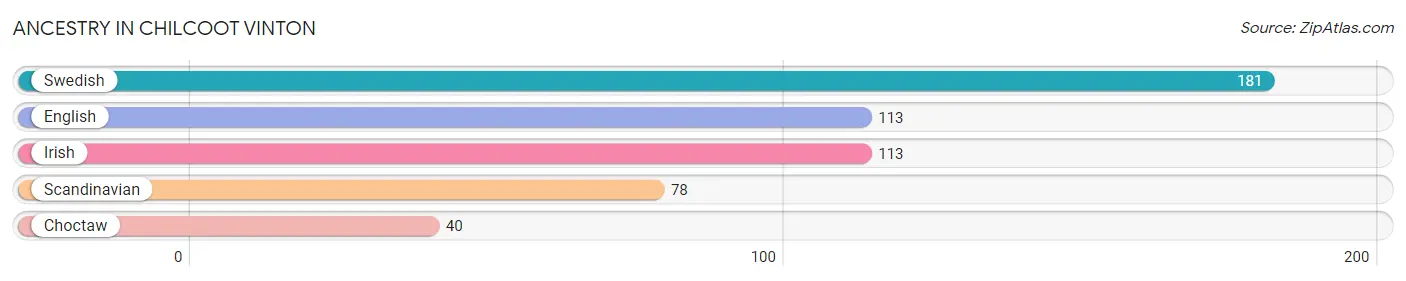
| Ancestry | # Population | % Population |
| Choctaw | 40 | 10.7% |
| English | 113 | 30.2% |
| Irish | 113 | 30.2% |
| Scandinavian | 78 | 20.9% |
| Swedish | 181 | 48.4% | View All 5 Rows |
Immigrants in Chilcoot Vinton
The most numerous immigrant groups reported in Chilcoot Vinton came from Micronesia (40 | 10.7%), and Oceania (40 | 10.7%), together accounting for 21.4% of all Chilcoot Vinton residents.
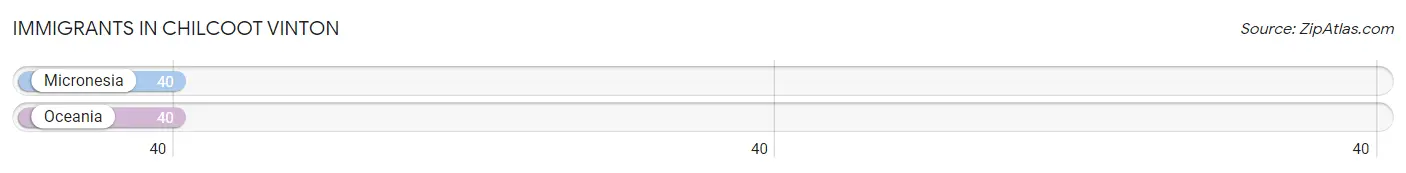
| Immigration Origin | # Population | % Population |
| Micronesia | 40 | 10.7% |
| Oceania | 40 | 10.7% | View All 2 Rows |
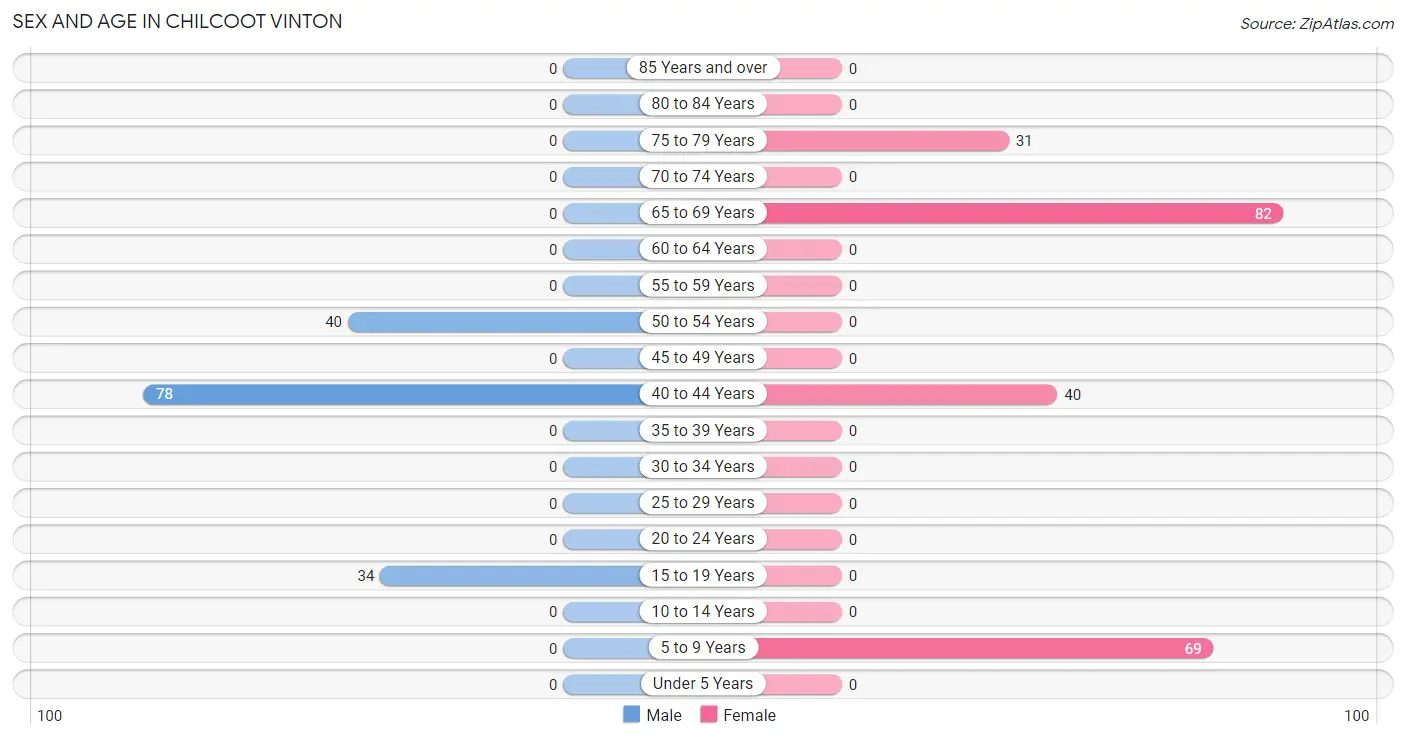
Sex and Age in Chilcoot Vinton
Sex and Age in Chilcoot Vinton
The most populous age groups in Chilcoot Vinton are 40 to 44 Years (78 | 51.3%) for men and 65 to 69 Years (82 | 36.9%) for women.
| Age Bracket | Male | Female |
| Under 5 Years | 0 (0.0%) | 0 (0.0%) |
| 5 to 9 Years | 0 (0.0%) | 69 (31.1%) |
| 10 to 14 Years | 0 (0.0%) | 0 (0.0%) |
| 15 to 19 Years | 34 (22.4%) | 0 (0.0%) |
| 20 to 24 Years | 0 (0.0%) | 0 (0.0%) |
| 25 to 29 Years | 0 (0.0%) | 0 (0.0%) |
| 30 to 34 Years | 0 (0.0%) | 0 (0.0%) |
| 35 to 39 Years | 0 (0.0%) | 0 (0.0%) |
| 40 to 44 Years | 78 (51.3%) | 40 (18.0%) |
| 45 to 49 Years | 0 (0.0%) | 0 (0.0%) |
| 50 to 54 Years | 40 (26.3%) | 0 (0.0%) |
| 55 to 59 Years | 0 (0.0%) | 0 (0.0%) |
| 60 to 64 Years | 0 (0.0%) | 0 (0.0%) |
| 65 to 69 Years | 0 (0.0%) | 82 (36.9%) |
| 70 to 74 Years | 0 (0.0%) | 0 (0.0%) |
| 75 to 79 Years | 0 (0.0%) | 31 (14.0%) |
| 80 to 84 Years | 0 (0.0%) | 0 (0.0%) |
| 85 Years and over | 0 (0.0%) | 0 (0.0%) |
| Total | 152 (100.0%) | 222 (100.0%) |
Families and Households in Chilcoot Vinton
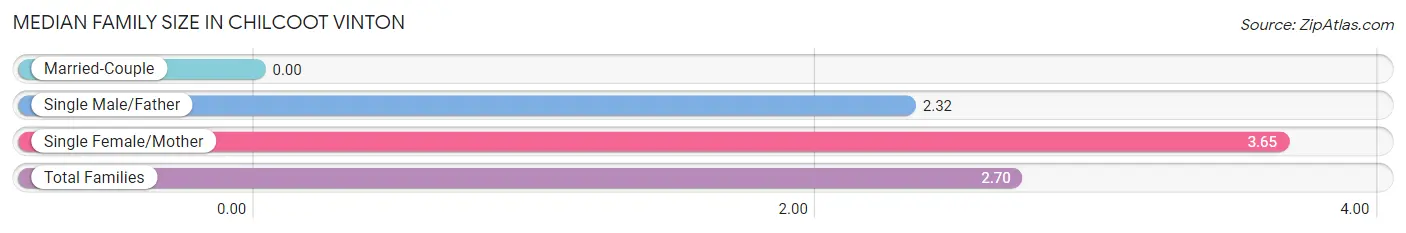
Median Family Size in Chilcoot Vinton
| Family Type | # Families | Family Size |
| Married-Couple | 0 (0.0%) | - |
| Single Male/Father | 78 (71.6%) | 2.32 |
| Single Female/Mother | 31 (28.4%) | 3.65 |
| Total Families | 109 (100.0%) | 2.70 |
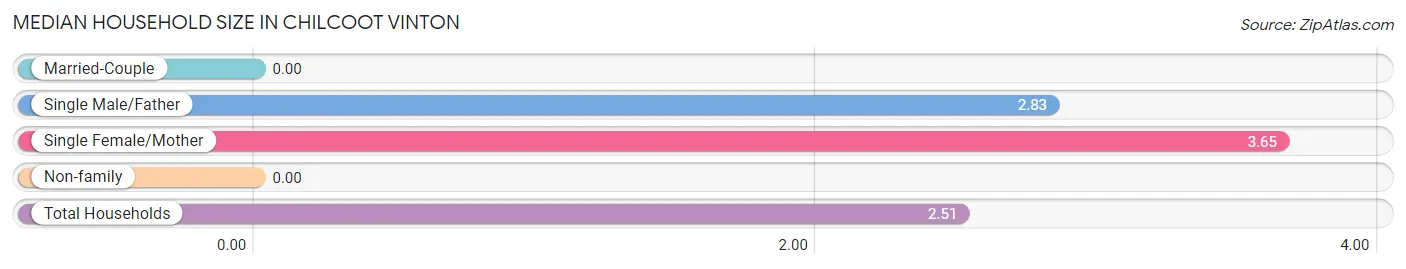
Median Household Size in Chilcoot Vinton
| Household Type | # Households | Household Size |
| Married-Couple | 0 (0.0%) | - |
| Single Male/Father | 78 (52.3%) | 2.83 |
| Single Female/Mother | 31 (20.8%) | 3.65 |
| Non-family | 40 (26.9%) | - |
| Total Households | 149 (100.0%) | 2.51 |
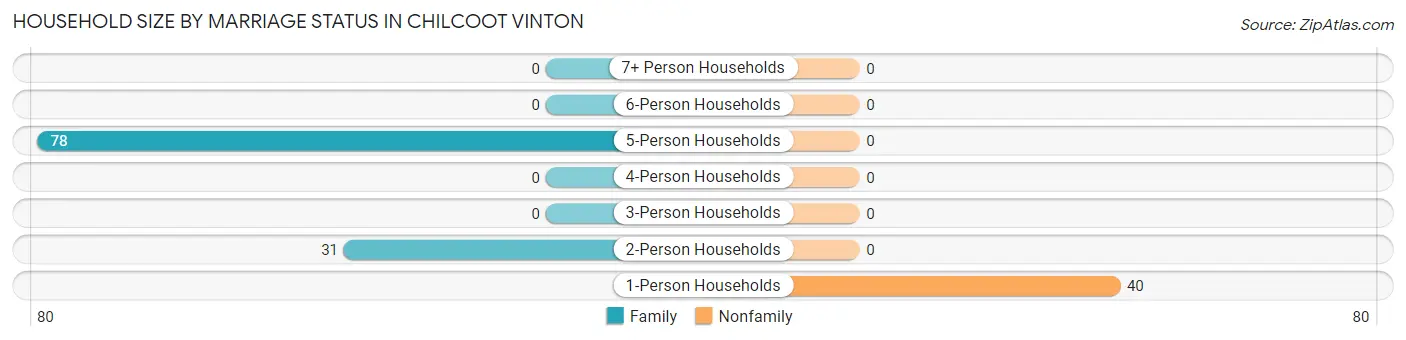
Household Size by Marriage Status in Chilcoot Vinton
Out of a total of 149 households in Chilcoot Vinton, 109 (73.2%) are family households, while 40 (26.9%) are nonfamily households. The most numerous type of family households are 5-person households, comprising 78, and the most common type of nonfamily households are 1-person households, comprising 40.
| Household Size | Family Households | Nonfamily Households |
| 1-Person Households | - | 40 (26.9%) |
| 2-Person Households | 31 (20.8%) | 0 (0.0%) |
| 3-Person Households | 0 (0.0%) | 0 (0.0%) |
| 4-Person Households | 0 (0.0%) | 0 (0.0%) |
| 5-Person Households | 78 (52.3%) | 0 (0.0%) |
| 6-Person Households | 0 (0.0%) | 0 (0.0%) |
| 7+ Person Households | 0 (0.0%) | 0 (0.0%) |
| Total | 109 (73.2%) | 40 (26.9%) |
Female Fertility in Chilcoot Vinton
Fertility by Age in Chilcoot Vinton
| Age Bracket | Women with Births | Births / 1,000 Women |
| 15 to 19 years | 0 (0.0%) | 0.0 |
| 20 to 34 years | 0 (0.0%) | 0.0 |
| 35 to 50 years | 0 (0.0%) | 0.0 |
| Total | 0 (0.0%) | 0.0 |
Fertility by Age by Marriage Status in Chilcoot Vinton
| Age Bracket | Married | Unmarried |
| 15 to 19 years | 0 (0.0%) | 0 (0.0%) |
| 20 to 34 years | 0 (0.0%) | 0 (0.0%) |
| 35 to 50 years | 0 (0.0%) | 0 (0.0%) |
| Total | 0 (0.0%) | 0 (0.0%) |
Fertility by Education in Chilcoot Vinton
| Educational Attainment | Women with Births | Births / 1,000 Women |
| Less than High School | 0 (0.0%) | 0.0 |
| High School Diploma | 0 (0.0%) | 0.0 |
| College or Associate's Degree | 0 (0.0%) | 0.0 |
| Bachelor's Degree | 0 (0.0%) | 0.0 |
| Graduate Degree | 0 (0.0%) | 0.0 |
| Total | 0 (0.0%) | 0.0 |
Fertility by Education by Marriage Status in Chilcoot Vinton
| Educational Attainment | Married | Unmarried |
| Less than High School | 0 (0.0%) | 0 (0.0%) |
| High School Diploma | 0 (0.0%) | 0 (0.0%) |
| College or Associate's Degree | 0 (0.0%) | 0 (0.0%) |
| Bachelor's Degree | 0 (0.0%) | 0 (0.0%) |
| Graduate Degree | 0 (0.0%) | 0 (0.0%) |
| Total | 0 (0.0%) | 0 (0.0%) |
Employment Characteristics in Chilcoot Vinton
Employment by Class of Employer in Chilcoot Vinton
Among the 152 employed individuals in Chilcoot Vinton, , and private company employees (152 | 100.0%) make up the most common classes of employment.
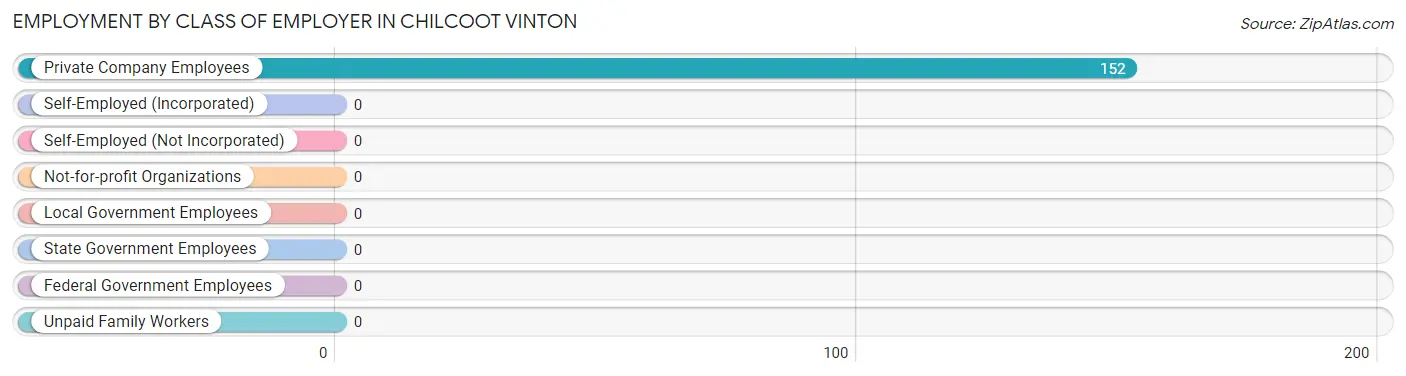
| Employer Class | # Employees | % Employees |
| Private Company Employees | 152 | 100.0% |
| Self-Employed (Incorporated) | 0 | 0.0% |
| Self-Employed (Not Incorporated) | 0 | 0.0% |
| Not-for-profit Organizations | 0 | 0.0% |
| Local Government Employees | 0 | 0.0% |
| State Government Employees | 0 | 0.0% |
| Federal Government Employees | 0 | 0.0% |
| Unpaid Family Workers | 0 | 0.0% |
| Total | 152 | 100.0% |
Employment Status by Age in Chilcoot Vinton
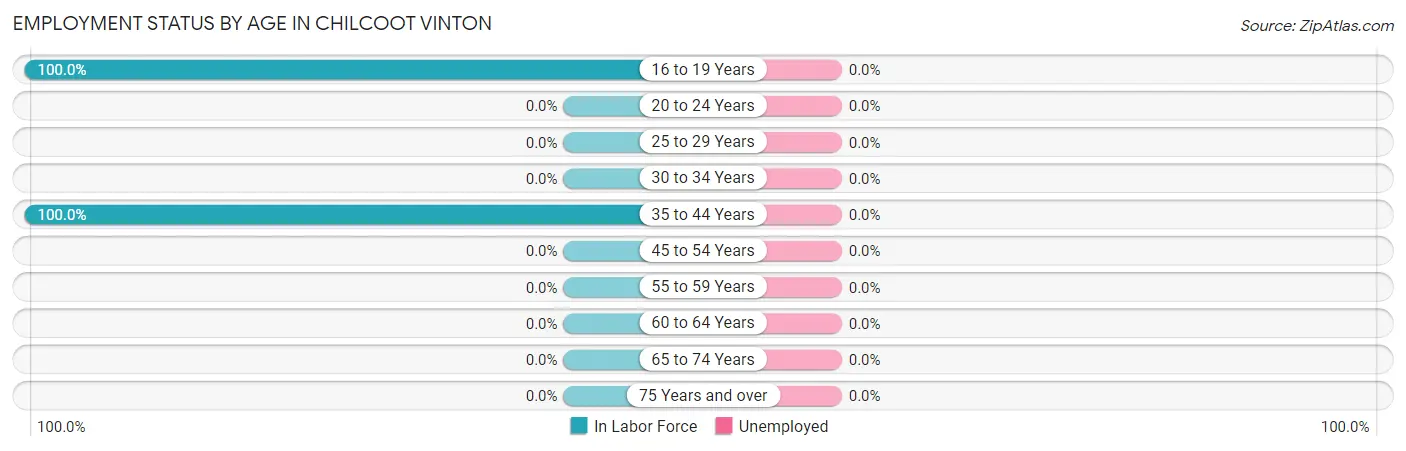
| Age Bracket | In Labor Force | Unemployed |
| 16 to 19 Years | 34 (100.0%) | 0 (0.0%) |
| 20 to 24 Years | 0 (0.0%) | 0 (0.0%) |
| 25 to 29 Years | 0 (0.0%) | 0 (0.0%) |
| 30 to 34 Years | 0 (0.0%) | 0 (0.0%) |
| 35 to 44 Years | 118 (100.0%) | 0 (0.0%) |
| 45 to 54 Years | 0 (0.0%) | 0 (0.0%) |
| 55 to 59 Years | 0 (0.0%) | 0 (0.0%) |
| 60 to 64 Years | 0 (0.0%) | 0 (0.0%) |
| 65 to 74 Years | 0 (0.0%) | 0 (0.0%) |
| 75 Years and over | 0 (0.0%) | 0 (0.0%) |
| Total | 152 (49.8%) | 0 (0.0%) |
Employment Status by Educational Attainment in Chilcoot Vinton
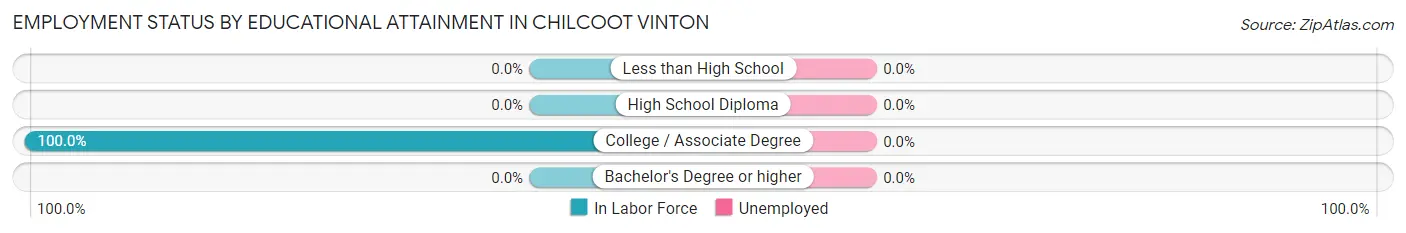
| Educational Attainment | In Labor Force | Unemployed |
| Less than High School | 0 (0.0%) | 0 (0.0%) |
| High School Diploma | 0 (0.0%) | 0 (0.0%) |
| College / Associate Degree | 118 (100.0%) | 0 (0.0%) |
| Bachelor's Degree or higher | 0 (0.0%) | 0 (0.0%) |
| Total | 118 (74.7%) | 0 (0.0%) |
Employment Occupations by Sex in Chilcoot Vinton
Management, Business, Science and Arts Occupations
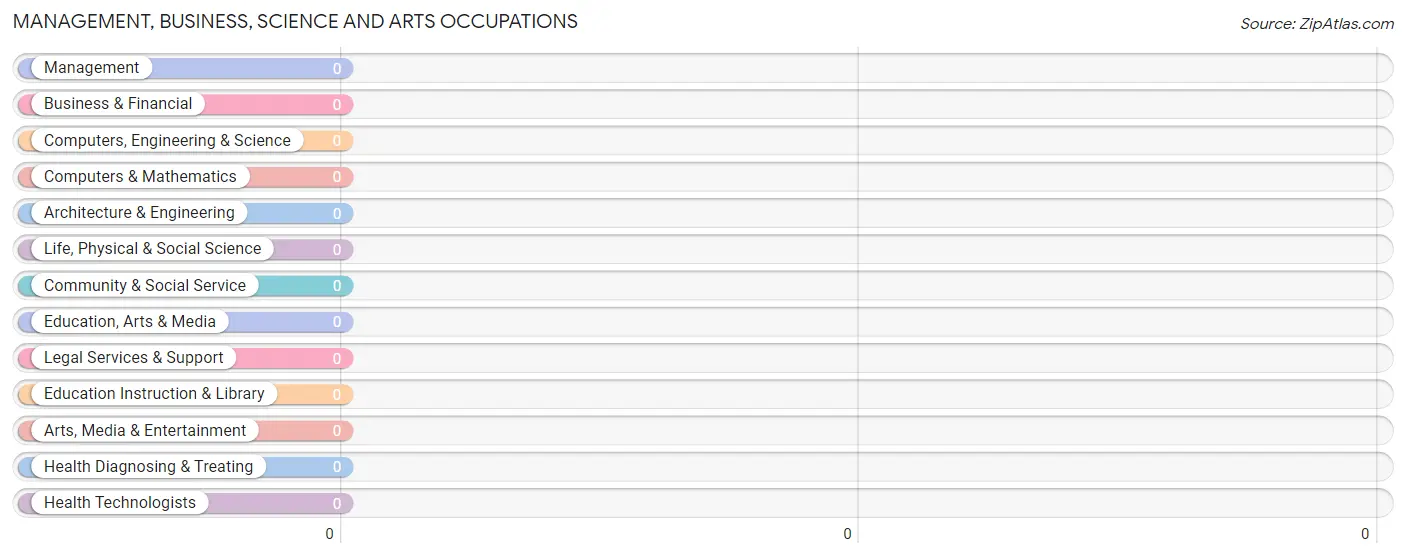
Management, Business, Science and Arts Occupations by Sex
| Occupation | Male | Female |
| Management | 0 (0.0%) | 0 (0.0%) |
| Business & Financial | 0 (0.0%) | 0 (0.0%) |
| Computers, Engineering & Science | 0 (0.0%) | 0 (0.0%) |
| Computers & Mathematics | 0 (0.0%) | 0 (0.0%) |
| Architecture & Engineering | 0 (0.0%) | 0 (0.0%) |
| Life, Physical & Social Science | 0 (0.0%) | 0 (0.0%) |
| Community & Social Service | 0 (0.0%) | 0 (0.0%) |
| Education, Arts & Media | 0 (0.0%) | 0 (0.0%) |
| Legal Services & Support | 0 (0.0%) | 0 (0.0%) |
| Education Instruction & Library | 0 (0.0%) | 0 (0.0%) |
| Arts, Media & Entertainment | 0 (0.0%) | 0 (0.0%) |
| Health Diagnosing & Treating | 0 (0.0%) | 0 (0.0%) |
| Health Technologists | 0 (0.0%) | 0 (0.0%) |
| Total (Category) | 0 (0.0%) | 0 (0.0%) |
| Total (Overall) | 112 (73.7%) | 40 (26.3%) |
Services Occupations
The most common Services occupations in Chilcoot Vinton are , and Food Preparation & Serving (34 | 22.4%).
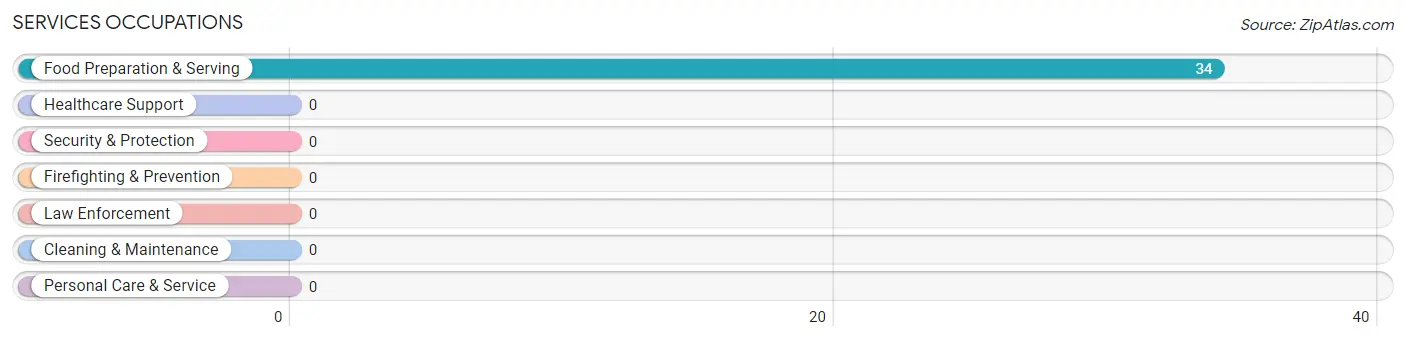
Services Occupations by Sex
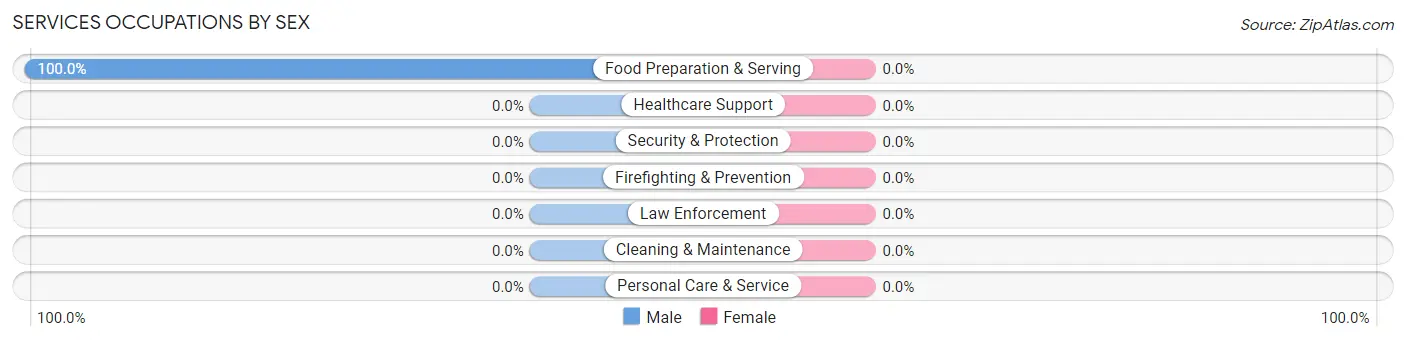
| Occupation | Male | Female |
| Healthcare Support | 0 (0.0%) | 0 (0.0%) |
| Security & Protection | 0 (0.0%) | 0 (0.0%) |
| Firefighting & Prevention | 0 (0.0%) | 0 (0.0%) |
| Law Enforcement | 0 (0.0%) | 0 (0.0%) |
| Food Preparation & Serving | 34 (100.0%) | 0 (0.0%) |
| Cleaning & Maintenance | 0 (0.0%) | 0 (0.0%) |
| Personal Care & Service | 0 (0.0%) | 0 (0.0%) |
| Total (Category) | 34 (100.0%) | 0 (0.0%) |
| Total (Overall) | 112 (73.7%) | 40 (26.3%) |
Sales and Office Occupations
Sales and Office Occupations by Sex
| Occupation | Male | Female |
| Sales & Related | 0 (0.0%) | 0 (0.0%) |
| Office & Administration | 0 (0.0%) | 0 (0.0%) |
| Total (Category) | 0 (0.0%) | 0 (0.0%) |
| Total (Overall) | 112 (73.7%) | 40 (26.3%) |
Natural Resources, Construction and Maintenance Occupations
The most common Natural Resources, Construction and Maintenance occupations in Chilcoot Vinton are , and Construction & Extraction (78 | 51.3%).
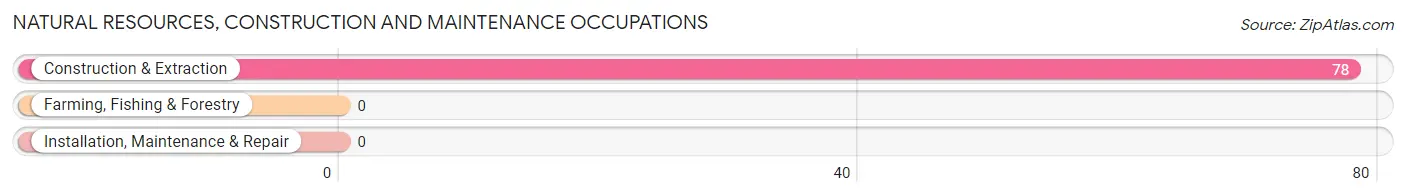
Natural Resources, Construction and Maintenance Occupations by Sex
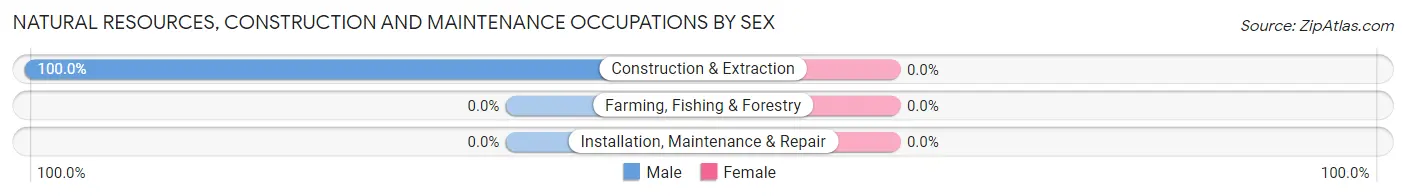
| Occupation | Male | Female |
| Farming, Fishing & Forestry | 0 (0.0%) | 0 (0.0%) |
| Construction & Extraction | 78 (100.0%) | 0 (0.0%) |
| Installation, Maintenance & Repair | 0 (0.0%) | 0 (0.0%) |
| Total (Category) | 78 (100.0%) | 0 (0.0%) |
| Total (Overall) | 112 (73.7%) | 40 (26.3%) |
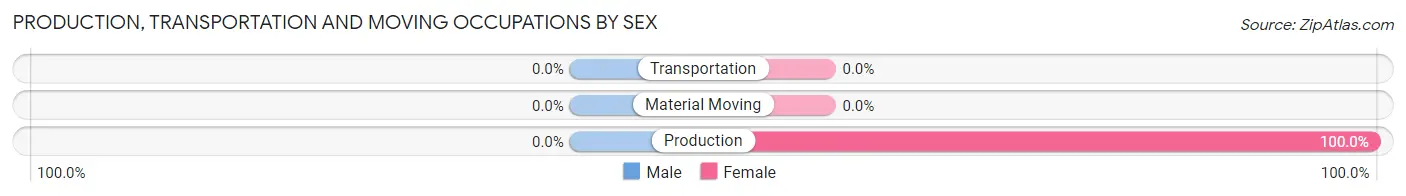
Production, Transportation and Moving Occupations
The most common Production, Transportation and Moving occupations in Chilcoot Vinton are , and Production (40 | 26.3%).
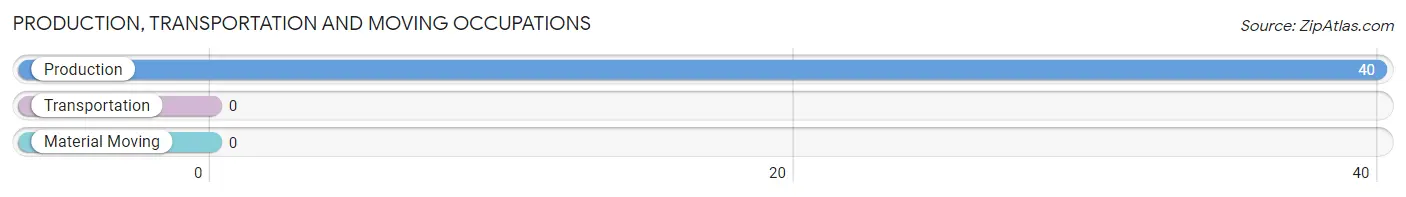
Production, Transportation and Moving Occupations by Sex
| Occupation | Male | Female |
| Production | 0 (0.0%) | 40 (100.0%) |
| Transportation | 0 (0.0%) | 0 (0.0%) |
| Material Moving | 0 (0.0%) | 0 (0.0%) |
| Total (Category) | 0 (0.0%) | 40 (100.0%) |
| Total (Overall) | 112 (73.7%) | 40 (26.3%) |
Employment Industries by Sex in Chilcoot Vinton
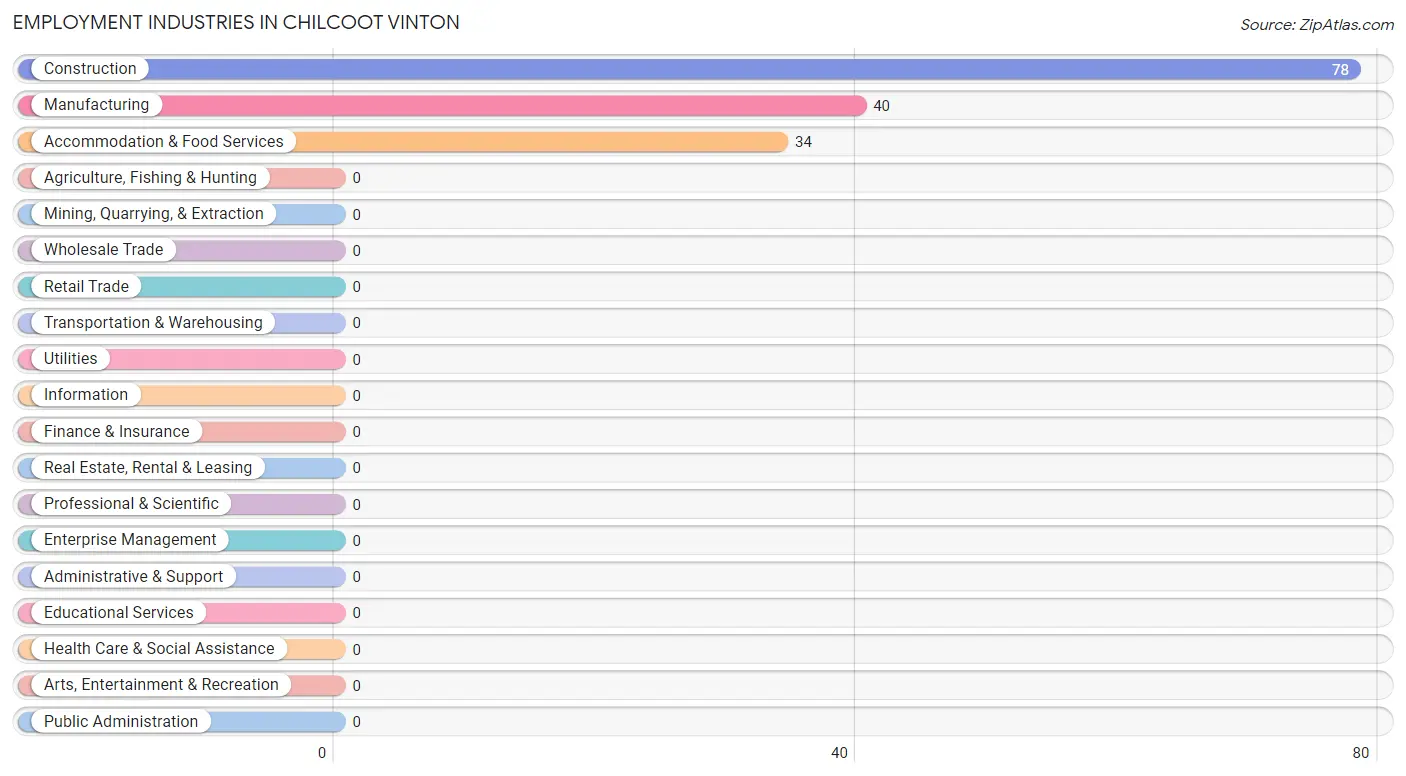
Employment Industries in Chilcoot Vinton
The major employment industries in Chilcoot Vinton include Construction (78 | 51.3%), Manufacturing (40 | 26.3%), and Accommodation & Food Services (34 | 22.4%).
Employment Industries by Sex in Chilcoot Vinton
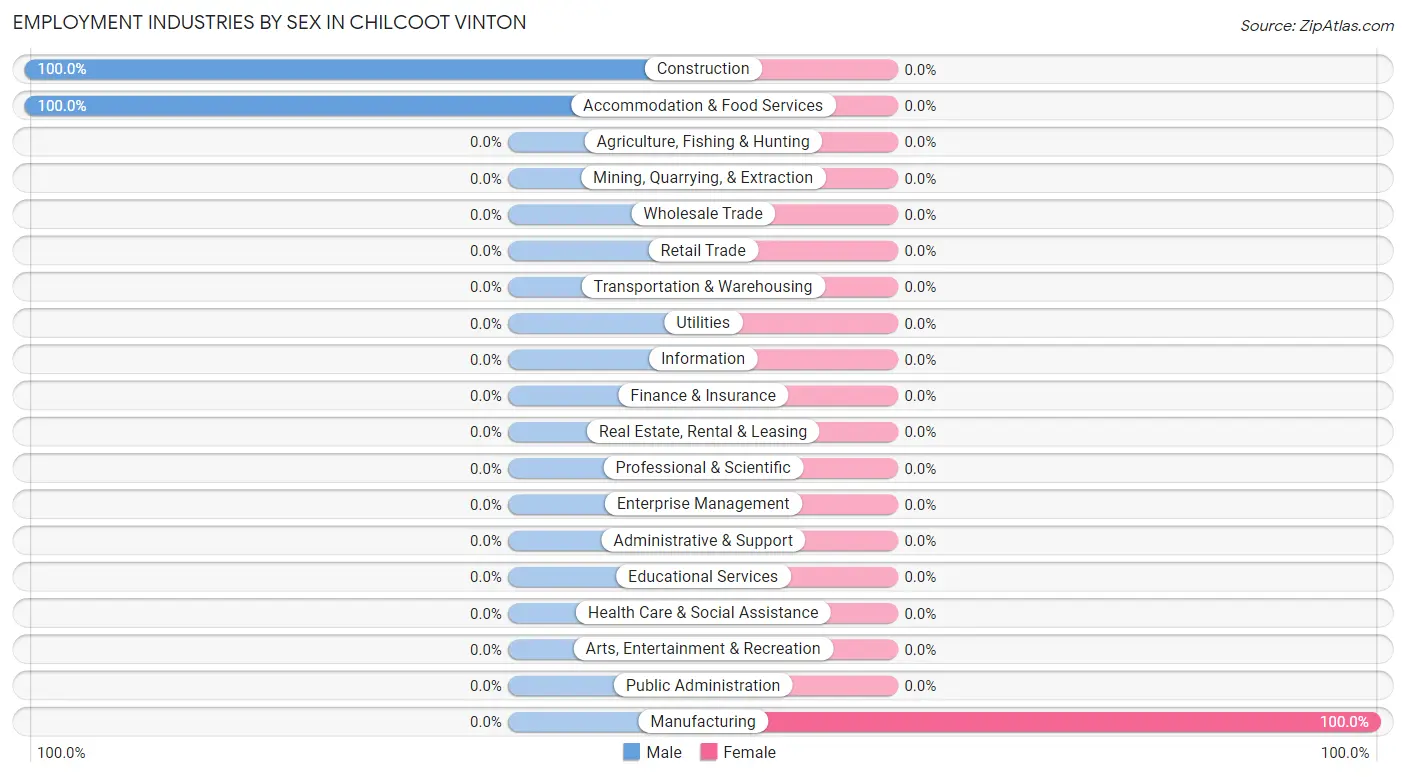
| Industry | Male | Female |
| Agriculture, Fishing & Hunting | 0 (0.0%) | 0 (0.0%) |
| Mining, Quarrying, & Extraction | 0 (0.0%) | 0 (0.0%) |
| Construction | 78 (100.0%) | 0 (0.0%) |
| Manufacturing | 0 (0.0%) | 40 (100.0%) |
| Wholesale Trade | 0 (0.0%) | 0 (0.0%) |
| Retail Trade | 0 (0.0%) | 0 (0.0%) |
| Transportation & Warehousing | 0 (0.0%) | 0 (0.0%) |
| Utilities | 0 (0.0%) | 0 (0.0%) |
| Information | 0 (0.0%) | 0 (0.0%) |
| Finance & Insurance | 0 (0.0%) | 0 (0.0%) |
| Real Estate, Rental & Leasing | 0 (0.0%) | 0 (0.0%) |
| Professional & Scientific | 0 (0.0%) | 0 (0.0%) |
| Enterprise Management | 0 (0.0%) | 0 (0.0%) |
| Administrative & Support | 0 (0.0%) | 0 (0.0%) |
| Educational Services | 0 (0.0%) | 0 (0.0%) |
| Health Care & Social Assistance | 0 (0.0%) | 0 (0.0%) |
| Arts, Entertainment & Recreation | 0 (0.0%) | 0 (0.0%) |
| Accommodation & Food Services | 34 (100.0%) | 0 (0.0%) |
| Public Administration | 0 (0.0%) | 0 (0.0%) |
| Total | 112 (73.7%) | 40 (26.3%) |
Education in Chilcoot Vinton
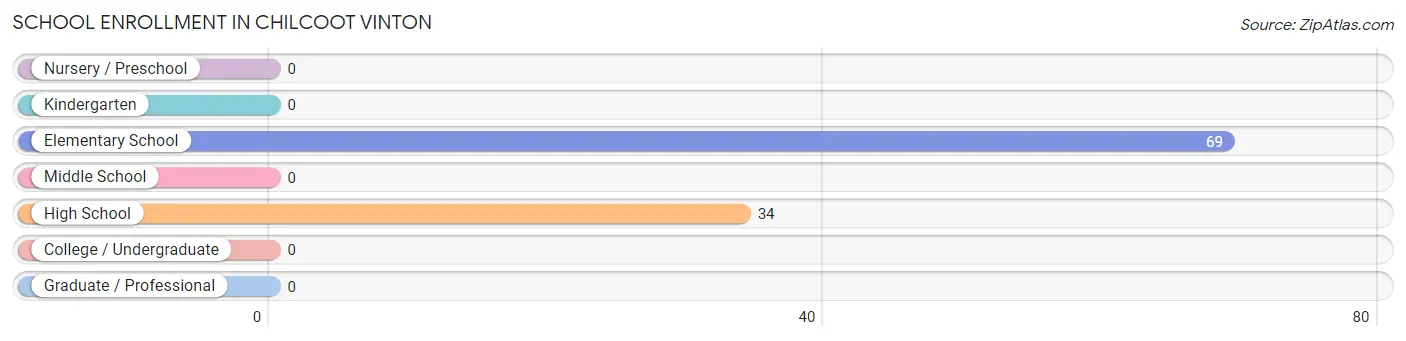
School Enrollment in Chilcoot Vinton
The most common levels of schooling among the 103 students in Chilcoot Vinton are elementary school (69 | 67.0%), and high school (34 | 33.0%).
| School Level | # Students | % Students |
| Nursery / Preschool | 0 | 0.0% |
| Kindergarten | 0 | 0.0% |
| Elementary School | 69 | 67.0% |
| Middle School | 0 | 0.0% |
| High School | 34 | 33.0% |
| College / Undergraduate | 0 | 0.0% |
| Graduate / Professional | 0 | 0.0% |
| Total | 103 | 100.0% |
School Enrollment by Age by Funding Source in Chilcoot Vinton
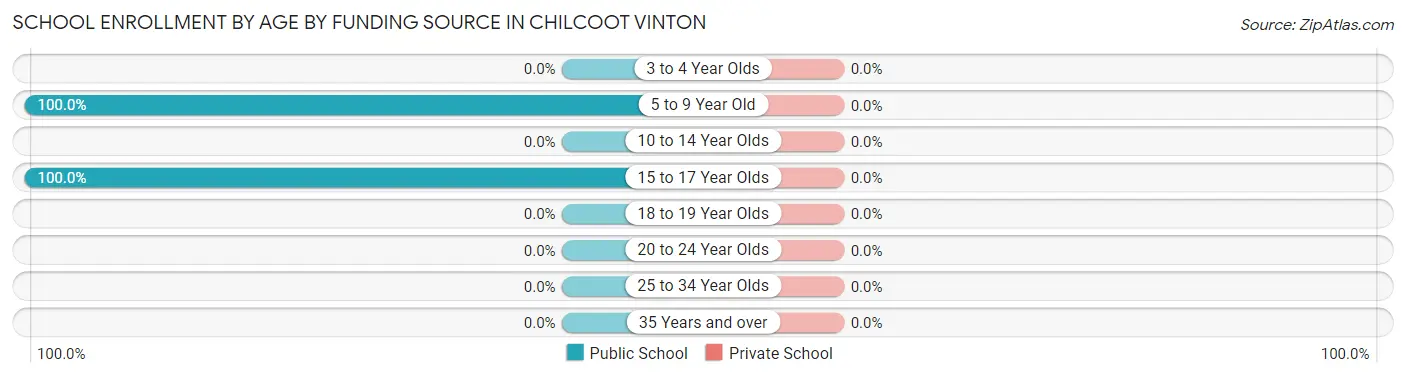
| Age Bracket | Public School | Private School |
| 3 to 4 Year Olds | 0 (0.0%) | 0 (0.0%) |
| 5 to 9 Year Old | 69 (100.0%) | 0 (0.0%) |
| 10 to 14 Year Olds | 0 (0.0%) | 0 (0.0%) |
| 15 to 17 Year Olds | 34 (100.0%) | 0 (0.0%) |
| 18 to 19 Year Olds | 0 (0.0%) | 0 (0.0%) |
| 20 to 24 Year Olds | 0 (0.0%) | 0 (0.0%) |
| 25 to 34 Year Olds | 0 (0.0%) | 0 (0.0%) |
| 35 Years and over | 0 (0.0%) | 0 (0.0%) |
| Total | 103 (100.0%) | 0 (0.0%) |
Educational Attainment by Field of Study in Chilcoot Vinton
Bio, nature & agricultural (40 | 50.0%), and physical & health sciences (40 | 50.0%) are the most common fields of study among 80 individuals in Chilcoot Vinton who have obtained a bachelor's degree or higher.
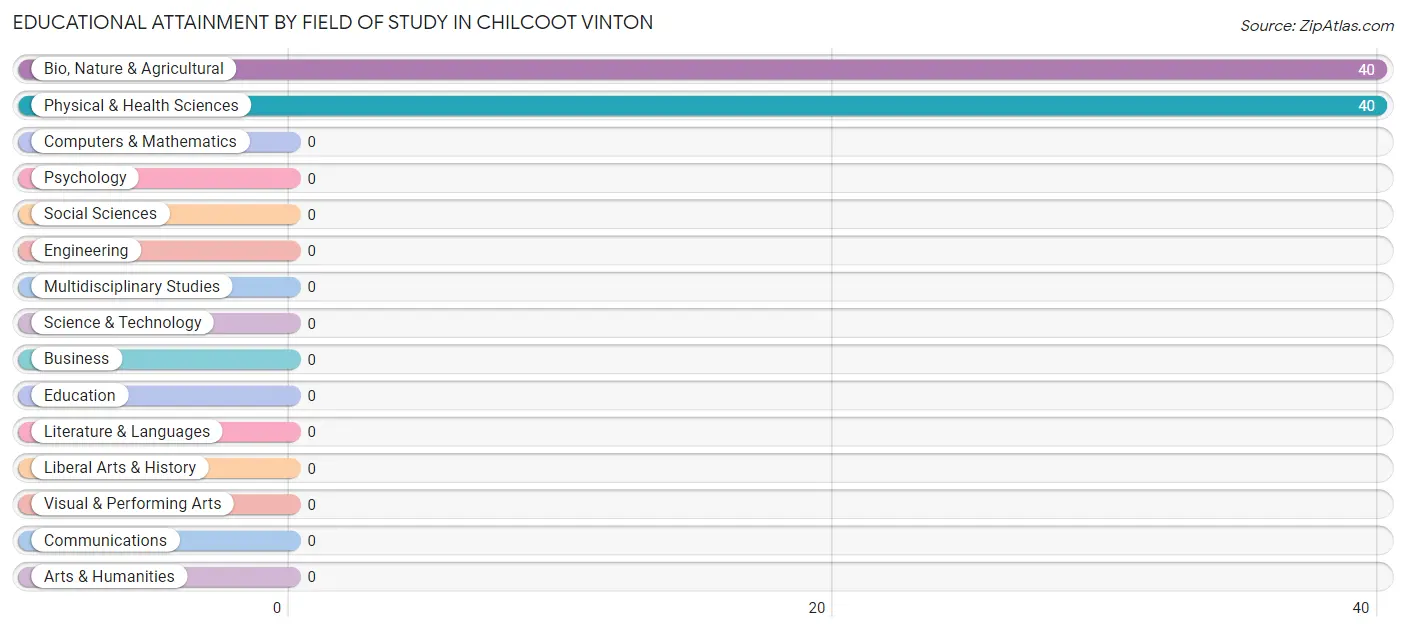
| Field of Study | # Graduates | % Graduates |
| Computers & Mathematics | 0 | 0.0% |
| Bio, Nature & Agricultural | 40 | 50.0% |
| Physical & Health Sciences | 40 | 50.0% |
| Psychology | 0 | 0.0% |
| Social Sciences | 0 | 0.0% |
| Engineering | 0 | 0.0% |
| Multidisciplinary Studies | 0 | 0.0% |
| Science & Technology | 0 | 0.0% |
| Business | 0 | 0.0% |
| Education | 0 | 0.0% |
| Literature & Languages | 0 | 0.0% |
| Liberal Arts & History | 0 | 0.0% |
| Visual & Performing Arts | 0 | 0.0% |
| Communications | 0 | 0.0% |
| Arts & Humanities | 0 | 0.0% |
| Total | 80 | 100.0% |
Transportation & Commute in Chilcoot Vinton
Vehicle Availability by Sex in Chilcoot Vinton
The most prevalent vehicle ownership categories in Chilcoot Vinton are males with 2 vehicles (112, accounting for 100.0%) and females with 2 vehicles (40, making up 280.0%).
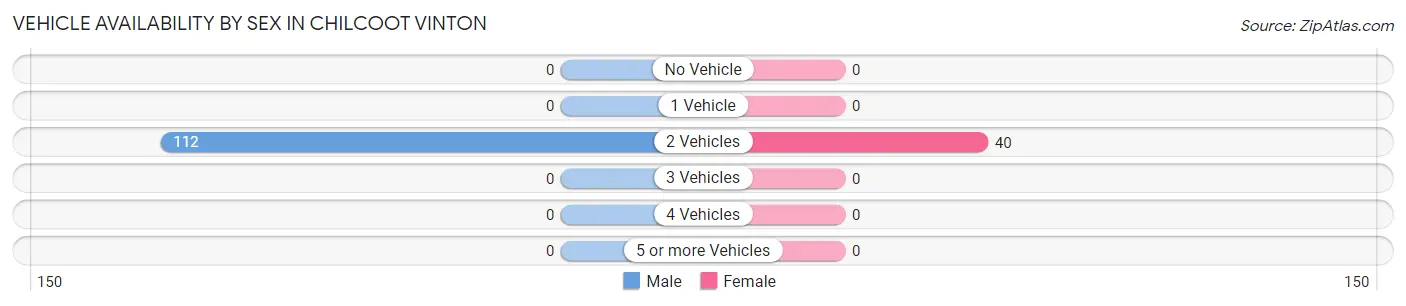
| Vehicles Available | Male | Female |
| No Vehicle | 0 (0.0%) | 0 (0.0%) |
| 1 Vehicle | 0 (0.0%) | 0 (0.0%) |
| 2 Vehicles | 112 (100.0%) | 40 (100.0%) |
| 3 Vehicles | 0 (0.0%) | 0 (0.0%) |
| 4 Vehicles | 0 (0.0%) | 0 (0.0%) |
| 5 or more Vehicles | 0 (0.0%) | 0 (0.0%) |
| Total | 112 (100.0%) | 40 (100.0%) |
Commute Time in Chilcoot Vinton
The most frequently occuring commute durations in Chilcoot Vinton are less than 5 minutes (78 commuters, 51.3%), 15 to 19 minutes (74 commuters, 48.7%), and 5 to 9 minutes (0 commuters, 0.0%).
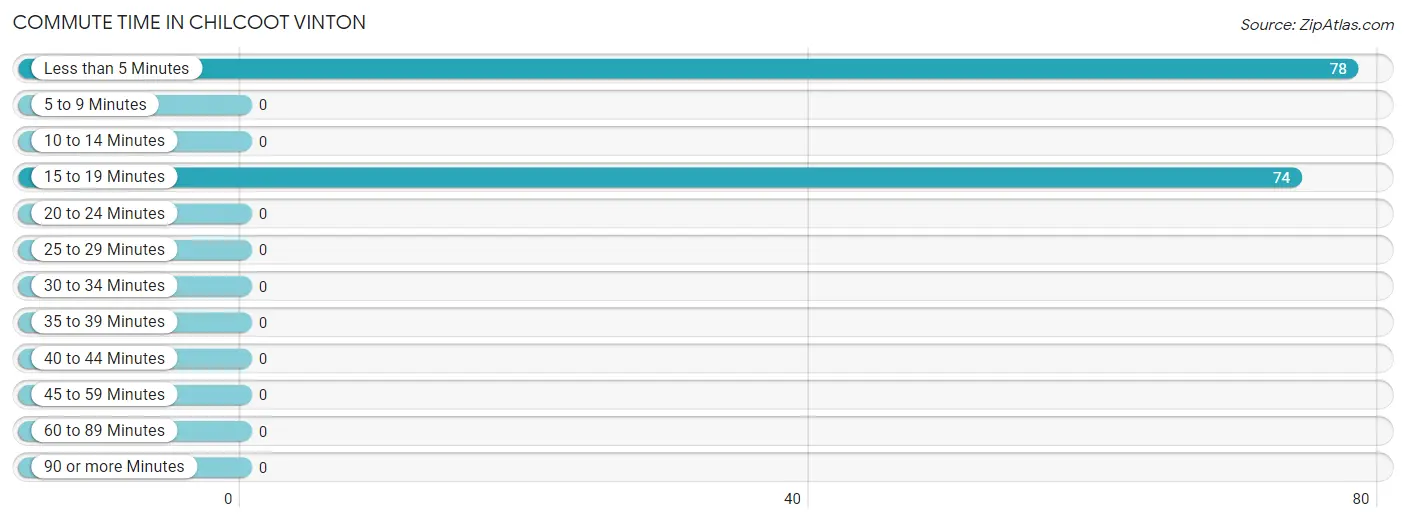
| Commute Time | # Commuters | % Commuters |
| Less than 5 Minutes | 78 | 51.3% |
| 5 to 9 Minutes | 0 | 0.0% |
| 10 to 14 Minutes | 0 | 0.0% |
| 15 to 19 Minutes | 74 | 48.7% |
| 20 to 24 Minutes | 0 | 0.0% |
| 25 to 29 Minutes | 0 | 0.0% |
| 30 to 34 Minutes | 0 | 0.0% |
| 35 to 39 Minutes | 0 | 0.0% |
| 40 to 44 Minutes | 0 | 0.0% |
| 45 to 59 Minutes | 0 | 0.0% |
| 60 to 89 Minutes | 0 | 0.0% |
| 90 or more Minutes | 0 | 0.0% |
Commute Time by Sex in Chilcoot Vinton
The most common commute times in Chilcoot Vinton are less than 5 minutes (78 commuters, 69.6%) for males and 15 to 19 minutes (40 commuters, 100.0%) for females.
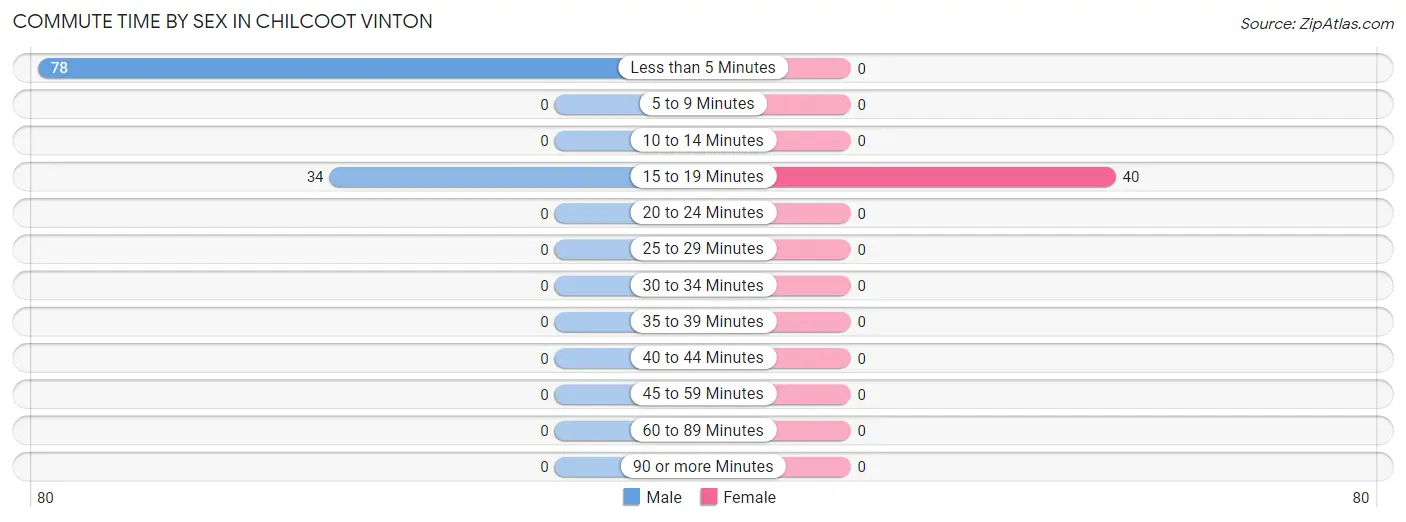
| Commute Time | Male | Female |
| Less than 5 Minutes | 78 (69.6%) | 0 (0.0%) |
| 5 to 9 Minutes | 0 (0.0%) | 0 (0.0%) |
| 10 to 14 Minutes | 0 (0.0%) | 0 (0.0%) |
| 15 to 19 Minutes | 34 (30.4%) | 40 (100.0%) |
| 20 to 24 Minutes | 0 (0.0%) | 0 (0.0%) |
| 25 to 29 Minutes | 0 (0.0%) | 0 (0.0%) |
| 30 to 34 Minutes | 0 (0.0%) | 0 (0.0%) |
| 35 to 39 Minutes | 0 (0.0%) | 0 (0.0%) |
| 40 to 44 Minutes | 0 (0.0%) | 0 (0.0%) |
| 45 to 59 Minutes | 0 (0.0%) | 0 (0.0%) |
| 60 to 89 Minutes | 0 (0.0%) | 0 (0.0%) |
| 90 or more Minutes | 0 (0.0%) | 0 (0.0%) |
Time of Departure to Work by Sex in Chilcoot Vinton
The most frequent times of departure to work in Chilcoot Vinton are 6:30 AM to 6:59 AM (78, 69.6%) for males and 8:00 AM to 8:29 AM (40, 100.0%) for females.
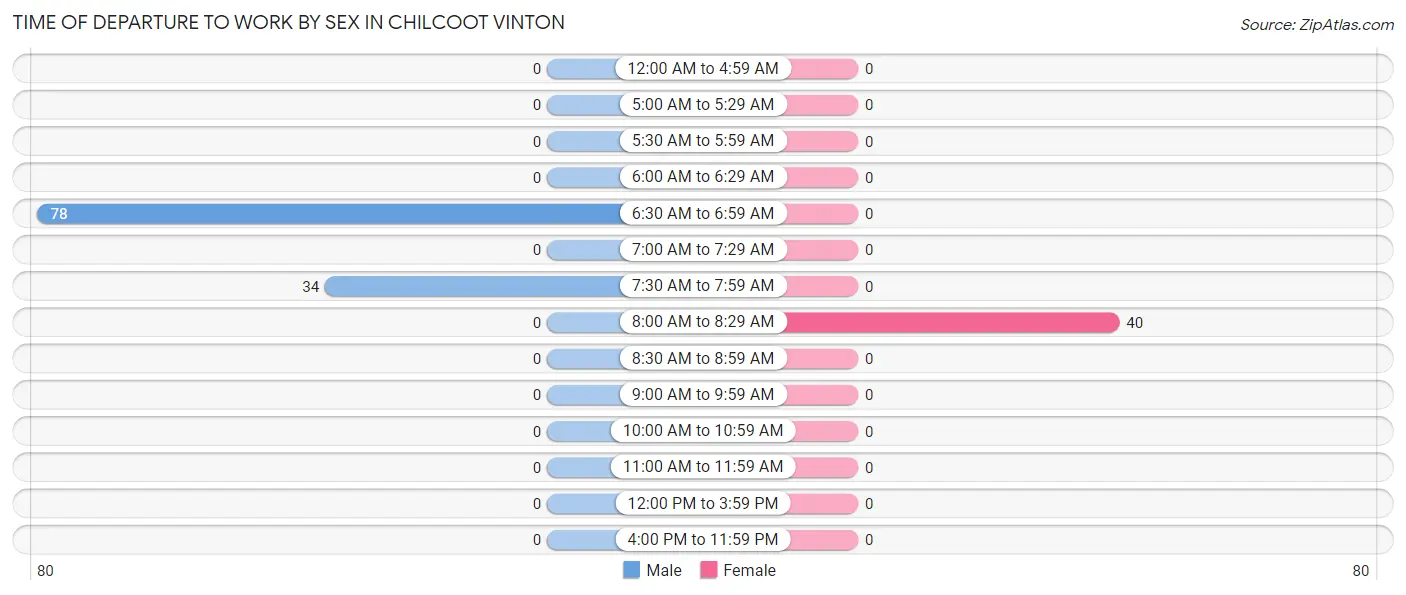
| Time of Departure | Male | Female |
| 12:00 AM to 4:59 AM | 0 (0.0%) | 0 (0.0%) |
| 5:00 AM to 5:29 AM | 0 (0.0%) | 0 (0.0%) |
| 5:30 AM to 5:59 AM | 0 (0.0%) | 0 (0.0%) |
| 6:00 AM to 6:29 AM | 0 (0.0%) | 0 (0.0%) |
| 6:30 AM to 6:59 AM | 78 (69.6%) | 0 (0.0%) |
| 7:00 AM to 7:29 AM | 0 (0.0%) | 0 (0.0%) |
| 7:30 AM to 7:59 AM | 34 (30.4%) | 0 (0.0%) |
| 8:00 AM to 8:29 AM | 0 (0.0%) | 40 (100.0%) |
| 8:30 AM to 8:59 AM | 0 (0.0%) | 0 (0.0%) |
| 9:00 AM to 9:59 AM | 0 (0.0%) | 0 (0.0%) |
| 10:00 AM to 10:59 AM | 0 (0.0%) | 0 (0.0%) |
| 11:00 AM to 11:59 AM | 0 (0.0%) | 0 (0.0%) |
| 12:00 PM to 3:59 PM | 0 (0.0%) | 0 (0.0%) |
| 4:00 PM to 11:59 PM | 0 (0.0%) | 0 (0.0%) |
| Total | 112 (100.0%) | 40 (100.0%) |
Housing Occupancy in Chilcoot Vinton
Occupancy by Ownership in Chilcoot Vinton
Of the total 149 dwellings in Chilcoot Vinton, owner-occupied units account for 149 (100.0%), while renter-occupied units make up 0 (0.0%).
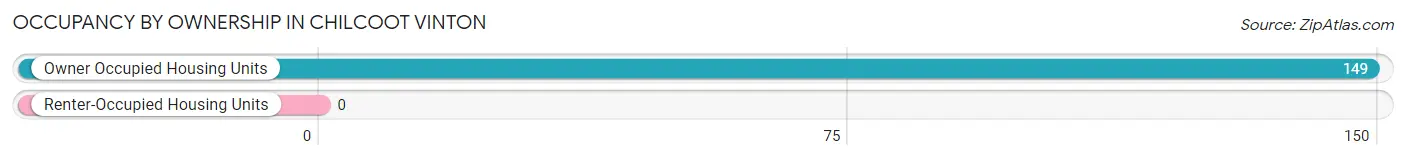
| Occupancy | # Housing Units | % Housing Units |
| Owner Occupied Housing Units | 149 | 100.0% |
| Renter-Occupied Housing Units | 0 | 0.0% |
| Total Occupied Housing Units | 149 | 100.0% |
Occupancy by Household Size in Chilcoot Vinton
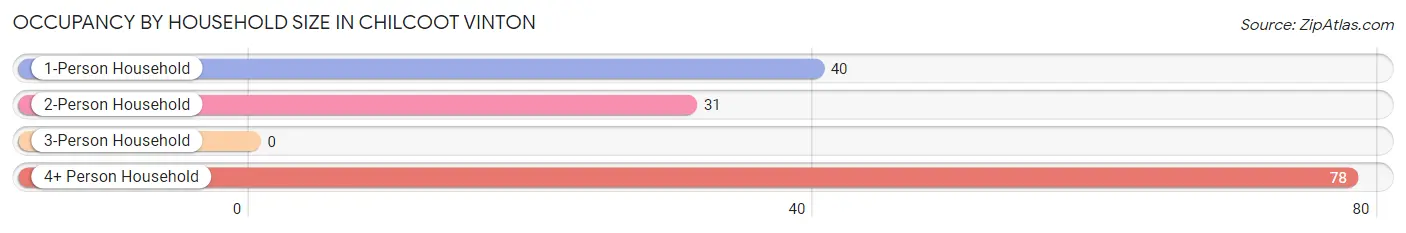
| Household Size | # Housing Units | % Housing Units |
| 1-Person Household | 40 | 26.9% |
| 2-Person Household | 31 | 20.8% |
| 3-Person Household | 0 | 0.0% |
| 4+ Person Household | 78 | 52.3% |
| Total Housing Units | 149 | 100.0% |
Occupancy by Ownership by Household Size in Chilcoot Vinton
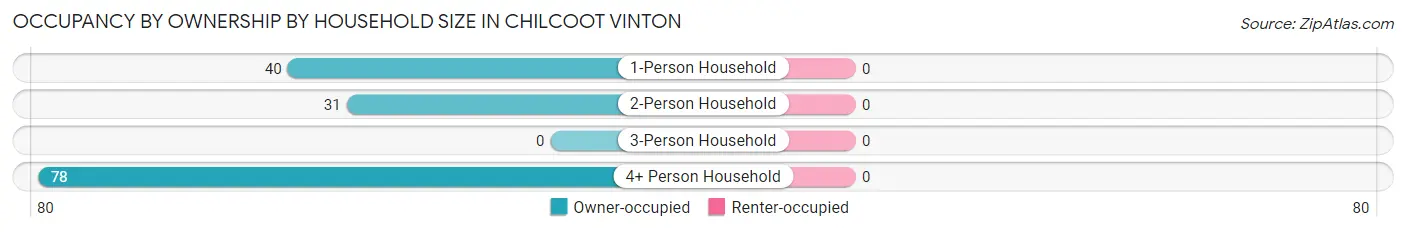
| Household Size | Owner-occupied | Renter-occupied |
| 1-Person Household | 40 (100.0%) | 0 (0.0%) |
| 2-Person Household | 31 (100.0%) | 0 (0.0%) |
| 3-Person Household | 0 (0.0%) | 0 (0.0%) |
| 4+ Person Household | 78 (100.0%) | 0 (0.0%) |
| Total Housing Units | 149 (100.0%) | 0 (0.0%) |
Occupancy by Educational Attainment in Chilcoot Vinton
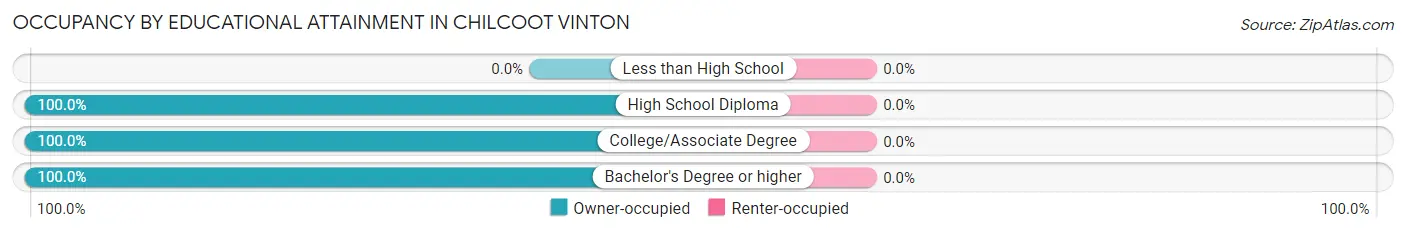
| Household Size | Owner-occupied | Renter-occupied |
| Less than High School | 0 (0.0%) | 0 (0.0%) |
| High School Diploma | 31 (100.0%) | 0 (0.0%) |
| College/Associate Degree | 78 (100.0%) | 0 (0.0%) |
| Bachelor's Degree or higher | 40 (100.0%) | 0 (0.0%) |
Occupancy by Age of Householder in Chilcoot Vinton
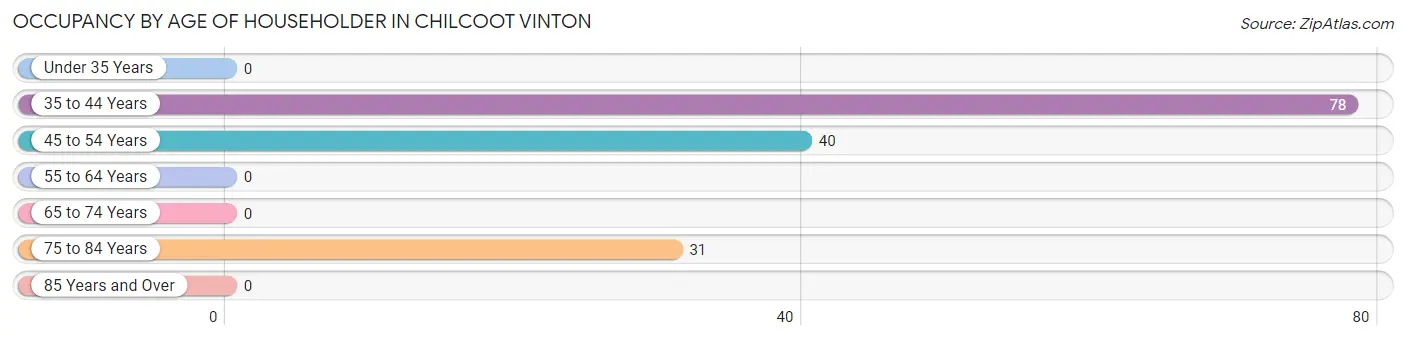
| Age Bracket | # Households | % Households |
| Under 35 Years | 0 | 0.0% |
| 35 to 44 Years | 78 | 52.3% |
| 45 to 54 Years | 40 | 26.9% |
| 55 to 64 Years | 0 | 0.0% |
| 65 to 74 Years | 0 | 0.0% |
| 75 to 84 Years | 31 | 20.8% |
| 85 Years and Over | 0 | 0.0% |
| Total | 149 | 100.0% |
Housing Finances in Chilcoot Vinton
Median Income by Occupancy in Chilcoot Vinton
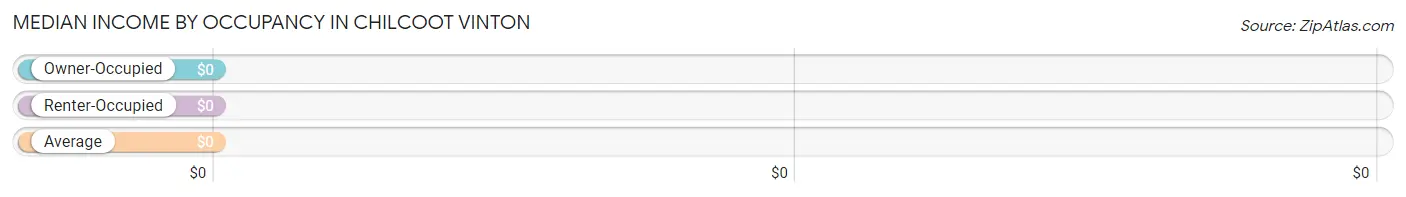
| Occupancy Type | # Households | Median Income |
| Owner-Occupied | 149 (100.0%) | $0 |
| Renter-Occupied | 0 (0.0%) | $0 |
| Average | 149 (100.0%) | $0 |
Occupancy by Householder Income Bracket in Chilcoot Vinton
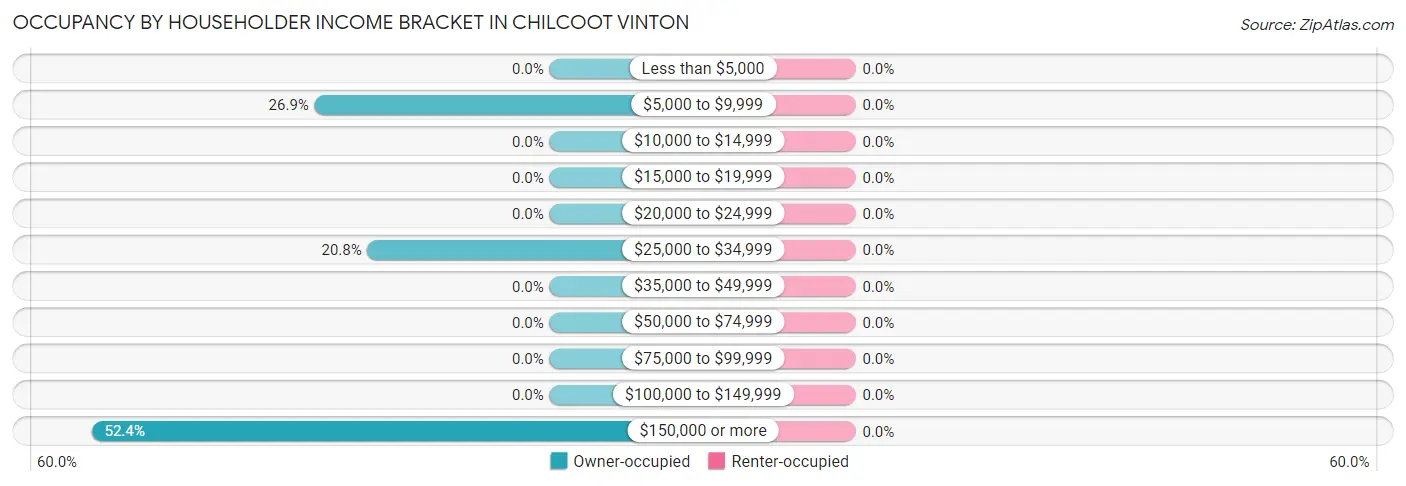
| Income Bracket | Owner-occupied | Renter-occupied |
| Less than $5,000 | 0 (0.0%) | 0 (0.0%) |
| $5,000 to $9,999 | 40 (26.9%) | 0 (0.0%) |
| $10,000 to $14,999 | 0 (0.0%) | 0 (0.0%) |
| $15,000 to $19,999 | 0 (0.0%) | 0 (0.0%) |
| $20,000 to $24,999 | 0 (0.0%) | 0 (0.0%) |
| $25,000 to $34,999 | 31 (20.8%) | 0 (0.0%) |
| $35,000 to $49,999 | 0 (0.0%) | 0 (0.0%) |
| $50,000 to $74,999 | 0 (0.0%) | 0 (0.0%) |
| $75,000 to $99,999 | 0 (0.0%) | 0 (0.0%) |
| $100,000 to $149,999 | 0 (0.0%) | 0 (0.0%) |
| $150,000 or more | 78 (52.3%) | 0 (0.0%) |
| Total | 149 (100.0%) | 0 (0.0%) |
Monthly Housing Cost Tiers in Chilcoot Vinton
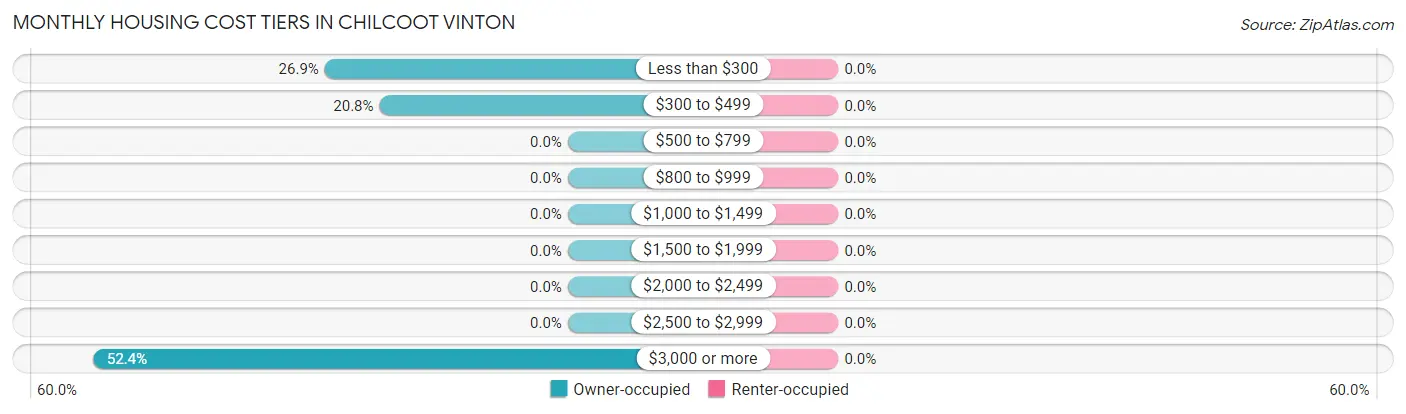
| Monthly Cost | Owner-occupied | Renter-occupied |
| Less than $300 | 40 (26.9%) | 0 (0.0%) |
| $300 to $499 | 31 (20.8%) | 0 (0.0%) |
| $500 to $799 | 0 (0.0%) | 0 (0.0%) |
| $800 to $999 | 0 (0.0%) | 0 (0.0%) |
| $1,000 to $1,499 | 0 (0.0%) | 0 (0.0%) |
| $1,500 to $1,999 | 0 (0.0%) | 0 (0.0%) |
| $2,000 to $2,499 | 0 (0.0%) | 0 (0.0%) |
| $2,500 to $2,999 | 0 (0.0%) | 0 (0.0%) |
| $3,000 or more | 78 (52.3%) | 0 (0.0%) |
| Total | 149 (100.0%) | 0 (0.0%) |
Physical Housing Characteristics in Chilcoot Vinton
Housing Structures in Chilcoot Vinton
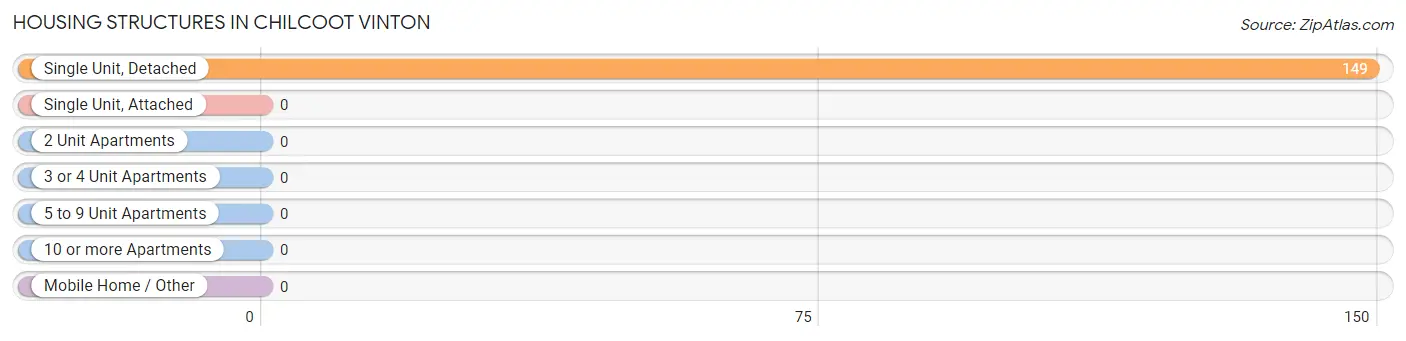
| Structure Type | # Housing Units | % Housing Units |
| Single Unit, Detached | 149 | 100.0% |
| Single Unit, Attached | 0 | 0.0% |
| 2 Unit Apartments | 0 | 0.0% |
| 3 or 4 Unit Apartments | 0 | 0.0% |
| 5 to 9 Unit Apartments | 0 | 0.0% |
| 10 or more Apartments | 0 | 0.0% |
| Mobile Home / Other | 0 | 0.0% |
| Total | 149 | 100.0% |
Housing Structures by Occupancy in Chilcoot Vinton
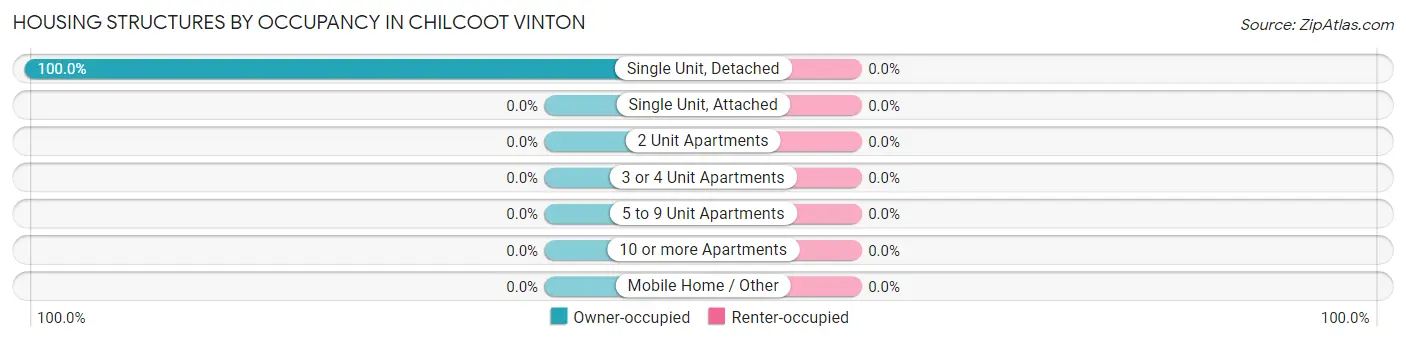
| Structure Type | Owner-occupied | Renter-occupied |
| Single Unit, Detached | 149 (100.0%) | 0 (0.0%) |
| Single Unit, Attached | 0 (0.0%) | 0 (0.0%) |
| 2 Unit Apartments | 0 (0.0%) | 0 (0.0%) |
| 3 or 4 Unit Apartments | 0 (0.0%) | 0 (0.0%) |
| 5 to 9 Unit Apartments | 0 (0.0%) | 0 (0.0%) |
| 10 or more Apartments | 0 (0.0%) | 0 (0.0%) |
| Mobile Home / Other | 0 (0.0%) | 0 (0.0%) |
| Total | 149 (100.0%) | 0 (0.0%) |
Housing Structures by Number of Rooms in Chilcoot Vinton
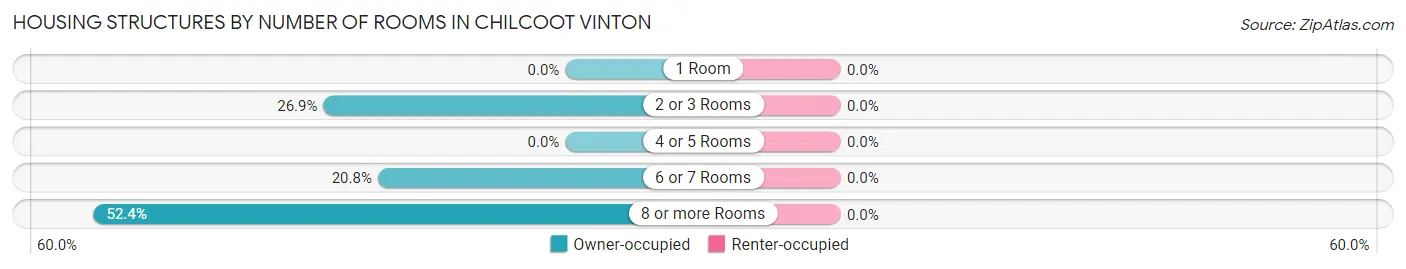
| Number of Rooms | Owner-occupied | Renter-occupied |
| 1 Room | 0 (0.0%) | 0 (0.0%) |
| 2 or 3 Rooms | 40 (26.9%) | 0 (0.0%) |
| 4 or 5 Rooms | 0 (0.0%) | 0 (0.0%) |
| 6 or 7 Rooms | 31 (20.8%) | 0 (0.0%) |
| 8 or more Rooms | 78 (52.3%) | 0 (0.0%) |
| Total | 149 (100.0%) | 0 (0.0%) |
Housing Structure by Heating Type in Chilcoot Vinton
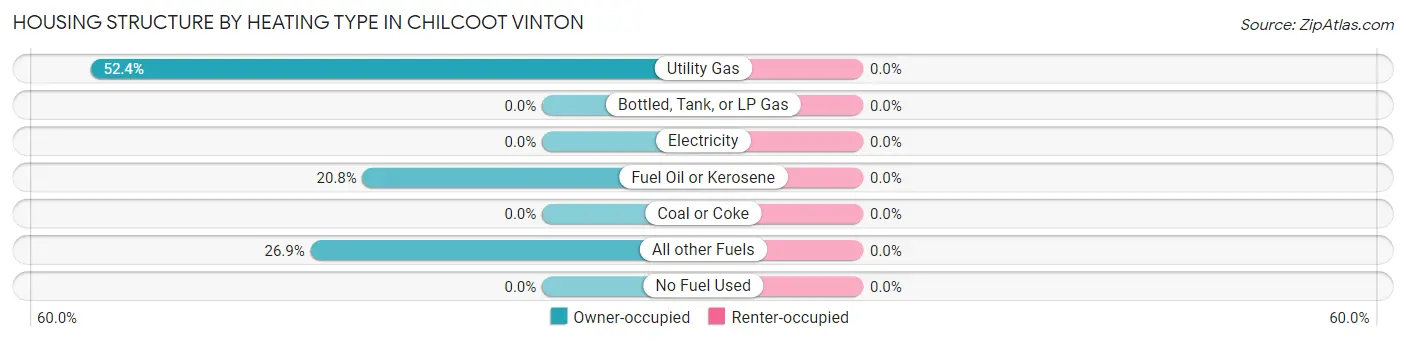
| Heating Type | Owner-occupied | Renter-occupied |
| Utility Gas | 78 (52.3%) | 0 (0.0%) |
| Bottled, Tank, or LP Gas | 0 (0.0%) | 0 (0.0%) |
| Electricity | 0 (0.0%) | 0 (0.0%) |
| Fuel Oil or Kerosene | 31 (20.8%) | 0 (0.0%) |
| Coal or Coke | 0 (0.0%) | 0 (0.0%) |
| All other Fuels | 40 (26.9%) | 0 (0.0%) |
| No Fuel Used | 0 (0.0%) | 0 (0.0%) |
| Total | 149 (100.0%) | 0 (0.0%) |
Household Vehicle Usage in Chilcoot Vinton
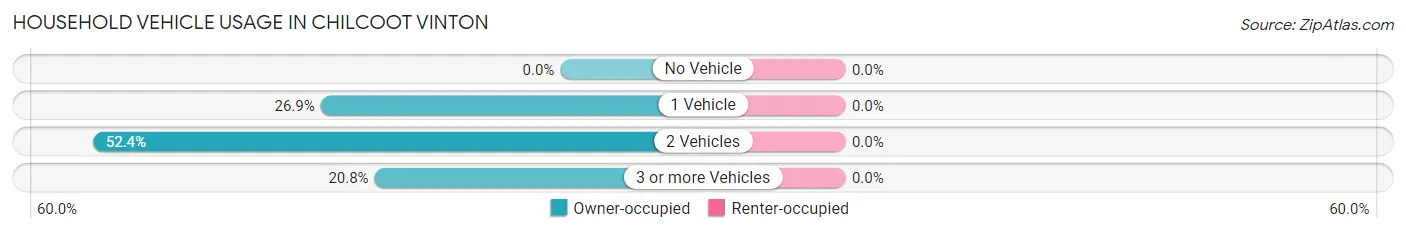
| Vehicles per Household | Owner-occupied | Renter-occupied |
| No Vehicle | 0 (0.0%) | 0 (0.0%) |
| 1 Vehicle | 40 (26.9%) | 0 (0.0%) |
| 2 Vehicles | 78 (52.3%) | 0 (0.0%) |
| 3 or more Vehicles | 31 (20.8%) | 0 (0.0%) |
| Total | 149 (100.0%) | 0 (0.0%) |
Real Estate & Mortgages in Chilcoot Vinton
Real Estate and Mortgage Overview in Chilcoot Vinton
| Characteristic | Without Mortgage | With Mortgage |
| Housing Units | 71 | 78 |
| Median Property Value | - | - |
| Median Household Income | - | - |
| Monthly Housing Costs | - | - |
| Real Estate Taxes | - | - |
Property Value by Mortgage Status in Chilcoot Vinton
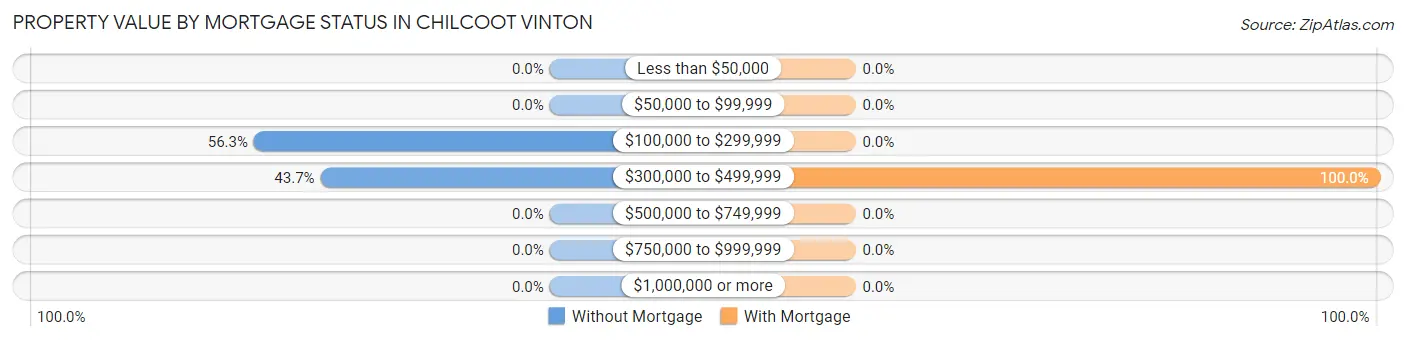
| Property Value | Without Mortgage | With Mortgage |
| Less than $50,000 | 0 (0.0%) | 0 (0.0%) |
| $50,000 to $99,999 | 0 (0.0%) | 0 (0.0%) |
| $100,000 to $299,999 | 40 (56.3%) | 0 (0.0%) |
| $300,000 to $499,999 | 31 (43.7%) | 78 (100.0%) |
| $500,000 to $749,999 | 0 (0.0%) | 0 (0.0%) |
| $750,000 to $999,999 | 0 (0.0%) | 0 (0.0%) |
| $1,000,000 or more | 0 (0.0%) | 0 (0.0%) |
| Total | 71 (100.0%) | 78 (100.0%) |
Household Income by Mortgage Status in Chilcoot Vinton
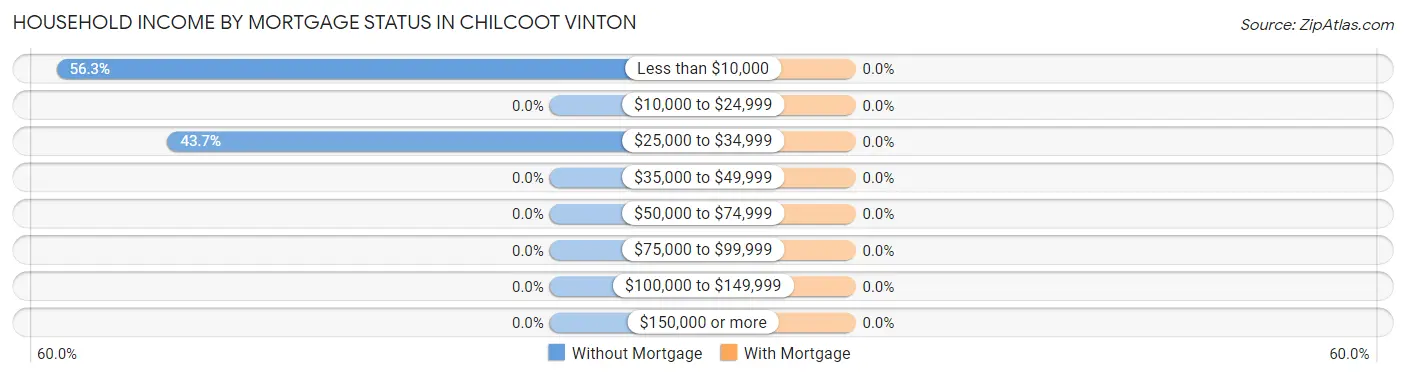
| Household Income | Without Mortgage | With Mortgage |
| Less than $10,000 | 40 (56.3%) | 0 (0.0%) |
| $10,000 to $24,999 | 0 (0.0%) | 0 (0.0%) |
| $25,000 to $34,999 | 31 (43.7%) | 0 (0.0%) |
| $35,000 to $49,999 | 0 (0.0%) | 0 (0.0%) |
| $50,000 to $74,999 | 0 (0.0%) | 0 (0.0%) |
| $75,000 to $99,999 | 0 (0.0%) | 0 (0.0%) |
| $100,000 to $149,999 | 0 (0.0%) | 0 (0.0%) |
| $150,000 or more | 0 (0.0%) | 0 (0.0%) |
| Total | 71 (100.0%) | 78 (100.0%) |
Property Value to Household Income Ratio in Chilcoot Vinton
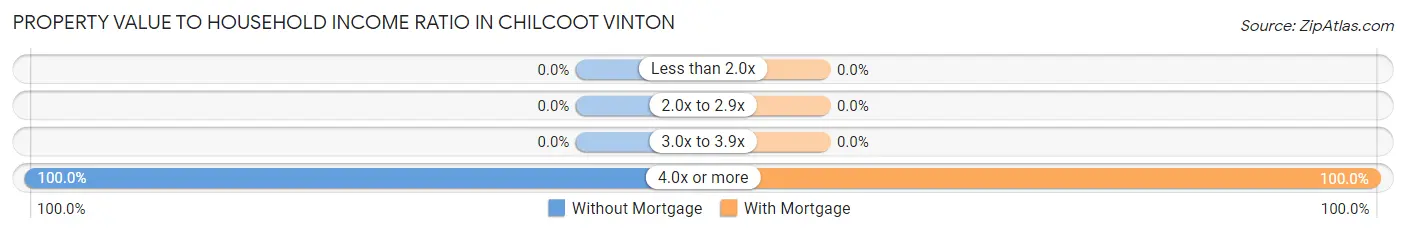
| Value-to-Income Ratio | Without Mortgage | With Mortgage |
| Less than 2.0x | 0 (0.0%) | 0 (0.0%) |
| 2.0x to 2.9x | 0 (0.0%) | 0 (0.0%) |
| 3.0x to 3.9x | 0 (0.0%) | 0 (0.0%) |
| 4.0x or more | 71 (100.0%) | 78 (100.0%) |
| Total | 71 (100.0%) | 78 (100.0%) |
Real Estate Taxes by Mortgage Status in Chilcoot Vinton
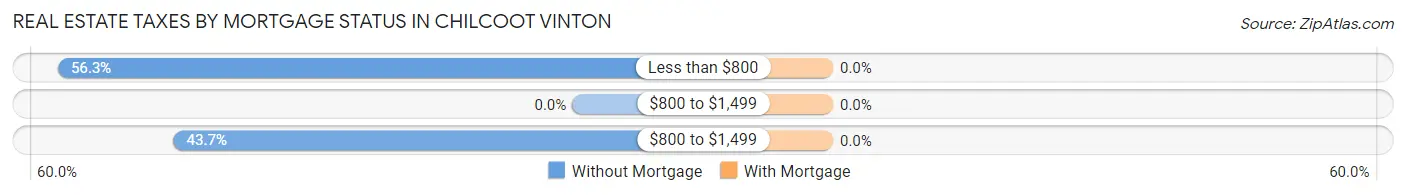
| Property Taxes | Without Mortgage | With Mortgage |
| Less than $800 | 40 (56.3%) | 0 (0.0%) |
| $800 to $1,499 | 0 (0.0%) | 0 (0.0%) |
| $800 to $1,499 | 31 (43.7%) | 0 (0.0%) |
| Total | 71 (100.0%) | 78 (100.0%) |
Health & Disability in Chilcoot Vinton
Health Insurance Coverage by Age in Chilcoot Vinton
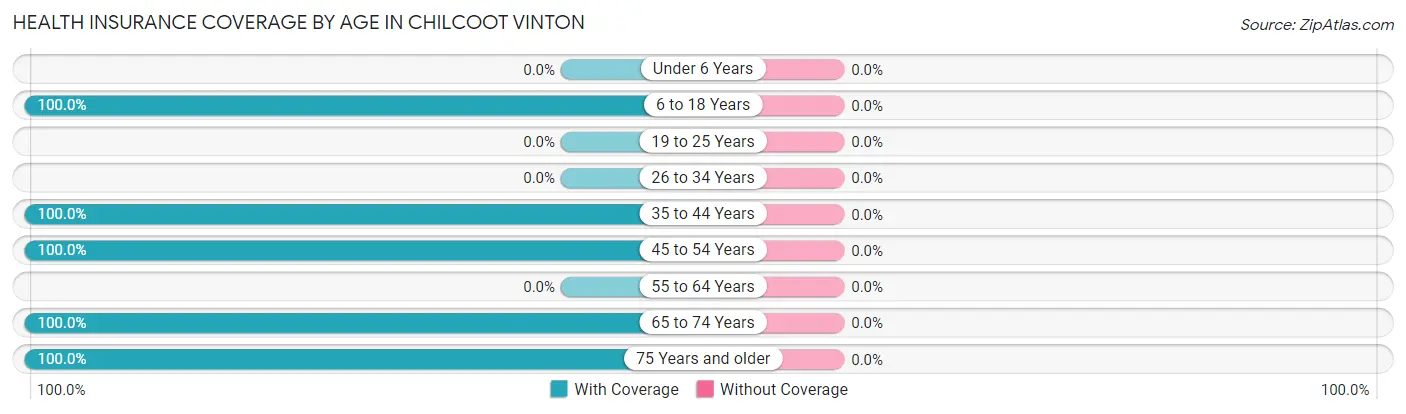
| Age Bracket | With Coverage | Without Coverage |
| Under 6 Years | 0 (0.0%) | 0 (0.0%) |
| 6 to 18 Years | 103 (100.0%) | 0 (0.0%) |
| 19 to 25 Years | 0 (0.0%) | 0 (0.0%) |
| 26 to 34 Years | 0 (0.0%) | 0 (0.0%) |
| 35 to 44 Years | 118 (100.0%) | 0 (0.0%) |
| 45 to 54 Years | 40 (100.0%) | 0 (0.0%) |
| 55 to 64 Years | 0 (0.0%) | 0 (0.0%) |
| 65 to 74 Years | 82 (100.0%) | 0 (0.0%) |
| 75 Years and older | 31 (100.0%) | 0 (0.0%) |
| Total | 374 (100.0%) | 0 (0.0%) |
Health Insurance Coverage by Citizenship Status in Chilcoot Vinton
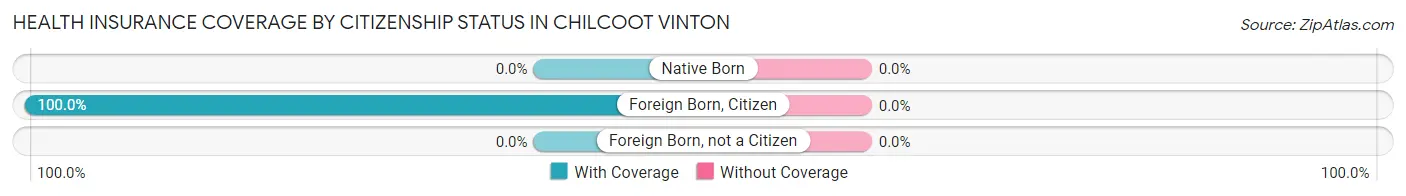
| Citizenship Status | With Coverage | Without Coverage |
| Native Born | 0 (0.0%) | 0 (0.0%) |
| Foreign Born, Citizen | 103 (100.0%) | 0 (0.0%) |
| Foreign Born, not a Citizen | 0 (0.0%) | 0 (0.0%) |
Health Insurance Coverage by Household Income in Chilcoot Vinton
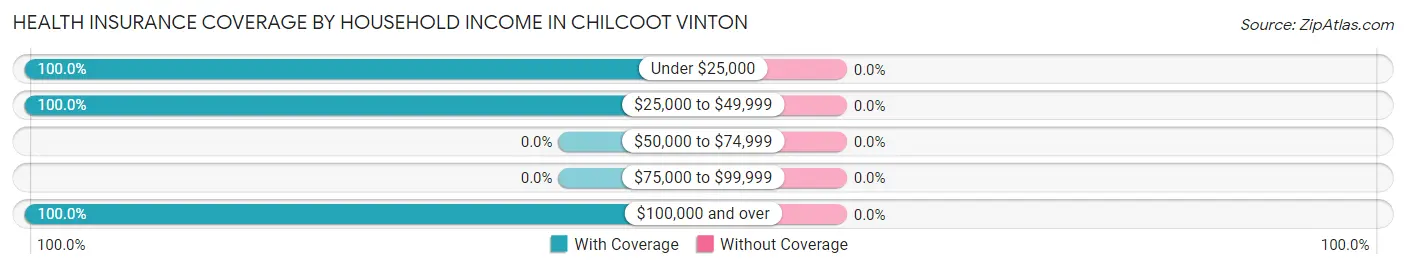
| Household Income | With Coverage | Without Coverage |
| Under $25,000 | 40 (100.0%) | 0 (0.0%) |
| $25,000 to $49,999 | 113 (100.0%) | 0 (0.0%) |
| $50,000 to $74,999 | 0 (0.0%) | 0 (0.0%) |
| $75,000 to $99,999 | 0 (0.0%) | 0 (0.0%) |
| $100,000 and over | 221 (100.0%) | 0 (0.0%) |
Public vs Private Health Insurance Coverage by Age in Chilcoot Vinton
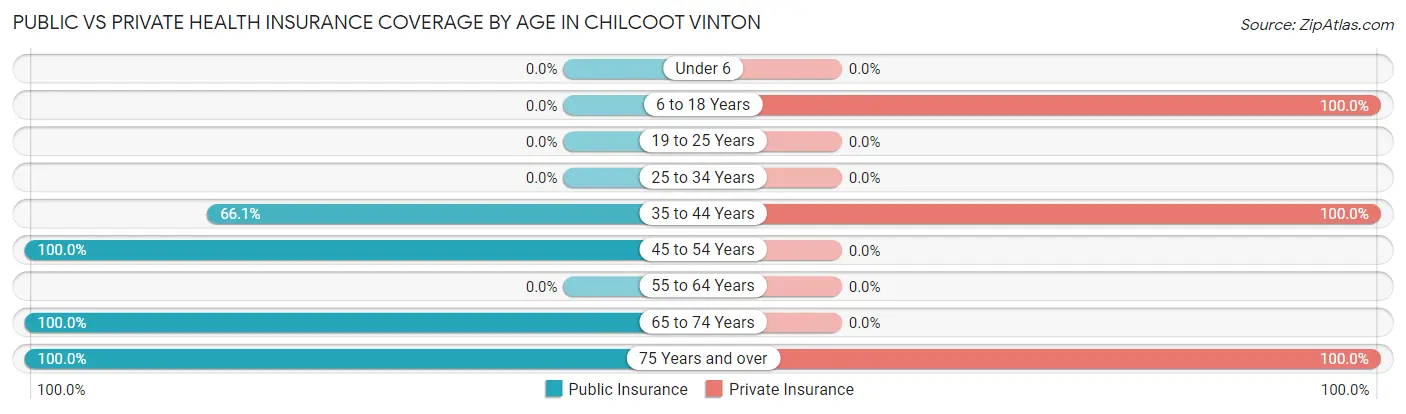
| Age Bracket | Public Insurance | Private Insurance |
| Under 6 | 0 (0.0%) | 0 (0.0%) |
| 6 to 18 Years | 0 (0.0%) | 103 (100.0%) |
| 19 to 25 Years | 0 (0.0%) | 0 (0.0%) |
| 25 to 34 Years | 0 (0.0%) | 0 (0.0%) |
| 35 to 44 Years | 78 (66.1%) | 118 (100.0%) |
| 45 to 54 Years | 40 (100.0%) | 0 (0.0%) |
| 55 to 64 Years | 0 (0.0%) | 0 (0.0%) |
| 65 to 74 Years | 82 (100.0%) | 0 (0.0%) |
| 75 Years and over | 31 (100.0%) | 31 (100.0%) |
| Total | 231 (61.8%) | 252 (67.4%) |
Disability Status by Sex by Age in Chilcoot Vinton
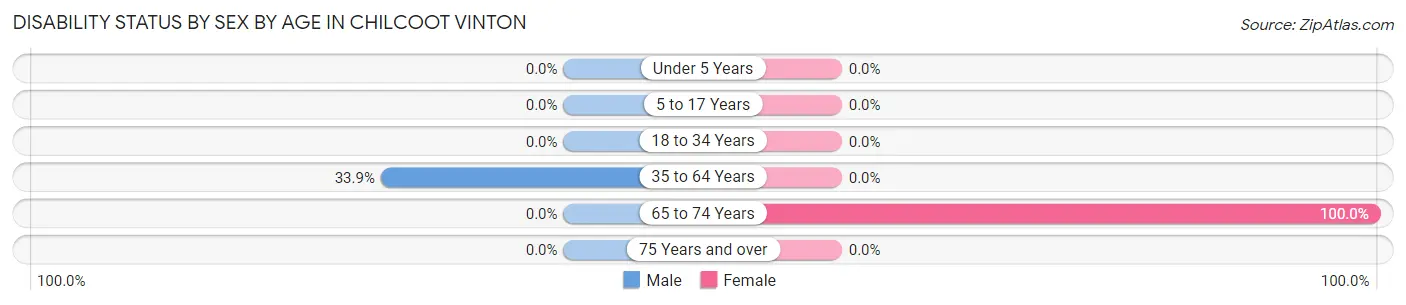
| Age Bracket | Male | Female |
| Under 5 Years | 0 (0.0%) | 0 (0.0%) |
| 5 to 17 Years | 0 (0.0%) | 0 (0.0%) |
| 18 to 34 Years | 0 (0.0%) | 0 (0.0%) |
| 35 to 64 Years | 40 (33.9%) | 0 (0.0%) |
| 65 to 74 Years | 0 (0.0%) | 82 (100.0%) |
| 75 Years and over | 0 (0.0%) | 0 (0.0%) |
Disability Class by Sex by Age in Chilcoot Vinton
Disability Class: Hearing Difficulty
| Age Bracket | Male | Female |
| Under 5 Years | 0 (0.0%) | 0 (0.0%) |
| 5 to 17 Years | 0 (0.0%) | 0 (0.0%) |
| 18 to 34 Years | 0 (0.0%) | 0 (0.0%) |
| 35 to 64 Years | 0 (0.0%) | 0 (0.0%) |
| 65 to 74 Years | 0 (0.0%) | 0 (0.0%) |
| 75 Years and over | 0 (0.0%) | 0 (0.0%) |
Disability Class: Vision Difficulty
| Age Bracket | Male | Female |
| Under 5 Years | 0 (0.0%) | 0 (0.0%) |
| 5 to 17 Years | 0 (0.0%) | 0 (0.0%) |
| 18 to 34 Years | 0 (0.0%) | 0 (0.0%) |
| 35 to 64 Years | 0 (0.0%) | 0 (0.0%) |
| 65 to 74 Years | 0 (0.0%) | 0 (0.0%) |
| 75 Years and over | 0 (0.0%) | 0 (0.0%) |
Disability Class: Cognitive Difficulty
| Age Bracket | Male | Female |
| 5 to 17 Years | 0 (0.0%) | 0 (0.0%) |
| 18 to 34 Years | 0 (0.0%) | 0 (0.0%) |
| 35 to 64 Years | 0 (0.0%) | 0 (0.0%) |
| 65 to 74 Years | 0 (0.0%) | 0 (0.0%) |
| 75 Years and over | 0 (0.0%) | 0 (0.0%) |
Disability Class: Ambulatory Difficulty
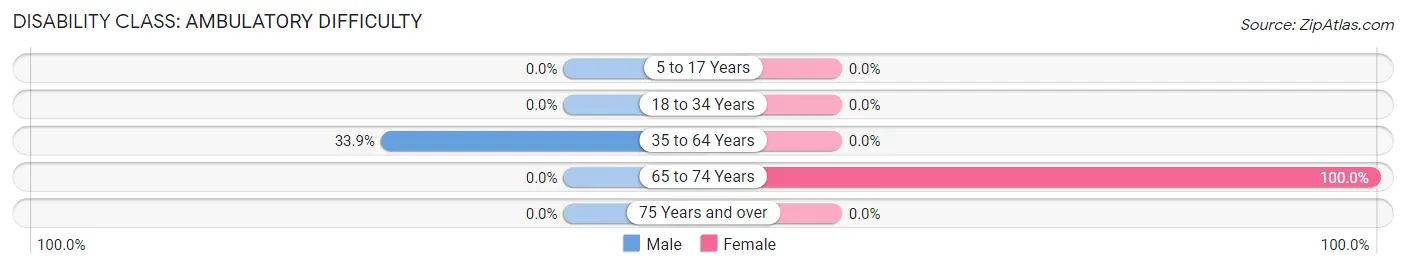
| Age Bracket | Male | Female |
| 5 to 17 Years | 0 (0.0%) | 0 (0.0%) |
| 18 to 34 Years | 0 (0.0%) | 0 (0.0%) |
| 35 to 64 Years | 40 (33.9%) | 0 (0.0%) |
| 65 to 74 Years | 0 (0.0%) | 82 (100.0%) |
| 75 Years and over | 0 (0.0%) | 0 (0.0%) |
Disability Class: Self-Care Difficulty

| Age Bracket | Male | Female |
| 5 to 17 Years | 0 (0.0%) | 0 (0.0%) |
| 18 to 34 Years | 0 (0.0%) | 0 (0.0%) |
| 35 to 64 Years | 40 (33.9%) | 0 (0.0%) |
| 65 to 74 Years | 0 (0.0%) | 82 (100.0%) |
| 75 Years and over | 0 (0.0%) | 0 (0.0%) |
Technology Access in Chilcoot Vinton
Computing Device Access in Chilcoot Vinton
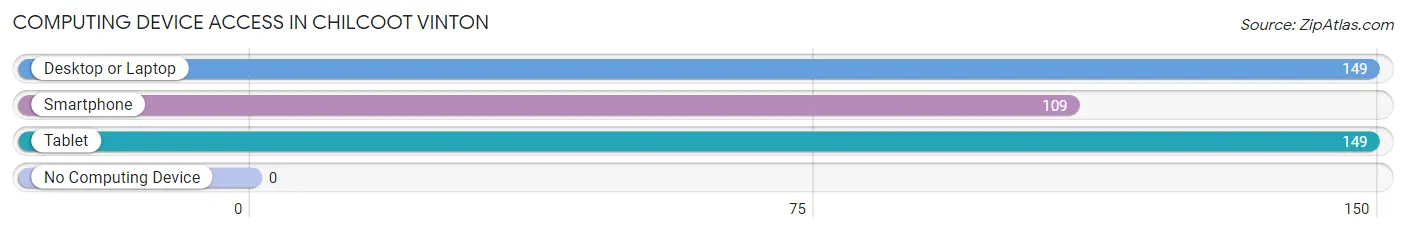
| Device Type | # Households | % Households |
| Desktop or Laptop | 149 | 100.0% |
| Smartphone | 109 | 73.2% |
| Tablet | 149 | 100.0% |
| No Computing Device | 0 | 0.0% |
| Total | 149 | 100.0% |
Internet Access in Chilcoot Vinton
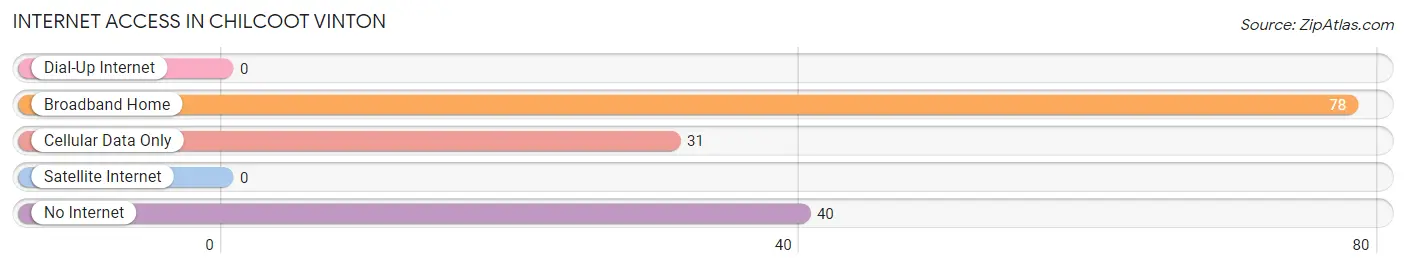
| Internet Type | # Households | % Households |
| Dial-Up Internet | 0 | 0.0% |
| Broadband Home | 78 | 52.3% |
| Cellular Data Only | 31 | 20.8% |
| Satellite Internet | 0 | 0.0% |
| No Internet | 40 | 26.9% |
| Total | 149 | 100.0% |
Chilcoot Vinton Summary
Chilcoot Vinton is a small unincorporated community located in Plumas County, California. It is situated in the Sierra Nevada mountain range, approximately 20 miles east of the city of Portola. The community is located at an elevation of 4,890 feet and is surrounded by the Plumas National Forest. The population of Chilcoot Vinton was estimated to be around 200 people in 2000.
History
The area that is now Chilcoot Vinton was originally inhabited by the Maidu and Washoe Native American tribes. The first European settlers arrived in the area in the late 1800s, and the town was officially established in 1891. The town was named after the Chilcoot Pass, which was used by Native Americans and early settlers to cross the Sierra Nevada mountain range.
The town was initially a mining community, with gold and silver being the primary minerals mined. The town also had a sawmill and a few other businesses. In the early 1900s, the town began to decline as the mining industry declined. The town was nearly abandoned by the 1940s, but a few people remained and the town was eventually re-established.
Geography
Chilcoot Vinton is located in the Sierra Nevada mountain range in Plumas County, California. The town is situated at an elevation of 4,890 feet and is surrounded by the Plumas National Forest. The town is located approximately 20 miles east of the city of Portola. The climate in Chilcoot Vinton is generally mild, with temperatures ranging from the mid-30s in the winter to the mid-80s in the summer.
Economy
The economy of Chilcoot Vinton is largely based on tourism. The town is a popular destination for outdoor recreation, such as camping, fishing, and hiking. The town also has a few small businesses, such as a general store and a gas station.
Demographics
The population of Chilcoot Vinton was estimated to be around 200 people in 2000. The racial makeup of the town was 95.0% White, 0.5% African American, 0.5% Native American, 0.5% Asian, and 3.5% from other races. The median household income in Chilcoot Vinton was $30,000 in 2000. The median age of the population was 44.5 years.
Common Questions
What is Per Capita Income in Chilcoot Vinton?
Per Capita income in Chilcoot Vinton is $33,024.
What is Inequality or Gini Index in Chilcoot Vinton?
Inequality or Gini Index in Chilcoot Vinton is 0.41.
What is the Total Population of Chilcoot Vinton?
Total Population of Chilcoot Vinton is 374.
What is the Total Male Population of Chilcoot Vinton?
Total Male Population of Chilcoot Vinton is 152.
What is the Total Female Population of Chilcoot Vinton?
Total Female Population of Chilcoot Vinton is 222.
What is the Ratio of Males per 100 Females in Chilcoot Vinton?
There are 68.47 Males per 100 Females in Chilcoot Vinton.
What is the Ratio of Females per 100 Males in Chilcoot Vinton?
There are 146.05 Females per 100 Males in Chilcoot Vinton.
What is the Median Population Age in Chilcoot Vinton?
Median Population Age in Chilcoot Vinton is 43.6 Years.
What is the Average Family Size in Chilcoot Vinton
Average Family Size in Chilcoot Vinton is 2.7 People.
What is the Average Household Size in Chilcoot Vinton
Average Household Size in Chilcoot Vinton is 2.5 People.
How Large is the Labor Force in Chilcoot Vinton?
There are 152 People in the Labor Forcein in Chilcoot Vinton.
What is the Percentage of People in the Labor Force in Chilcoot Vinton?
49.8% of People are in the Labor Force in Chilcoot Vinton.