Cities with the Highest Percentage of Population Employed in Food Preparation & Serving in Delaware
RELATED REPORTS & OPTIONS
Food Preparation & Serving
Delaware
Compare Cities
Map of Cities with the Highest Percentage of Population Employed in Food Preparation & Serving in Delaware
0.0%
25.0%
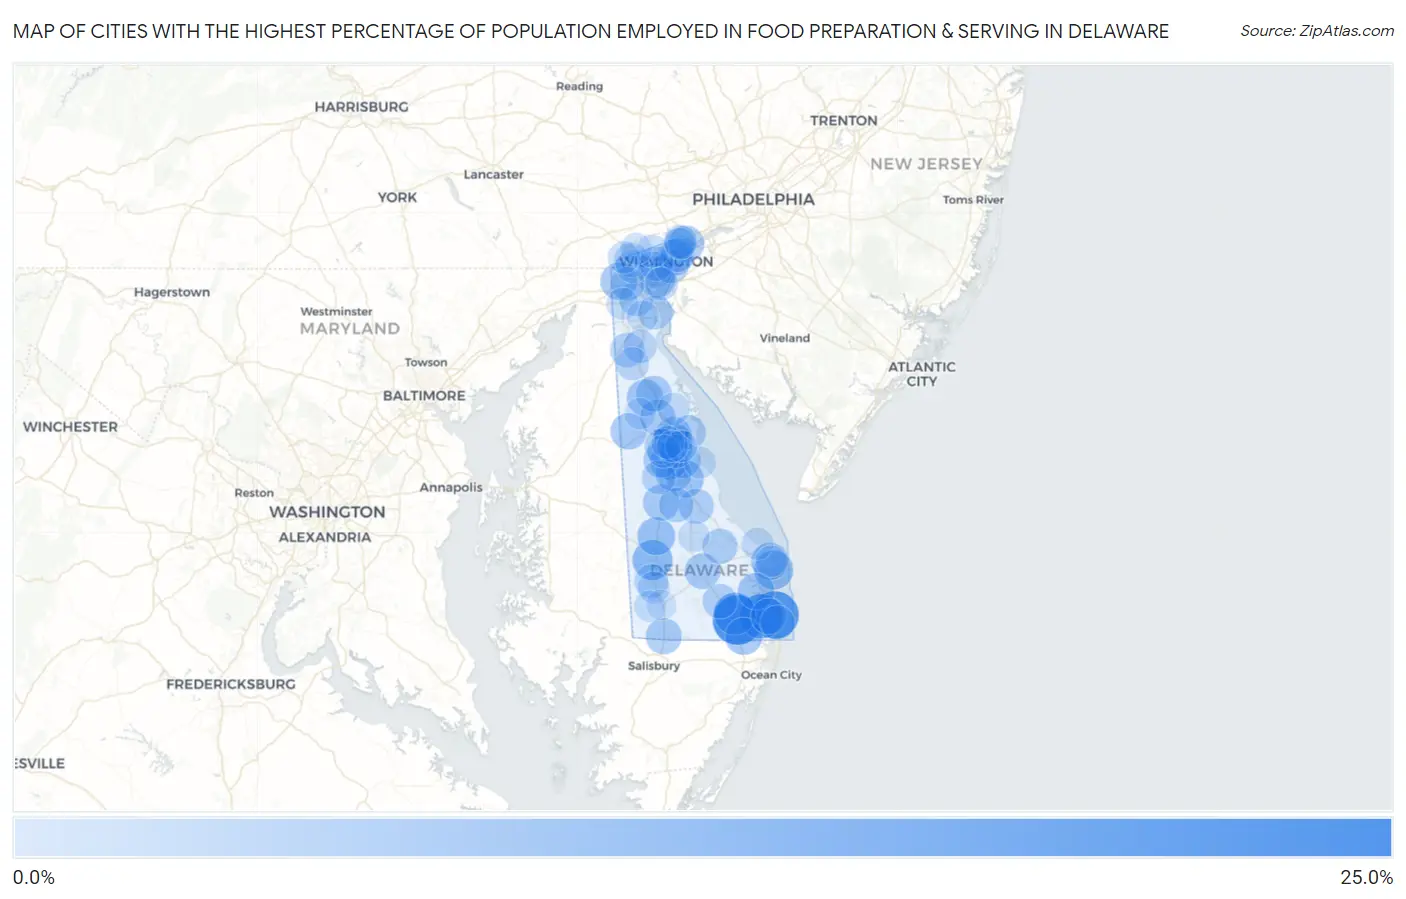
Cities with the Highest Percentage of Population Employed in Food Preparation & Serving in Delaware
| City | % Employed | vs State | vs National | |
| 1. | Frankford | 23.0% | 5.0%(+18.1)#1 | 5.3%(+17.8)#615 |
| 2. | Bethany Beach | 20.7% | 5.0%(+15.8)#2 | 5.3%(+15.4)#761 |
| 3. | Millville | 17.0% | 5.0%(+12.0)#3 | 5.3%(+11.7)#1,208 |
| 4. | Lincoln | 15.3% | 5.0%(+10.4)#4 | 5.3%(+10.0)#1,554 |
| 5. | Dagsboro | 14.0% | 5.0%(+9.00)#5 | 5.3%(+8.68)#1,927 |
| 6. | Bridgeville | 11.5% | 5.0%(+6.58)#6 | 5.3%(+6.25)#3,042 |
| 7. | Dewey Beach | 10.4% | 5.0%(+5.44)#7 | 5.3%(+5.12)#3,791 |
| 8. | Kent Acres | 9.6% | 5.0%(+4.63)#8 | 5.3%(+4.31)#4,449 |
| 9. | Greenwood | 9.0% | 5.0%(+4.04)#9 | 5.3%(+3.72)#5,049 |
| 10. | Frederica | 8.5% | 5.0%(+3.51)#10 | 5.3%(+3.19)#5,693 |
| 11. | Rehoboth Beach | 8.4% | 5.0%(+3.41)#11 | 5.3%(+3.09)#5,814 |
| 12. | Selbyville | 8.4% | 5.0%(+3.39)#12 | 5.3%(+3.06)#5,840 |
| 13. | Woodside East | 7.9% | 5.0%(+2.98)#13 | 5.3%(+2.66)#6,423 |
| 14. | Newark | 7.9% | 5.0%(+2.90)#14 | 5.3%(+2.58)#6,557 |
| 15. | Long Neck | 7.7% | 5.0%(+2.74)#15 | 5.3%(+2.42)#6,810 |
| 16. | Clayton | 7.4% | 5.0%(+2.47)#16 | 5.3%(+2.14)#7,234 |
| 17. | Harrington | 7.3% | 5.0%(+2.34)#17 | 5.3%(+2.02)#7,441 |
| 18. | Hartly | 7.2% | 5.0%(+2.28)#18 | 5.3%(+1.96)#7,530 |
| 19. | Magnolia | 6.9% | 5.0%(+1.93)#19 | 5.3%(+1.61)#8,199 |
| 20. | Dover | 6.9% | 5.0%(+1.90)#20 | 5.3%(+1.57)#8,266 |
| 21. | Claymont | 6.8% | 5.0%(+1.87)#21 | 5.3%(+1.54)#8,339 |
| 22. | Cheswold | 6.8% | 5.0%(+1.81)#22 | 5.3%(+1.49)#8,449 |
| 23. | Riverview | 6.7% | 5.0%(+1.74)#23 | 5.3%(+1.42)#8,594 |
| 24. | Delmar | 6.7% | 5.0%(+1.70)#24 | 5.3%(+1.38)#8,672 |
| 25. | Edgemoor | 6.6% | 5.0%(+1.64)#25 | 5.3%(+1.32)#8,851 |
| 26. | Smyrna | 6.5% | 5.0%(+1.53)#26 | 5.3%(+1.21)#9,100 |
| 27. | Ocean View | 6.5% | 5.0%(+1.53)#27 | 5.3%(+1.20)#9,116 |
| 28. | Newport | 6.5% | 5.0%(+1.51)#28 | 5.3%(+1.18)#9,166 |
| 29. | Georgetown | 6.3% | 5.0%(+1.38)#29 | 5.3%(+1.06)#9,450 |
| 30. | Woodside | 6.2% | 5.0%(+1.29)#30 | 5.3%(+0.964)#9,676 |
| 31. | Wyoming | 6.1% | 5.0%(+1.17)#31 | 5.3%(+0.848)#9,983 |
| 32. | Wilmington Manor | 6.0% | 5.0%(+1.05)#32 | 5.3%(+0.724)#10,311 |
| 33. | Milton | 5.8% | 5.0%(+0.876)#33 | 5.3%(+0.553)#10,713 |
| 34. | Milford | 5.8% | 5.0%(+0.828)#34 | 5.3%(+0.505)#10,839 |
| 35. | Millsboro | 5.2% | 5.0%(+0.286)#35 | 5.3%(-0.036)#12,309 |
| 36. | Houston | 5.2% | 5.0%(+0.195)#36 | 5.3%(-0.127)#12,552 |
| 37. | Little Creek | 5.1% | 5.0%(+0.184)#37 | 5.3%(-0.139)#12,585 |
| 38. | Middletown | 5.0% | 5.0%(+0.048)#38 | 5.3%(-0.275)#12,984 |
| 39. | Bear | 4.9% | 5.0%(-0.051)#39 | 5.3%(-0.373)#13,271 |
| 40. | Elsmere | 4.9% | 5.0%(-0.085)#40 | 5.3%(-0.408)#13,373 |
| 41. | South Bethany | 4.9% | 5.0%(-0.102)#41 | 5.3%(-0.425)#13,439 |
| 42. | Wilmington | 4.8% | 5.0%(-0.167)#42 | 5.3%(-0.489)#13,623 |
| 43. | Bellefonte | 4.7% | 5.0%(-0.236)#43 | 5.3%(-0.559)#13,819 |
| 44. | Delaware City | 4.7% | 5.0%(-0.292)#44 | 5.3%(-0.614)#13,987 |
| 45. | Seaford | 4.4% | 5.0%(-0.521)#45 | 5.3%(-0.844)#14,619 |
| 46. | Pike Creek | 4.4% | 5.0%(-0.529)#46 | 5.3%(-0.852)#14,645 |
| 47. | Brookside | 4.2% | 5.0%(-0.745)#47 | 5.3%(-1.07)#15,296 |
| 48. | Felton | 4.2% | 5.0%(-0.774)#48 | 5.3%(-1.10)#15,382 |
| 49. | Rising Sun Lebanon | 3.8% | 5.0%(-1.20)#49 | 5.3%(-1.52)#16,720 |
| 50. | Odessa | 3.6% | 5.0%(-1.35)#50 | 5.3%(-1.67)#17,172 |
| 51. | Pike Creek Valley | 3.6% | 5.0%(-1.38)#51 | 5.3%(-1.71)#17,280 |
| 52. | Camden | 3.4% | 5.0%(-1.56)#52 | 5.3%(-1.89)#17,840 |
| 53. | Townsend | 3.4% | 5.0%(-1.58)#53 | 5.3%(-1.90)#17,893 |
| 54. | New Castle | 3.3% | 5.0%(-1.67)#54 | 5.3%(-1.99)#18,159 |
| 55. | Arden | 3.0% | 5.0%(-1.95)#55 | 5.3%(-2.28)#18,967 |
| 56. | Ardentown | 3.0% | 5.0%(-1.96)#56 | 5.3%(-2.29)#18,998 |
| 57. | Rodney Village | 2.9% | 5.0%(-2.04)#57 | 5.3%(-2.36)#19,189 |
| 58. | Greenville | 2.5% | 5.0%(-2.48)#58 | 5.3%(-2.80)#20,380 |
| 59. | Lewes | 2.4% | 5.0%(-2.60)#59 | 5.3%(-2.93)#20,737 |
| 60. | Glasgow | 2.3% | 5.0%(-2.68)#60 | 5.3%(-3.00)#20,922 |
| 61. | North Star | 2.3% | 5.0%(-2.69)#61 | 5.3%(-3.01)#20,943 |
| 62. | Leipsic | 2.2% | 5.0%(-2.72)#62 | 5.3%(-3.04)#21,028 |
| 63. | Blades | 2.2% | 5.0%(-2.77)#63 | 5.3%(-3.09)#21,188 |
| 64. | Bowers | 2.0% | 5.0%(-3.00)#64 | 5.3%(-3.33)#21,752 |
| 65. | Dover Base Housing | 1.9% | 5.0%(-3.01)#65 | 5.3%(-3.34)#21,787 |
| 66. | Hockessin | 1.8% | 5.0%(-3.17)#66 | 5.3%(-3.49)#22,197 |
| 67. | Ardencroft | 1.8% | 5.0%(-3.21)#67 | 5.3%(-3.53)#22,288 |
| 68. | Bethel | 1.7% | 5.0%(-3.28)#68 | 5.3%(-3.61)#22,454 |
| 69. | Ellendale | 1.6% | 5.0%(-3.37)#69 | 5.3%(-3.69)#22,631 |
| 70. | Henlopen Acres | 1.6% | 5.0%(-3.40)#70 | 5.3%(-3.72)#22,706 |
| 71. | Highland Acres | 1.3% | 5.0%(-3.62)#71 | 5.3%(-3.94)#23,154 |
| 72. | St Georges | 1.3% | 5.0%(-3.64)#72 | 5.3%(-3.96)#23,179 |
| 73. | Kenton | 1.2% | 5.0%(-3.76)#73 | 5.3%(-4.08)#23,398 |
| 74. | Laurel | 0.40% | 5.0%(-4.57)#74 | 5.3%(-4.89)#24,431 |
1
Common Questions
What are the Top 10 Cities with the Highest Percentage of Population Employed in Food Preparation & Serving in Delaware?
Top 10 Cities with the Highest Percentage of Population Employed in Food Preparation & Serving in Delaware are:
#1
23.0%
#2
20.7%
#3
17.0%
#4
14.0%
#5
11.5%
#6
10.4%
#7
9.6%
#8
9.0%
#9
8.5%
#10
8.4%
What city has the Highest Percentage of Population Employed in Food Preparation & Serving in Delaware?
Frankford has the Highest Percentage of Population Employed in Food Preparation & Serving in Delaware with 23.0%.
What is the Percentage of Population Employed in Food Preparation & Serving in the State of Delaware?
Percentage of Population Employed in Food Preparation & Serving in Delaware is 5.0%.
What is the Percentage of Population Employed in Food Preparation & Serving in the United States?
Percentage of Population Employed in Food Preparation & Serving in the United States is 5.3%.