Indio Hills, CA Map & Demographics
Indio Hills Map
Indio Hills Overview
$22,788
PER CAPITA INCOME
$46,217
AVG FAMILY INCOME
$48,601
AVG HOUSEHOLD INCOME
0.33
INEQUALITY / GINI INDEX
605
TOTAL POPULATION
158
MALE POPULATION
447
FEMALE POPULATION
35.35
MALES / 100 FEMALES
282.91
FEMALES / 100 MALES
42.3
MEDIAN AGE
3.3
AVG FAMILY SIZE
3.2
AVG HOUSEHOLD SIZE
280
LABOR FORCE [ PEOPLE ]
67.8%
PERCENT IN LABOR FORCE
30.7%
UNEMPLOYMENT RATE
Income in Indio Hills
Income Overview in Indio Hills
Per Capita Income in Indio Hills is $22,788, while median incomes of families and households are $46,217 and $48,601 respectively.
| Characteristic | Number | Measure |
| Per Capita Income | 605 | $22,788 |
| Median Family Income | 163 | $46,217 |
| Mean Family Income | 163 | $44,977 |
| Median Household Income | 185 | $48,601 |
| Mean Household Income | 185 | $74,011 |
| Income Deficit | 163 | $0 |
| Wage / Income Gap (%) | 605 | 0.00% |
| Wage / Income Gap ($) | 605 | 100.00¢ per $1 |
| Gini / Inequality Index | 605 | 0.33 |
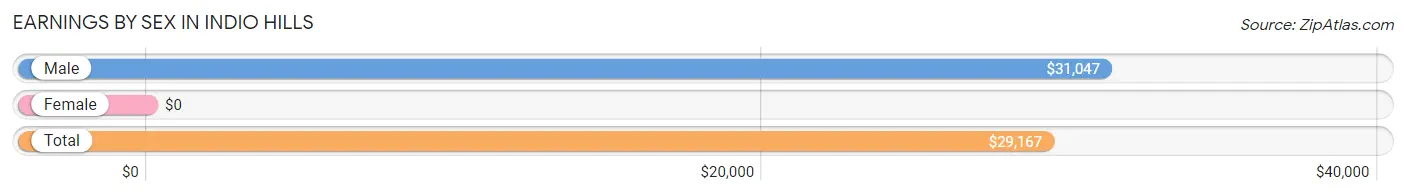
Earnings by Sex in Indio Hills
| Sex | Number | Average Earnings |
| Male | 122 (43.3%) | $31,047 |
| Female | 160 (56.7%) | $0 |
| Total | 282 (100.0%) | $29,167 |
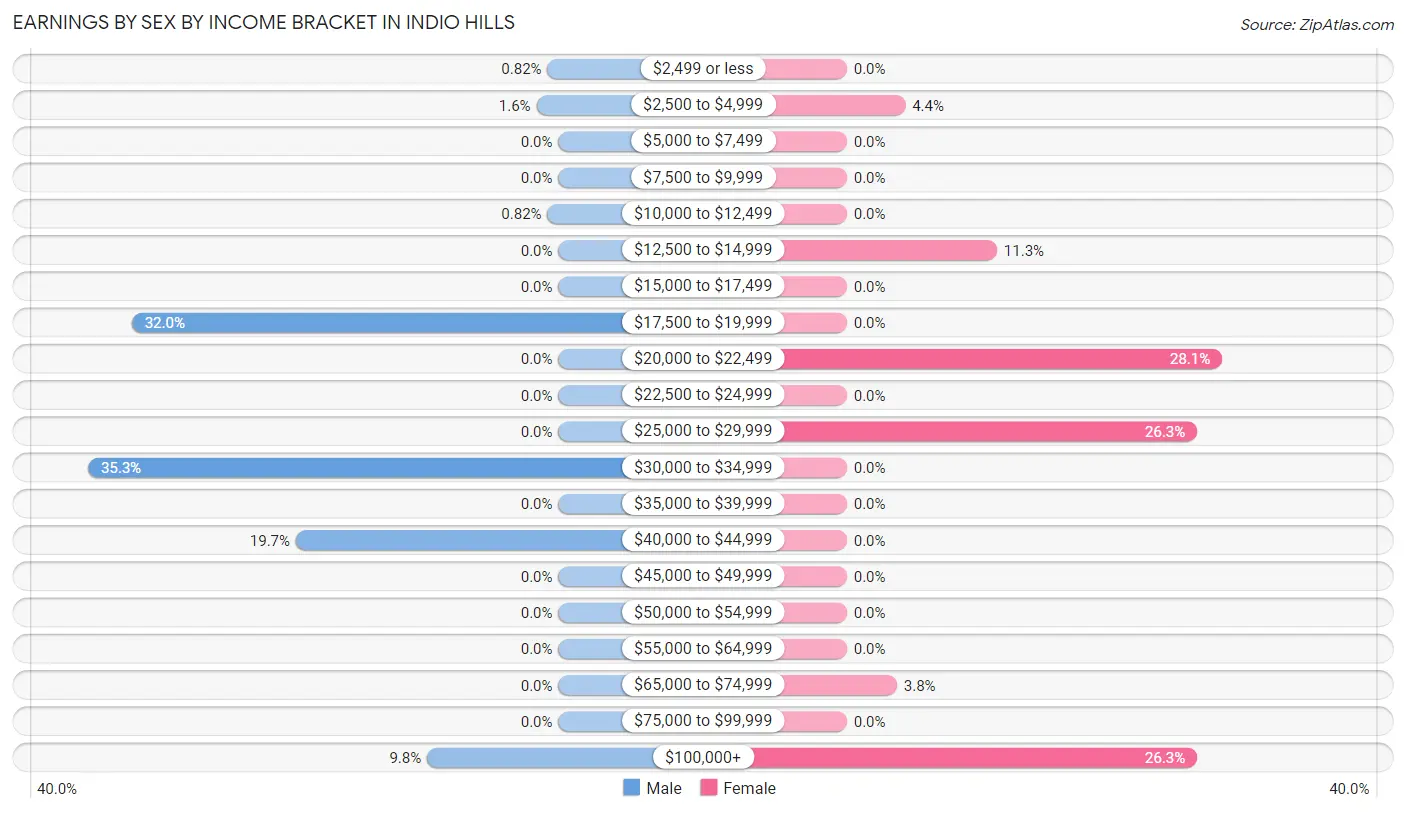
Earnings by Sex by Income Bracket in Indio Hills
The most common earnings brackets in Indio Hills are $30,000 to $34,999 for men (43 | 35.2%) and $20,000 to $22,499 for women (45 | 28.1%).
| Income | Male | Female |
| $2,499 or less | 1 (0.8%) | 0 (0.0%) |
| $2,500 to $4,999 | 2 (1.6%) | 7 (4.4%) |
| $5,000 to $7,499 | 0 (0.0%) | 0 (0.0%) |
| $7,500 to $9,999 | 0 (0.0%) | 0 (0.0%) |
| $10,000 to $12,499 | 1 (0.8%) | 0 (0.0%) |
| $12,500 to $14,999 | 0 (0.0%) | 18 (11.3%) |
| $15,000 to $17,499 | 0 (0.0%) | 0 (0.0%) |
| $17,500 to $19,999 | 39 (32.0%) | 0 (0.0%) |
| $20,000 to $22,499 | 0 (0.0%) | 45 (28.1%) |
| $22,500 to $24,999 | 0 (0.0%) | 0 (0.0%) |
| $25,000 to $29,999 | 0 (0.0%) | 42 (26.3%) |
| $30,000 to $34,999 | 43 (35.2%) | 0 (0.0%) |
| $35,000 to $39,999 | 0 (0.0%) | 0 (0.0%) |
| $40,000 to $44,999 | 24 (19.7%) | 0 (0.0%) |
| $45,000 to $49,999 | 0 (0.0%) | 0 (0.0%) |
| $50,000 to $54,999 | 0 (0.0%) | 0 (0.0%) |
| $55,000 to $64,999 | 0 (0.0%) | 0 (0.0%) |
| $65,000 to $74,999 | 0 (0.0%) | 6 (3.7%) |
| $75,000 to $99,999 | 0 (0.0%) | 0 (0.0%) |
| $100,000+ | 12 (9.8%) | 42 (26.3%) |
| Total | 122 (100.0%) | 160 (100.0%) |
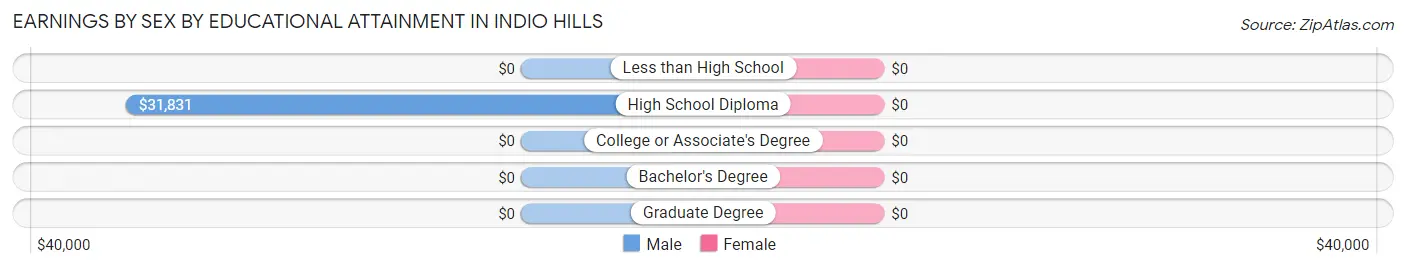
Earnings by Sex by Educational Attainment in Indio Hills
| Educational Attainment | Male Income | Female Income |
| Less than High School | - | - |
| High School Diploma | $31,831 | $0 |
| College or Associate's Degree | - | - |
| Bachelor's Degree | - | - |
| Graduate Degree | - | - |
| Total | $31,134 | $0 |
Family Income in Indio Hills
Family Income Brackets in Indio Hills
According to the Indio Hills family income data, there are 83 families falling into the $35,000 to $49,999 income range, which is the most common income bracket and makes up 50.9% of all families.
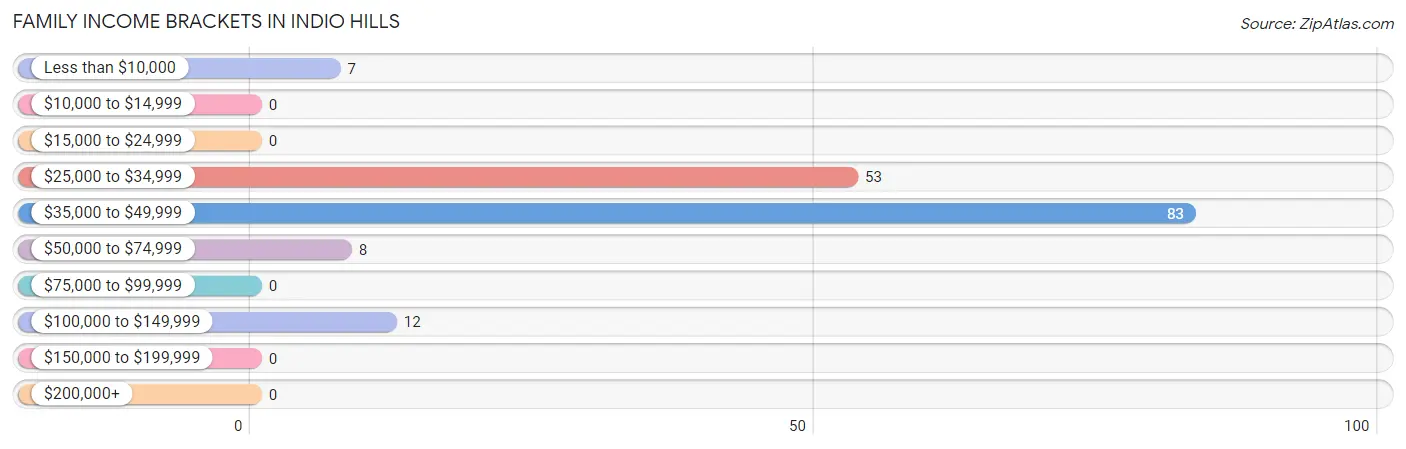
| Income Bracket | # Families | % Families |
| Less than $10,000 | 7 | 4.3% |
| $10,000 to $14,999 | 0 | 0.0% |
| $15,000 to $24,999 | 0 | 0.0% |
| $25,000 to $34,999 | 53 | 32.5% |
| $35,000 to $49,999 | 83 | 50.9% |
| $50,000 to $74,999 | 8 | 4.9% |
| $75,000 to $99,999 | 0 | 0.0% |
| $100,000 to $149,999 | 12 | 7.4% |
| $150,000 to $199,999 | 0 | 0.0% |
| $200,000+ | 0 | 0.0% |
Family Income by Famaliy Size in Indio Hills
3-person families (58 | 35.6%) account for the highest median family income in Indio Hills with $46,908 per family, while 3-person families (58 | 35.6%) have the highest median income of $15,636 per family member.
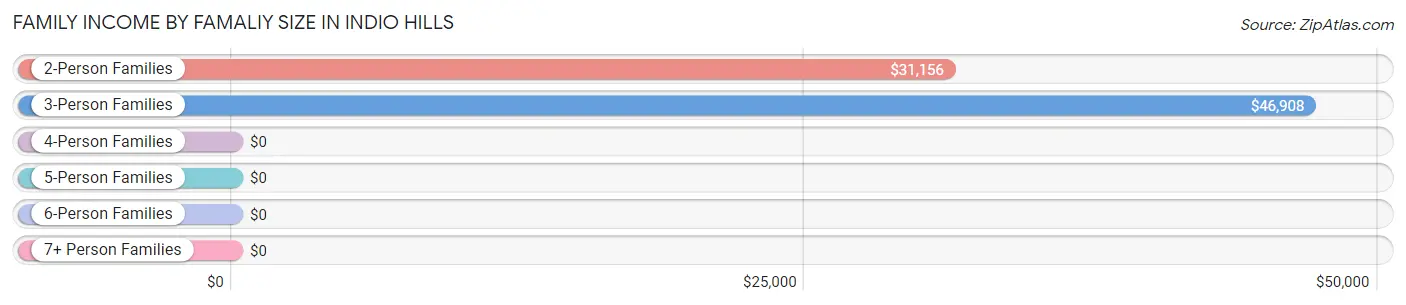
| Income Bracket | # Families | Median Income |
| 2-Person Families | 63 (38.7%) | $31,156 |
| 3-Person Families | 58 (35.6%) | $46,908 |
| 4-Person Families | 0 (0.0%) | $0 |
| 5-Person Families | 42 (25.8%) | $0 |
| 6-Person Families | 0 (0.0%) | $0 |
| 7+ Person Families | 0 (0.0%) | $0 |
| Total | 163 (100.0%) | $46,217 |
Family Income by Number of Earners in Indio Hills
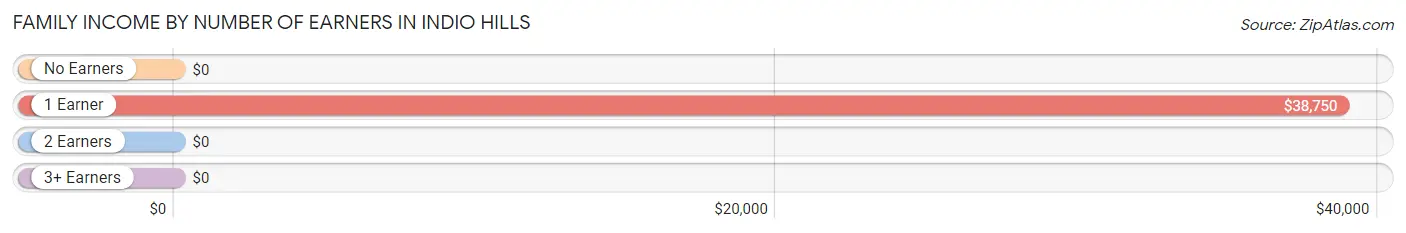
| Number of Earners | # Families | Median Income |
| No Earners | 13 (8.0%) | $0 |
| 1 Earner | 100 (61.4%) | $38,750 |
| 2 Earners | 42 (25.8%) | $0 |
| 3+ Earners | 8 (4.9%) | $0 |
| Total | 163 (100.0%) | $46,217 |
Household Income in Indio Hills
Household Income Brackets in Indio Hills
With 99 households falling in the category, the $35,000 to $49,999 income range is the most frequent in Indio Hills, accounting for 53.5% of all households.
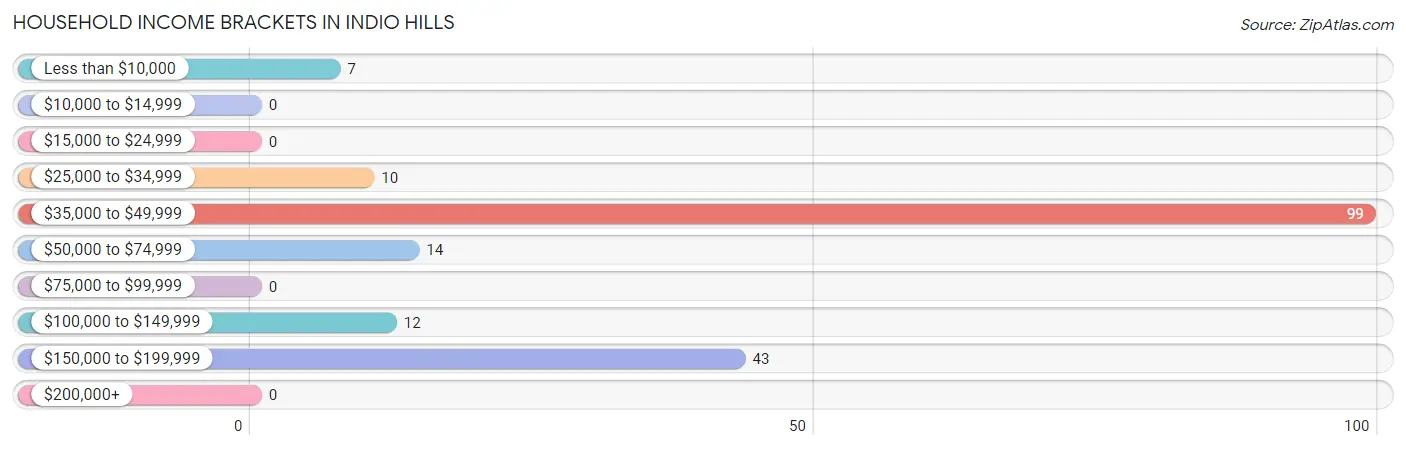
| Income Bracket | # Households | % Households |
| Less than $10,000 | 7 | 3.8% |
| $10,000 to $14,999 | 0 | 0.0% |
| $15,000 to $24,999 | 0 | 0.0% |
| $25,000 to $34,999 | 10 | 5.4% |
| $35,000 to $49,999 | 99 | 53.5% |
| $50,000 to $74,999 | 14 | 7.6% |
| $75,000 to $99,999 | 0 | 0.0% |
| $100,000 to $149,999 | 12 | 6.5% |
| $150,000 to $199,999 | 43 | 23.2% |
| $200,000+ | 0 | 0.0% |
Household Income by Householder Age in Indio Hills
The median household income in Indio Hills is $48,601, with the highest median household income of $46,020 found in the 65+ years age bracket for the primary householder. A total of 57 households (30.8%) fall into this category.
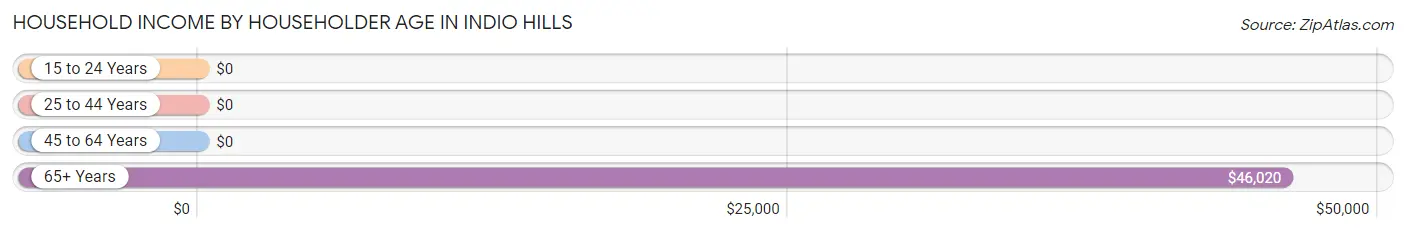
| Income Bracket | # Households | Median Income |
| 15 to 24 Years | 0 (0.0%) | $0 |
| 25 to 44 Years | 105 (56.8%) | $0 |
| 45 to 64 Years | 23 (12.4%) | $0 |
| 65+ Years | 57 (30.8%) | $46,020 |
| Total | 185 (100.0%) | $48,601 |
Poverty in Indio Hills
Income Below Poverty by Sex and Age in Indio Hills
With 7.1% poverty level for males and 1.8% for females among the residents of Indio Hills, 25 to 34 year old males and 55 to 64 year old females are the most vulnerable to poverty, with 11 males (47.8%) and 7 females (100.0%) in their respective age groups living below the poverty level.
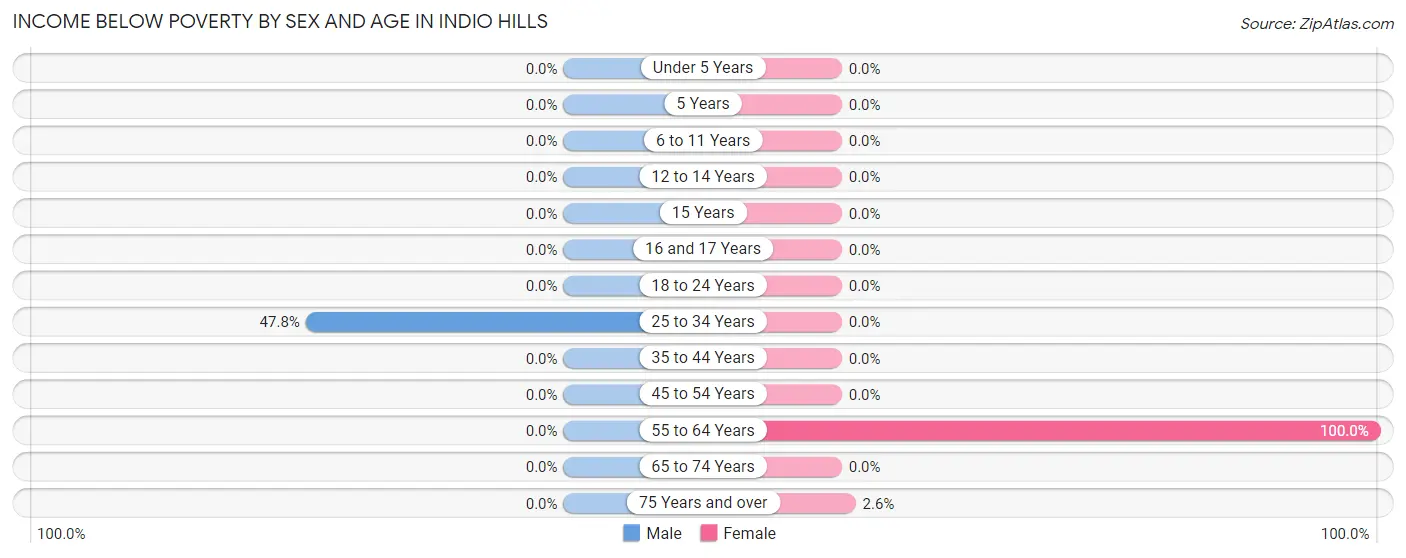
| Age Bracket | Male | Female |
| Under 5 Years | 0 (0.0%) | 0 (0.0%) |
| 5 Years | 0 (0.0%) | 0 (0.0%) |
| 6 to 11 Years | 0 (0.0%) | 0 (0.0%) |
| 12 to 14 Years | 0 (0.0%) | 0 (0.0%) |
| 15 Years | 0 (0.0%) | 0 (0.0%) |
| 16 and 17 Years | 0 (0.0%) | 0 (0.0%) |
| 18 to 24 Years | 0 (0.0%) | 0 (0.0%) |
| 25 to 34 Years | 11 (47.8%) | 0 (0.0%) |
| 35 to 44 Years | 0 (0.0%) | 0 (0.0%) |
| 45 to 54 Years | 0 (0.0%) | 0 (0.0%) |
| 55 to 64 Years | 0 (0.0%) | 7 (100.0%) |
| 65 to 74 Years | 0 (0.0%) | 0 (0.0%) |
| 75 Years and over | 0 (0.0%) | 1 (2.6%) |
| Total | 11 (7.1%) | 8 (1.8%) |
Income Above Poverty by Sex and Age in Indio Hills
According to the poverty statistics in Indio Hills, males aged under 5 years and females aged under 5 years are the age groups that are most secure financially, with 100.0% of males and 100.0% of females in these age groups living above the poverty line.
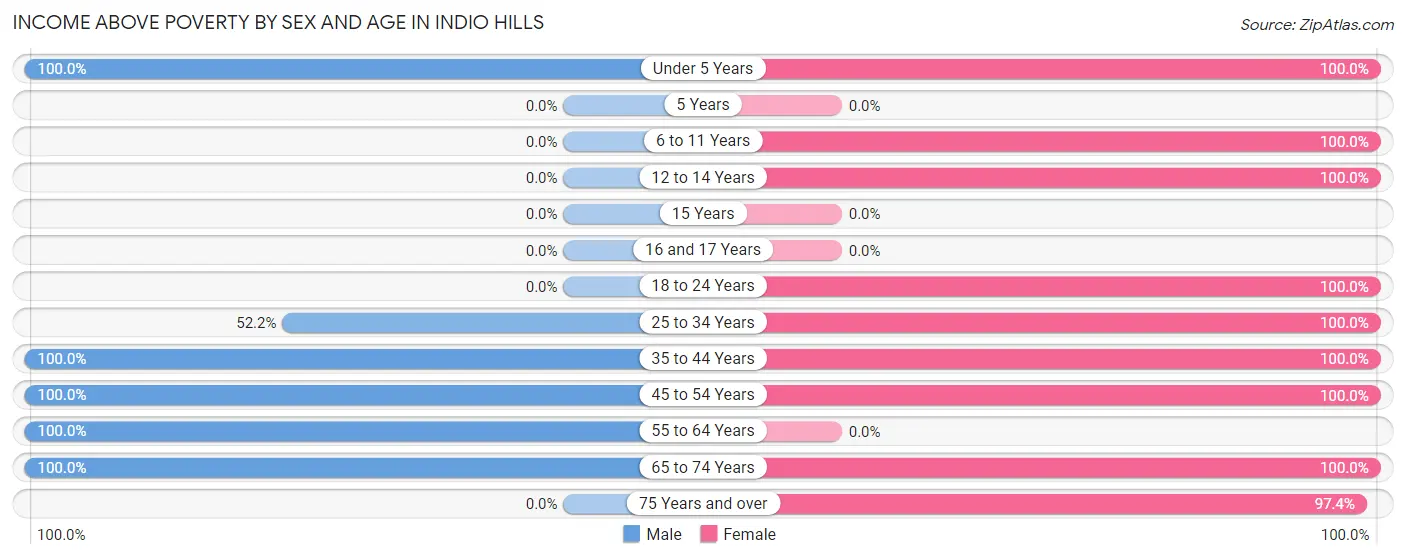
| Age Bracket | Male | Female |
| Under 5 Years | 11 (100.0%) | 86 (100.0%) |
| 5 Years | 0 (0.0%) | 0 (0.0%) |
| 6 to 11 Years | 0 (0.0%) | 45 (100.0%) |
| 12 to 14 Years | 0 (0.0%) | 50 (100.0%) |
| 15 Years | 0 (0.0%) | 0 (0.0%) |
| 16 and 17 Years | 0 (0.0%) | 0 (0.0%) |
| 18 to 24 Years | 0 (0.0%) | 9 (100.0%) |
| 25 to 34 Years | 12 (52.2%) | 12 (100.0%) |
| 35 to 44 Years | 51 (100.0%) | 51 (100.0%) |
| 45 to 54 Years | 16 (100.0%) | 87 (100.0%) |
| 55 to 64 Years | 40 (100.0%) | 0 (0.0%) |
| 65 to 74 Years | 13 (100.0%) | 61 (100.0%) |
| 75 Years and over | 0 (0.0%) | 38 (97.4%) |
| Total | 143 (92.9%) | 439 (98.2%) |
Income Below Poverty Among Married-Couple Families in Indio Hills
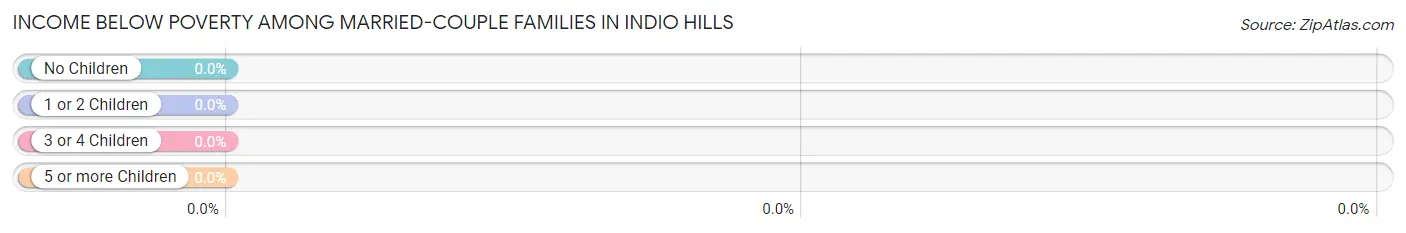
| Children | Above Poverty | Below Poverty |
| No Children | 21 (100.0%) | 0 (0.0%) |
| 1 or 2 Children | 12 (100.0%) | 0 (0.0%) |
| 3 or 4 Children | 42 (100.0%) | 0 (0.0%) |
| 5 or more Children | 0 (0.0%) | 0 (0.0%) |
| Total | 75 (100.0%) | 0 (0.0%) |
Income Below Poverty Among Single-Parent Households in Indio Hills
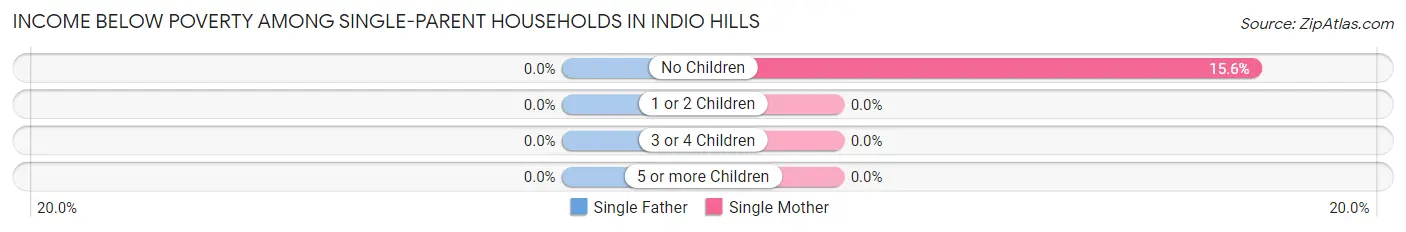
| Children | Single Father | Single Mother |
| No Children | 0 (0.0%) | 7 (15.6%) |
| 1 or 2 Children | 0 (0.0%) | 0 (0.0%) |
| 3 or 4 Children | 0 (0.0%) | 0 (0.0%) |
| 5 or more Children | 0 (0.0%) | 0 (0.0%) |
| Total | 0 (0.0%) | 7 (15.6%) |
Income Below Poverty Among Married-Couple vs Single-Parent Households in Indio Hills
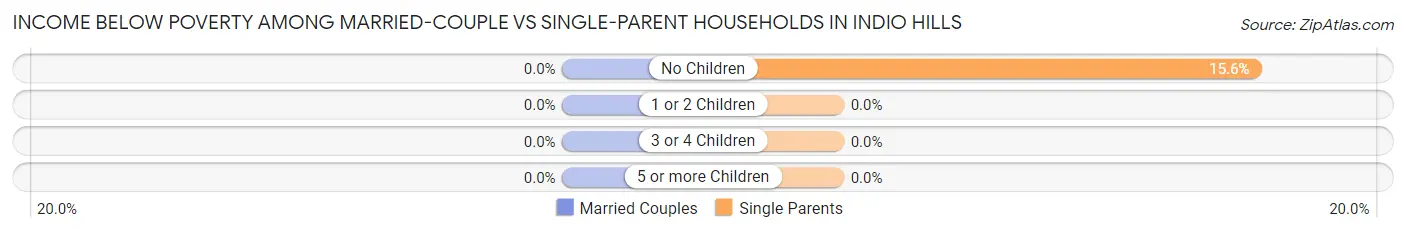
| Children | Married-Couple Families | Single-Parent Households |
| No Children | 0 (0.0%) | 7 (15.6%) |
| 1 or 2 Children | 0 (0.0%) | 0 (0.0%) |
| 3 or 4 Children | 0 (0.0%) | 0 (0.0%) |
| 5 or more Children | 0 (0.0%) | 0 (0.0%) |
| Total | 0 (0.0%) | 7 (8.0%) |
Race in Indio Hills
The most populous races in Indio Hills are Hispanic or Latino (440 | 72.7%), White / Caucasian (330 | 54.5%), and Some other Race (237 | 39.2%).
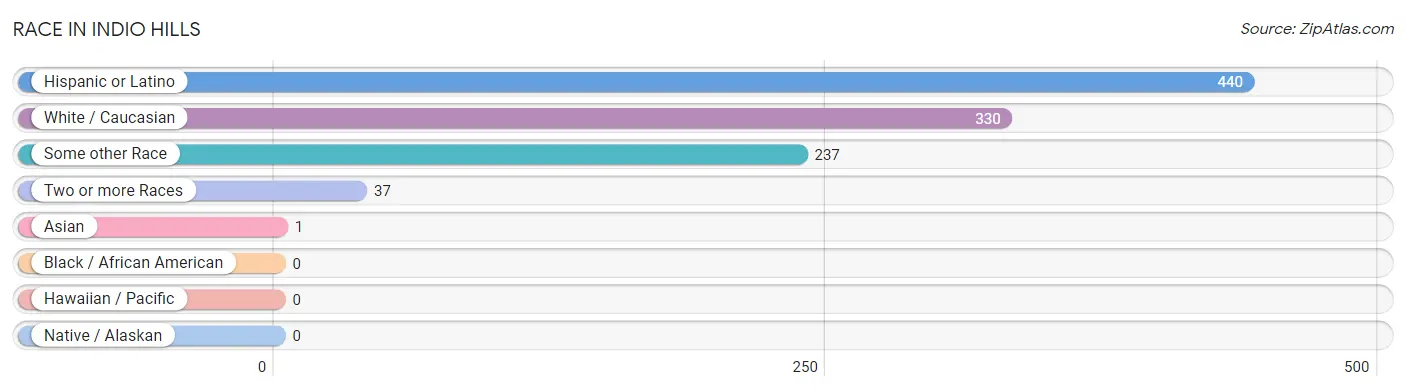
| Race | # Population | % Population |
| Asian | 1 | 0.2% |
| Black / African American | 0 | 0.0% |
| Hawaiian / Pacific | 0 | 0.0% |
| Hispanic or Latino | 440 | 72.7% |
| Native / Alaskan | 0 | 0.0% |
| White / Caucasian | 330 | 54.5% |
| Two or more Races | 37 | 6.1% |
| Some other Race | 237 | 39.2% |
| Total | 605 | 100.0% |
Ancestry in Indio Hills
The most populous ancestries reported in Indio Hills are Mexican (390 | 64.5%), Central American (50 | 8.3%), Costa Rican (50 | 8.3%), English (33 | 5.4%), and German (19 | 3.1%), together accounting for 89.6% of all Indio Hills residents.
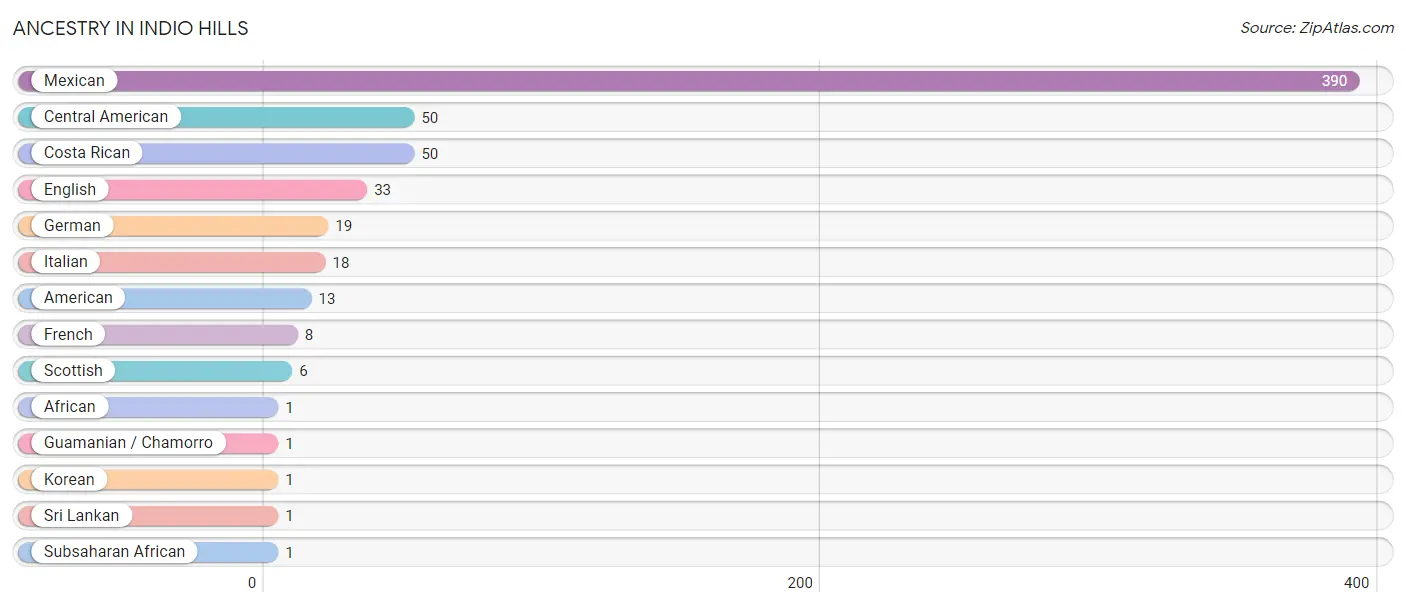
| Ancestry | # Population | % Population |
| African | 1 | 0.2% |
| American | 13 | 2.1% |
| Central American | 50 | 8.3% |
| Costa Rican | 50 | 8.3% |
| English | 33 | 5.4% |
| French | 8 | 1.3% |
| German | 19 | 3.1% |
| Guamanian / Chamorro | 1 | 0.2% |
| Italian | 18 | 3.0% |
| Korean | 1 | 0.2% |
| Mexican | 390 | 64.5% |
| Scottish | 6 | 1.0% |
| Sri Lankan | 1 | 0.2% |
| Subsaharan African | 1 | 0.2% | View All 14 Rows |
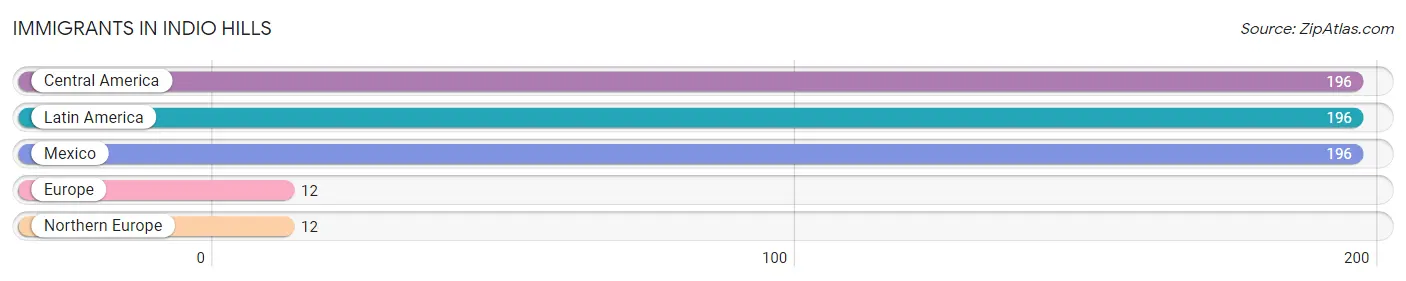
Immigrants in Indio Hills
The most numerous immigrant groups reported in Indio Hills came from Central America (196 | 32.4%), Latin America (196 | 32.4%), Mexico (196 | 32.4%), Europe (12 | 2.0%), and Northern Europe (12 | 2.0%), together accounting for 101.2% of all Indio Hills residents.
| Immigration Origin | # Population | % Population |
| Central America | 196 | 32.4% |
| Europe | 12 | 2.0% |
| Latin America | 196 | 32.4% |
| Mexico | 196 | 32.4% |
| Northern Europe | 12 | 2.0% | View All 5 Rows |
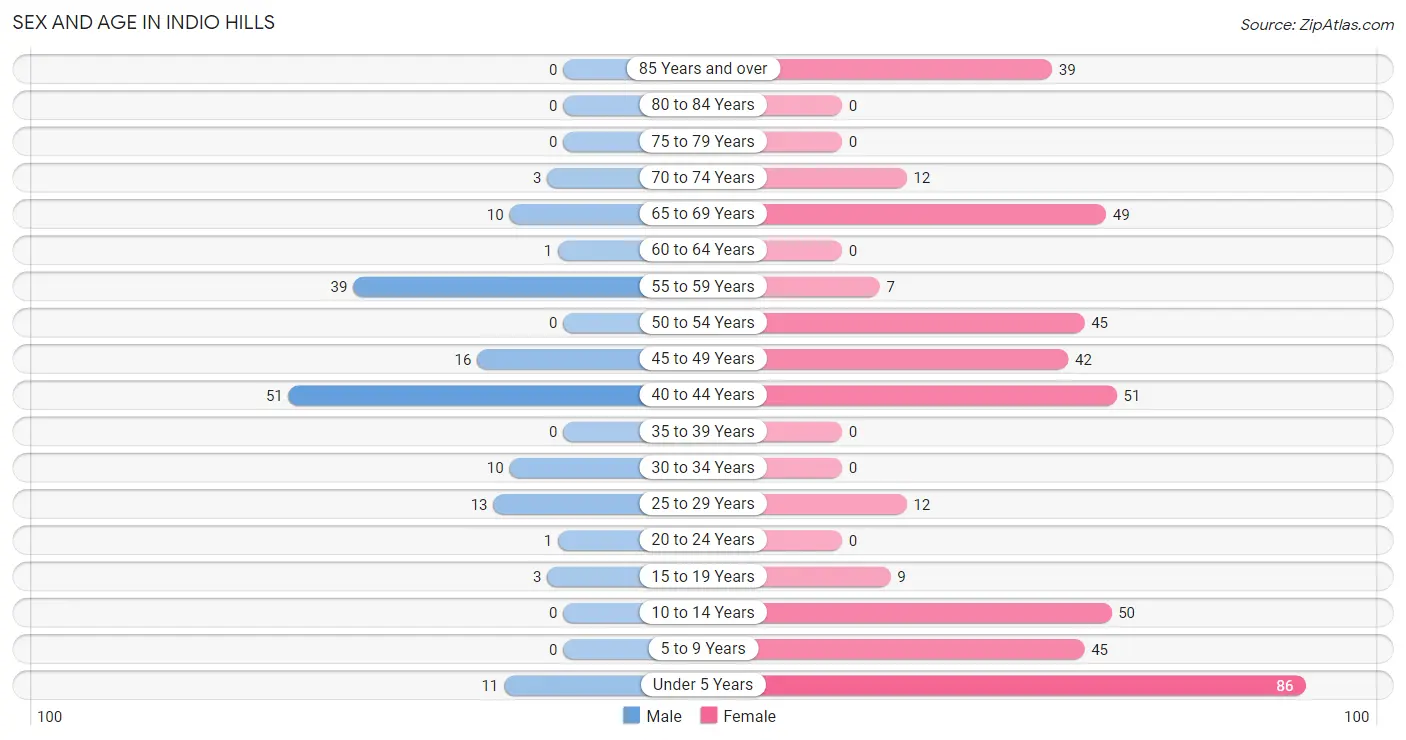
Sex and Age in Indio Hills
Sex and Age in Indio Hills
The most populous age groups in Indio Hills are 40 to 44 Years (51 | 32.3%) for men and Under 5 Years (86 | 19.2%) for women.
| Age Bracket | Male | Female |
| Under 5 Years | 11 (7.0%) | 86 (19.2%) |
| 5 to 9 Years | 0 (0.0%) | 45 (10.1%) |
| 10 to 14 Years | 0 (0.0%) | 50 (11.2%) |
| 15 to 19 Years | 3 (1.9%) | 9 (2.0%) |
| 20 to 24 Years | 1 (0.6%) | 0 (0.0%) |
| 25 to 29 Years | 13 (8.2%) | 12 (2.7%) |
| 30 to 34 Years | 10 (6.3%) | 0 (0.0%) |
| 35 to 39 Years | 0 (0.0%) | 0 (0.0%) |
| 40 to 44 Years | 51 (32.3%) | 51 (11.4%) |
| 45 to 49 Years | 16 (10.1%) | 42 (9.4%) |
| 50 to 54 Years | 0 (0.0%) | 45 (10.1%) |
| 55 to 59 Years | 39 (24.7%) | 7 (1.6%) |
| 60 to 64 Years | 1 (0.6%) | 0 (0.0%) |
| 65 to 69 Years | 10 (6.3%) | 49 (11.0%) |
| 70 to 74 Years | 3 (1.9%) | 12 (2.7%) |
| 75 to 79 Years | 0 (0.0%) | 0 (0.0%) |
| 80 to 84 Years | 0 (0.0%) | 0 (0.0%) |
| 85 Years and over | 0 (0.0%) | 39 (8.7%) |
| Total | 158 (100.0%) | 447 (100.0%) |
Families and Households in Indio Hills
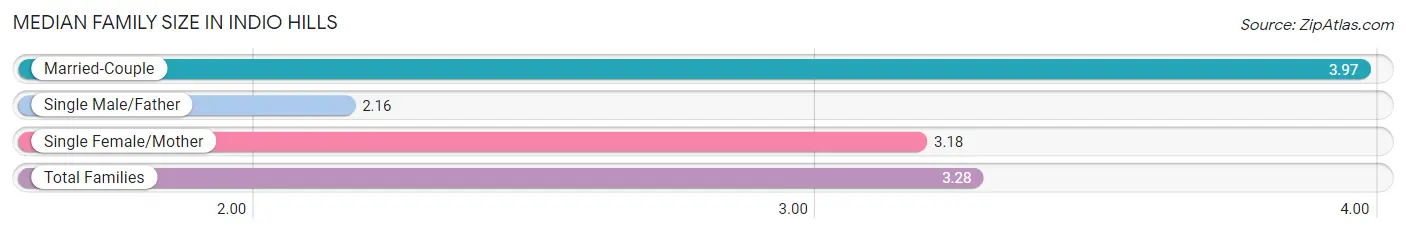
Median Family Size in Indio Hills
The median family size in Indio Hills is 3.28 persons per family, with married-couple families (75 | 46.0%) accounting for the largest median family size of 3.97 persons per family. On the other hand, single male/father families (43 | 26.4%) represent the smallest median family size with 2.16 persons per family.
| Family Type | # Families | Family Size |
| Married-Couple | 75 (46.0%) | 3.97 |
| Single Male/Father | 43 (26.4%) | 2.16 |
| Single Female/Mother | 45 (27.6%) | 3.18 |
| Total Families | 163 (100.0%) | 3.28 |
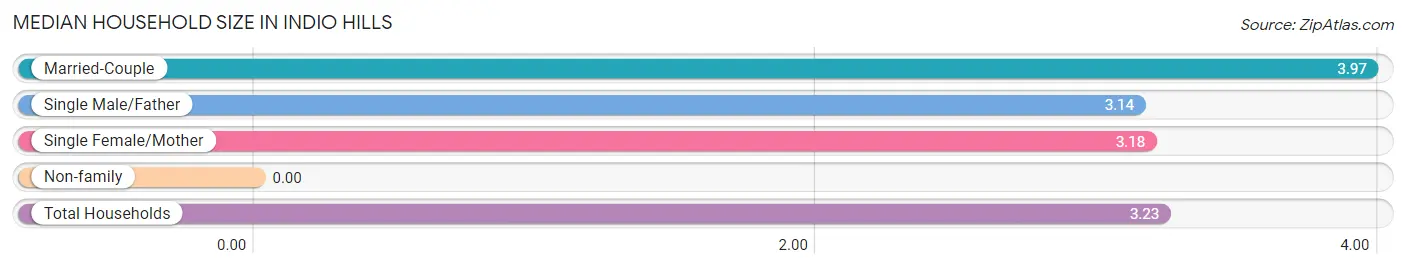
Median Household Size in Indio Hills
| Household Type | # Households | Household Size |
| Married-Couple | 75 (40.5%) | 3.97 |
| Single Male/Father | 43 (23.2%) | 3.14 |
| Single Female/Mother | 45 (24.3%) | 3.18 |
| Non-family | 22 (11.9%) | - |
| Total Households | 185 (100.0%) | 3.23 |
Household Size by Marriage Status in Indio Hills
Out of a total of 185 households in Indio Hills, 163 (88.1%) are family households, while 22 (11.9%) are nonfamily households. The most numerous type of family households are 3-person households, comprising 101, and the most common type of nonfamily households are 1-person households, comprising 22.
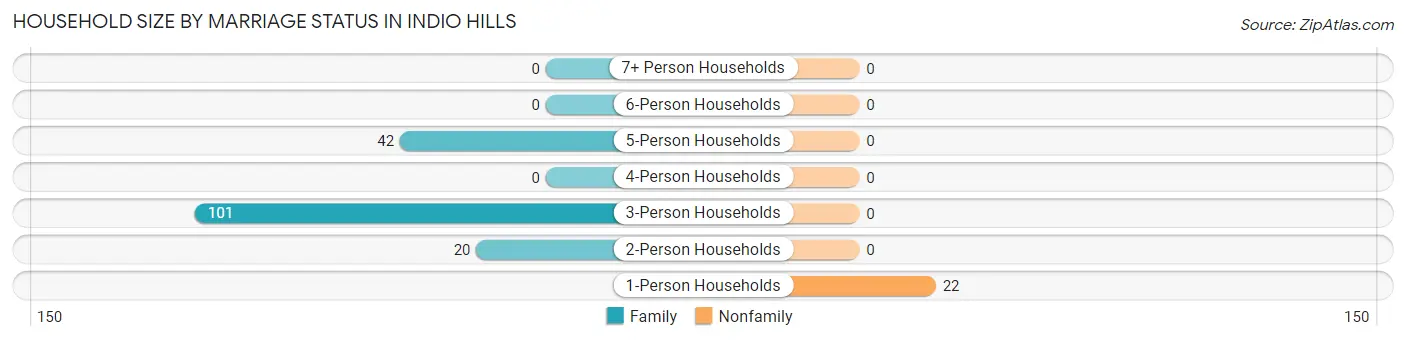
| Household Size | Family Households | Nonfamily Households |
| 1-Person Households | - | 22 (11.9%) |
| 2-Person Households | 20 (10.8%) | 0 (0.0%) |
| 3-Person Households | 101 (54.6%) | 0 (0.0%) |
| 4-Person Households | 0 (0.0%) | 0 (0.0%) |
| 5-Person Households | 42 (22.7%) | 0 (0.0%) |
| 6-Person Households | 0 (0.0%) | 0 (0.0%) |
| 7+ Person Households | 0 (0.0%) | 0 (0.0%) |
| Total | 163 (88.1%) | 22 (11.9%) |
Female Fertility in Indio Hills
Fertility by Age in Indio Hills
Average fertility rate in Indio Hills is 75.0 births per 1,000 women. Women in the age bracket of 20 to 34 years have the highest fertility rate with 1,000.0 births per 1,000 women. Women in the age bracket of 20 to 34 years acount for 100.0% of all women with births.
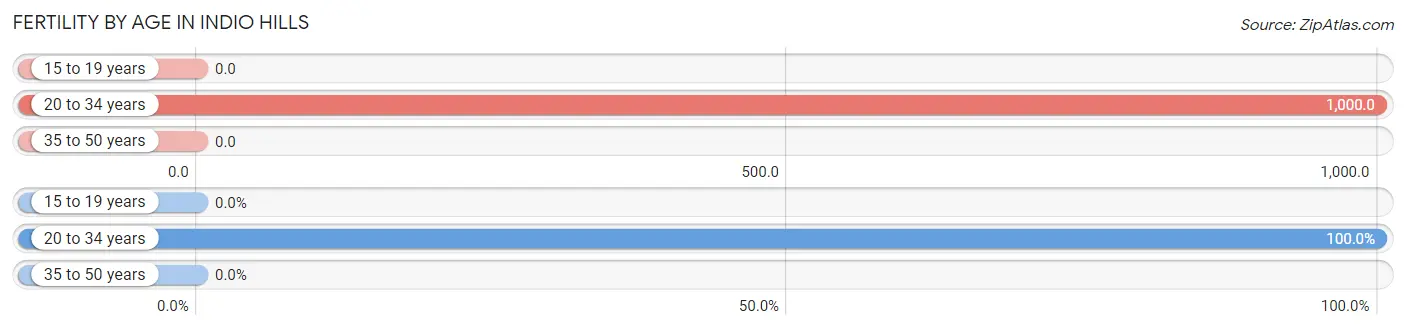
| Age Bracket | Women with Births | Births / 1,000 Women |
| 15 to 19 years | 0 (0.0%) | 0.0 |
| 20 to 34 years | 12 (100.0%) | 1,000.0 |
| 35 to 50 years | 0 (0.0%) | 0.0 |
| Total | 12 (100.0%) | 75.0 |
Fertility by Age by Marriage Status in Indio Hills
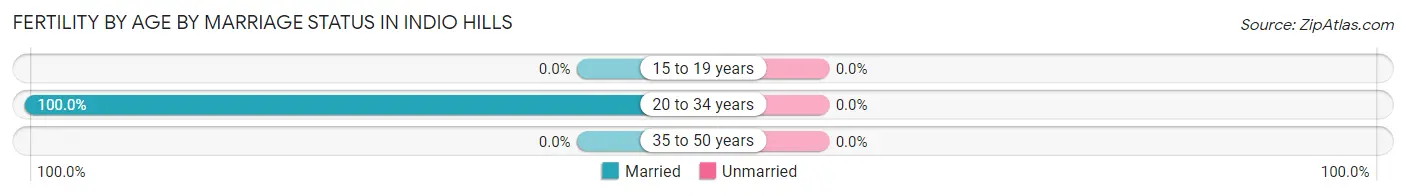
| Age Bracket | Married | Unmarried |
| 15 to 19 years | 0 (0.0%) | 0 (0.0%) |
| 20 to 34 years | 12 (100.0%) | 0 (0.0%) |
| 35 to 50 years | 0 (0.0%) | 0 (0.0%) |
| Total | 12 (100.0%) | 0 (0.0%) |
Fertility by Education in Indio Hills
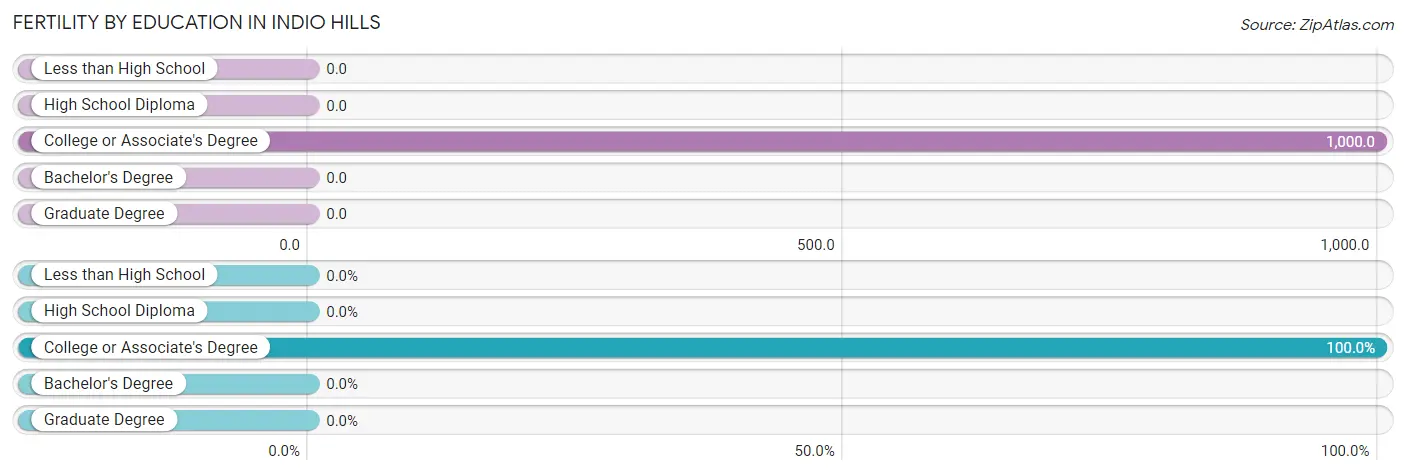
| Educational Attainment | Women with Births | Births / 1,000 Women |
| Less than High School | 0 (0.0%) | 0.0 |
| High School Diploma | 0 (0.0%) | 0.0 |
| College or Associate's Degree | 12 (100.0%) | 1,000.0 |
| Bachelor's Degree | 0 (0.0%) | 0.0 |
| Graduate Degree | 0 (0.0%) | 0.0 |
| Total | 12 (100.0%) | 75.0 |
Fertility by Education by Marriage Status in Indio Hills
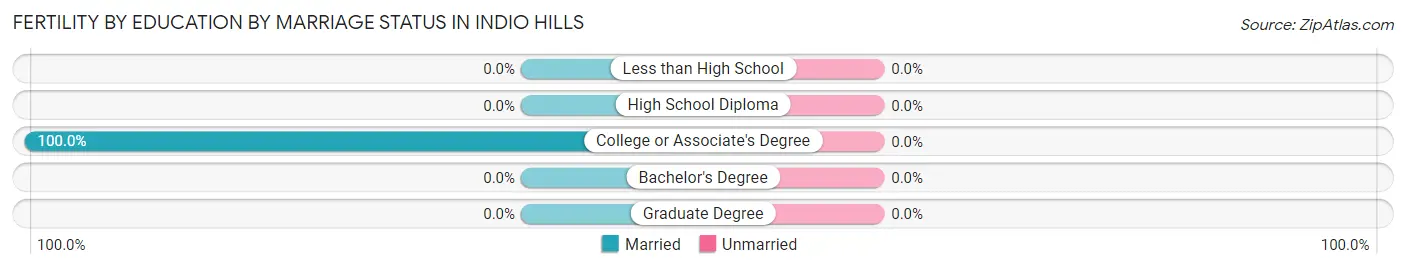
| Educational Attainment | Married | Unmarried |
| Less than High School | 0 (0.0%) | 0 (0.0%) |
| High School Diploma | 0 (0.0%) | 0 (0.0%) |
| College or Associate's Degree | 12 (100.0%) | 0 (0.0%) |
| Bachelor's Degree | 0 (0.0%) | 0 (0.0%) |
| Graduate Degree | 0 (0.0%) | 0 (0.0%) |
| Total | 12 (100.0%) | 0 (0.0%) |
Employment Characteristics in Indio Hills
Employment by Class of Employer in Indio Hills
Among the 194 employed individuals in Indio Hills, private company employees (78 | 40.2%), local government employees (51 | 26.3%), and self-employed (not incorporated) (49 | 25.3%) make up the most common classes of employment.
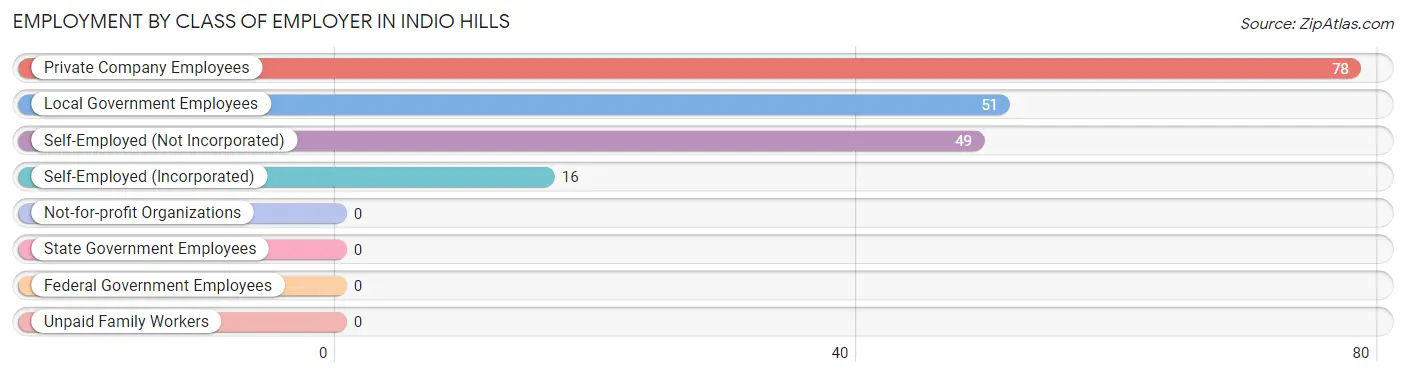
| Employer Class | # Employees | % Employees |
| Private Company Employees | 78 | 40.2% |
| Self-Employed (Incorporated) | 16 | 8.3% |
| Self-Employed (Not Incorporated) | 49 | 25.3% |
| Not-for-profit Organizations | 0 | 0.0% |
| Local Government Employees | 51 | 26.3% |
| State Government Employees | 0 | 0.0% |
| Federal Government Employees | 0 | 0.0% |
| Unpaid Family Workers | 0 | 0.0% |
| Total | 194 | 100.0% |
Employment Status by Age in Indio Hills
According to the labor force statistics for Indio Hills, out of the total population over 16 years of age (413), 67.8% or 280 individuals are in the labor force, with 30.7% or 86 of them unemployed. The age group with the highest labor force participation rate is 35 to 44 years, with 100.0% or 102 individuals in the labor force. Within the labor force, the 35 to 44 years age range has the highest percentage of unemployed individuals, with 42.2% or 43 of them being unemployed.
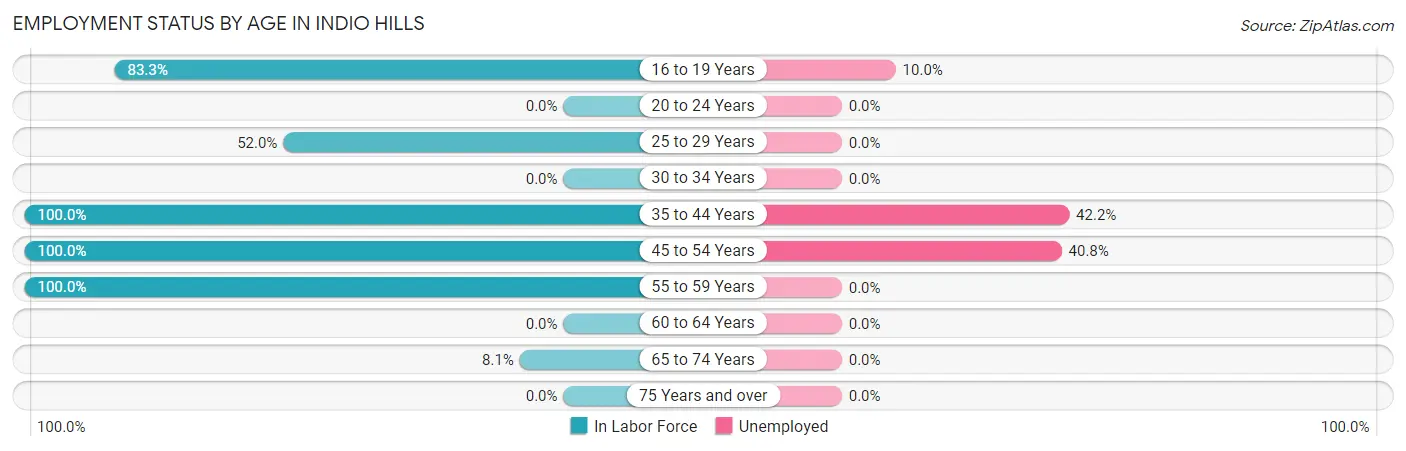
| Age Bracket | In Labor Force | Unemployed |
| 16 to 19 Years | 10 (83.3%) | 1 (10.0%) |
| 20 to 24 Years | 0 (0.0%) | 0 (0.0%) |
| 25 to 29 Years | 13 (52.0%) | 0 (0.0%) |
| 30 to 34 Years | 0 (0.0%) | 0 (0.0%) |
| 35 to 44 Years | 102 (100.0%) | 43 (42.2%) |
| 45 to 54 Years | 103 (100.0%) | 42 (40.8%) |
| 55 to 59 Years | 46 (100.0%) | 0 (0.0%) |
| 60 to 64 Years | 0 (0.0%) | 0 (0.0%) |
| 65 to 74 Years | 6 (8.1%) | 0 (0.0%) |
| 75 Years and over | 0 (0.0%) | 0 (0.0%) |
| Total | 280 (67.8%) | 86 (30.7%) |
Employment Status by Educational Attainment in Indio Hills
According to labor force statistics for Indio Hills, 92.0% of individuals (264) out of the total population between 25 and 64 years of age (287) are in the labor force, with 32.2% or 85 of them being unemployed. The group with the highest labor force participation rate are those with the educational attainment of high school diploma, with 99.4% or 166 individuals in the labor force. Within the labor force, individuals with high school diploma education have the highest percentage of unemployment, with 51.2% or 85 of them being unemployed.
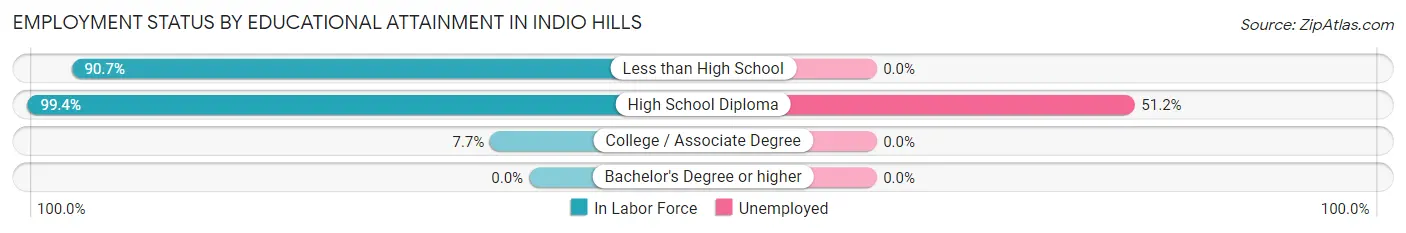
| Educational Attainment | In Labor Force | Unemployed |
| Less than High School | 97 (90.7%) | 0 (0.0%) |
| High School Diploma | 166 (99.4%) | 86 (51.2%) |
| College / Associate Degree | 1 (7.7%) | 0 (0.0%) |
| Bachelor's Degree or higher | 0 (0.0%) | 0 (0.0%) |
| Total | 264 (92.0%) | 92 (32.2%) |
Employment Occupations by Sex in Indio Hills
Management, Business, Science and Arts Occupations
The most common Management, Business, Science and Arts occupations in Indio Hills are , and Management (8 | 4.1%).
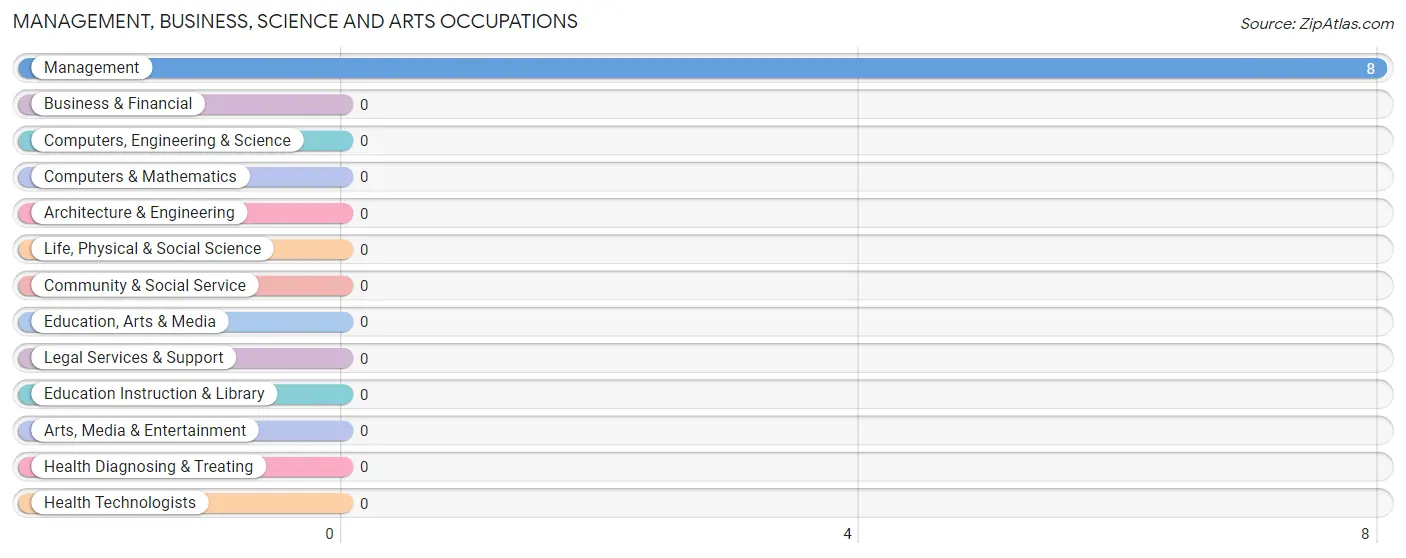
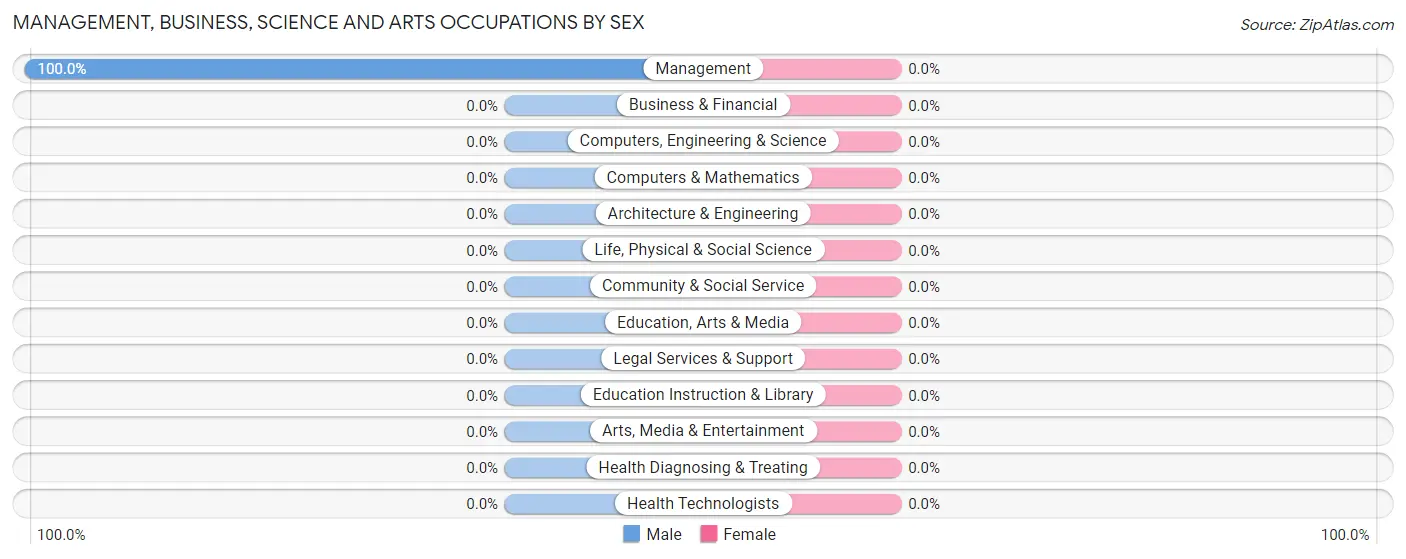
Management, Business, Science and Arts Occupations by Sex
| Occupation | Male | Female |
| Management | 8 (100.0%) | 0 (0.0%) |
| Business & Financial | 0 (0.0%) | 0 (0.0%) |
| Computers, Engineering & Science | 0 (0.0%) | 0 (0.0%) |
| Computers & Mathematics | 0 (0.0%) | 0 (0.0%) |
| Architecture & Engineering | 0 (0.0%) | 0 (0.0%) |
| Life, Physical & Social Science | 0 (0.0%) | 0 (0.0%) |
| Community & Social Service | 0 (0.0%) | 0 (0.0%) |
| Education, Arts & Media | 0 (0.0%) | 0 (0.0%) |
| Legal Services & Support | 0 (0.0%) | 0 (0.0%) |
| Education Instruction & Library | 0 (0.0%) | 0 (0.0%) |
| Arts, Media & Entertainment | 0 (0.0%) | 0 (0.0%) |
| Health Diagnosing & Treating | 0 (0.0%) | 0 (0.0%) |
| Health Technologists | 0 (0.0%) | 0 (0.0%) |
| Total (Category) | 8 (100.0%) | 0 (0.0%) |
| Total (Overall) | 76 (39.2%) | 118 (60.8%) |
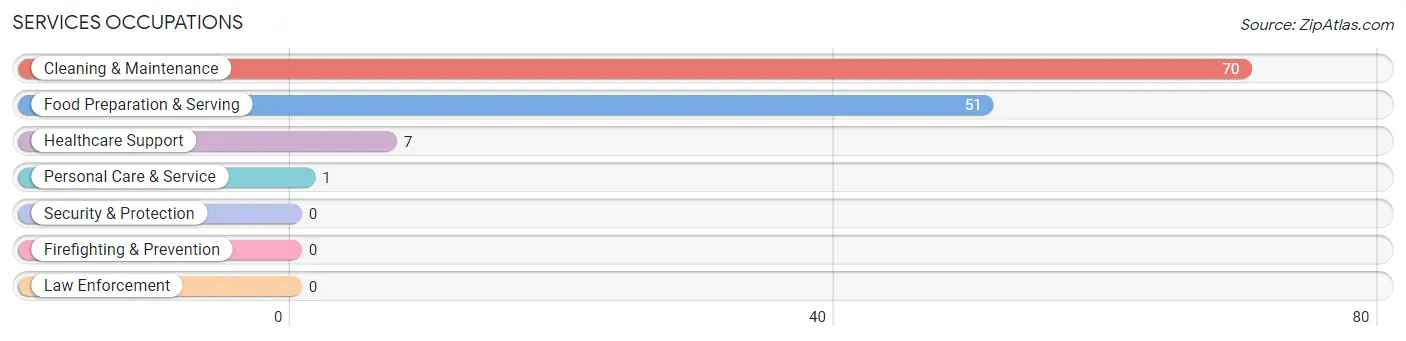
Services Occupations
The most common Services occupations in Indio Hills are Cleaning & Maintenance (70 | 36.1%), Food Preparation & Serving (51 | 26.3%), Healthcare Support (7 | 3.6%), and Personal Care & Service (1 | 0.5%).
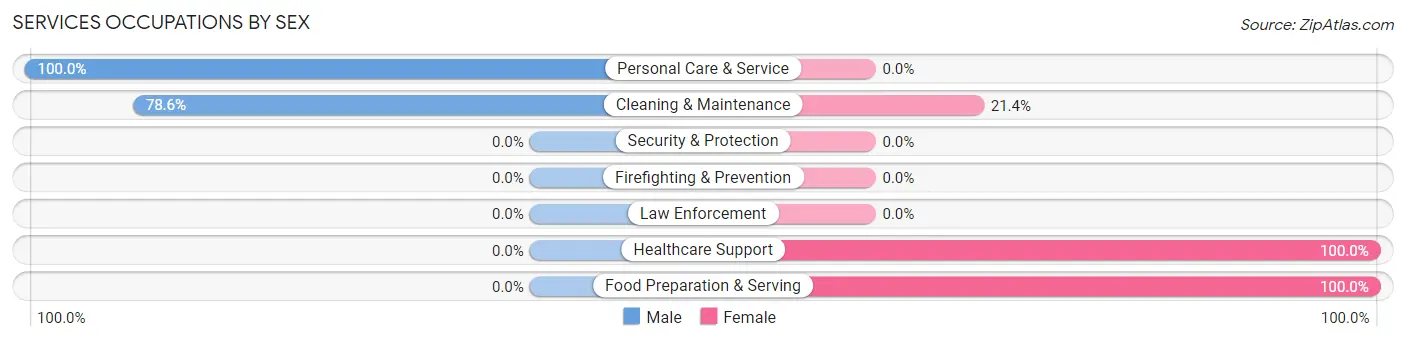
Services Occupations by Sex
Within the Services occupations in Indio Hills, the most male-oriented occupations are Personal Care & Service (100.0%), and Cleaning & Maintenance (78.6%), while the most female-oriented occupations are Healthcare Support (100.0%), Food Preparation & Serving (100.0%), and Cleaning & Maintenance (21.4%).
| Occupation | Male | Female |
| Healthcare Support | 0 (0.0%) | 7 (100.0%) |
| Security & Protection | 0 (0.0%) | 0 (0.0%) |
| Firefighting & Prevention | 0 (0.0%) | 0 (0.0%) |
| Law Enforcement | 0 (0.0%) | 0 (0.0%) |
| Food Preparation & Serving | 0 (0.0%) | 51 (100.0%) |
| Cleaning & Maintenance | 55 (78.6%) | 15 (21.4%) |
| Personal Care & Service | 1 (100.0%) | 0 (0.0%) |
| Total (Category) | 56 (43.4%) | 73 (56.6%) |
| Total (Overall) | 76 (39.2%) | 118 (60.8%) |
Sales and Office Occupations
The most common Sales and Office occupations in Indio Hills are , and Office & Administration (45 | 23.2%).
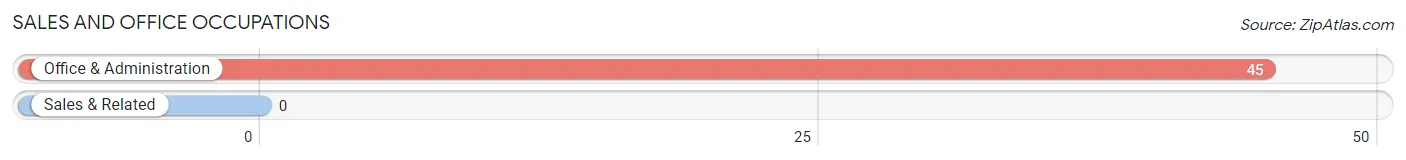
Sales and Office Occupations by Sex
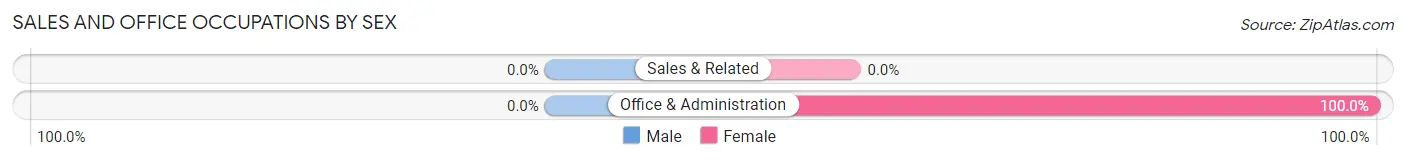
| Occupation | Male | Female |
| Sales & Related | 0 (0.0%) | 0 (0.0%) |
| Office & Administration | 0 (0.0%) | 45 (100.0%) |
| Total (Category) | 0 (0.0%) | 45 (100.0%) |
| Total (Overall) | 76 (39.2%) | 118 (60.8%) |
Natural Resources, Construction and Maintenance Occupations
The most common Natural Resources, Construction and Maintenance occupations in Indio Hills are , and Construction & Extraction (12 | 6.2%).
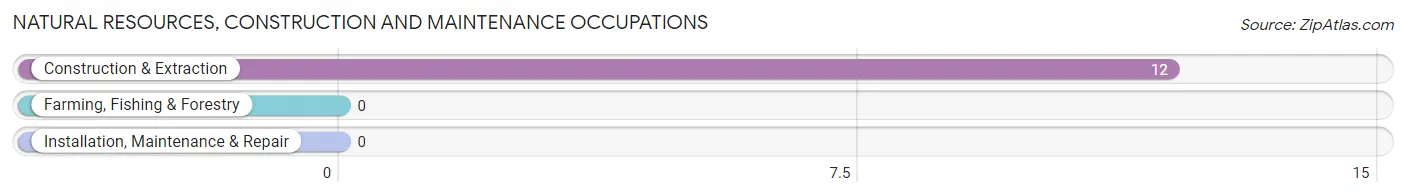
Natural Resources, Construction and Maintenance Occupations by Sex
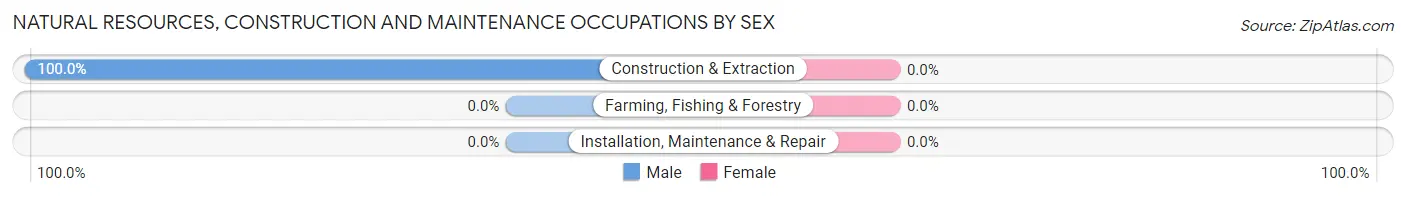
| Occupation | Male | Female |
| Farming, Fishing & Forestry | 0 (0.0%) | 0 (0.0%) |
| Construction & Extraction | 12 (100.0%) | 0 (0.0%) |
| Installation, Maintenance & Repair | 0 (0.0%) | 0 (0.0%) |
| Total (Category) | 12 (100.0%) | 0 (0.0%) |
| Total (Overall) | 76 (39.2%) | 118 (60.8%) |
Production, Transportation and Moving Occupations
Production, Transportation and Moving Occupations by Sex
| Occupation | Male | Female |
| Production | 0 (0.0%) | 0 (0.0%) |
| Transportation | 0 (0.0%) | 0 (0.0%) |
| Material Moving | 0 (0.0%) | 0 (0.0%) |
| Total (Category) | 0 (0.0%) | 0 (0.0%) |
| Total (Overall) | 76 (39.2%) | 118 (60.8%) |
Employment Industries by Sex in Indio Hills
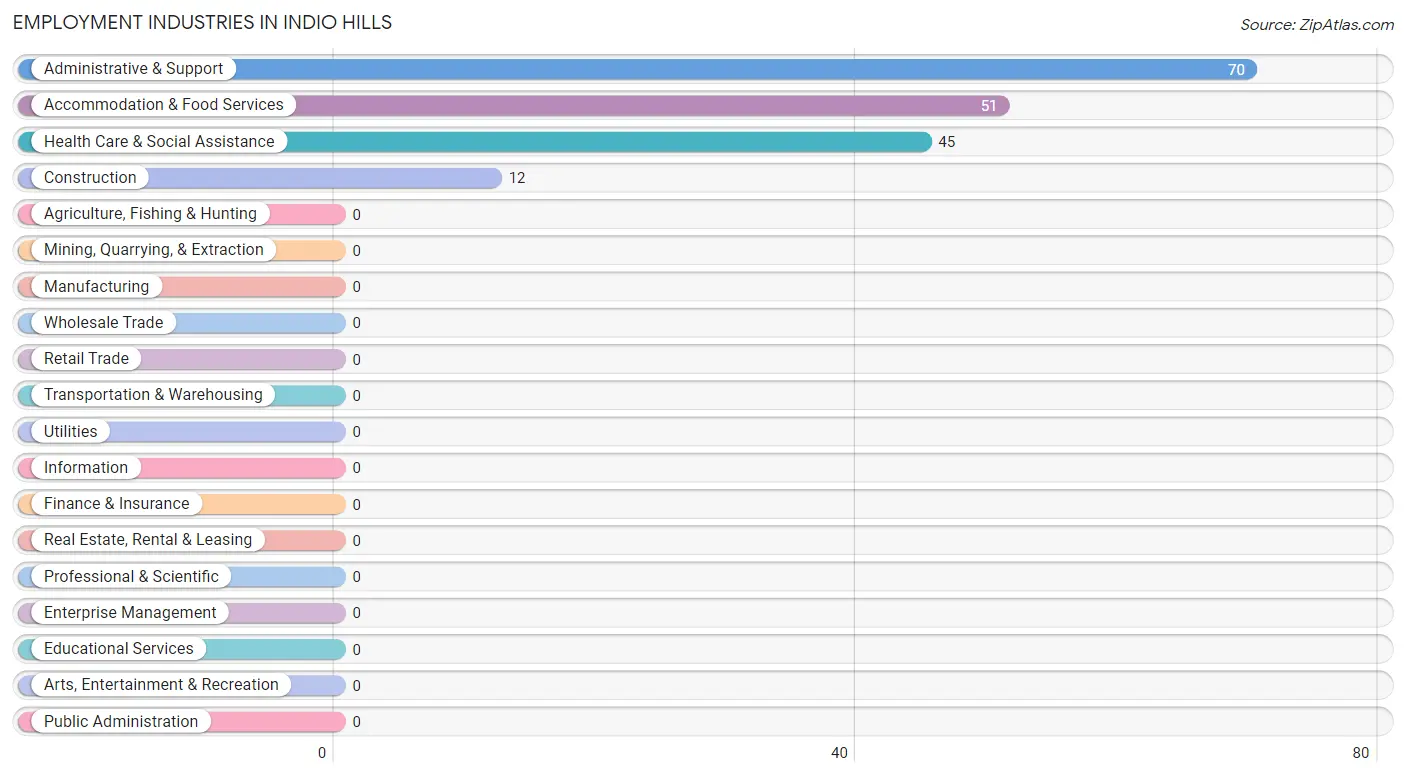
Employment Industries in Indio Hills
The major employment industries in Indio Hills include Administrative & Support (70 | 36.1%), Accommodation & Food Services (51 | 26.3%), Health Care & Social Assistance (45 | 23.2%), and Construction (12 | 6.2%).
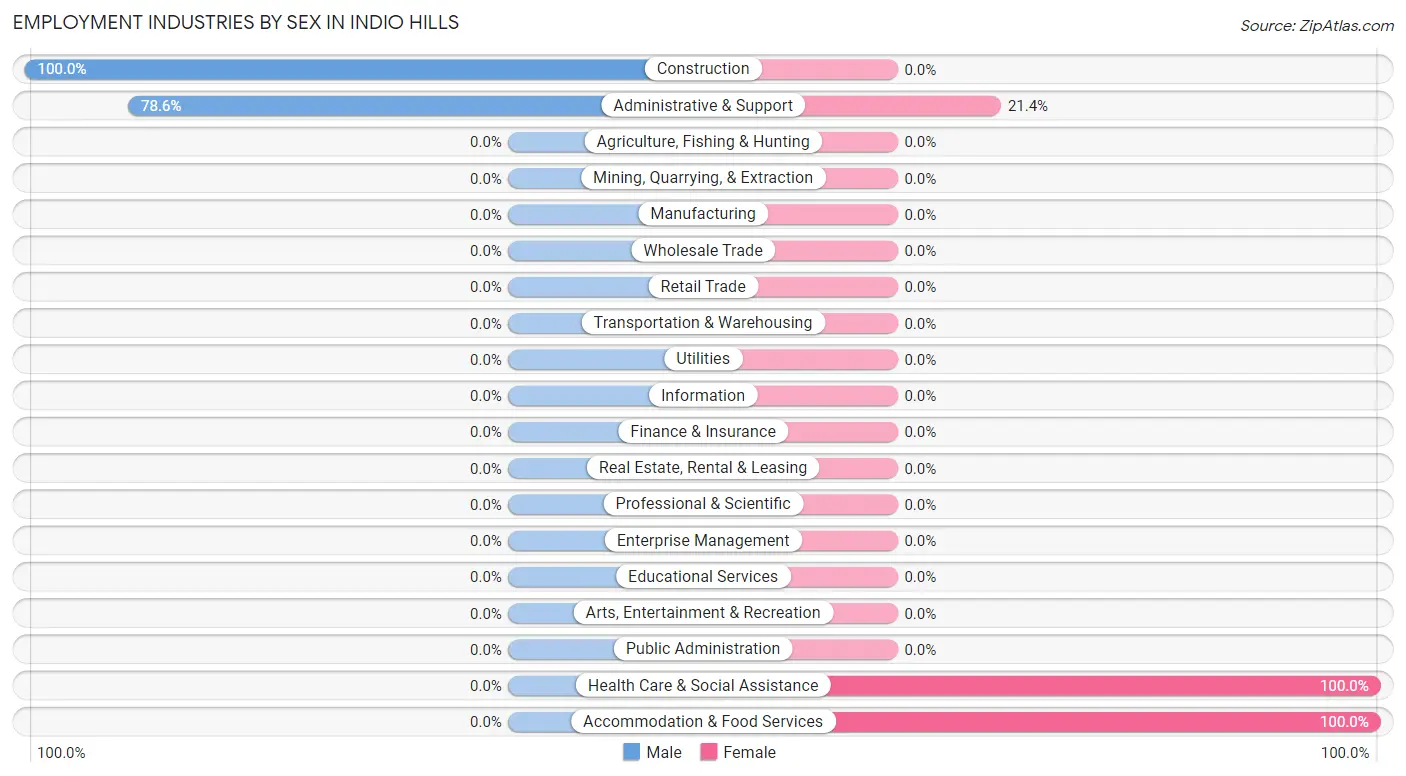
Employment Industries by Sex in Indio Hills
The Indio Hills industries that see more men than women are Construction (100.0%), and Administrative & Support (78.6%), whereas the industries that tend to have a higher number of women are Health Care & Social Assistance (100.0%), Accommodation & Food Services (100.0%), and Administrative & Support (21.4%).
| Industry | Male | Female |
| Agriculture, Fishing & Hunting | 0 (0.0%) | 0 (0.0%) |
| Mining, Quarrying, & Extraction | 0 (0.0%) | 0 (0.0%) |
| Construction | 12 (100.0%) | 0 (0.0%) |
| Manufacturing | 0 (0.0%) | 0 (0.0%) |
| Wholesale Trade | 0 (0.0%) | 0 (0.0%) |
| Retail Trade | 0 (0.0%) | 0 (0.0%) |
| Transportation & Warehousing | 0 (0.0%) | 0 (0.0%) |
| Utilities | 0 (0.0%) | 0 (0.0%) |
| Information | 0 (0.0%) | 0 (0.0%) |
| Finance & Insurance | 0 (0.0%) | 0 (0.0%) |
| Real Estate, Rental & Leasing | 0 (0.0%) | 0 (0.0%) |
| Professional & Scientific | 0 (0.0%) | 0 (0.0%) |
| Enterprise Management | 0 (0.0%) | 0 (0.0%) |
| Administrative & Support | 55 (78.6%) | 15 (21.4%) |
| Educational Services | 0 (0.0%) | 0 (0.0%) |
| Health Care & Social Assistance | 0 (0.0%) | 45 (100.0%) |
| Arts, Entertainment & Recreation | 0 (0.0%) | 0 (0.0%) |
| Accommodation & Food Services | 0 (0.0%) | 51 (100.0%) |
| Public Administration | 0 (0.0%) | 0 (0.0%) |
| Total | 76 (39.2%) | 118 (60.8%) |
Education in Indio Hills
School Enrollment in Indio Hills
The most common levels of schooling among the 99 students in Indio Hills are middle school (50 | 50.5%), kindergarten (45 | 45.5%), and college / undergraduate (4 | 4.0%).
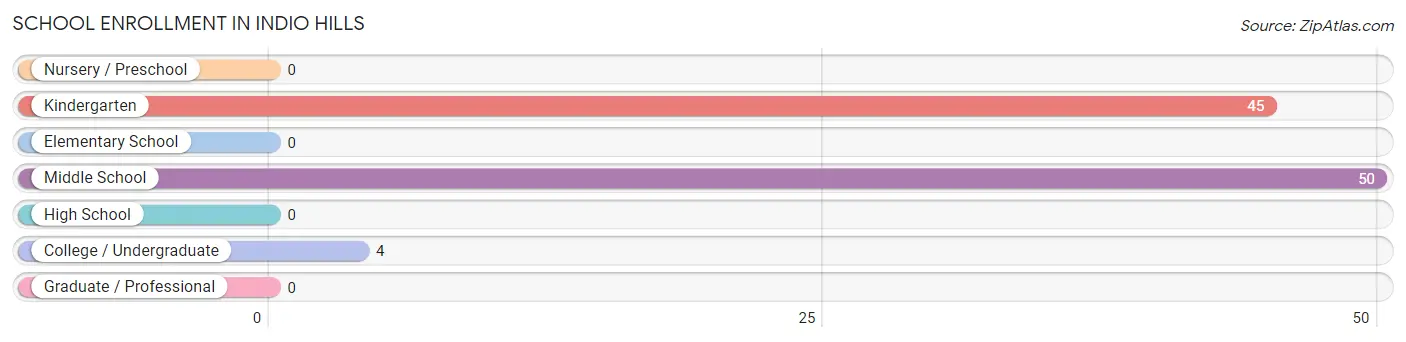
| School Level | # Students | % Students |
| Nursery / Preschool | 0 | 0.0% |
| Kindergarten | 45 | 45.5% |
| Elementary School | 0 | 0.0% |
| Middle School | 50 | 50.5% |
| High School | 0 | 0.0% |
| College / Undergraduate | 4 | 4.0% |
| Graduate / Professional | 0 | 0.0% |
| Total | 99 | 100.0% |
School Enrollment by Age by Funding Source in Indio Hills
Out of a total of 99 students who are enrolled in schools in Indio Hills, 1 (1.0%) attend a private institution, while the remaining 98 (99.0%) are enrolled in public schools. The age group of 20 to 24 year olds has the highest likelihood of being enrolled in private schools, with 1 (100.0% in the age bracket) enrolled. Conversely, the age group of 5 to 9 year old has the lowest likelihood of being enrolled in a private school, with 45 (100.0% in the age bracket) attending a public institution.
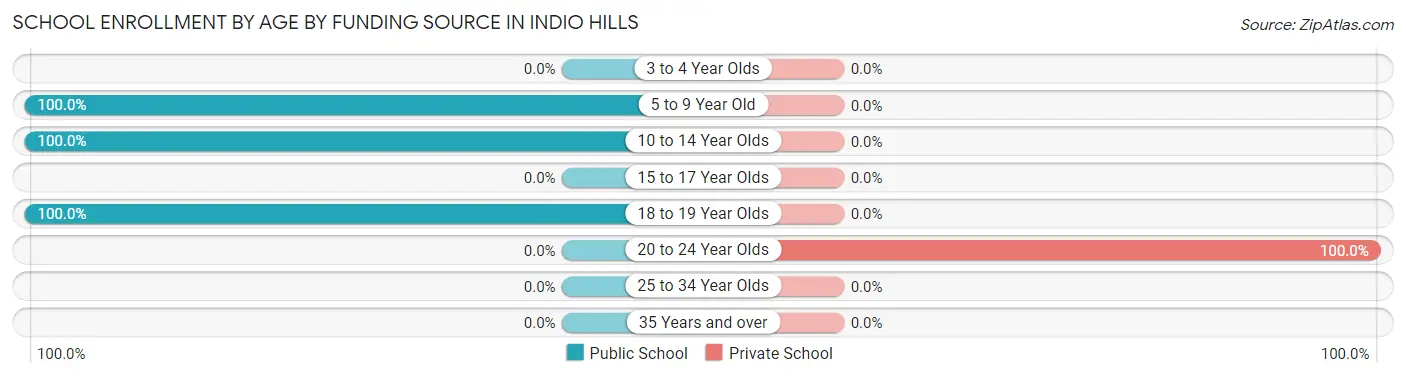
| Age Bracket | Public School | Private School |
| 3 to 4 Year Olds | 0 (0.0%) | 0 (0.0%) |
| 5 to 9 Year Old | 45 (100.0%) | 0 (0.0%) |
| 10 to 14 Year Olds | 50 (100.0%) | 0 (0.0%) |
| 15 to 17 Year Olds | 0 (0.0%) | 0 (0.0%) |
| 18 to 19 Year Olds | 3 (100.0%) | 0 (0.0%) |
| 20 to 24 Year Olds | 0 (0.0%) | 1 (100.0%) |
| 25 to 34 Year Olds | 0 (0.0%) | 0 (0.0%) |
| 35 Years and over | 0 (0.0%) | 0 (0.0%) |
| Total | 98 (99.0%) | 1 (1.0%) |
Educational Attainment by Field of Study in Indio Hills
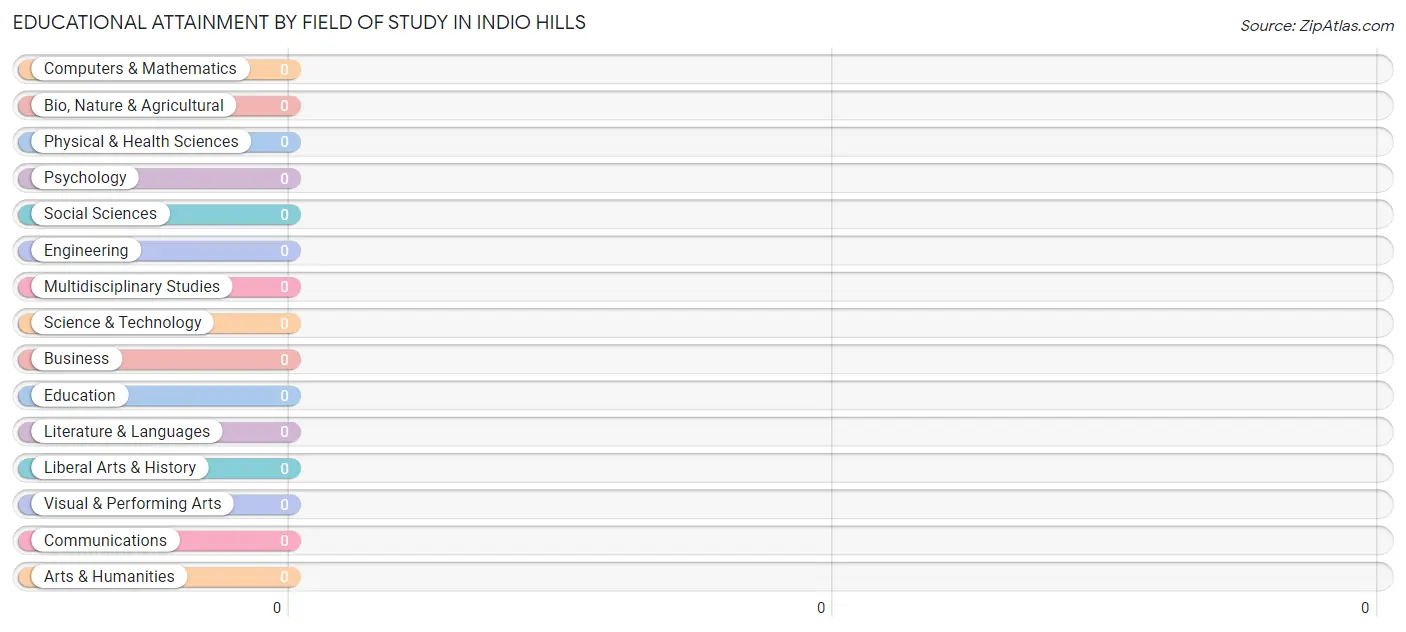
| Field of Study | # Graduates | % Graduates |
| Computers & Mathematics | 0 | 0.0% |
| Bio, Nature & Agricultural | 0 | 0.0% |
| Physical & Health Sciences | 0 | 0.0% |
| Psychology | 0 | 0.0% |
| Social Sciences | 0 | 0.0% |
| Engineering | 0 | 0.0% |
| Multidisciplinary Studies | 0 | 0.0% |
| Science & Technology | 0 | 0.0% |
| Business | 0 | 0.0% |
| Education | 0 | 0.0% |
| Literature & Languages | 0 | 0.0% |
| Liberal Arts & History | 0 | 0.0% |
| Visual & Performing Arts | 0 | 0.0% |
| Communications | 0 | 0.0% |
| Arts & Humanities | 0 | 0.0% |
| Total | 0 | 0.0% |
Transportation & Commute in Indio Hills
Vehicle Availability by Sex in Indio Hills
The most prevalent vehicle ownership categories in Indio Hills are males with 2 vehicles (51, accounting for 68.0%) and females with 2 vehicles (49, making up 43.2%).
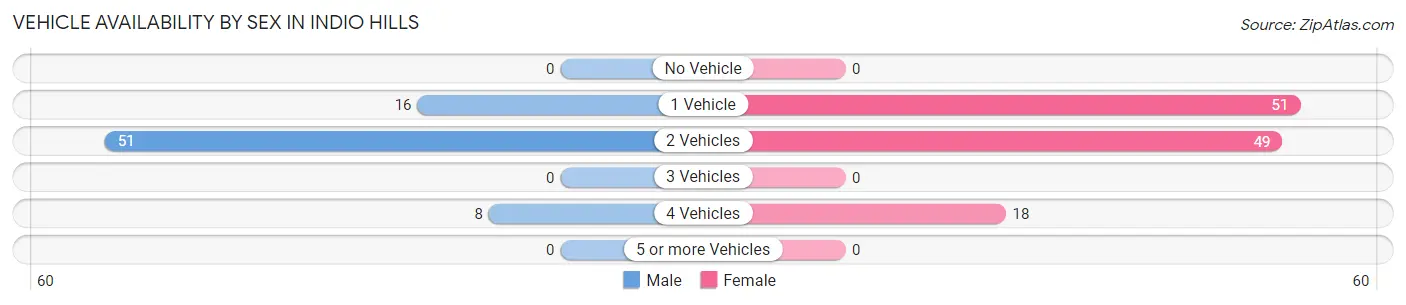
| Vehicles Available | Male | Female |
| No Vehicle | 0 (0.0%) | 0 (0.0%) |
| 1 Vehicle | 16 (21.3%) | 51 (43.2%) |
| 2 Vehicles | 51 (68.0%) | 49 (41.5%) |
| 3 Vehicles | 0 (0.0%) | 0 (0.0%) |
| 4 Vehicles | 8 (10.7%) | 18 (15.2%) |
| 5 or more Vehicles | 0 (0.0%) | 0 (0.0%) |
| Total | 75 (100.0%) | 118 (100.0%) |
Commute Time in Indio Hills
The most frequently occuring commute durations in Indio Hills are 30 to 34 minutes (91 commuters, 61.1%), 25 to 29 minutes (24 commuters, 16.1%), and 20 to 24 minutes (22 commuters, 14.8%).
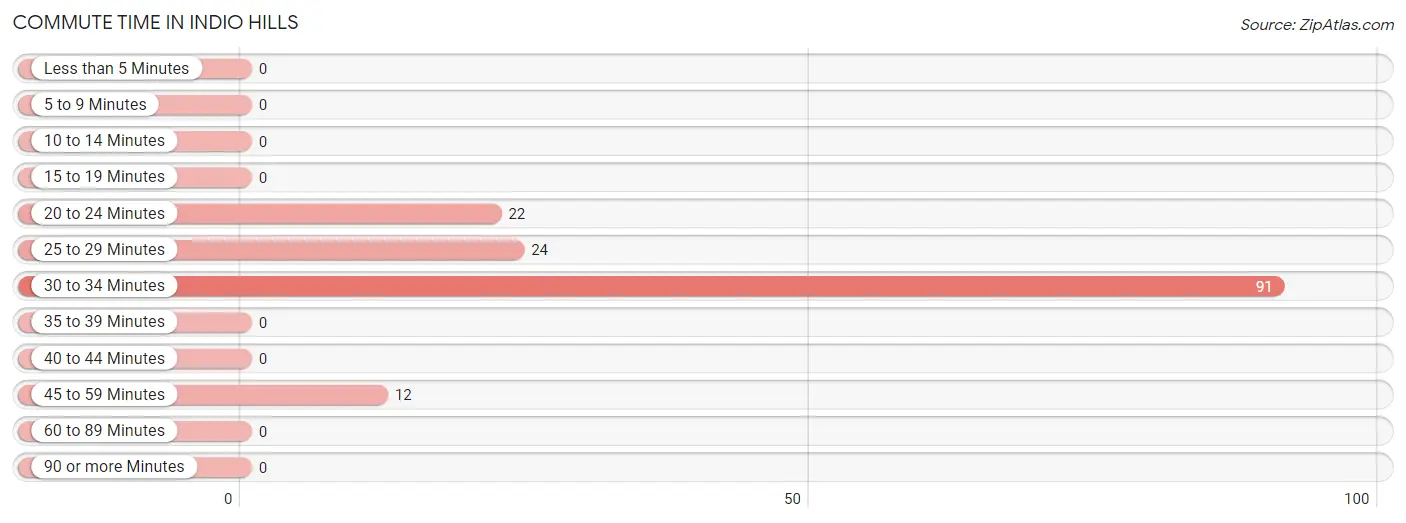
| Commute Time | # Commuters | % Commuters |
| Less than 5 Minutes | 0 | 0.0% |
| 5 to 9 Minutes | 0 | 0.0% |
| 10 to 14 Minutes | 0 | 0.0% |
| 15 to 19 Minutes | 0 | 0.0% |
| 20 to 24 Minutes | 22 | 14.8% |
| 25 to 29 Minutes | 24 | 16.1% |
| 30 to 34 Minutes | 91 | 61.1% |
| 35 to 39 Minutes | 0 | 0.0% |
| 40 to 44 Minutes | 0 | 0.0% |
| 45 to 59 Minutes | 12 | 8.1% |
| 60 to 89 Minutes | 0 | 0.0% |
| 90 or more Minutes | 0 | 0.0% |
Commute Time by Sex in Indio Hills
The most common commute times in Indio Hills are 30 to 34 minutes (40 commuters, 52.6%) for males and 30 to 34 minutes (51 commuters, 69.9%) for females.
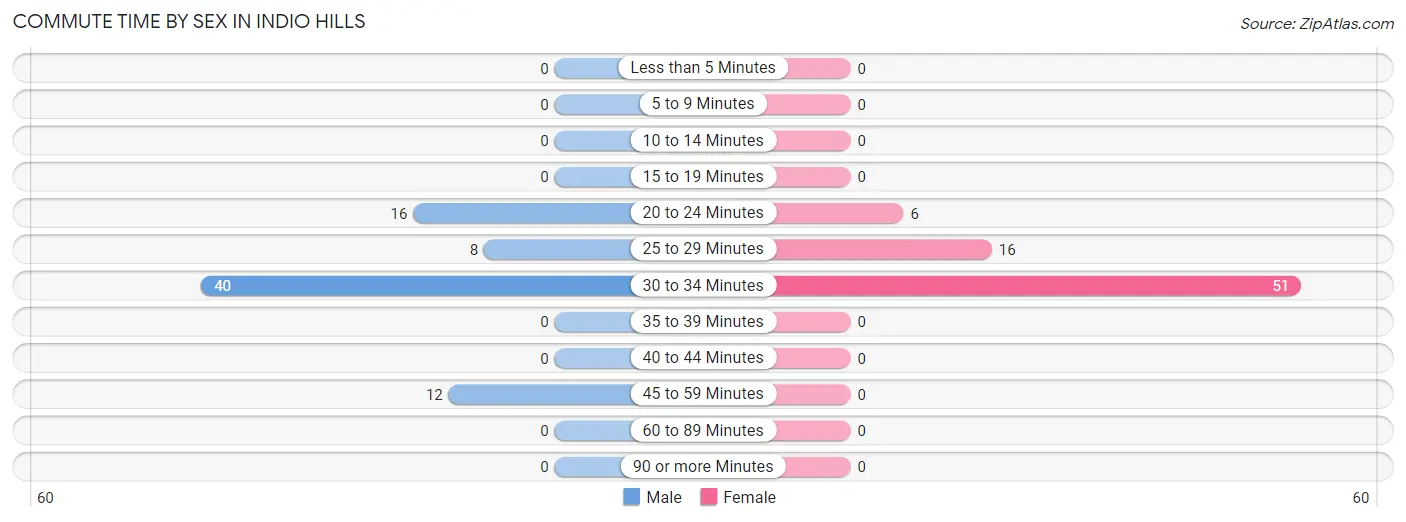
| Commute Time | Male | Female |
| Less than 5 Minutes | 0 (0.0%) | 0 (0.0%) |
| 5 to 9 Minutes | 0 (0.0%) | 0 (0.0%) |
| 10 to 14 Minutes | 0 (0.0%) | 0 (0.0%) |
| 15 to 19 Minutes | 0 (0.0%) | 0 (0.0%) |
| 20 to 24 Minutes | 16 (21.0%) | 6 (8.2%) |
| 25 to 29 Minutes | 8 (10.5%) | 16 (21.9%) |
| 30 to 34 Minutes | 40 (52.6%) | 51 (69.9%) |
| 35 to 39 Minutes | 0 (0.0%) | 0 (0.0%) |
| 40 to 44 Minutes | 0 (0.0%) | 0 (0.0%) |
| 45 to 59 Minutes | 12 (15.8%) | 0 (0.0%) |
| 60 to 89 Minutes | 0 (0.0%) | 0 (0.0%) |
| 90 or more Minutes | 0 (0.0%) | 0 (0.0%) |
Time of Departure to Work by Sex in Indio Hills
The most frequent times of departure to work in Indio Hills are 5:00 AM to 5:29 AM (39, 51.3%) for males and 7:00 AM to 7:29 AM (48, 65.7%) for females.
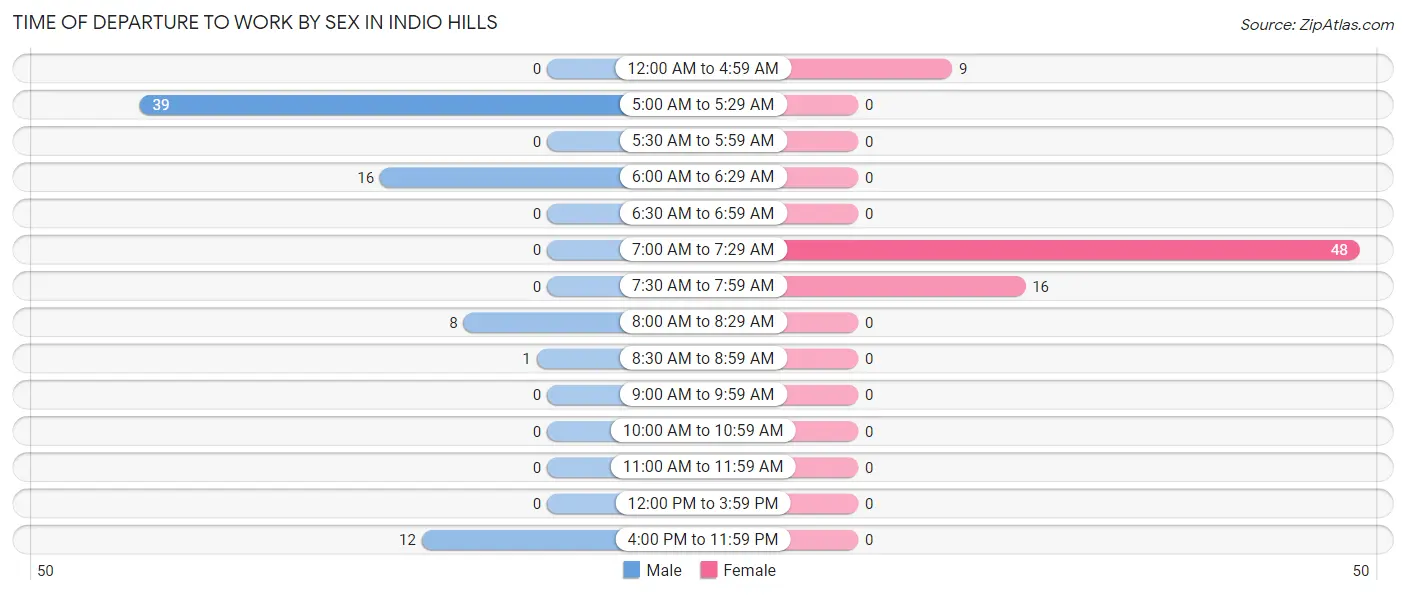
| Time of Departure | Male | Female |
| 12:00 AM to 4:59 AM | 0 (0.0%) | 9 (12.3%) |
| 5:00 AM to 5:29 AM | 39 (51.3%) | 0 (0.0%) |
| 5:30 AM to 5:59 AM | 0 (0.0%) | 0 (0.0%) |
| 6:00 AM to 6:29 AM | 16 (21.0%) | 0 (0.0%) |
| 6:30 AM to 6:59 AM | 0 (0.0%) | 0 (0.0%) |
| 7:00 AM to 7:29 AM | 0 (0.0%) | 48 (65.7%) |
| 7:30 AM to 7:59 AM | 0 (0.0%) | 16 (21.9%) |
| 8:00 AM to 8:29 AM | 8 (10.5%) | 0 (0.0%) |
| 8:30 AM to 8:59 AM | 1 (1.3%) | 0 (0.0%) |
| 9:00 AM to 9:59 AM | 0 (0.0%) | 0 (0.0%) |
| 10:00 AM to 10:59 AM | 0 (0.0%) | 0 (0.0%) |
| 11:00 AM to 11:59 AM | 0 (0.0%) | 0 (0.0%) |
| 12:00 PM to 3:59 PM | 0 (0.0%) | 0 (0.0%) |
| 4:00 PM to 11:59 PM | 12 (15.8%) | 0 (0.0%) |
| Total | 76 (100.0%) | 73 (100.0%) |
Housing Occupancy in Indio Hills
Occupancy by Ownership in Indio Hills
Of the total 185 dwellings in Indio Hills, owner-occupied units account for 160 (86.5%), while renter-occupied units make up 25 (13.5%).
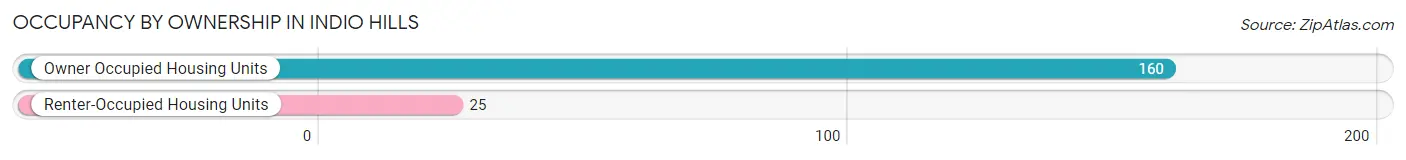
| Occupancy | # Housing Units | % Housing Units |
| Owner Occupied Housing Units | 160 | 86.5% |
| Renter-Occupied Housing Units | 25 | 13.5% |
| Total Occupied Housing Units | 185 | 100.0% |
Occupancy by Household Size in Indio Hills
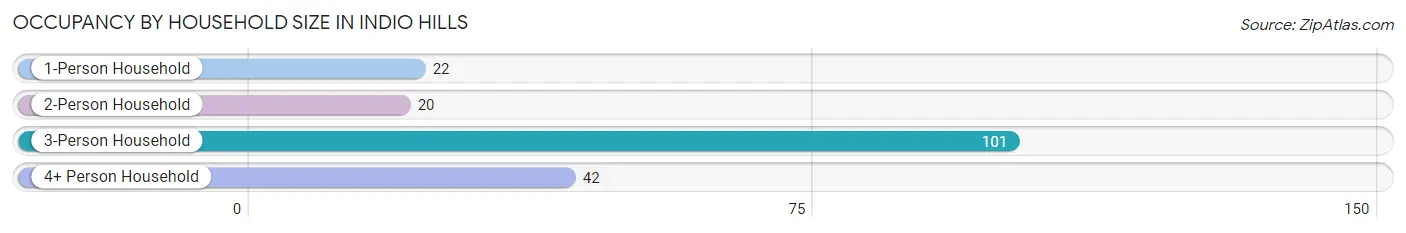
| Household Size | # Housing Units | % Housing Units |
| 1-Person Household | 22 | 11.9% |
| 2-Person Household | 20 | 10.8% |
| 3-Person Household | 101 | 54.6% |
| 4+ Person Household | 42 | 22.7% |
| Total Housing Units | 185 | 100.0% |
Occupancy by Ownership by Household Size in Indio Hills
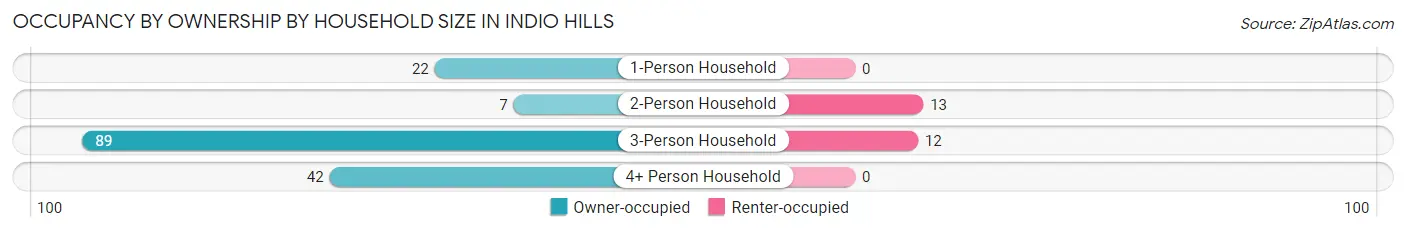
| Household Size | Owner-occupied | Renter-occupied |
| 1-Person Household | 22 (100.0%) | 0 (0.0%) |
| 2-Person Household | 7 (35.0%) | 13 (65.0%) |
| 3-Person Household | 89 (88.1%) | 12 (11.9%) |
| 4+ Person Household | 42 (100.0%) | 0 (0.0%) |
| Total Housing Units | 160 (86.5%) | 25 (13.5%) |
Occupancy by Educational Attainment in Indio Hills
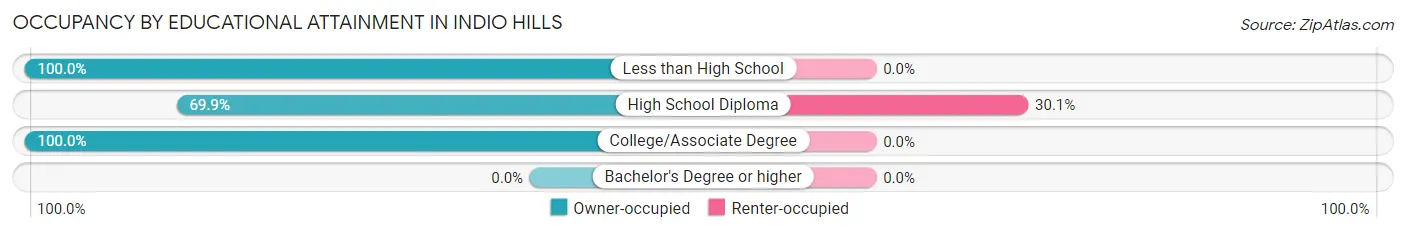
| Household Size | Owner-occupied | Renter-occupied |
| Less than High School | 96 (100.0%) | 0 (0.0%) |
| High School Diploma | 58 (69.9%) | 25 (30.1%) |
| College/Associate Degree | 6 (100.0%) | 0 (0.0%) |
| Bachelor's Degree or higher | 0 (0.0%) | 0 (0.0%) |
Occupancy by Age of Householder in Indio Hills
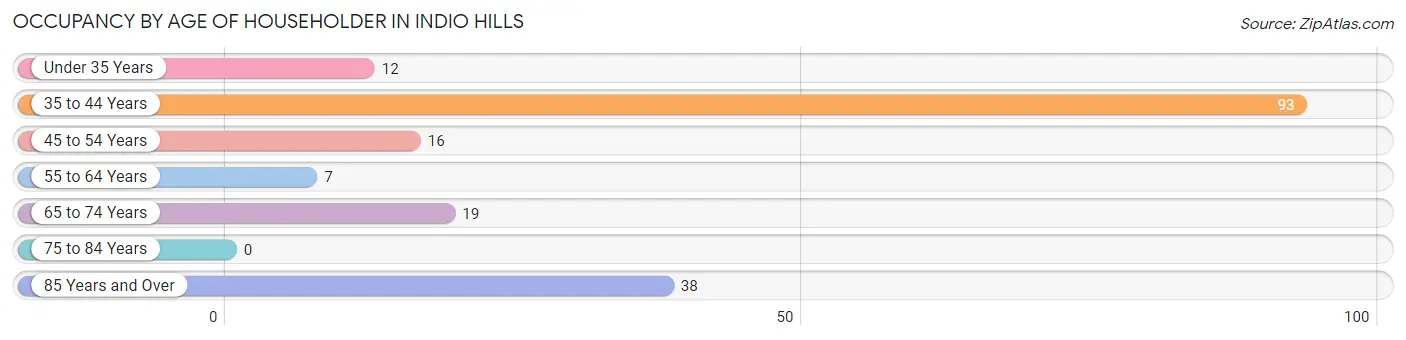
| Age Bracket | # Households | % Households |
| Under 35 Years | 12 | 6.5% |
| 35 to 44 Years | 93 | 50.3% |
| 45 to 54 Years | 16 | 8.6% |
| 55 to 64 Years | 7 | 3.8% |
| 65 to 74 Years | 19 | 10.3% |
| 75 to 84 Years | 0 | 0.0% |
| 85 Years and Over | 38 | 20.5% |
| Total | 185 | 100.0% |
Housing Finances in Indio Hills
Median Income by Occupancy in Indio Hills
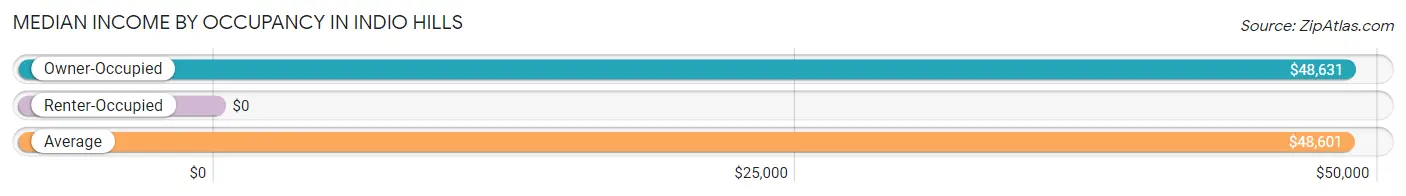
| Occupancy Type | # Households | Median Income |
| Owner-Occupied | 160 (86.5%) | $48,631 |
| Renter-Occupied | 25 (13.5%) | $0 |
| Average | 185 (100.0%) | $48,601 |
Occupancy by Householder Income Bracket in Indio Hills
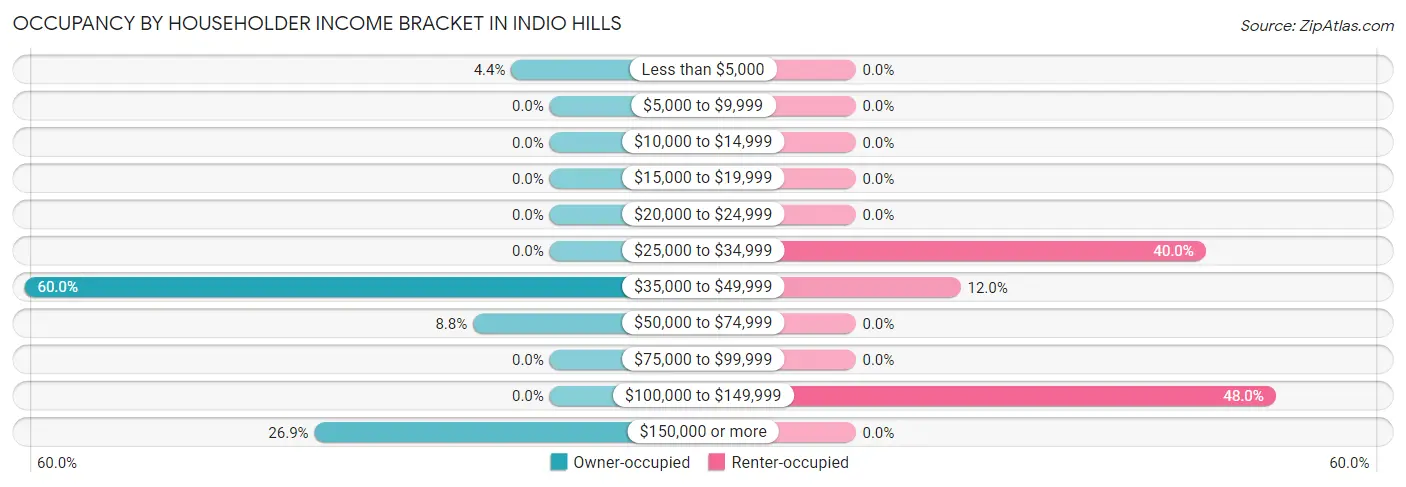
| Income Bracket | Owner-occupied | Renter-occupied |
| Less than $5,000 | 7 (4.4%) | 0 (0.0%) |
| $5,000 to $9,999 | 0 (0.0%) | 0 (0.0%) |
| $10,000 to $14,999 | 0 (0.0%) | 0 (0.0%) |
| $15,000 to $19,999 | 0 (0.0%) | 0 (0.0%) |
| $20,000 to $24,999 | 0 (0.0%) | 0 (0.0%) |
| $25,000 to $34,999 | 0 (0.0%) | 10 (40.0%) |
| $35,000 to $49,999 | 96 (60.0%) | 3 (12.0%) |
| $50,000 to $74,999 | 14 (8.7%) | 0 (0.0%) |
| $75,000 to $99,999 | 0 (0.0%) | 0 (0.0%) |
| $100,000 to $149,999 | 0 (0.0%) | 12 (48.0%) |
| $150,000 or more | 43 (26.9%) | 0 (0.0%) |
| Total | 160 (100.0%) | 25 (100.0%) |
Monthly Housing Cost Tiers in Indio Hills
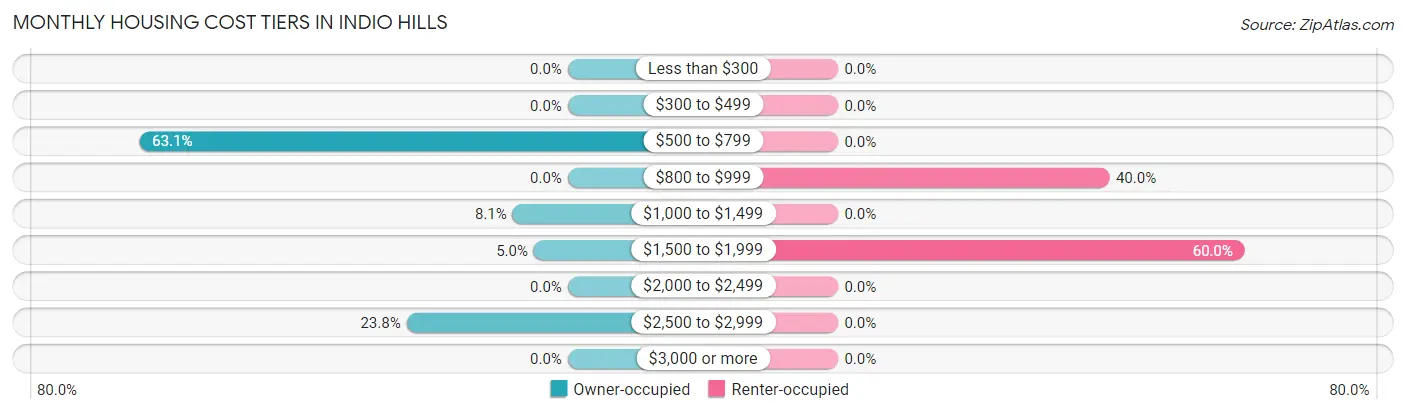
| Monthly Cost | Owner-occupied | Renter-occupied |
| Less than $300 | 0 (0.0%) | 0 (0.0%) |
| $300 to $499 | 0 (0.0%) | 0 (0.0%) |
| $500 to $799 | 101 (63.1%) | 0 (0.0%) |
| $800 to $999 | 0 (0.0%) | 10 (40.0%) |
| $1,000 to $1,499 | 13 (8.1%) | 0 (0.0%) |
| $1,500 to $1,999 | 8 (5.0%) | 15 (60.0%) |
| $2,000 to $2,499 | 0 (0.0%) | 0 (0.0%) |
| $2,500 to $2,999 | 38 (23.7%) | 0 (0.0%) |
| $3,000 or more | 0 (0.0%) | 0 (0.0%) |
| Total | 160 (100.0%) | 25 (100.0%) |
Physical Housing Characteristics in Indio Hills
Housing Structures in Indio Hills
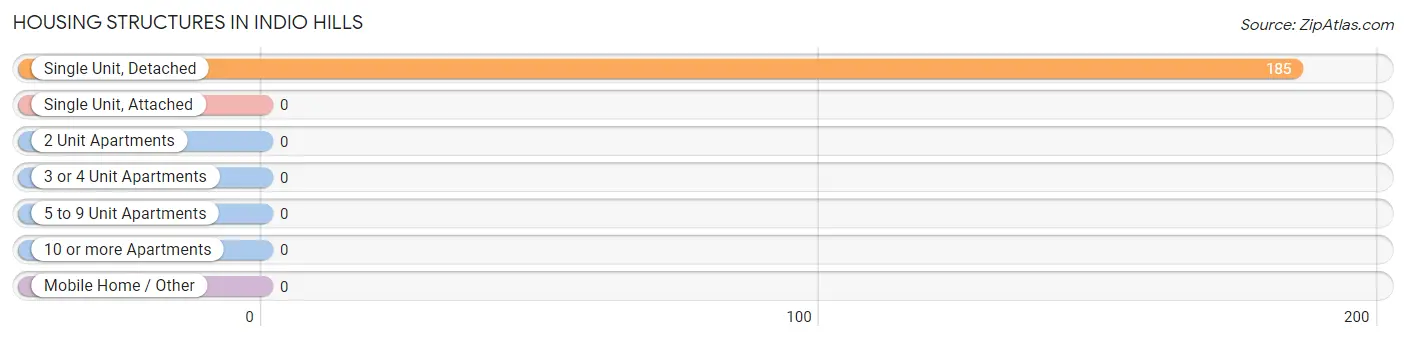
| Structure Type | # Housing Units | % Housing Units |
| Single Unit, Detached | 185 | 100.0% |
| Single Unit, Attached | 0 | 0.0% |
| 2 Unit Apartments | 0 | 0.0% |
| 3 or 4 Unit Apartments | 0 | 0.0% |
| 5 to 9 Unit Apartments | 0 | 0.0% |
| 10 or more Apartments | 0 | 0.0% |
| Mobile Home / Other | 0 | 0.0% |
| Total | 185 | 100.0% |
Housing Structures by Occupancy in Indio Hills
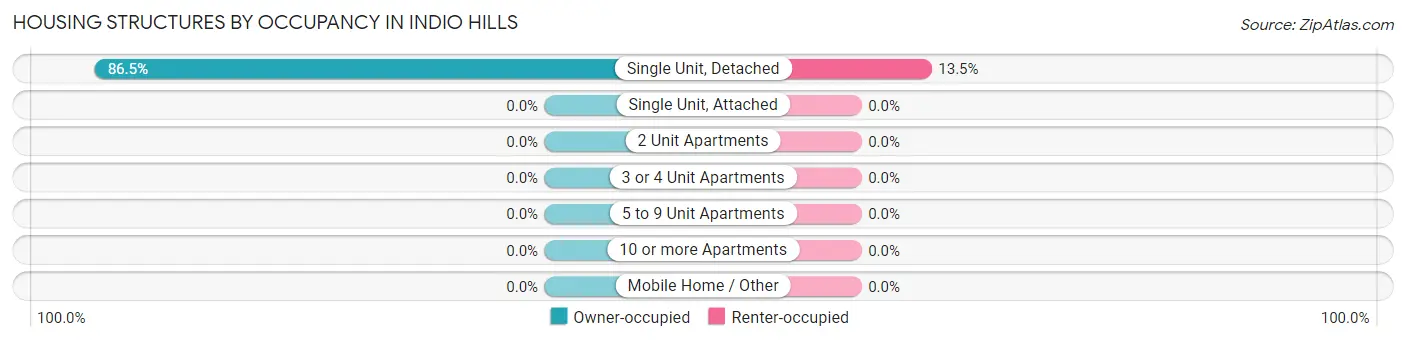
| Structure Type | Owner-occupied | Renter-occupied |
| Single Unit, Detached | 160 (86.5%) | 25 (13.5%) |
| Single Unit, Attached | 0 (0.0%) | 0 (0.0%) |
| 2 Unit Apartments | 0 (0.0%) | 0 (0.0%) |
| 3 or 4 Unit Apartments | 0 (0.0%) | 0 (0.0%) |
| 5 to 9 Unit Apartments | 0 (0.0%) | 0 (0.0%) |
| 10 or more Apartments | 0 (0.0%) | 0 (0.0%) |
| Mobile Home / Other | 0 (0.0%) | 0 (0.0%) |
| Total | 160 (86.5%) | 25 (13.5%) |
Housing Structures by Number of Rooms in Indio Hills
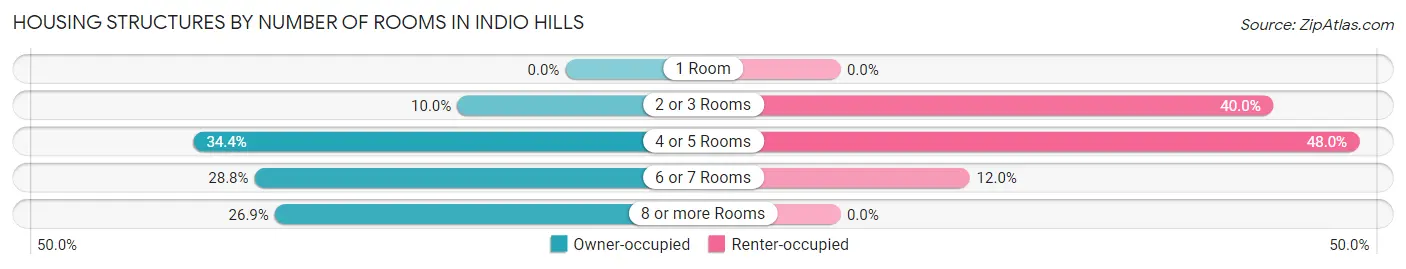
| Number of Rooms | Owner-occupied | Renter-occupied |
| 1 Room | 0 (0.0%) | 0 (0.0%) |
| 2 or 3 Rooms | 16 (10.0%) | 10 (40.0%) |
| 4 or 5 Rooms | 55 (34.4%) | 12 (48.0%) |
| 6 or 7 Rooms | 46 (28.7%) | 3 (12.0%) |
| 8 or more Rooms | 43 (26.9%) | 0 (0.0%) |
| Total | 160 (100.0%) | 25 (100.0%) |
Housing Structure by Heating Type in Indio Hills
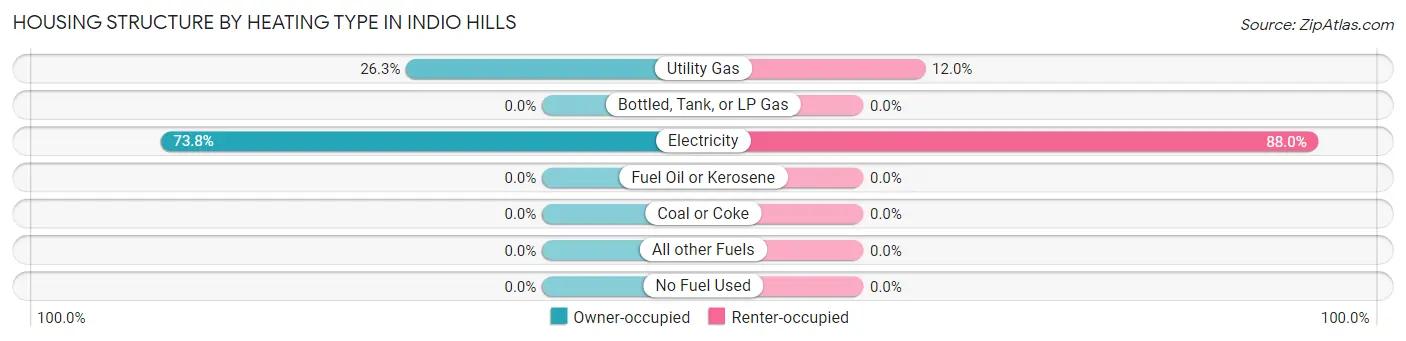
| Heating Type | Owner-occupied | Renter-occupied |
| Utility Gas | 42 (26.3%) | 3 (12.0%) |
| Bottled, Tank, or LP Gas | 0 (0.0%) | 0 (0.0%) |
| Electricity | 118 (73.8%) | 22 (88.0%) |
| Fuel Oil or Kerosene | 0 (0.0%) | 0 (0.0%) |
| Coal or Coke | 0 (0.0%) | 0 (0.0%) |
| All other Fuels | 0 (0.0%) | 0 (0.0%) |
| No Fuel Used | 0 (0.0%) | 0 (0.0%) |
| Total | 160 (100.0%) | 25 (100.0%) |
Household Vehicle Usage in Indio Hills
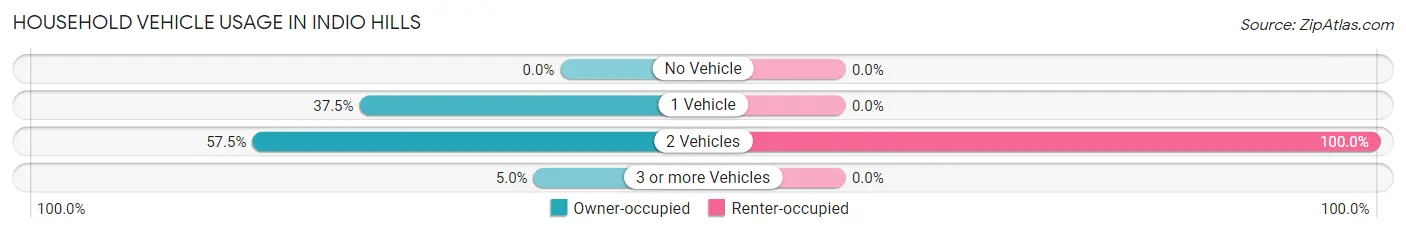
| Vehicles per Household | Owner-occupied | Renter-occupied |
| No Vehicle | 0 (0.0%) | 0 (0.0%) |
| 1 Vehicle | 60 (37.5%) | 0 (0.0%) |
| 2 Vehicles | 92 (57.5%) | 25 (100.0%) |
| 3 or more Vehicles | 8 (5.0%) | 0 (0.0%) |
| Total | 160 (100.0%) | 25 (100.0%) |
Real Estate & Mortgages in Indio Hills
Real Estate and Mortgage Overview in Indio Hills
| Characteristic | Without Mortgage | With Mortgage |
| Housing Units | 85 | 75 |
| Median Property Value | - | - |
| Median Household Income | - | - |
| Monthly Housing Costs | - | - |
| Real Estate Taxes | - | - |
Property Value by Mortgage Status in Indio Hills
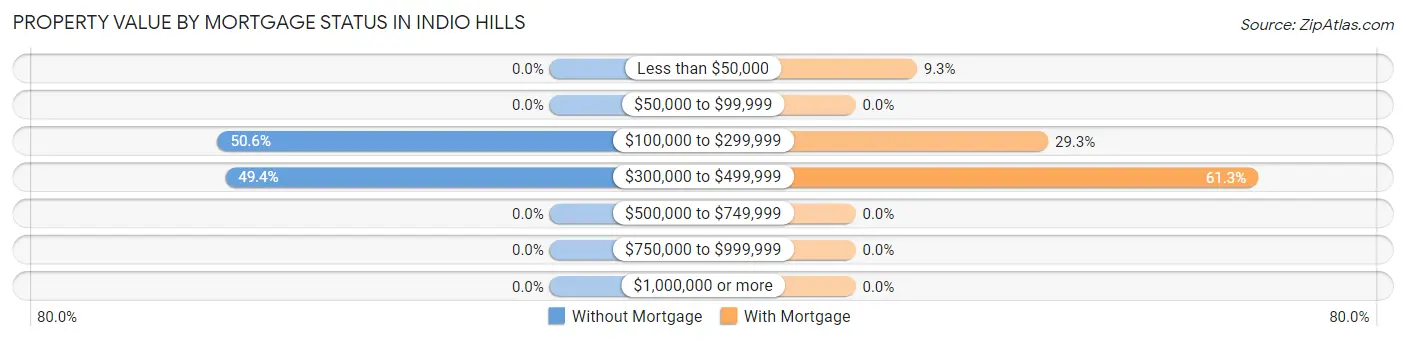
| Property Value | Without Mortgage | With Mortgage |
| Less than $50,000 | 0 (0.0%) | 7 (9.3%) |
| $50,000 to $99,999 | 0 (0.0%) | 0 (0.0%) |
| $100,000 to $299,999 | 43 (50.6%) | 22 (29.3%) |
| $300,000 to $499,999 | 42 (49.4%) | 46 (61.3%) |
| $500,000 to $749,999 | 0 (0.0%) | 0 (0.0%) |
| $750,000 to $999,999 | 0 (0.0%) | 0 (0.0%) |
| $1,000,000 or more | 0 (0.0%) | 0 (0.0%) |
| Total | 85 (100.0%) | 75 (100.0%) |
Household Income by Mortgage Status in Indio Hills
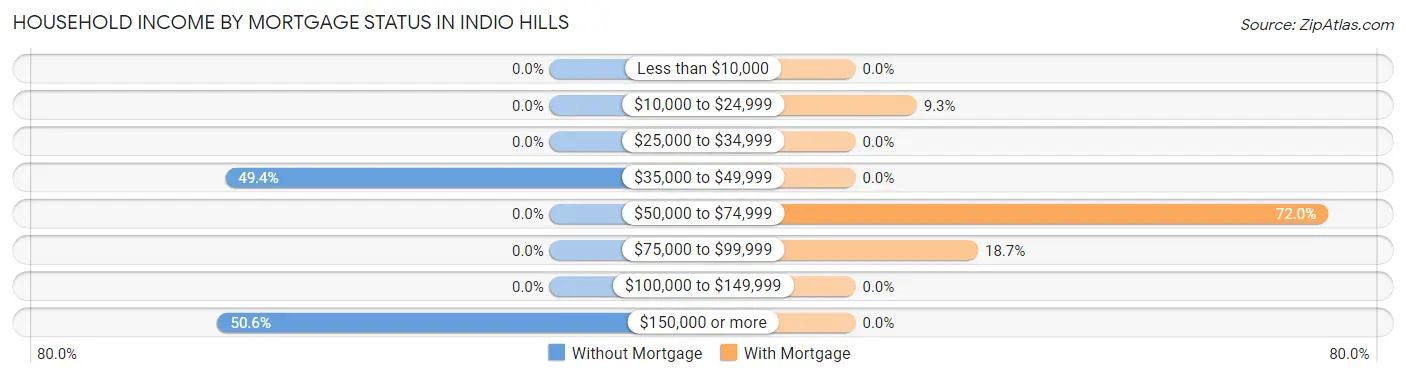
| Household Income | Without Mortgage | With Mortgage |
| Less than $10,000 | 0 (0.0%) | 0 (0.0%) |
| $10,000 to $24,999 | 0 (0.0%) | 7 (9.3%) |
| $25,000 to $34,999 | 0 (0.0%) | 0 (0.0%) |
| $35,000 to $49,999 | 42 (49.4%) | 0 (0.0%) |
| $50,000 to $74,999 | 0 (0.0%) | 54 (72.0%) |
| $75,000 to $99,999 | 0 (0.0%) | 14 (18.7%) |
| $100,000 to $149,999 | 0 (0.0%) | 0 (0.0%) |
| $150,000 or more | 43 (50.6%) | 0 (0.0%) |
| Total | 85 (100.0%) | 75 (100.0%) |
Property Value to Household Income Ratio in Indio Hills
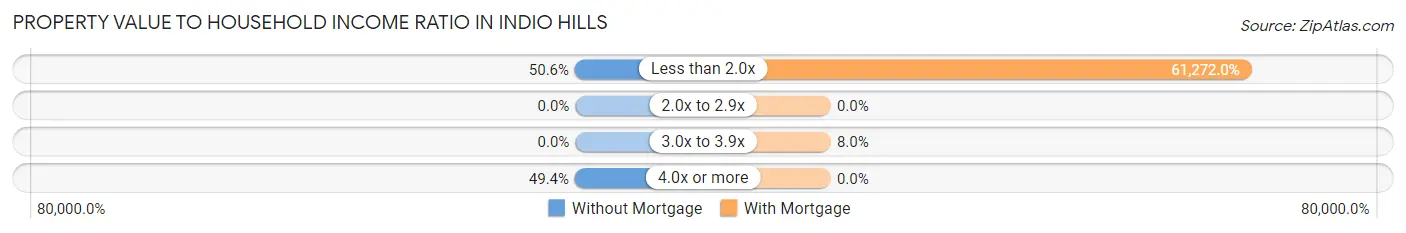
| Value-to-Income Ratio | Without Mortgage | With Mortgage |
| Less than 2.0x | 43 (50.6%) | 45,954 (61,272.0%) |
| 2.0x to 2.9x | 0 (0.0%) | 0 (0.0%) |
| 3.0x to 3.9x | 0 (0.0%) | 6 (8.0%) |
| 4.0x or more | 42 (49.4%) | 0 (0.0%) |
| Total | 85 (100.0%) | 75 (100.0%) |
Real Estate Taxes by Mortgage Status in Indio Hills
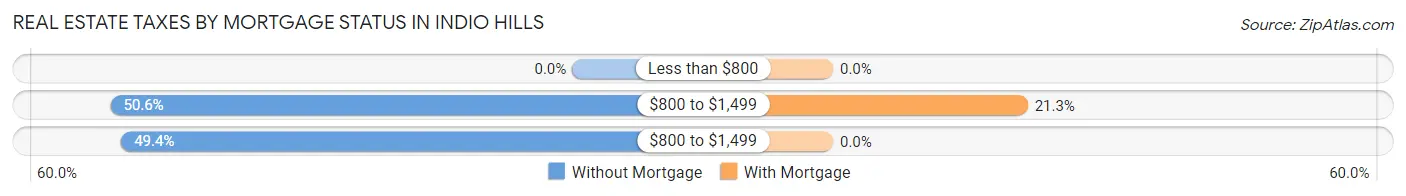
| Property Taxes | Without Mortgage | With Mortgage |
| Less than $800 | 0 (0.0%) | 0 (0.0%) |
| $800 to $1,499 | 43 (50.6%) | 16 (21.3%) |
| $800 to $1,499 | 42 (49.4%) | 0 (0.0%) |
| Total | 85 (100.0%) | 75 (100.0%) |
Health & Disability in Indio Hills
Health Insurance Coverage by Age in Indio Hills
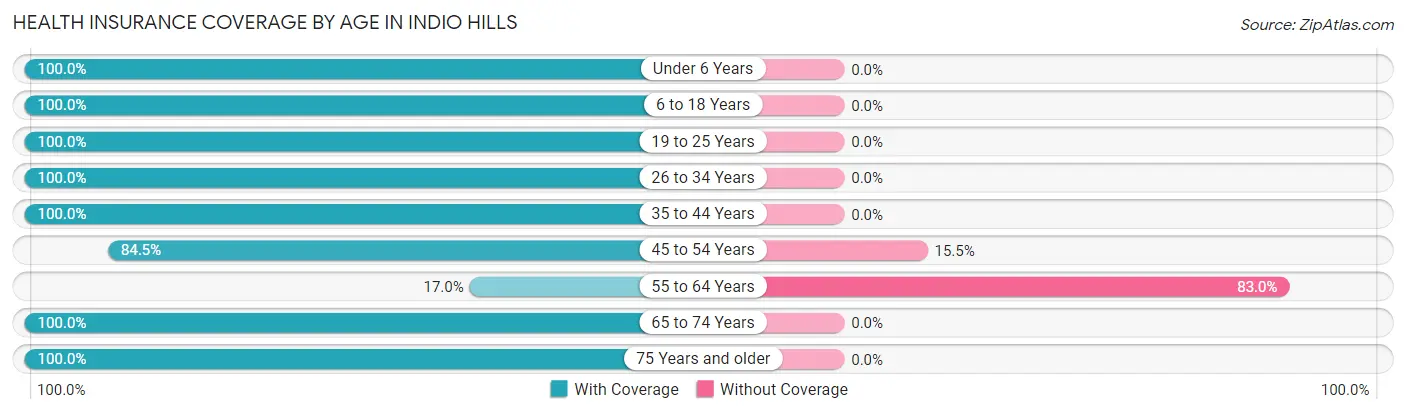
| Age Bracket | With Coverage | Without Coverage |
| Under 6 Years | 97 (100.0%) | 0 (0.0%) |
| 6 to 18 Years | 96 (100.0%) | 0 (0.0%) |
| 19 to 25 Years | 13 (100.0%) | 0 (0.0%) |
| 26 to 34 Years | 34 (100.0%) | 0 (0.0%) |
| 35 to 44 Years | 102 (100.0%) | 0 (0.0%) |
| 45 to 54 Years | 87 (84.5%) | 16 (15.5%) |
| 55 to 64 Years | 8 (17.0%) | 39 (83.0%) |
| 65 to 74 Years | 74 (100.0%) | 0 (0.0%) |
| 75 Years and older | 39 (100.0%) | 0 (0.0%) |
| Total | 550 (90.9%) | 55 (9.1%) |
Health Insurance Coverage by Citizenship Status in Indio Hills
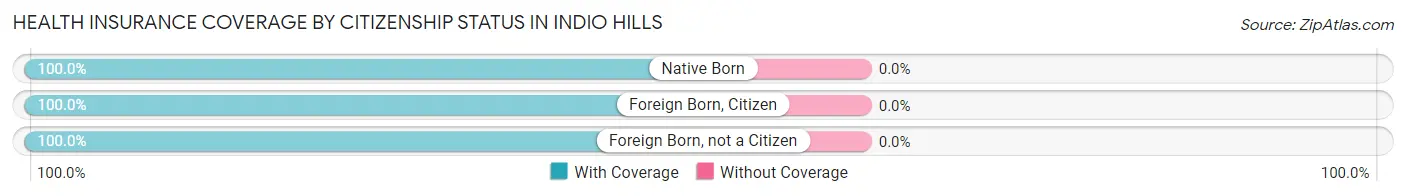
| Citizenship Status | With Coverage | Without Coverage |
| Native Born | 97 (100.0%) | 0 (0.0%) |
| Foreign Born, Citizen | 96 (100.0%) | 0 (0.0%) |
| Foreign Born, not a Citizen | 13 (100.0%) | 0 (0.0%) |
Health Insurance Coverage by Household Income in Indio Hills
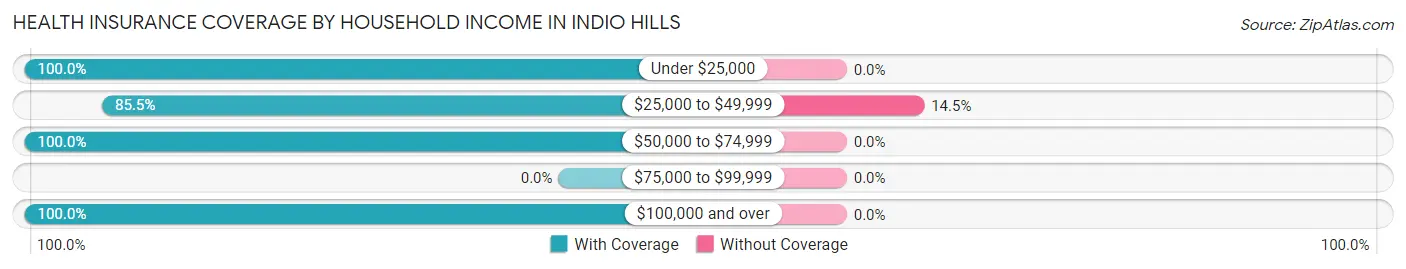
| Household Income | With Coverage | Without Coverage |
| Under $25,000 | 17 (100.0%) | 0 (0.0%) |
| $25,000 to $49,999 | 324 (85.5%) | 55 (14.5%) |
| $50,000 to $74,999 | 32 (100.0%) | 0 (0.0%) |
| $75,000 to $99,999 | 0 (0.0%) | 0 (0.0%) |
| $100,000 and over | 170 (100.0%) | 0 (0.0%) |
Public vs Private Health Insurance Coverage by Age in Indio Hills
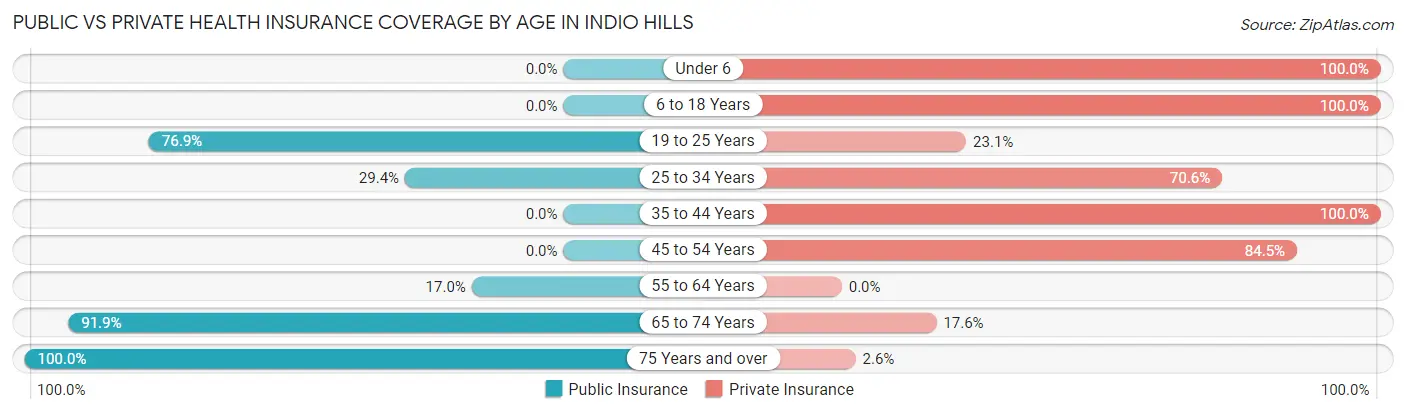
| Age Bracket | Public Insurance | Private Insurance |
| Under 6 | 0 (0.0%) | 97 (100.0%) |
| 6 to 18 Years | 0 (0.0%) | 96 (100.0%) |
| 19 to 25 Years | 10 (76.9%) | 3 (23.1%) |
| 25 to 34 Years | 10 (29.4%) | 24 (70.6%) |
| 35 to 44 Years | 0 (0.0%) | 102 (100.0%) |
| 45 to 54 Years | 0 (0.0%) | 87 (84.5%) |
| 55 to 64 Years | 8 (17.0%) | 0 (0.0%) |
| 65 to 74 Years | 68 (91.9%) | 13 (17.6%) |
| 75 Years and over | 39 (100.0%) | 1 (2.6%) |
| Total | 135 (22.3%) | 423 (69.9%) |
Disability Status by Sex by Age in Indio Hills
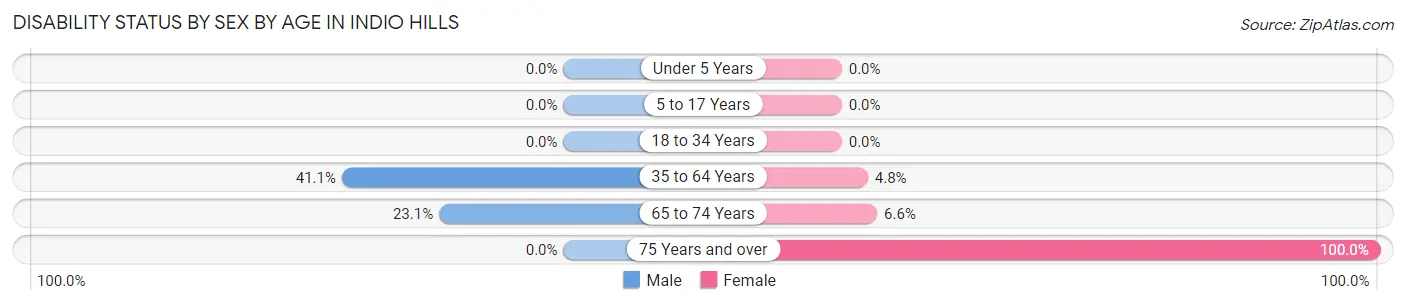
| Age Bracket | Male | Female |
| Under 5 Years | 0 (0.0%) | 0 (0.0%) |
| 5 to 17 Years | 0 (0.0%) | 0 (0.0%) |
| 18 to 34 Years | 0 (0.0%) | 0 (0.0%) |
| 35 to 64 Years | 44 (41.1%) | 7 (4.8%) |
| 65 to 74 Years | 3 (23.1%) | 4 (6.6%) |
| 75 Years and over | 0 (0.0%) | 39 (100.0%) |
Disability Class by Sex by Age in Indio Hills
Disability Class: Hearing Difficulty
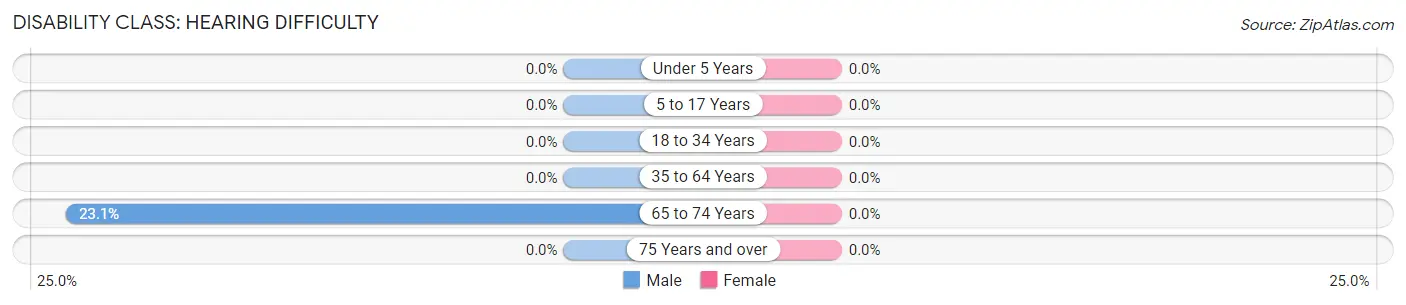
| Age Bracket | Male | Female |
| Under 5 Years | 0 (0.0%) | 0 (0.0%) |
| 5 to 17 Years | 0 (0.0%) | 0 (0.0%) |
| 18 to 34 Years | 0 (0.0%) | 0 (0.0%) |
| 35 to 64 Years | 0 (0.0%) | 0 (0.0%) |
| 65 to 74 Years | 3 (23.1%) | 0 (0.0%) |
| 75 Years and over | 0 (0.0%) | 0 (0.0%) |
Disability Class: Vision Difficulty
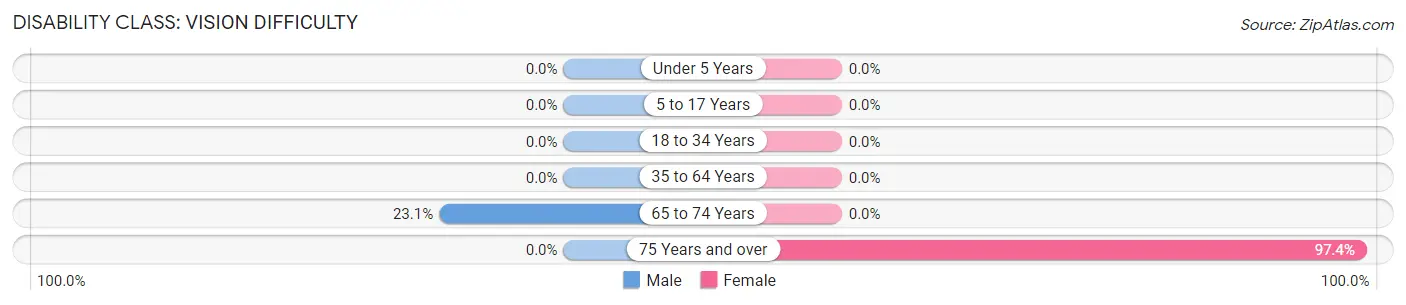
| Age Bracket | Male | Female |
| Under 5 Years | 0 (0.0%) | 0 (0.0%) |
| 5 to 17 Years | 0 (0.0%) | 0 (0.0%) |
| 18 to 34 Years | 0 (0.0%) | 0 (0.0%) |
| 35 to 64 Years | 0 (0.0%) | 0 (0.0%) |
| 65 to 74 Years | 3 (23.1%) | 0 (0.0%) |
| 75 Years and over | 0 (0.0%) | 38 (97.4%) |
Disability Class: Cognitive Difficulty
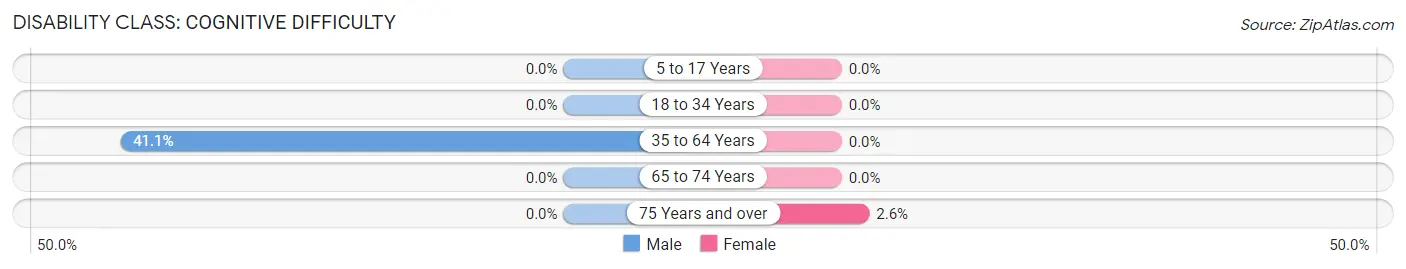
| Age Bracket | Male | Female |
| 5 to 17 Years | 0 (0.0%) | 0 (0.0%) |
| 18 to 34 Years | 0 (0.0%) | 0 (0.0%) |
| 35 to 64 Years | 44 (41.1%) | 0 (0.0%) |
| 65 to 74 Years | 0 (0.0%) | 0 (0.0%) |
| 75 Years and over | 0 (0.0%) | 1 (2.6%) |
Disability Class: Ambulatory Difficulty
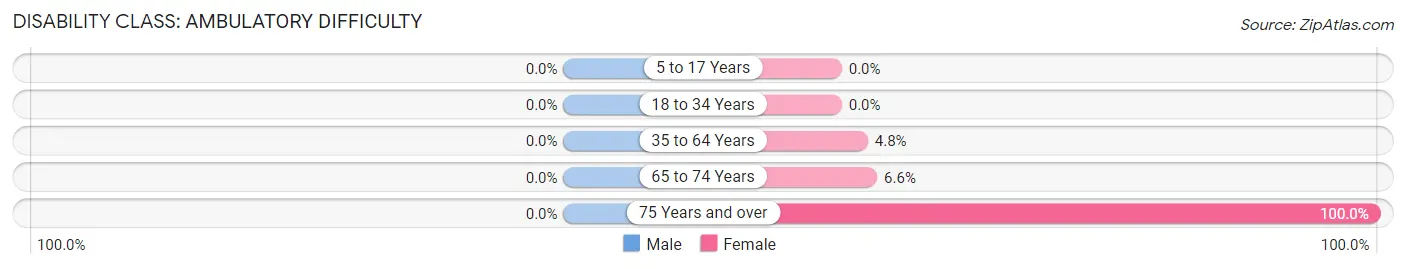
| Age Bracket | Male | Female |
| 5 to 17 Years | 0 (0.0%) | 0 (0.0%) |
| 18 to 34 Years | 0 (0.0%) | 0 (0.0%) |
| 35 to 64 Years | 0 (0.0%) | 7 (4.8%) |
| 65 to 74 Years | 0 (0.0%) | 4 (6.6%) |
| 75 Years and over | 0 (0.0%) | 39 (100.0%) |
Disability Class: Self-Care Difficulty
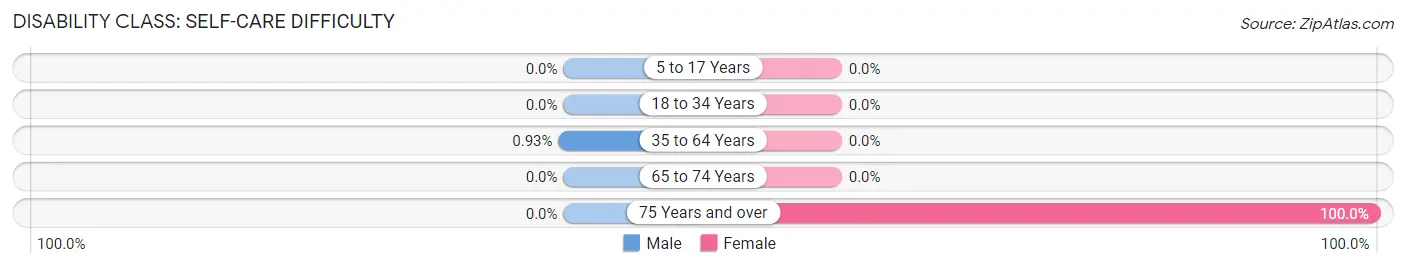
| Age Bracket | Male | Female |
| 5 to 17 Years | 0 (0.0%) | 0 (0.0%) |
| 18 to 34 Years | 0 (0.0%) | 0 (0.0%) |
| 35 to 64 Years | 1 (0.9%) | 0 (0.0%) |
| 65 to 74 Years | 0 (0.0%) | 0 (0.0%) |
| 75 Years and over | 0 (0.0%) | 39 (100.0%) |
Technology Access in Indio Hills
Computing Device Access in Indio Hills
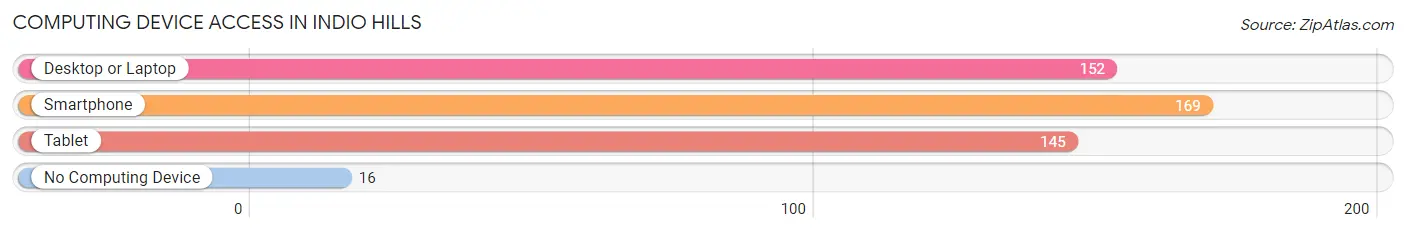
| Device Type | # Households | % Households |
| Desktop or Laptop | 152 | 82.2% |
| Smartphone | 169 | 91.3% |
| Tablet | 145 | 78.4% |
| No Computing Device | 16 | 8.6% |
| Total | 185 | 100.0% |
Internet Access in Indio Hills
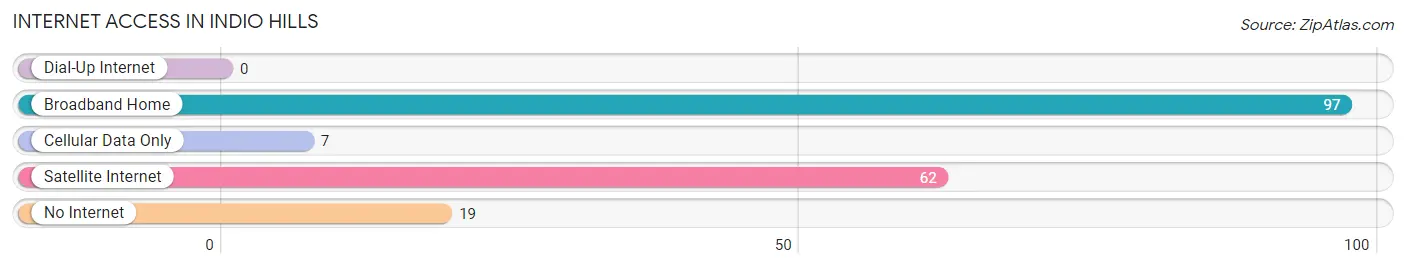
| Internet Type | # Households | % Households |
| Dial-Up Internet | 0 | 0.0% |
| Broadband Home | 97 | 52.4% |
| Cellular Data Only | 7 | 3.8% |
| Satellite Internet | 62 | 33.5% |
| No Internet | 19 | 10.3% |
| Total | 185 | 100.0% |
Indio Hills Summary
Indio Hills is a small unincorporated community located in Riverside County, California. It is situated in the Coachella Valley, approximately 25 miles east of Palm Springs. The community is surrounded by the Santa Rosa and San Jacinto Mountains, and is home to a population of approximately 1,000 people.
History
Indio Hills was originally inhabited by the Cahuilla Indians, who were the original inhabitants of the Coachella Valley. The Cahuilla Indians were hunter-gatherers who lived in the area for thousands of years before the arrival of Europeans. The first Europeans to settle in the area were the Spanish, who established the Mission San Luis Rey de Francia in 1798. The mission was abandoned in 1834, and the area was later settled by American settlers in the late 19th century.
The first post office in Indio Hills was established in 1891, and the community was officially incorporated in 1893. The town was named after the nearby Indio Mountains, which were named by the Spanish explorers who first visited the area.
Geography
Indio Hills is located in the Coachella Valley, which is a desert region in southeastern California. The community is situated at an elevation of 1,000 feet, and is surrounded by the Santa Rosa and San Jacinto Mountains. The climate in the area is hot and dry, with temperatures ranging from the mid-90s in the summer to the mid-60s in the winter.
The community is located approximately 25 miles east of Palm Springs, and is accessible via Interstate 10. The nearest major airport is Palm Springs International Airport, which is located approximately 30 miles away.
Economy
The economy of Indio Hills is largely based on agriculture and tourism. The area is home to a number of farms and ranches, which produce a variety of crops including dates, citrus fruits, and vegetables. The area is also home to a number of tourist attractions, including the nearby Joshua Tree National Park and the Salton Sea.
Demographics
As of the 2010 census, the population of Indio Hills was 1,000. The racial makeup of the community was 75.2% White, 0.7% African American, 0.7% Native American, 0.7% Asian, 0.3% Pacific Islander, and 21.1% from other races. The median household income in the area was $37,500, and the median age was 37.
Conclusion
Indio Hills is a small unincorporated community located in Riverside County, California. It is situated in the Coachella Valley, approximately 25 miles east of Palm Springs. The community is surrounded by the Santa Rosa and San Jacinto Mountains, and is home to a population of approximately 1,000 people. The economy of Indio Hills is largely based on agriculture and tourism, and the area is home to a number of farms and ranches, as well as tourist attractions. The population of Indio Hills is largely White, with a significant minority population.
Common Questions
What is Per Capita Income in Indio Hills?
Per Capita income in Indio Hills is $22,788.
What is the Median Family Income in Indio Hills?
Median Family Income in Indio Hills is $46,217.
What is the Median Household income in Indio Hills?
Median Household Income in Indio Hills is $48,601.
What is Inequality or Gini Index in Indio Hills?
Inequality or Gini Index in Indio Hills is 0.33.
What is the Total Population of Indio Hills?
Total Population of Indio Hills is 605.
What is the Total Male Population of Indio Hills?
Total Male Population of Indio Hills is 158.
What is the Total Female Population of Indio Hills?
Total Female Population of Indio Hills is 447.
What is the Ratio of Males per 100 Females in Indio Hills?
There are 35.35 Males per 100 Females in Indio Hills.
What is the Ratio of Females per 100 Males in Indio Hills?
There are 282.91 Females per 100 Males in Indio Hills.
What is the Median Population Age in Indio Hills?
Median Population Age in Indio Hills is 42.3 Years.
What is the Average Family Size in Indio Hills
Average Family Size in Indio Hills is 3.3 People.
What is the Average Household Size in Indio Hills
Average Household Size in Indio Hills is 3.2 People.
How Large is the Labor Force in Indio Hills?
There are 280 People in the Labor Forcein in Indio Hills.
What is the Percentage of People in the Labor Force in Indio Hills?
67.8% of People are in the Labor Force in Indio Hills.
What is the Unemployment Rate in Indio Hills?
Unemployment Rate in Indio Hills is 30.7%.