California Pines, CA Map & Demographics
California Pines Map
California Pines Overview
$31,076
PER CAPITA INCOME
$75,795
AVG FAMILY INCOME
$47,045
AVG HOUSEHOLD INCOME
8.1%
WAGE / INCOME GAP [ % ]
91.9¢/ $1
WAGE / INCOME GAP [ $ ]
0.31
INEQUALITY / GINI INDEX
272
TOTAL POPULATION
142
MALE POPULATION
130
FEMALE POPULATION
109.23
MALES / 100 FEMALES
91.55
FEMALES / 100 MALES
54.6
MEDIAN AGE
2.7
AVG FAMILY SIZE
2.0
AVG HOUSEHOLD SIZE
131
LABOR FORCE [ PEOPLE ]
52.0%
PERCENT IN LABOR FORCE
6.9%
UNEMPLOYMENT RATE
Income in California Pines
Income Overview in California Pines
Per Capita Income in California Pines is $31,076, while median incomes of families and households are $75,795 and $47,045 respectively.
| Characteristic | Number | Measure |
| Per Capita Income | 272 | $31,076 |
| Median Family Income | 65 | $75,795 |
| Mean Family Income | 65 | $77,420 |
| Median Household Income | 134 | $47,045 |
| Mean Household Income | 134 | $56,123 |
| Income Deficit | 65 | $0 |
| Wage / Income Gap (%) | 272 | 8.15% |
| Wage / Income Gap ($) | 272 | 91.85¢ per $1 |
| Gini / Inequality Index | 272 | 0.31 |
Earnings by Sex in California Pines
Average Earnings in California Pines are $32,102, $32,273 for men and $29,643 for women, a difference of 8.2%.
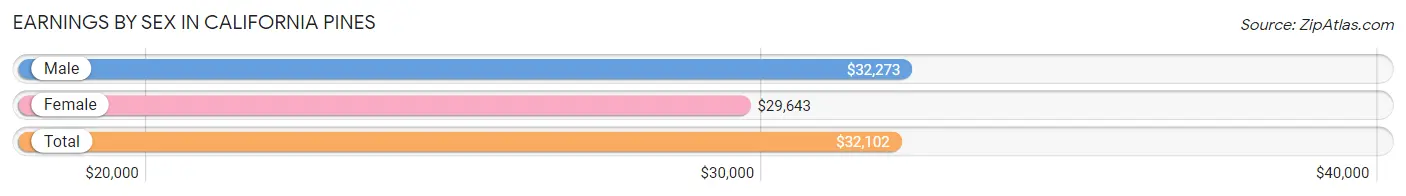
| Sex | Number | Average Earnings |
| Male | 80 (58.8%) | $32,273 |
| Female | 56 (41.2%) | $29,643 |
| Total | 136 (100.0%) | $32,102 |
Earnings by Sex by Income Bracket in California Pines
The most common earnings brackets in California Pines are $30,000 to $34,999 for men (44 | 55.0%) and $25,000 to $29,999 for women (21 | 37.5%).
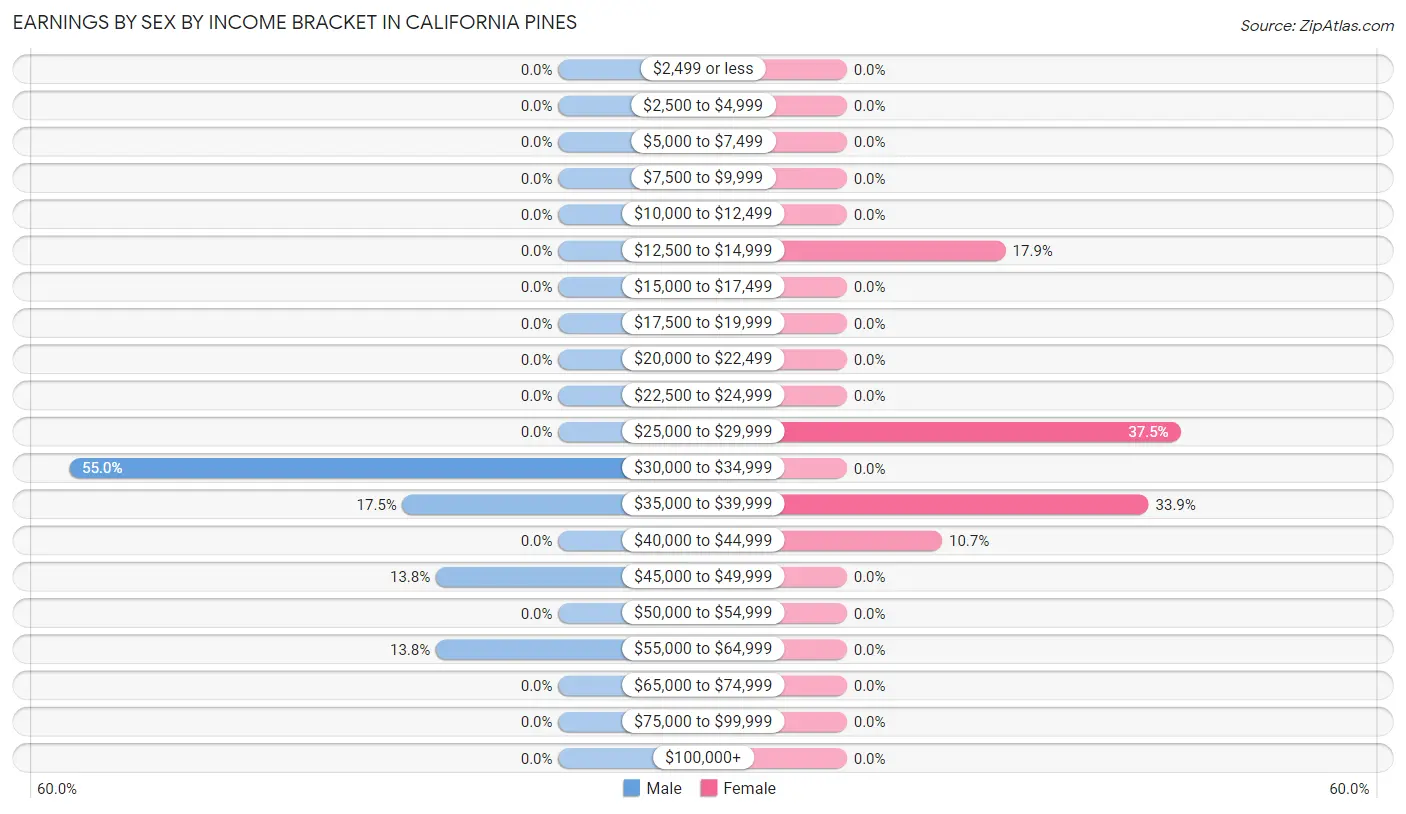
| Income | Male | Female |
| $2,499 or less | 0 (0.0%) | 0 (0.0%) |
| $2,500 to $4,999 | 0 (0.0%) | 0 (0.0%) |
| $5,000 to $7,499 | 0 (0.0%) | 0 (0.0%) |
| $7,500 to $9,999 | 0 (0.0%) | 0 (0.0%) |
| $10,000 to $12,499 | 0 (0.0%) | 0 (0.0%) |
| $12,500 to $14,999 | 0 (0.0%) | 10 (17.9%) |
| $15,000 to $17,499 | 0 (0.0%) | 0 (0.0%) |
| $17,500 to $19,999 | 0 (0.0%) | 0 (0.0%) |
| $20,000 to $22,499 | 0 (0.0%) | 0 (0.0%) |
| $22,500 to $24,999 | 0 (0.0%) | 0 (0.0%) |
| $25,000 to $29,999 | 0 (0.0%) | 21 (37.5%) |
| $30,000 to $34,999 | 44 (55.0%) | 0 (0.0%) |
| $35,000 to $39,999 | 14 (17.5%) | 19 (33.9%) |
| $40,000 to $44,999 | 0 (0.0%) | 6 (10.7%) |
| $45,000 to $49,999 | 11 (13.8%) | 0 (0.0%) |
| $50,000 to $54,999 | 0 (0.0%) | 0 (0.0%) |
| $55,000 to $64,999 | 11 (13.8%) | 0 (0.0%) |
| $65,000 to $74,999 | 0 (0.0%) | 0 (0.0%) |
| $75,000 to $99,999 | 0 (0.0%) | 0 (0.0%) |
| $100,000+ | 0 (0.0%) | 0 (0.0%) |
| Total | 80 (100.0%) | 56 (100.0%) |
Earnings by Sex by Educational Attainment in California Pines
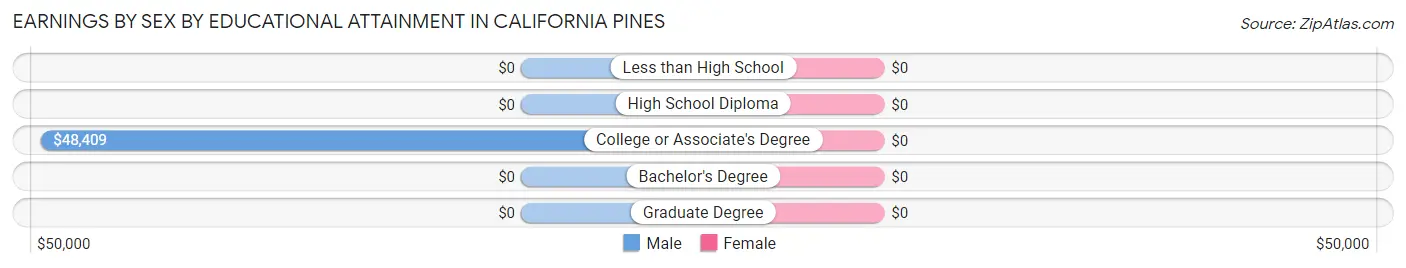
| Educational Attainment | Male Income | Female Income |
| Less than High School | - | - |
| High School Diploma | - | - |
| College or Associate's Degree | $48,409 | $0 |
| Bachelor's Degree | - | - |
| Graduate Degree | - | - |
| Total | $32,273 | $29,643 |
Family Income in California Pines
Family Income Brackets in California Pines
According to the California Pines family income data, there are 36 families falling into the $75,000 to $99,999 income range, which is the most common income bracket and makes up 55.4% of all families.
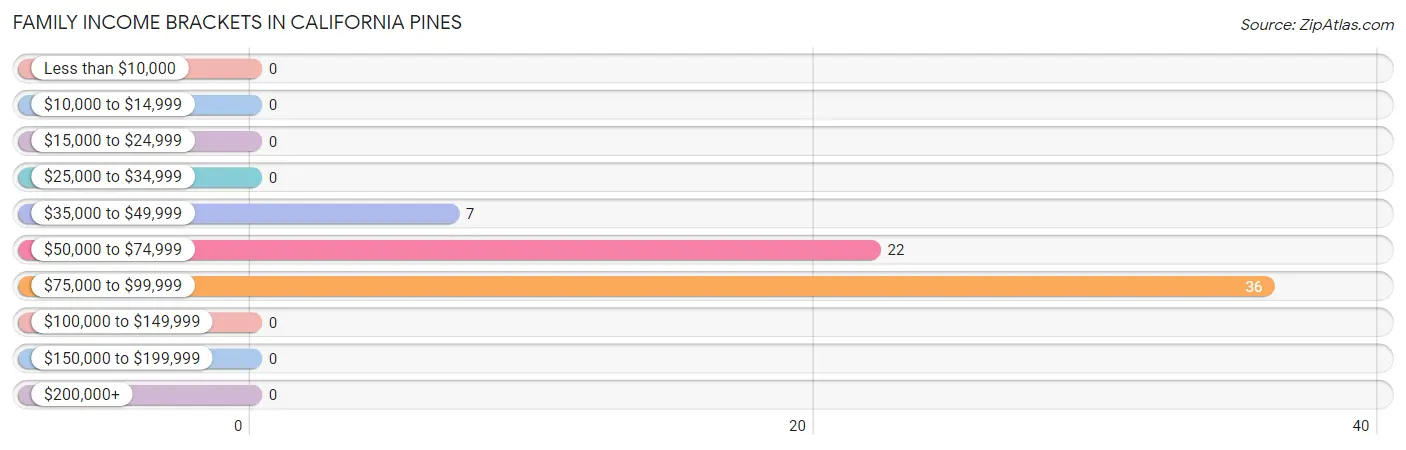
| Income Bracket | # Families | % Families |
| Less than $10,000 | 0 | 0.0% |
| $10,000 to $14,999 | 0 | 0.0% |
| $15,000 to $24,999 | 0 | 0.0% |
| $25,000 to $34,999 | 0 | 0.0% |
| $35,000 to $49,999 | 7 | 10.8% |
| $50,000 to $74,999 | 22 | 33.8% |
| $75,000 to $99,999 | 36 | 55.4% |
| $100,000 to $149,999 | 0 | 0.0% |
| $150,000 to $199,999 | 0 | 0.0% |
| $200,000+ | 0 | 0.0% |
Family Income by Famaliy Size in California Pines
2-person families (46 | 70.8%) account for the highest median family income in California Pines with $66,429 per family, while 2-person families (46 | 70.8%) have the highest median income of $33,214 per family member.
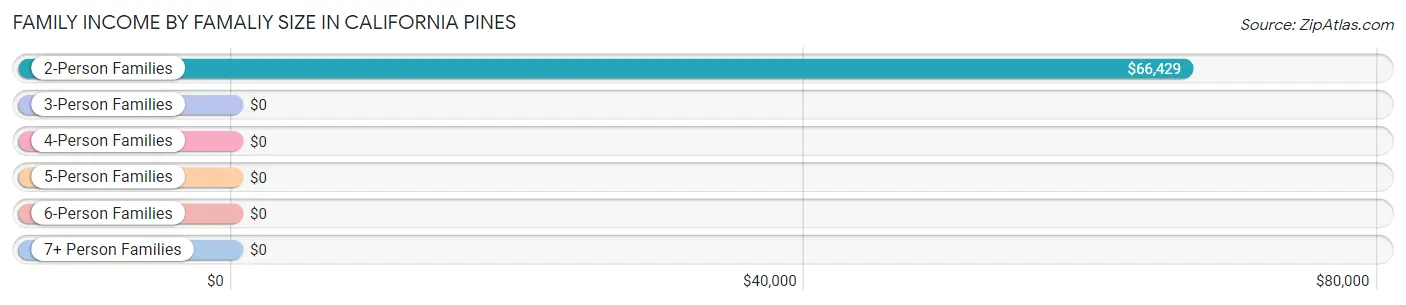
| Income Bracket | # Families | Median Income |
| 2-Person Families | 46 (70.8%) | $66,429 |
| 3-Person Families | 19 (29.2%) | $0 |
| 4-Person Families | 0 (0.0%) | $0 |
| 5-Person Families | 0 (0.0%) | $0 |
| 6-Person Families | 0 (0.0%) | $0 |
| 7+ Person Families | 0 (0.0%) | $0 |
| Total | 65 (100.0%) | $75,795 |
Family Income by Number of Earners in California Pines
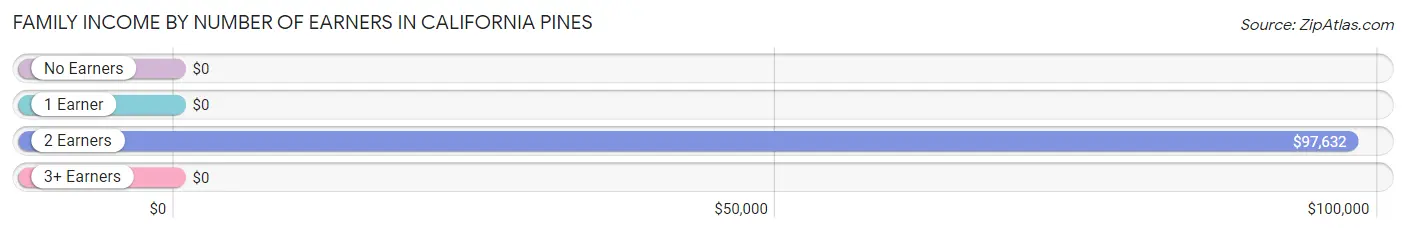
| Number of Earners | # Families | Median Income |
| No Earners | 8 (12.3%) | $0 |
| 1 Earner | 21 (32.3%) | $0 |
| 2 Earners | 36 (55.4%) | $97,632 |
| 3+ Earners | 0 (0.0%) | $0 |
| Total | 65 (100.0%) | $75,795 |
Household Income in California Pines
Household Income Brackets in California Pines
With 39 households falling in the category, the $35,000 to $49,999 income range is the most frequent in California Pines, accounting for 29.1% of all households.
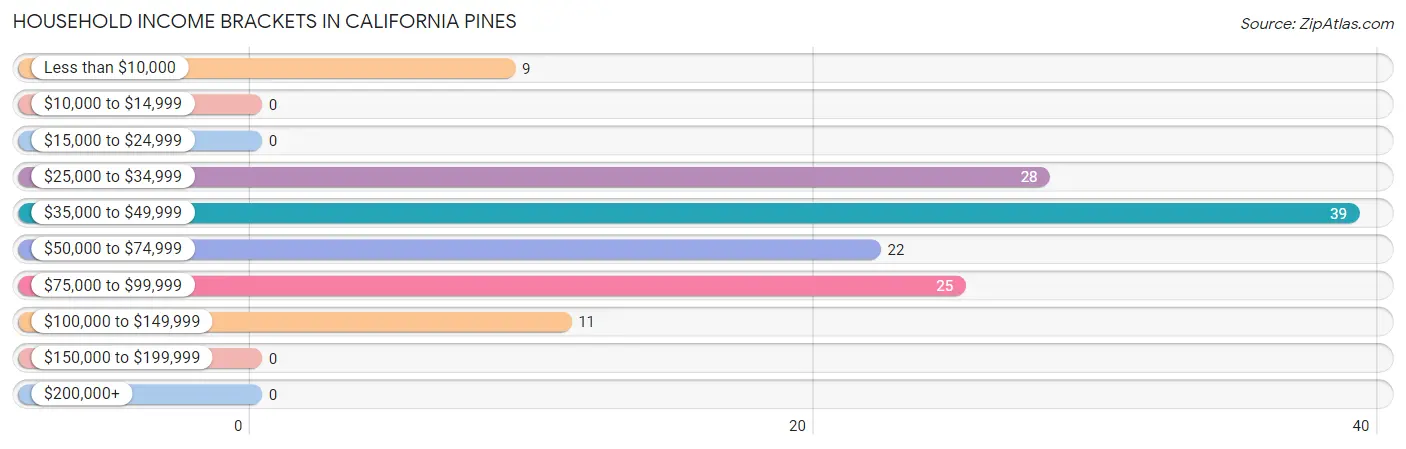
| Income Bracket | # Households | % Households |
| Less than $10,000 | 9 | 6.7% |
| $10,000 to $14,999 | 0 | 0.0% |
| $15,000 to $24,999 | 0 | 0.0% |
| $25,000 to $34,999 | 28 | 20.9% |
| $35,000 to $49,999 | 39 | 29.1% |
| $50,000 to $74,999 | 22 | 16.4% |
| $75,000 to $99,999 | 25 | 18.7% |
| $100,000 to $149,999 | 11 | 8.2% |
| $150,000 to $199,999 | 0 | 0.0% |
| $200,000+ | 0 | 0.0% |
Household Income by Householder Age in California Pines
The median household income in California Pines is $47,045, with the highest median household income of $98,882 found in the 25 to 44 years age bracket for the primary householder. A total of 39 households (29.1%) fall into this category.
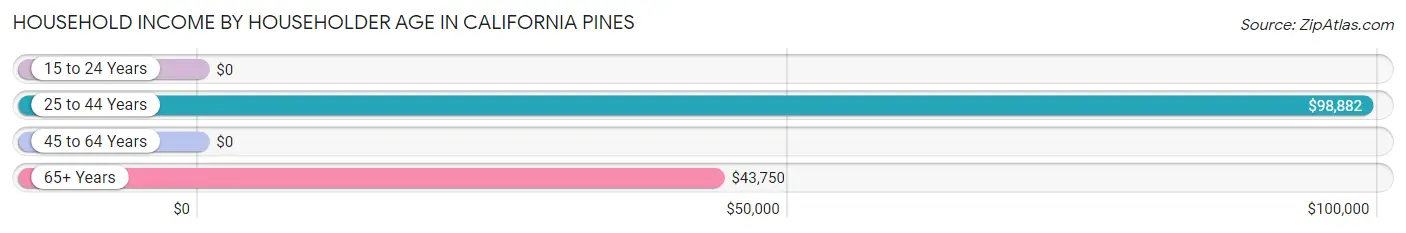
| Income Bracket | # Households | Median Income |
| 15 to 24 Years | 0 (0.0%) | $0 |
| 25 to 44 Years | 39 (29.1%) | $98,882 |
| 45 to 64 Years | 17 (12.7%) | $0 |
| 65+ Years | 78 (58.2%) | $43,750 |
| Total | 134 (100.0%) | $47,045 |
Poverty in California Pines
Income Below Poverty by Sex and Age in California Pines
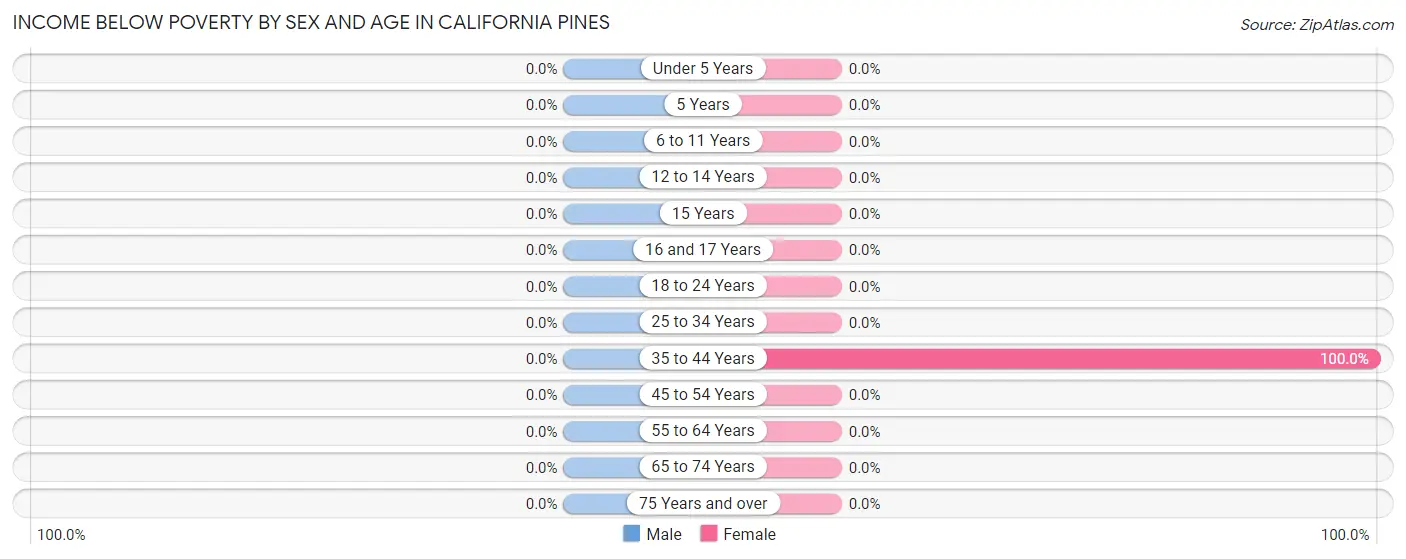
| Age Bracket | Male | Female |
| Under 5 Years | 0 (0.0%) | 0 (0.0%) |
| 5 Years | 0 (0.0%) | 0 (0.0%) |
| 6 to 11 Years | 0 (0.0%) | 0 (0.0%) |
| 12 to 14 Years | 0 (0.0%) | 0 (0.0%) |
| 15 Years | 0 (0.0%) | 0 (0.0%) |
| 16 and 17 Years | 0 (0.0%) | 0 (0.0%) |
| 18 to 24 Years | 0 (0.0%) | 0 (0.0%) |
| 25 to 34 Years | 0 (0.0%) | 0 (0.0%) |
| 35 to 44 Years | 0 (0.0%) | 9 (100.0%) |
| 45 to 54 Years | 0 (0.0%) | 0 (0.0%) |
| 55 to 64 Years | 0 (0.0%) | 0 (0.0%) |
| 65 to 74 Years | 0 (0.0%) | 0 (0.0%) |
| 75 Years and over | 0 (0.0%) | 0 (0.0%) |
| Total | 0 (0.0%) | 9 (6.9%) |
Income Above Poverty by Sex and Age in California Pines
According to the poverty statistics in California Pines, males aged under 5 years and females aged 25 to 34 years are the age groups that are most secure financially, with 100.0% of males and 100.0% of females in these age groups living above the poverty line.
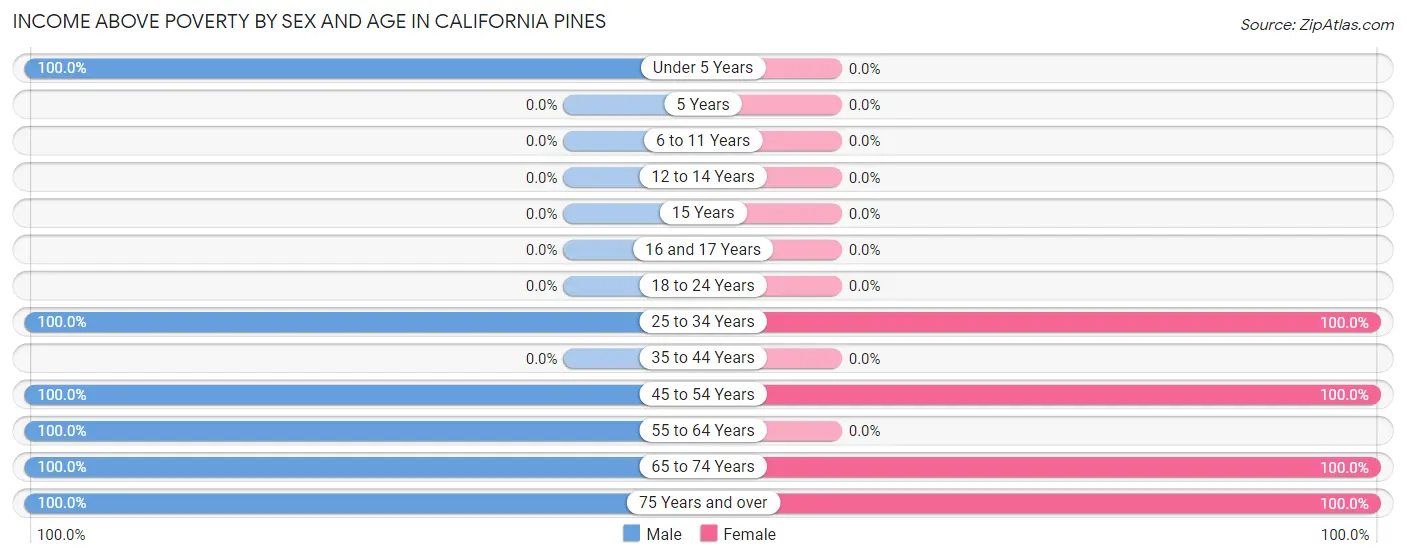
| Age Bracket | Male | Female |
| Under 5 Years | 20 (100.0%) | 0 (0.0%) |
| 5 Years | 0 (0.0%) | 0 (0.0%) |
| 6 to 11 Years | 0 (0.0%) | 0 (0.0%) |
| 12 to 14 Years | 0 (0.0%) | 0 (0.0%) |
| 15 Years | 0 (0.0%) | 0 (0.0%) |
| 16 and 17 Years | 0 (0.0%) | 0 (0.0%) |
| 18 to 24 Years | 0 (0.0%) | 0 (0.0%) |
| 25 to 34 Years | 52 (100.0%) | 40 (100.0%) |
| 35 to 44 Years | 0 (0.0%) | 0 (0.0%) |
| 45 to 54 Years | 14 (100.0%) | 10 (100.0%) |
| 55 to 64 Years | 17 (100.0%) | 0 (0.0%) |
| 65 to 74 Years | 11 (100.0%) | 39 (100.0%) |
| 75 Years and over | 28 (100.0%) | 32 (100.0%) |
| Total | 142 (100.0%) | 121 (93.1%) |
Income Below Poverty Among Married-Couple Families in California Pines
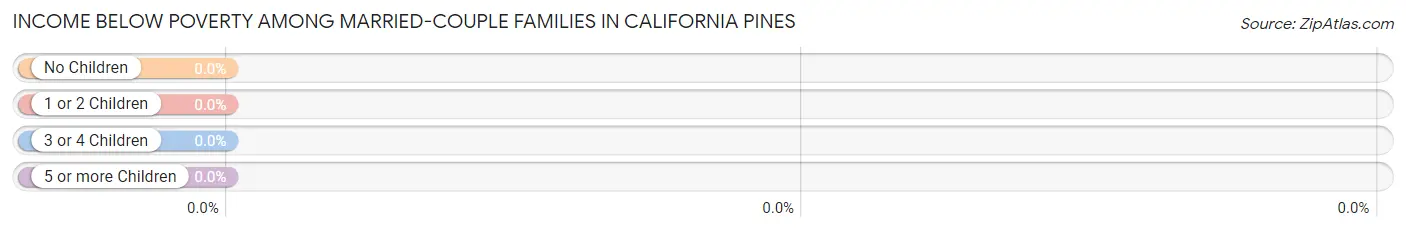
| Children | Above Poverty | Below Poverty |
| No Children | 40 (100.0%) | 0 (0.0%) |
| 1 or 2 Children | 19 (100.0%) | 0 (0.0%) |
| 3 or 4 Children | 0 (0.0%) | 0 (0.0%) |
| 5 or more Children | 0 (0.0%) | 0 (0.0%) |
| Total | 59 (100.0%) | 0 (0.0%) |
Income Below Poverty Among Single-Parent Households in California Pines
| Children | Single Father | Single Mother |
| No Children | 0 (0.0%) | 0 (0.0%) |
| 1 or 2 Children | 0 (0.0%) | 0 (0.0%) |
| 3 or 4 Children | 0 (0.0%) | 0 (0.0%) |
| 5 or more Children | 0 (0.0%) | 0 (0.0%) |
| Total | 0 (0.0%) | 0 (0.0%) |
Income Below Poverty Among Married-Couple vs Single-Parent Households in California Pines
| Children | Married-Couple Families | Single-Parent Households |
| No Children | 0 (0.0%) | 0 (0.0%) |
| 1 or 2 Children | 0 (0.0%) | 0 (0.0%) |
| 3 or 4 Children | 0 (0.0%) | 0 (0.0%) |
| 5 or more Children | 0 (0.0%) | 0 (0.0%) |
| Total | 0 (0.0%) | 0 (0.0%) |
Race in California Pines
The most populous races in California Pines are White / Caucasian (224 | 82.4%), Native / Alaskan (21 | 7.7%), and Hispanic or Latino (18 | 6.6%).
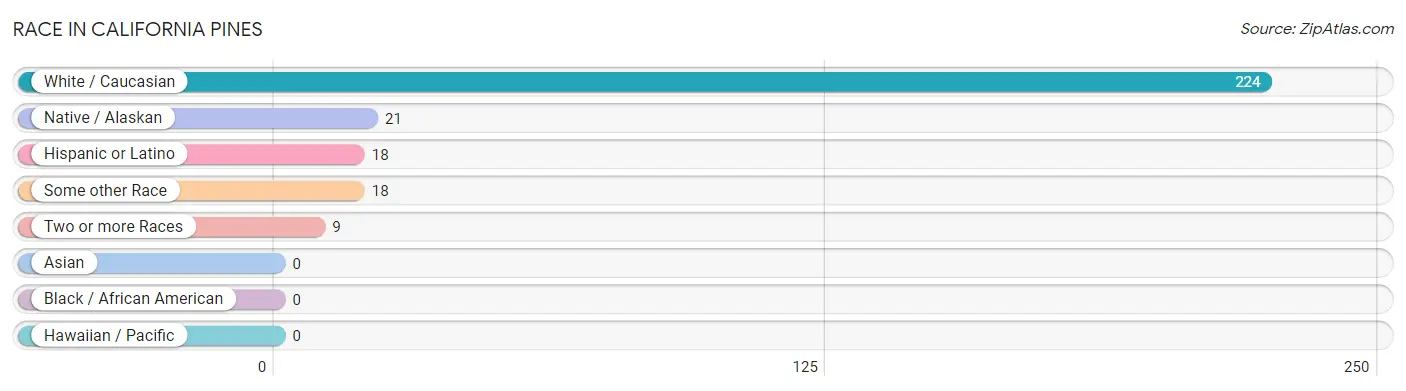
| Race | # Population | % Population |
| Asian | 0 | 0.0% |
| Black / African American | 0 | 0.0% |
| Hawaiian / Pacific | 0 | 0.0% |
| Hispanic or Latino | 18 | 6.6% |
| Native / Alaskan | 21 | 7.7% |
| White / Caucasian | 224 | 82.4% |
| Two or more Races | 9 | 3.3% |
| Some other Race | 18 | 6.6% |
| Total | 272 | 100.0% |
Ancestry in California Pines
The most populous ancestries reported in California Pines are English (92 | 33.8%), Irish (49 | 18.0%), German (33 | 12.1%), Danish (28 | 10.3%), and French (21 | 7.7%), together accounting for 82.0% of all California Pines residents.
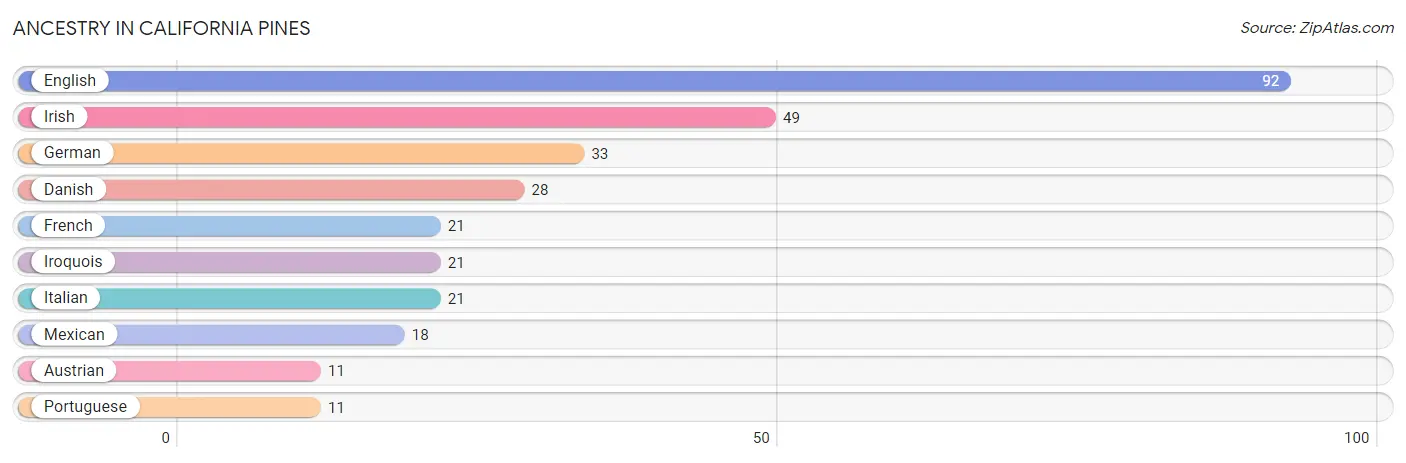
| Ancestry | # Population | % Population |
| Austrian | 11 | 4.0% |
| Danish | 28 | 10.3% |
| English | 92 | 33.8% |
| French | 21 | 7.7% |
| German | 33 | 12.1% |
| Irish | 49 | 18.0% |
| Iroquois | 21 | 7.7% |
| Italian | 21 | 7.7% |
| Mexican | 18 | 6.6% |
| Portuguese | 11 | 4.0% | View All 10 Rows |
Immigrants in California Pines
The most numerous immigrant groups reported in California Pines came from Asia (9 | 3.3%), Iran (9 | 3.3%), and South Central Asia (9 | 3.3%), together accounting for 9.9% of all California Pines residents.
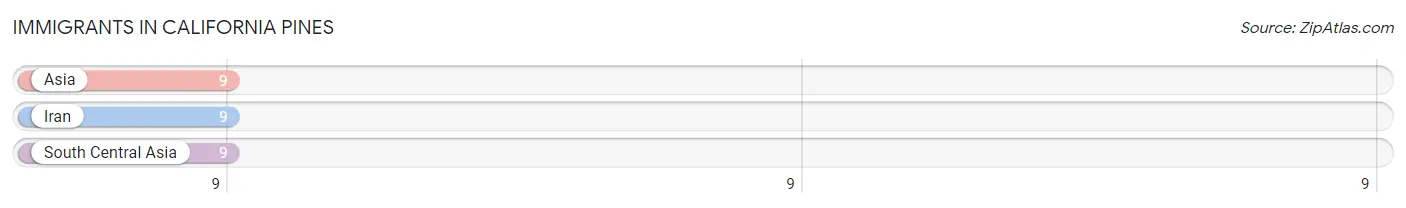
| Immigration Origin | # Population | % Population |
| Asia | 9 | 3.3% |
| Iran | 9 | 3.3% |
| South Central Asia | 9 | 3.3% | View All 3 Rows |
Sex and Age in California Pines
Sex and Age in California Pines
The most populous age groups in California Pines are 25 to 29 Years (30 | 21.1%) for men and 75 to 79 Years (26 | 20.0%) for women.
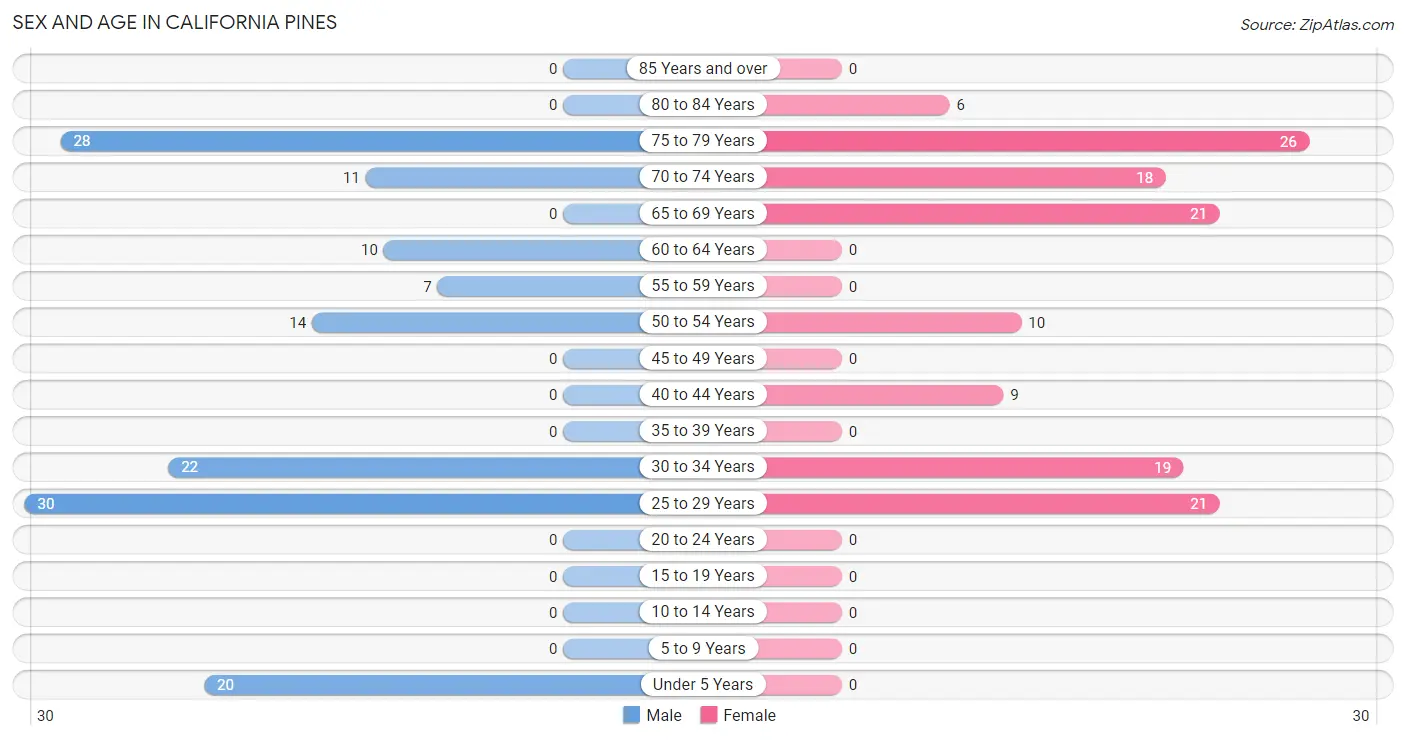
| Age Bracket | Male | Female |
| Under 5 Years | 20 (14.1%) | 0 (0.0%) |
| 5 to 9 Years | 0 (0.0%) | 0 (0.0%) |
| 10 to 14 Years | 0 (0.0%) | 0 (0.0%) |
| 15 to 19 Years | 0 (0.0%) | 0 (0.0%) |
| 20 to 24 Years | 0 (0.0%) | 0 (0.0%) |
| 25 to 29 Years | 30 (21.1%) | 21 (16.2%) |
| 30 to 34 Years | 22 (15.5%) | 19 (14.6%) |
| 35 to 39 Years | 0 (0.0%) | 0 (0.0%) |
| 40 to 44 Years | 0 (0.0%) | 9 (6.9%) |
| 45 to 49 Years | 0 (0.0%) | 0 (0.0%) |
| 50 to 54 Years | 14 (9.9%) | 10 (7.7%) |
| 55 to 59 Years | 7 (4.9%) | 0 (0.0%) |
| 60 to 64 Years | 10 (7.0%) | 0 (0.0%) |
| 65 to 69 Years | 0 (0.0%) | 21 (16.2%) |
| 70 to 74 Years | 11 (7.7%) | 18 (13.9%) |
| 75 to 79 Years | 28 (19.7%) | 26 (20.0%) |
| 80 to 84 Years | 0 (0.0%) | 6 (4.6%) |
| 85 Years and over | 0 (0.0%) | 0 (0.0%) |
| Total | 142 (100.0%) | 130 (100.0%) |
Families and Households in California Pines
Median Family Size in California Pines
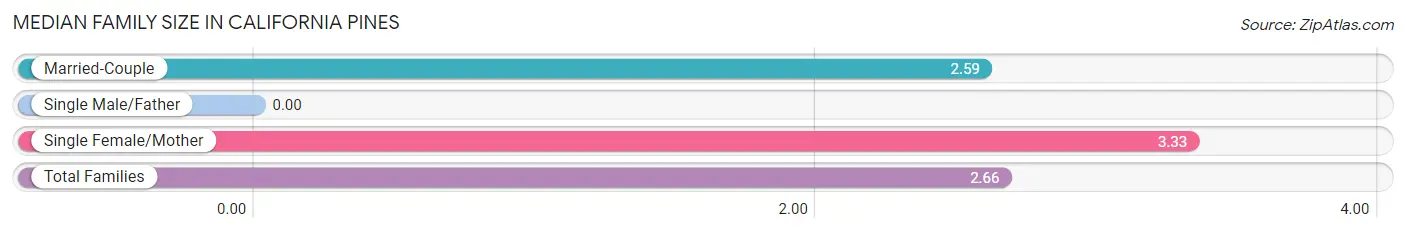
| Family Type | # Families | Family Size |
| Married-Couple | 59 (90.8%) | 2.59 |
| Single Male/Father | 0 (0.0%) | - |
| Single Female/Mother | 6 (9.2%) | 3.33 |
| Total Families | 65 (100.0%) | 2.66 |
Median Household Size in California Pines
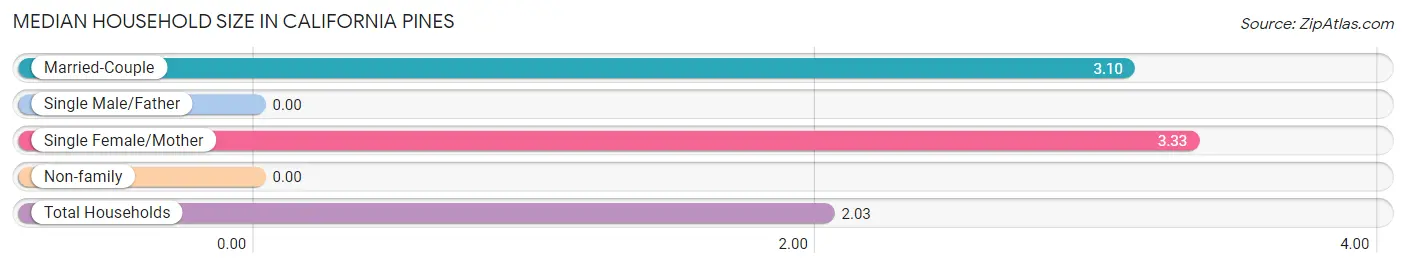
| Household Type | # Households | Household Size |
| Married-Couple | 59 (44.0%) | 3.10 |
| Single Male/Father | 0 (0.0%) | - |
| Single Female/Mother | 6 (4.5%) | 3.33 |
| Non-family | 69 (51.5%) | - |
| Total Households | 134 (100.0%) | 2.03 |
Household Size by Marriage Status in California Pines
Out of a total of 134 households in California Pines, 65 (48.5%) are family households, while 69 (51.5%) are nonfamily households. The most numerous type of family households are 2-person households, comprising 35, and the most common type of nonfamily households are 1-person households, comprising 69.
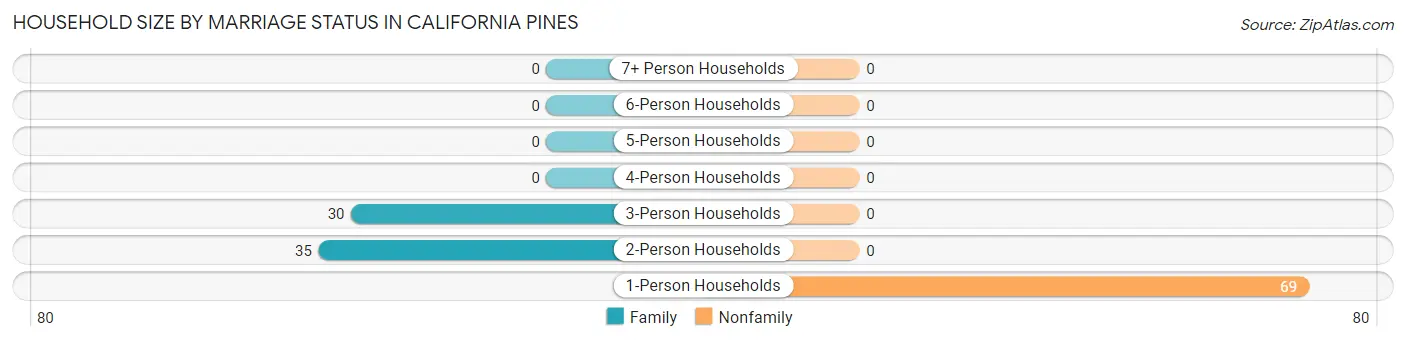
| Household Size | Family Households | Nonfamily Households |
| 1-Person Households | - | 69 (51.5%) |
| 2-Person Households | 35 (26.1%) | 0 (0.0%) |
| 3-Person Households | 30 (22.4%) | 0 (0.0%) |
| 4-Person Households | 0 (0.0%) | 0 (0.0%) |
| 5-Person Households | 0 (0.0%) | 0 (0.0%) |
| 6-Person Households | 0 (0.0%) | 0 (0.0%) |
| 7+ Person Households | 0 (0.0%) | 0 (0.0%) |
| Total | 65 (48.5%) | 69 (51.5%) |
Female Fertility in California Pines
Fertility by Age in California Pines
Average fertility rate in California Pines is 388.0 births per 1,000 women. Women in the age bracket of 20 to 34 years have the highest fertility rate with 475.0 births per 1,000 women. Women in the age bracket of 20 to 34 years acount for 100.0% of all women with births.
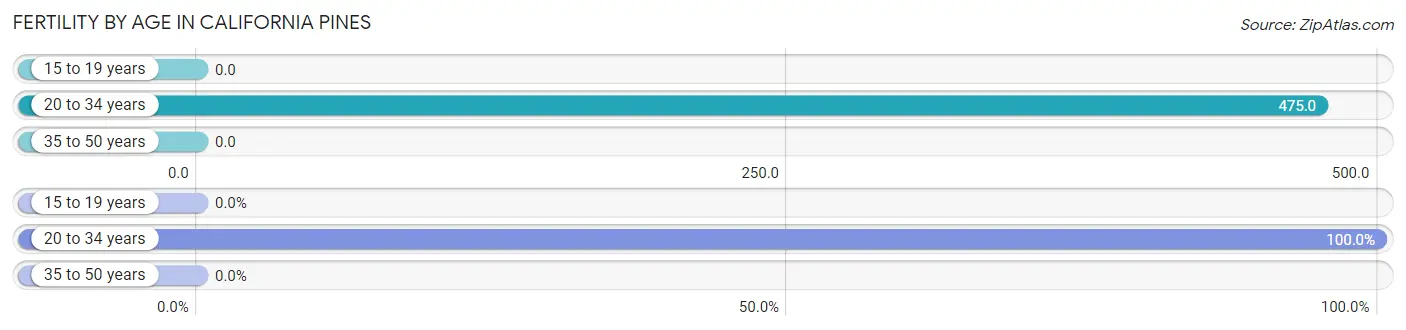
| Age Bracket | Women with Births | Births / 1,000 Women |
| 15 to 19 years | 0 (0.0%) | 0.0 |
| 20 to 34 years | 19 (100.0%) | 475.0 |
| 35 to 50 years | 0 (0.0%) | 0.0 |
| Total | 19 (100.0%) | 388.0 |
Fertility by Age by Marriage Status in California Pines
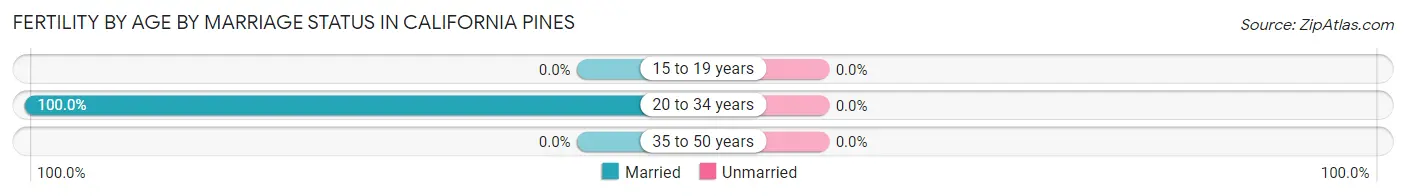
| Age Bracket | Married | Unmarried |
| 15 to 19 years | 0 (0.0%) | 0 (0.0%) |
| 20 to 34 years | 19 (100.0%) | 0 (0.0%) |
| 35 to 50 years | 0 (0.0%) | 0 (0.0%) |
| Total | 19 (100.0%) | 0 (0.0%) |
Fertility by Education in California Pines
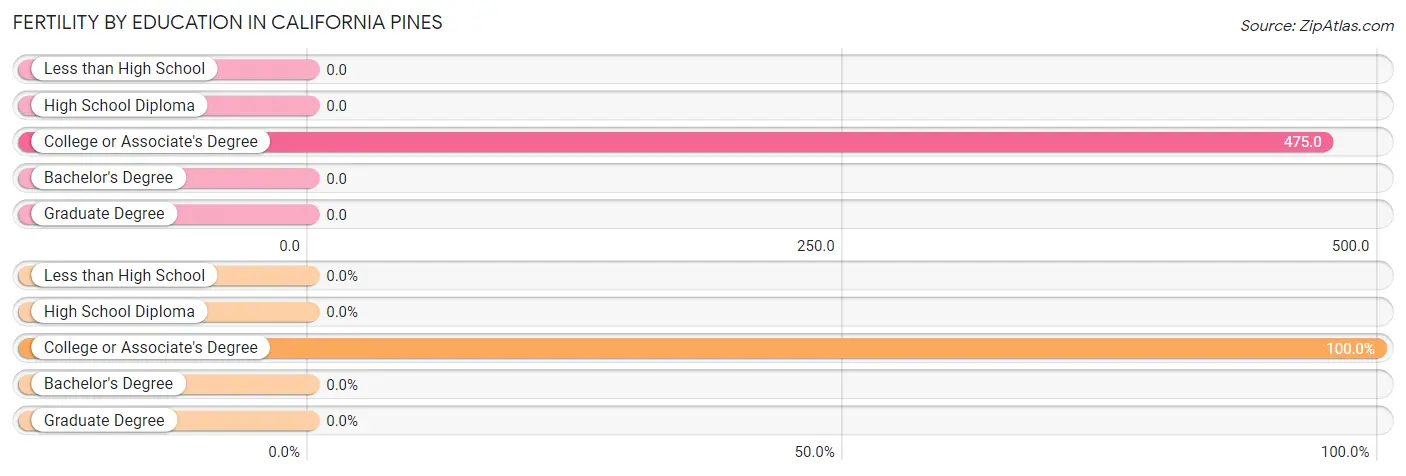
| Educational Attainment | Women with Births | Births / 1,000 Women |
| Less than High School | 0 (0.0%) | 0.0 |
| High School Diploma | 0 (0.0%) | 0.0 |
| College or Associate's Degree | 19 (100.0%) | 475.0 |
| Bachelor's Degree | 0 (0.0%) | 0.0 |
| Graduate Degree | 0 (0.0%) | 0.0 |
| Total | 19 (100.0%) | 388.0 |
Fertility by Education by Marriage Status in California Pines
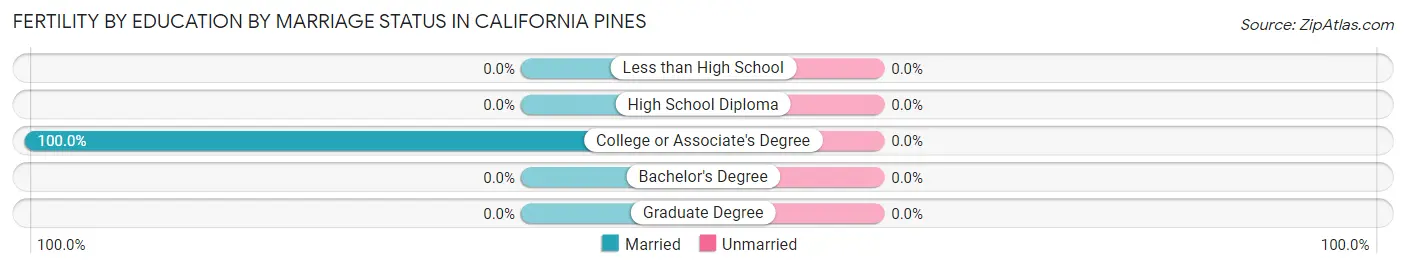
| Educational Attainment | Married | Unmarried |
| Less than High School | 0 (0.0%) | 0 (0.0%) |
| High School Diploma | 0 (0.0%) | 0 (0.0%) |
| College or Associate's Degree | 19 (100.0%) | 0 (0.0%) |
| Bachelor's Degree | 0 (0.0%) | 0 (0.0%) |
| Graduate Degree | 0 (0.0%) | 0 (0.0%) |
| Total | 19 (100.0%) | 0 (0.0%) |
Employment Characteristics in California Pines
Employment by Class of Employer in California Pines
Among the 122 employed individuals in California Pines, private company employees (52 | 42.6%), state government employees (39 | 32.0%), and local government employees (31 | 25.4%) make up the most common classes of employment.
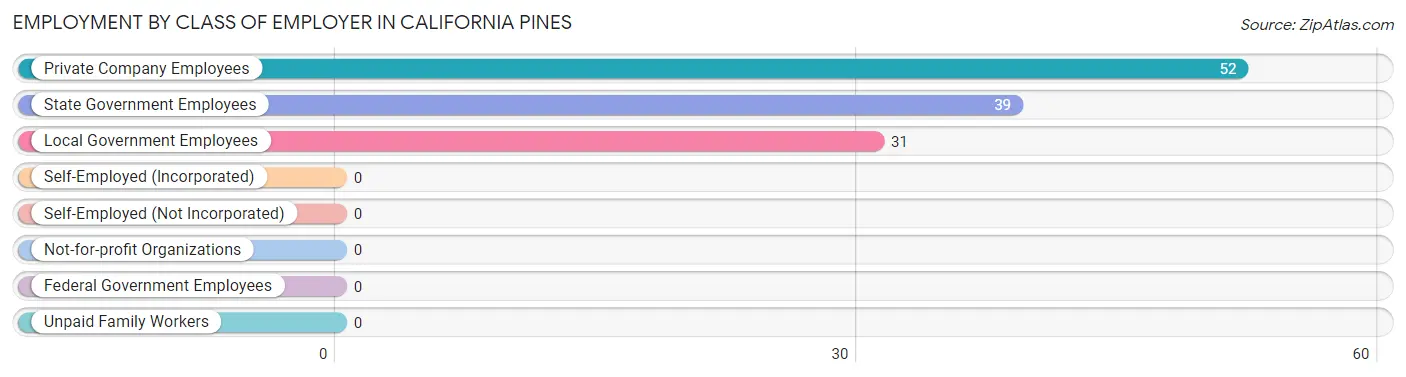
| Employer Class | # Employees | % Employees |
| Private Company Employees | 52 | 42.6% |
| Self-Employed (Incorporated) | 0 | 0.0% |
| Self-Employed (Not Incorporated) | 0 | 0.0% |
| Not-for-profit Organizations | 0 | 0.0% |
| Local Government Employees | 31 | 25.4% |
| State Government Employees | 39 | 32.0% |
| Federal Government Employees | 0 | 0.0% |
| Unpaid Family Workers | 0 | 0.0% |
| Total | 122 | 100.0% |
Employment Status by Age in California Pines
According to the labor force statistics for California Pines, out of the total population over 16 years of age (252), 52.0% or 131 individuals are in the labor force, with 6.9% or 9 of them unemployed. The age group with the highest labor force participation rate is 25 to 29 years, with 100.0% or 51 individuals in the labor force. Within the labor force, the 35 to 44 years age range has the highest percentage of unemployed individuals, with 100.0% or 9 of them being unemployed.
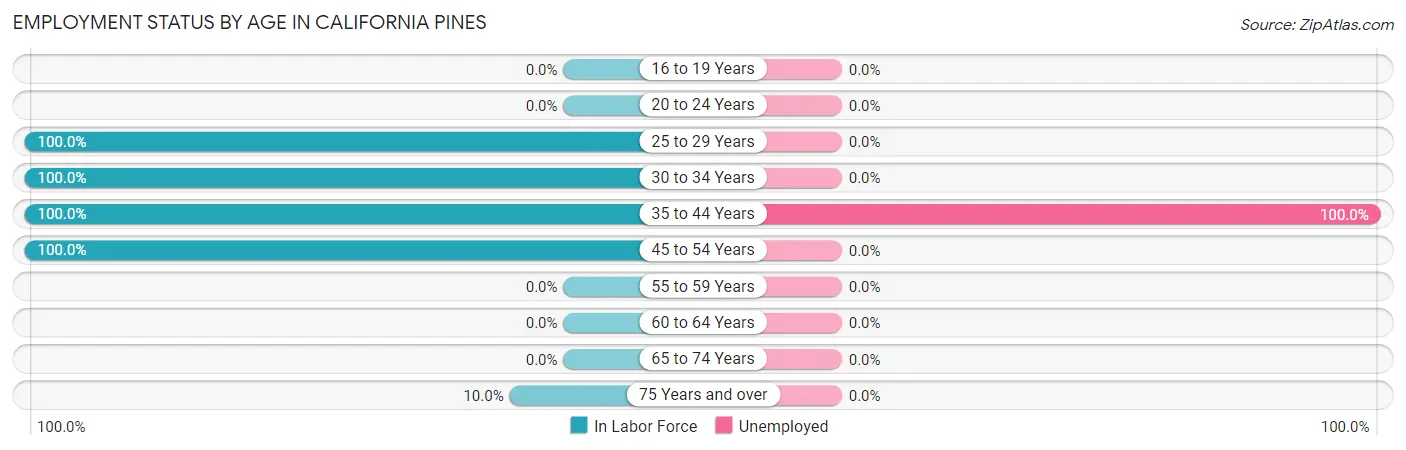
| Age Bracket | In Labor Force | Unemployed |
| 16 to 19 Years | 0 (0.0%) | 0 (0.0%) |
| 20 to 24 Years | 0 (0.0%) | 0 (0.0%) |
| 25 to 29 Years | 51 (100.0%) | 0 (0.0%) |
| 30 to 34 Years | 41 (100.0%) | 0 (0.0%) |
| 35 to 44 Years | 9 (100.0%) | 9 (100.0%) |
| 45 to 54 Years | 24 (100.0%) | 0 (0.0%) |
| 55 to 59 Years | 0 (0.0%) | 0 (0.0%) |
| 60 to 64 Years | 0 (0.0%) | 0 (0.0%) |
| 65 to 74 Years | 0 (0.0%) | 0 (0.0%) |
| 75 Years and over | 6 (10.0%) | 0 (0.0%) |
| Total | 131 (52.0%) | 9 (6.9%) |
Employment Status by Educational Attainment in California Pines
According to labor force statistics for California Pines, 88.0% of individuals (125) out of the total population between 25 and 64 years of age (142) are in the labor force, with 7.2% or 9 of them being unemployed. The group with the highest labor force participation rate are those with the educational attainment of college / associate degree, with 91.6% or 76 individuals in the labor force. Within the labor force, individuals with high school diploma education have the highest percentage of unemployment, with 18.4% or 9 of them being unemployed.
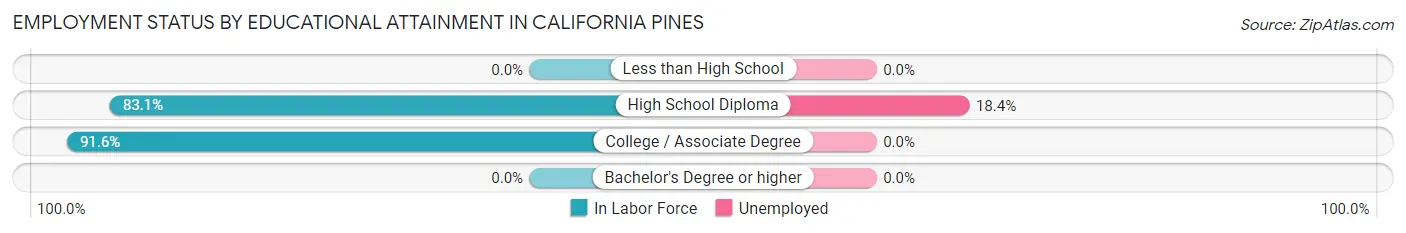
| Educational Attainment | In Labor Force | Unemployed |
| Less than High School | 0 (0.0%) | 0 (0.0%) |
| High School Diploma | 49 (83.1%) | 11 (18.4%) |
| College / Associate Degree | 76 (91.6%) | 0 (0.0%) |
| Bachelor's Degree or higher | 0 (0.0%) | 0 (0.0%) |
| Total | 125 (88.0%) | 10 (7.2%) |
Employment Occupations by Sex in California Pines
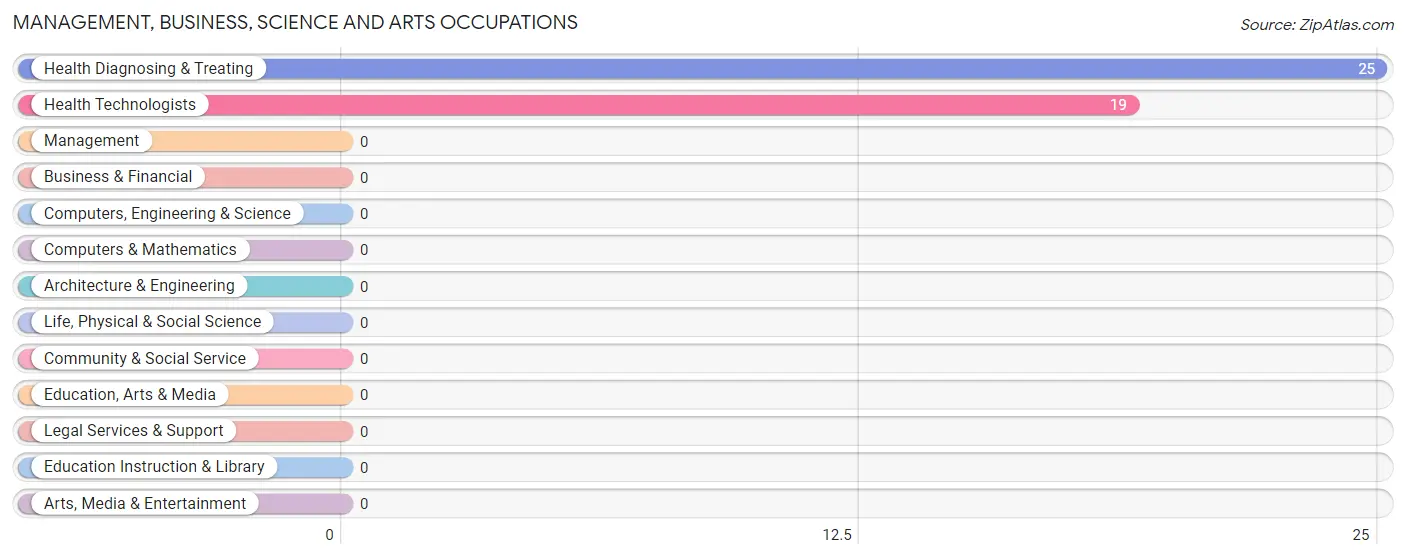
Management, Business, Science and Arts Occupations
The most common Management, Business, Science and Arts occupations in California Pines are Health Diagnosing & Treating (25 | 20.5%), and Health Technologists (19 | 15.6%).
Management, Business, Science and Arts Occupations by Sex
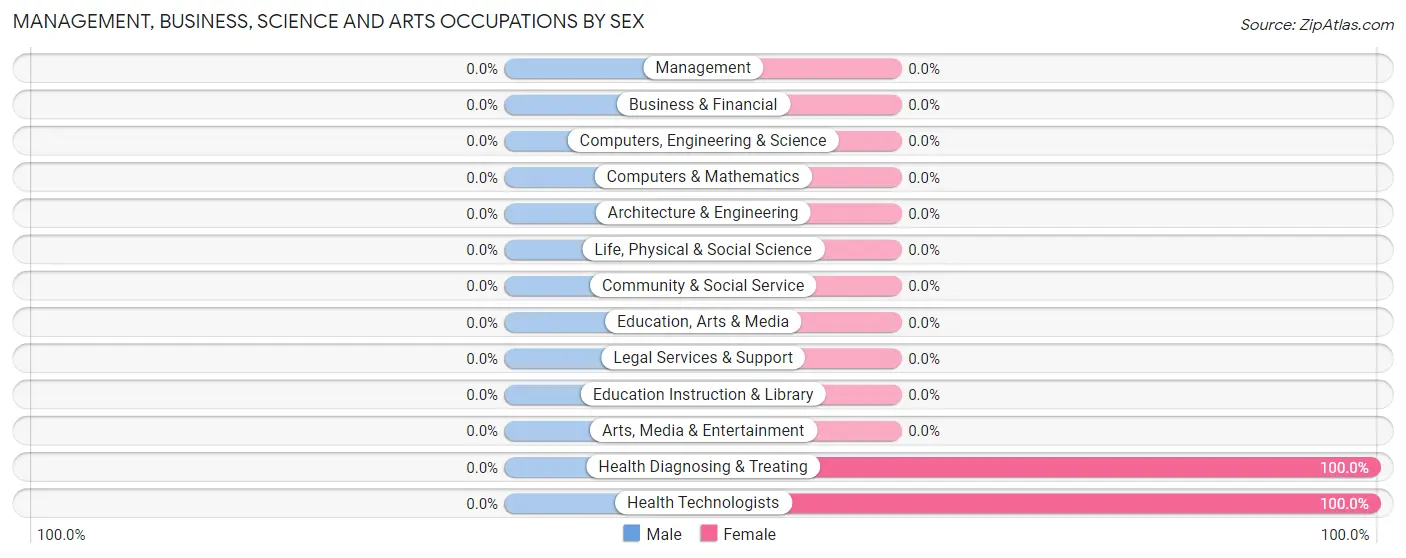
| Occupation | Male | Female |
| Management | 0 (0.0%) | 0 (0.0%) |
| Business & Financial | 0 (0.0%) | 0 (0.0%) |
| Computers, Engineering & Science | 0 (0.0%) | 0 (0.0%) |
| Computers & Mathematics | 0 (0.0%) | 0 (0.0%) |
| Architecture & Engineering | 0 (0.0%) | 0 (0.0%) |
| Life, Physical & Social Science | 0 (0.0%) | 0 (0.0%) |
| Community & Social Service | 0 (0.0%) | 0 (0.0%) |
| Education, Arts & Media | 0 (0.0%) | 0 (0.0%) |
| Legal Services & Support | 0 (0.0%) | 0 (0.0%) |
| Education Instruction & Library | 0 (0.0%) | 0 (0.0%) |
| Arts, Media & Entertainment | 0 (0.0%) | 0 (0.0%) |
| Health Diagnosing & Treating | 0 (0.0%) | 25 (100.0%) |
| Health Technologists | 0 (0.0%) | 19 (100.0%) |
| Total (Category) | 0 (0.0%) | 25 (100.0%) |
| Total (Overall) | 66 (54.1%) | 56 (45.9%) |
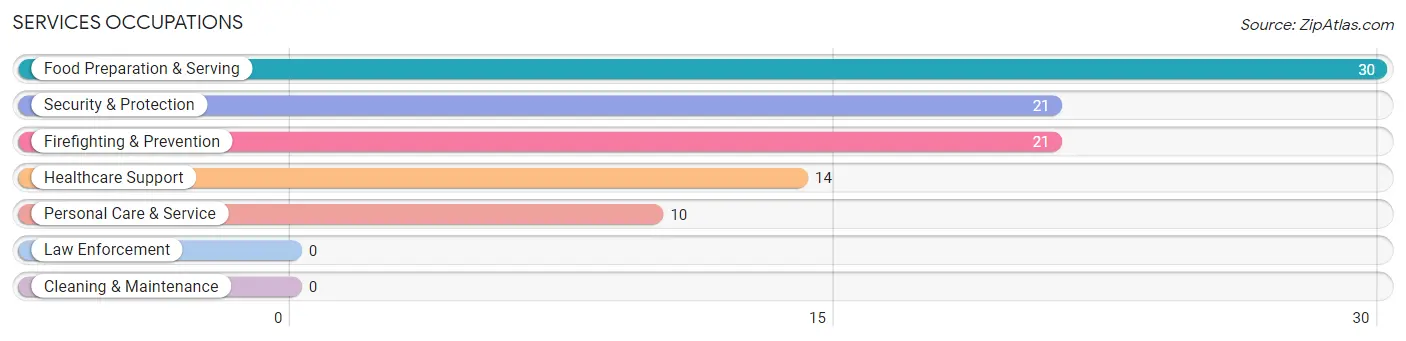
Services Occupations
The most common Services occupations in California Pines are Food Preparation & Serving (30 | 24.6%), Security & Protection (21 | 17.2%), Firefighting & Prevention (21 | 17.2%), Healthcare Support (14 | 11.5%), and Personal Care & Service (10 | 8.2%).
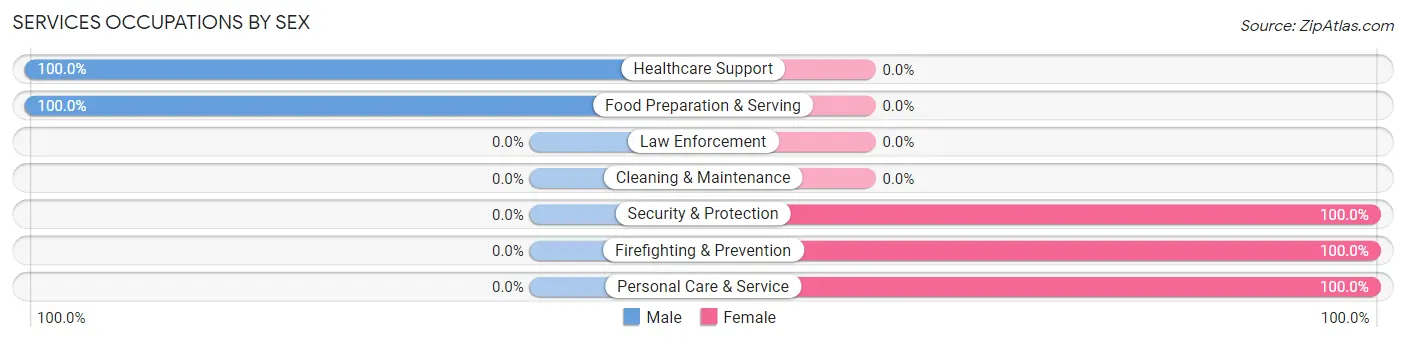
Services Occupations by Sex
Within the Services occupations in California Pines, the most male-oriented occupations are Healthcare Support (100.0%), and Food Preparation & Serving (100.0%), while the most female-oriented occupations are Security & Protection (100.0%), Firefighting & Prevention (100.0%), and Personal Care & Service (100.0%).
| Occupation | Male | Female |
| Healthcare Support | 14 (100.0%) | 0 (0.0%) |
| Security & Protection | 0 (0.0%) | 21 (100.0%) |
| Firefighting & Prevention | 0 (0.0%) | 21 (100.0%) |
| Law Enforcement | 0 (0.0%) | 0 (0.0%) |
| Food Preparation & Serving | 30 (100.0%) | 0 (0.0%) |
| Cleaning & Maintenance | 0 (0.0%) | 0 (0.0%) |
| Personal Care & Service | 0 (0.0%) | 10 (100.0%) |
| Total (Category) | 44 (58.7%) | 31 (41.3%) |
| Total (Overall) | 66 (54.1%) | 56 (45.9%) |
Sales and Office Occupations
The most common Sales and Office occupations in California Pines are , and Sales & Related (11 | 9.0%).
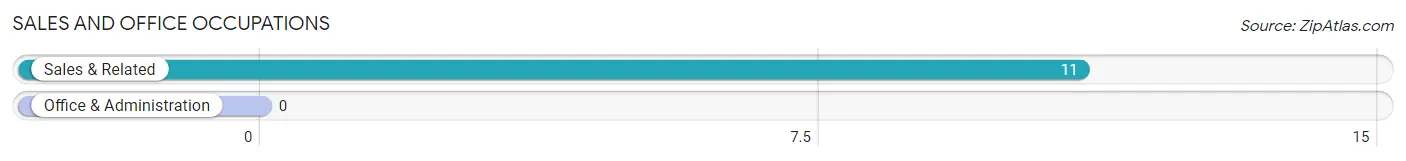
Sales and Office Occupations by Sex

| Occupation | Male | Female |
| Sales & Related | 11 (100.0%) | 0 (0.0%) |
| Office & Administration | 0 (0.0%) | 0 (0.0%) |
| Total (Category) | 11 (100.0%) | 0 (0.0%) |
| Total (Overall) | 66 (54.1%) | 56 (45.9%) |
Natural Resources, Construction and Maintenance Occupations
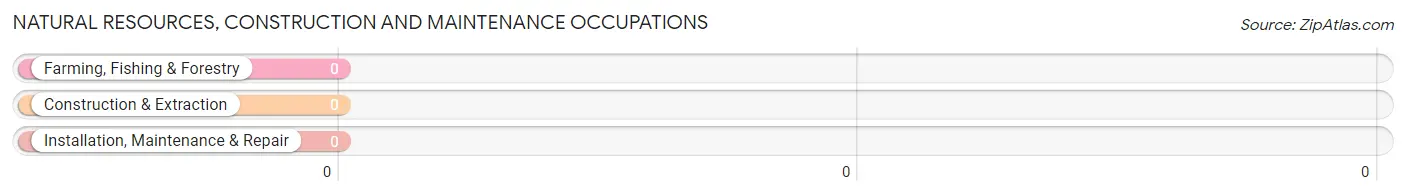
Natural Resources, Construction and Maintenance Occupations by Sex
| Occupation | Male | Female |
| Farming, Fishing & Forestry | 0 (0.0%) | 0 (0.0%) |
| Construction & Extraction | 0 (0.0%) | 0 (0.0%) |
| Installation, Maintenance & Repair | 0 (0.0%) | 0 (0.0%) |
| Total (Category) | 0 (0.0%) | 0 (0.0%) |
| Total (Overall) | 66 (54.1%) | 56 (45.9%) |
Production, Transportation and Moving Occupations
The most common Production, Transportation and Moving occupations in California Pines are , and Transportation (11 | 9.0%).
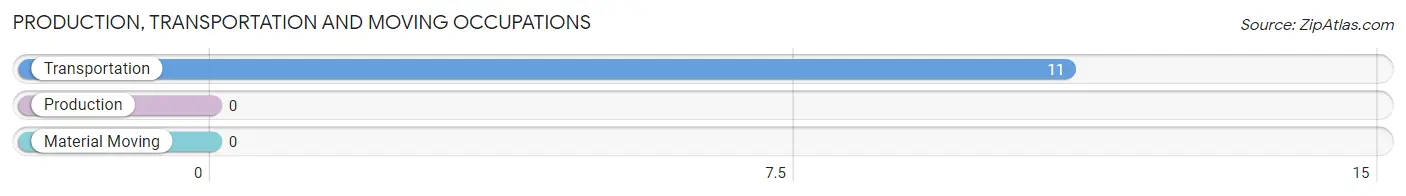
Production, Transportation and Moving Occupations by Sex
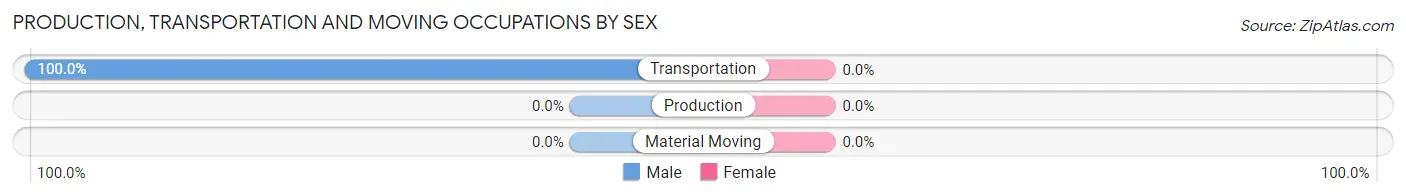
| Occupation | Male | Female |
| Production | 0 (0.0%) | 0 (0.0%) |
| Transportation | 11 (100.0%) | 0 (0.0%) |
| Material Moving | 0 (0.0%) | 0 (0.0%) |
| Total (Category) | 11 (100.0%) | 0 (0.0%) |
| Total (Overall) | 66 (54.1%) | 56 (45.9%) |
Employment Industries by Sex in California Pines
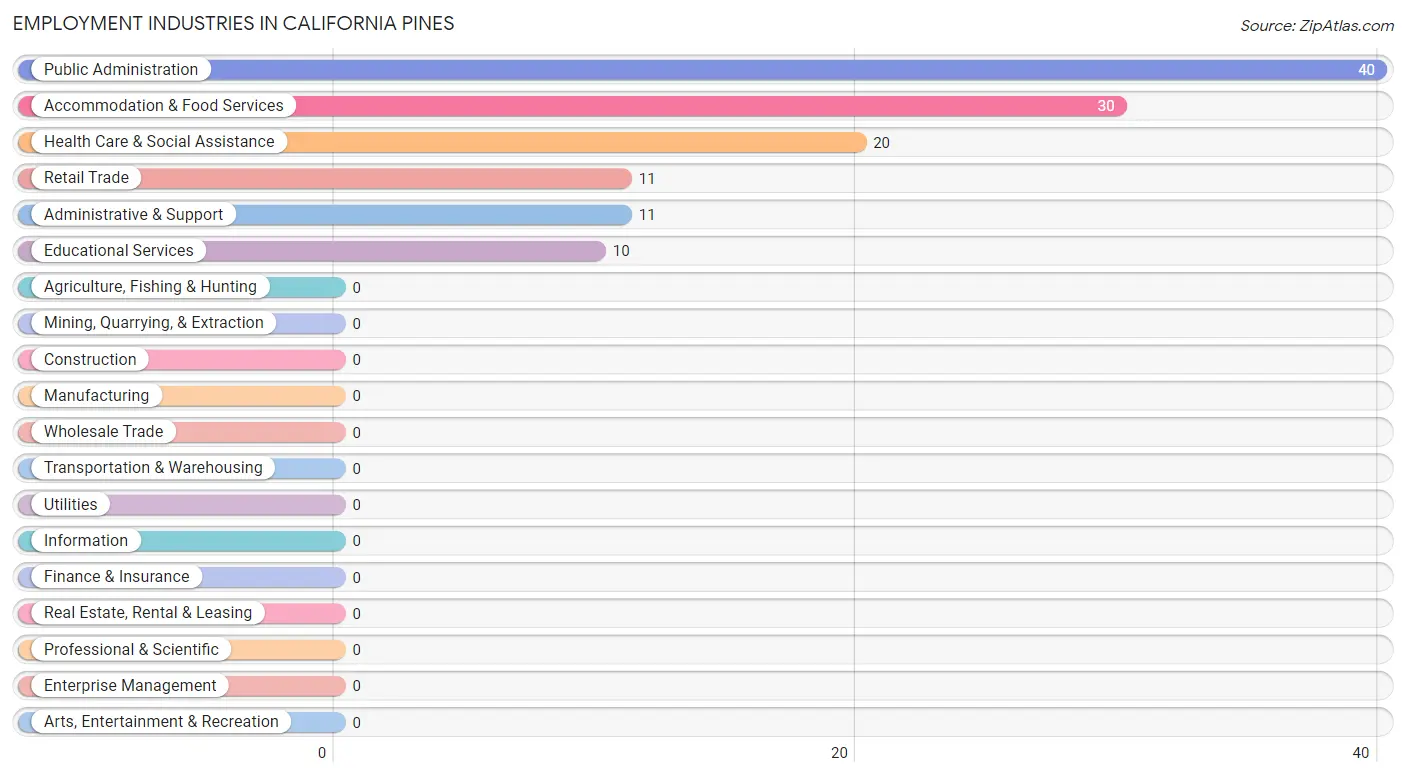
Employment Industries in California Pines
The major employment industries in California Pines include Public Administration (40 | 32.8%), Accommodation & Food Services (30 | 24.6%), Health Care & Social Assistance (20 | 16.4%), Retail Trade (11 | 9.0%), and Administrative & Support (11 | 9.0%).
Employment Industries by Sex in California Pines
The California Pines industries that see more men than women are Retail Trade (100.0%), Administrative & Support (100.0%), and Accommodation & Food Services (100.0%), whereas the industries that tend to have a higher number of women are Educational Services (100.0%), Public Administration (100.0%), and Health Care & Social Assistance (30.0%).
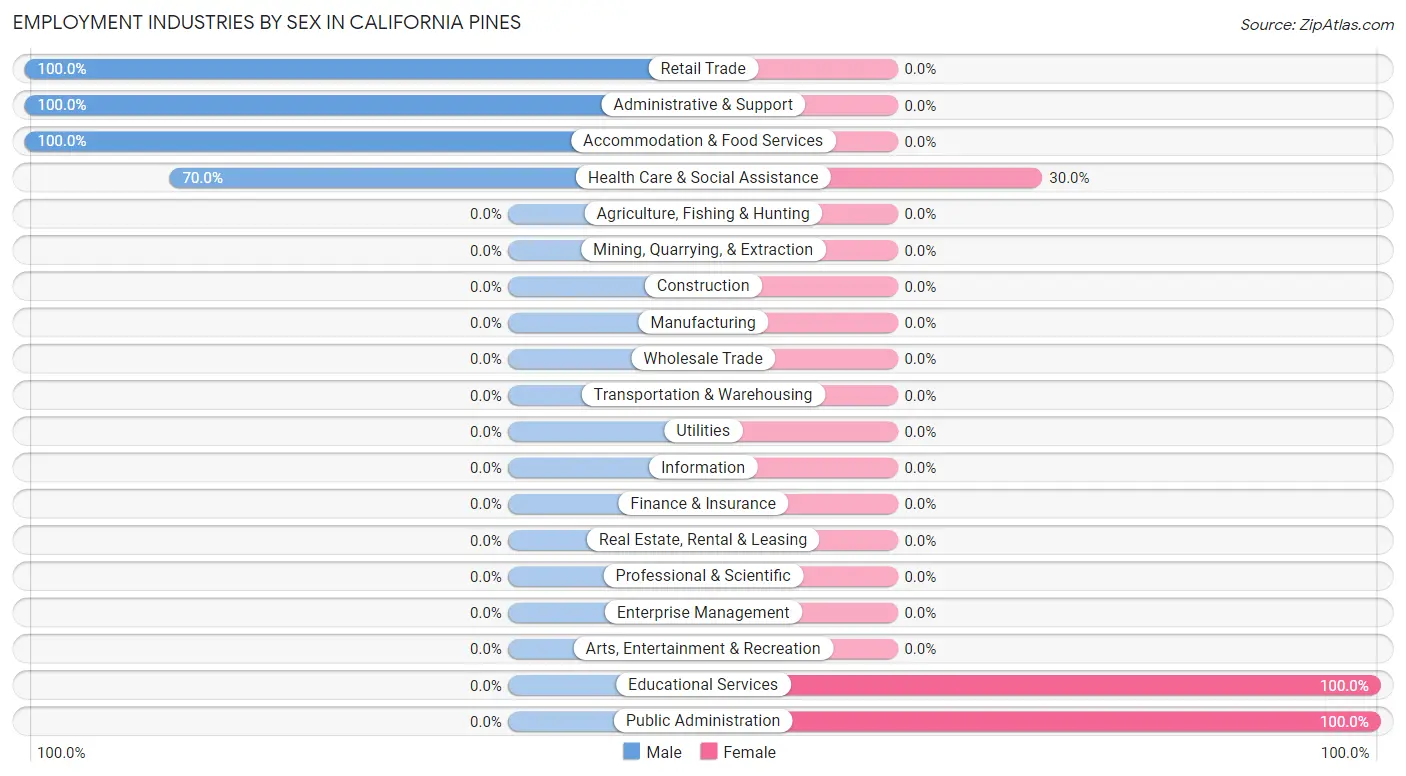
| Industry | Male | Female |
| Agriculture, Fishing & Hunting | 0 (0.0%) | 0 (0.0%) |
| Mining, Quarrying, & Extraction | 0 (0.0%) | 0 (0.0%) |
| Construction | 0 (0.0%) | 0 (0.0%) |
| Manufacturing | 0 (0.0%) | 0 (0.0%) |
| Wholesale Trade | 0 (0.0%) | 0 (0.0%) |
| Retail Trade | 11 (100.0%) | 0 (0.0%) |
| Transportation & Warehousing | 0 (0.0%) | 0 (0.0%) |
| Utilities | 0 (0.0%) | 0 (0.0%) |
| Information | 0 (0.0%) | 0 (0.0%) |
| Finance & Insurance | 0 (0.0%) | 0 (0.0%) |
| Real Estate, Rental & Leasing | 0 (0.0%) | 0 (0.0%) |
| Professional & Scientific | 0 (0.0%) | 0 (0.0%) |
| Enterprise Management | 0 (0.0%) | 0 (0.0%) |
| Administrative & Support | 11 (100.0%) | 0 (0.0%) |
| Educational Services | 0 (0.0%) | 10 (100.0%) |
| Health Care & Social Assistance | 14 (70.0%) | 6 (30.0%) |
| Arts, Entertainment & Recreation | 0 (0.0%) | 0 (0.0%) |
| Accommodation & Food Services | 30 (100.0%) | 0 (0.0%) |
| Public Administration | 0 (0.0%) | 40 (100.0%) |
| Total | 66 (54.1%) | 56 (45.9%) |
Education in California Pines
School Enrollment in California Pines
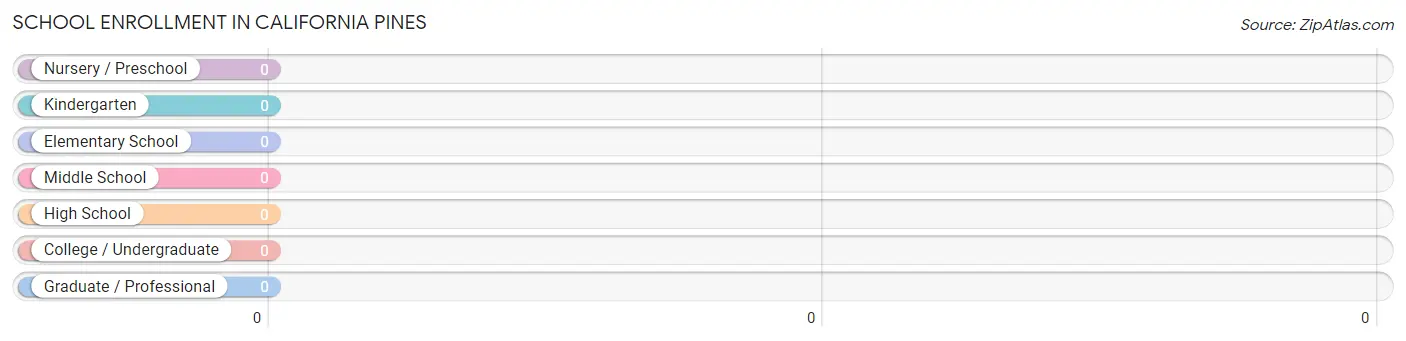
| School Level | # Students | % Students |
| Nursery / Preschool | 0 | 0.0% |
| Kindergarten | 0 | 0.0% |
| Elementary School | 0 | 0.0% |
| Middle School | 0 | 0.0% |
| High School | 0 | 0.0% |
| College / Undergraduate | 0 | 0.0% |
| Graduate / Professional | 0 | 0.0% |
| Total | 0 | 0.0% |
School Enrollment by Age by Funding Source in California Pines
| Age Bracket | Public School | Private School |
| 3 to 4 Year Olds | 0 (0.0%) | 0 (0.0%) |
| 5 to 9 Year Old | 0 (0.0%) | 0 (0.0%) |
| 10 to 14 Year Olds | 0 (0.0%) | 0 (0.0%) |
| 15 to 17 Year Olds | 0 (0.0%) | 0 (0.0%) |
| 18 to 19 Year Olds | 0 (0.0%) | 0 (0.0%) |
| 20 to 24 Year Olds | 0 (0.0%) | 0 (0.0%) |
| 25 to 34 Year Olds | 0 (0.0%) | 0 (0.0%) |
| 35 Years and over | 0 (0.0%) | 0 (0.0%) |
| Total | 0 (0.0%) | 0 (0.0%) |
Educational Attainment by Field of Study in California Pines
Engineering (14 | 56.0%), and business (11 | 44.0%) are the most common fields of study among 25 individuals in California Pines who have obtained a bachelor's degree or higher.
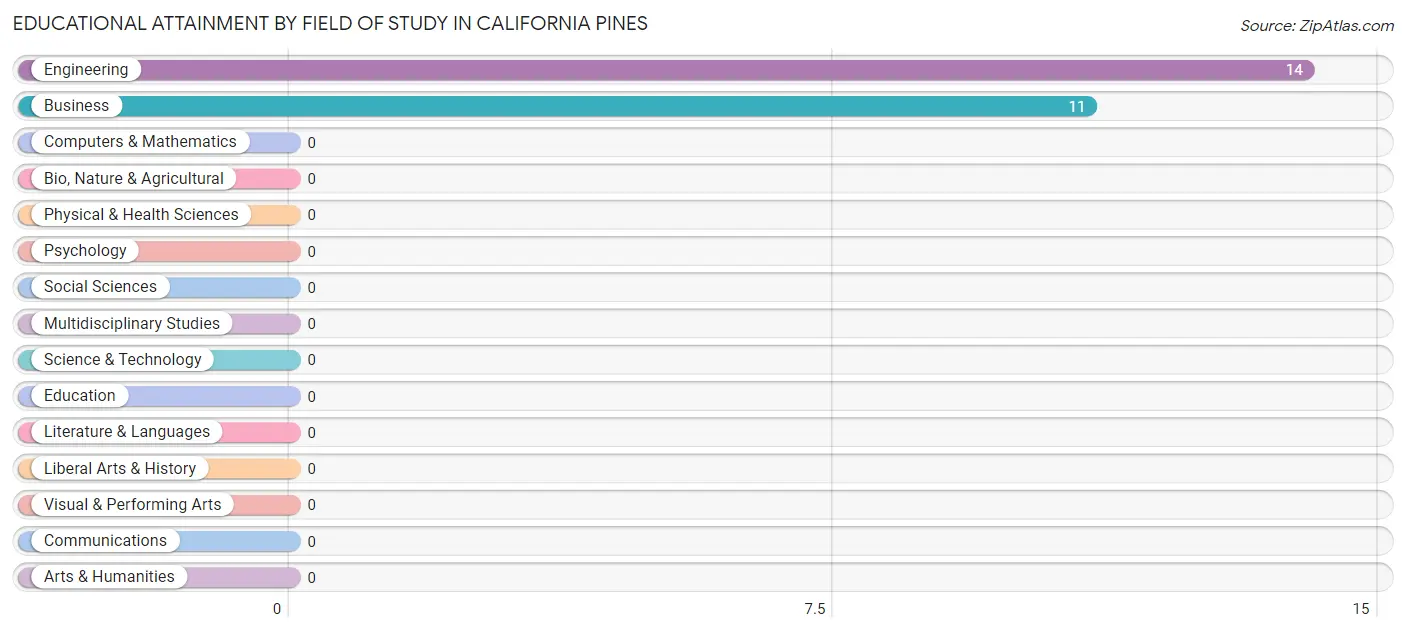
| Field of Study | # Graduates | % Graduates |
| Computers & Mathematics | 0 | 0.0% |
| Bio, Nature & Agricultural | 0 | 0.0% |
| Physical & Health Sciences | 0 | 0.0% |
| Psychology | 0 | 0.0% |
| Social Sciences | 0 | 0.0% |
| Engineering | 14 | 56.0% |
| Multidisciplinary Studies | 0 | 0.0% |
| Science & Technology | 0 | 0.0% |
| Business | 11 | 44.0% |
| Education | 0 | 0.0% |
| Literature & Languages | 0 | 0.0% |
| Liberal Arts & History | 0 | 0.0% |
| Visual & Performing Arts | 0 | 0.0% |
| Communications | 0 | 0.0% |
| Arts & Humanities | 0 | 0.0% |
| Total | 25 | 100.0% |
Transportation & Commute in California Pines
Vehicle Availability by Sex in California Pines
The most prevalent vehicle ownership categories in California Pines are males with 4 vehicles (41, accounting for 62.1%) and females with 4 vehicles (21, making up 73.2%).
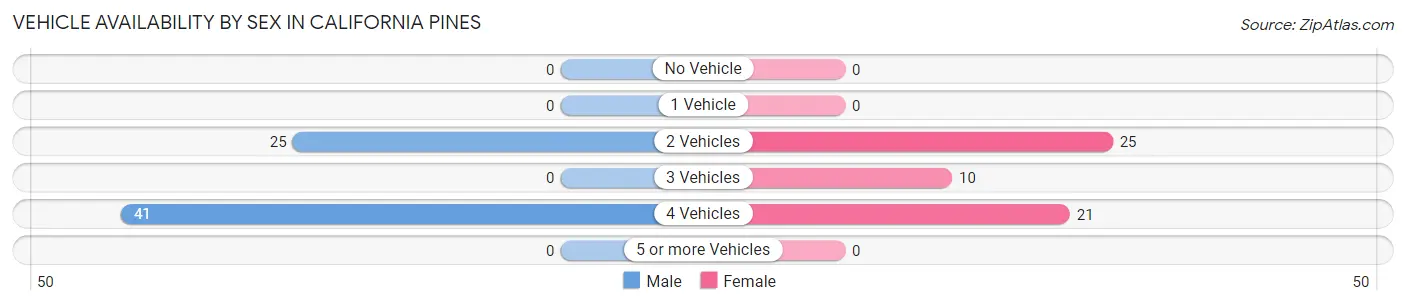
| Vehicles Available | Male | Female |
| No Vehicle | 0 (0.0%) | 0 (0.0%) |
| 1 Vehicle | 0 (0.0%) | 0 (0.0%) |
| 2 Vehicles | 25 (37.9%) | 25 (44.6%) |
| 3 Vehicles | 0 (0.0%) | 10 (17.9%) |
| 4 Vehicles | 41 (62.1%) | 21 (37.5%) |
| 5 or more Vehicles | 0 (0.0%) | 0 (0.0%) |
| Total | 66 (100.0%) | 56 (100.0%) |
Commute Time in California Pines
The most frequently occuring commute durations in California Pines are 15 to 19 minutes (59 commuters, 48.4%), less than 5 minutes (21 commuters, 17.2%), and 20 to 24 minutes (20 commuters, 16.4%).
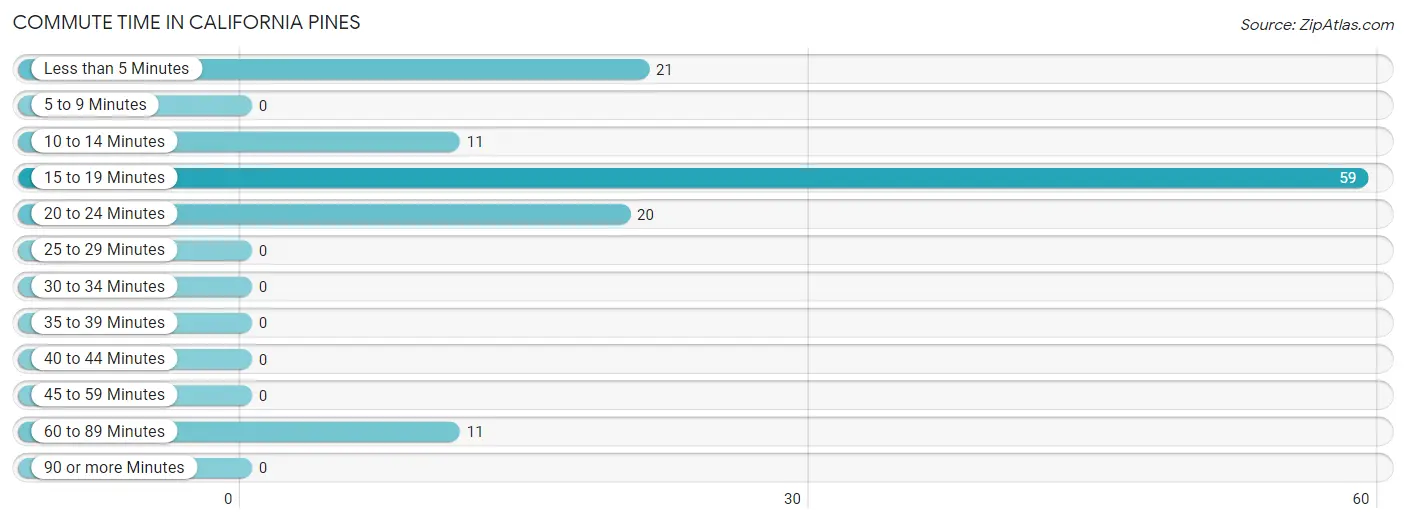
| Commute Time | # Commuters | % Commuters |
| Less than 5 Minutes | 21 | 17.2% |
| 5 to 9 Minutes | 0 | 0.0% |
| 10 to 14 Minutes | 11 | 9.0% |
| 15 to 19 Minutes | 59 | 48.4% |
| 20 to 24 Minutes | 20 | 16.4% |
| 25 to 29 Minutes | 0 | 0.0% |
| 30 to 34 Minutes | 0 | 0.0% |
| 35 to 39 Minutes | 0 | 0.0% |
| 40 to 44 Minutes | 0 | 0.0% |
| 45 to 59 Minutes | 0 | 0.0% |
| 60 to 89 Minutes | 11 | 9.0% |
| 90 or more Minutes | 0 | 0.0% |
Commute Time by Sex in California Pines
The most common commute times in California Pines are 15 to 19 minutes (30 commuters, 45.5%) for males and 15 to 19 minutes (29 commuters, 51.8%) for females.
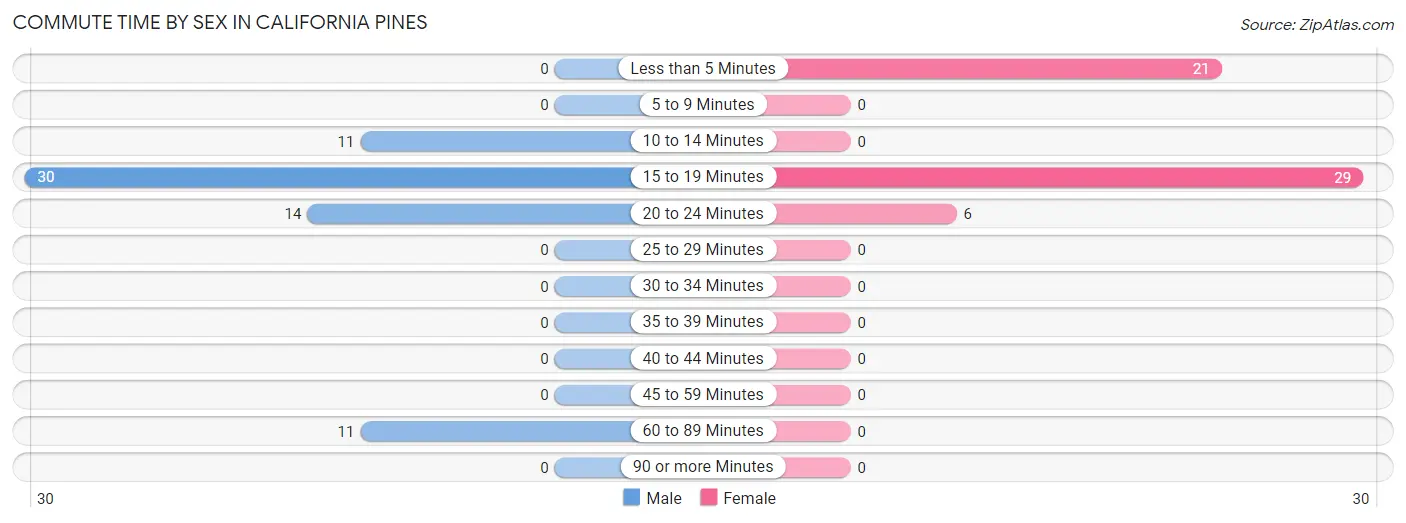
| Commute Time | Male | Female |
| Less than 5 Minutes | 0 (0.0%) | 21 (37.5%) |
| 5 to 9 Minutes | 0 (0.0%) | 0 (0.0%) |
| 10 to 14 Minutes | 11 (16.7%) | 0 (0.0%) |
| 15 to 19 Minutes | 30 (45.5%) | 29 (51.8%) |
| 20 to 24 Minutes | 14 (21.2%) | 6 (10.7%) |
| 25 to 29 Minutes | 0 (0.0%) | 0 (0.0%) |
| 30 to 34 Minutes | 0 (0.0%) | 0 (0.0%) |
| 35 to 39 Minutes | 0 (0.0%) | 0 (0.0%) |
| 40 to 44 Minutes | 0 (0.0%) | 0 (0.0%) |
| 45 to 59 Minutes | 0 (0.0%) | 0 (0.0%) |
| 60 to 89 Minutes | 11 (16.7%) | 0 (0.0%) |
| 90 or more Minutes | 0 (0.0%) | 0 (0.0%) |
Time of Departure to Work by Sex in California Pines
The most frequent times of departure to work in California Pines are 7:30 AM to 7:59 AM (41, 62.1%) for males and 6:30 AM to 6:59 AM (31, 55.4%) for females.
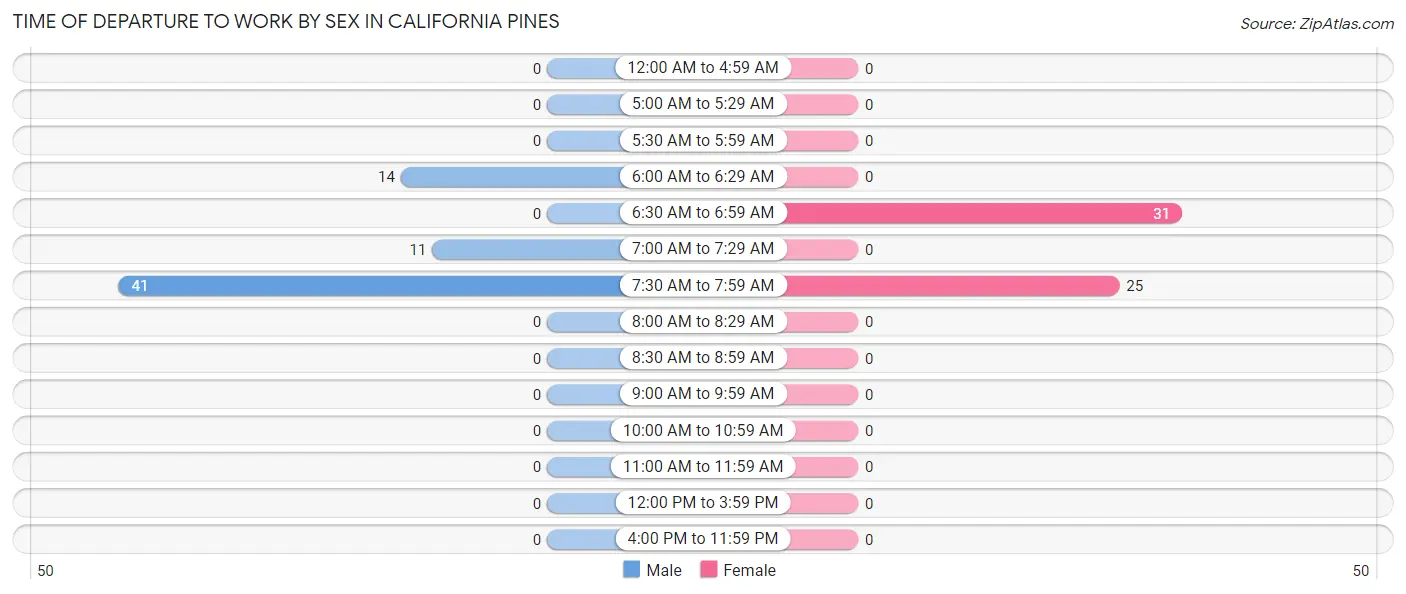
| Time of Departure | Male | Female |
| 12:00 AM to 4:59 AM | 0 (0.0%) | 0 (0.0%) |
| 5:00 AM to 5:29 AM | 0 (0.0%) | 0 (0.0%) |
| 5:30 AM to 5:59 AM | 0 (0.0%) | 0 (0.0%) |
| 6:00 AM to 6:29 AM | 14 (21.2%) | 0 (0.0%) |
| 6:30 AM to 6:59 AM | 0 (0.0%) | 31 (55.4%) |
| 7:00 AM to 7:29 AM | 11 (16.7%) | 0 (0.0%) |
| 7:30 AM to 7:59 AM | 41 (62.1%) | 25 (44.6%) |
| 8:00 AM to 8:29 AM | 0 (0.0%) | 0 (0.0%) |
| 8:30 AM to 8:59 AM | 0 (0.0%) | 0 (0.0%) |
| 9:00 AM to 9:59 AM | 0 (0.0%) | 0 (0.0%) |
| 10:00 AM to 10:59 AM | 0 (0.0%) | 0 (0.0%) |
| 11:00 AM to 11:59 AM | 0 (0.0%) | 0 (0.0%) |
| 12:00 PM to 3:59 PM | 0 (0.0%) | 0 (0.0%) |
| 4:00 PM to 11:59 PM | 0 (0.0%) | 0 (0.0%) |
| Total | 66 (100.0%) | 56 (100.0%) |
Housing Occupancy in California Pines
Occupancy by Ownership in California Pines
Of the total 134 dwellings in California Pines, owner-occupied units account for 113 (84.3%), while renter-occupied units make up 21 (15.7%).
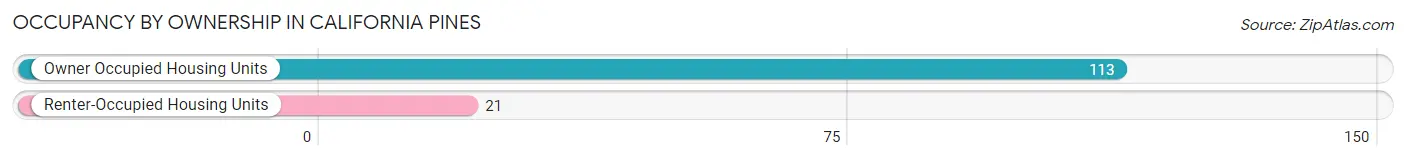
| Occupancy | # Housing Units | % Housing Units |
| Owner Occupied Housing Units | 113 | 84.3% |
| Renter-Occupied Housing Units | 21 | 15.7% |
| Total Occupied Housing Units | 134 | 100.0% |
Occupancy by Household Size in California Pines
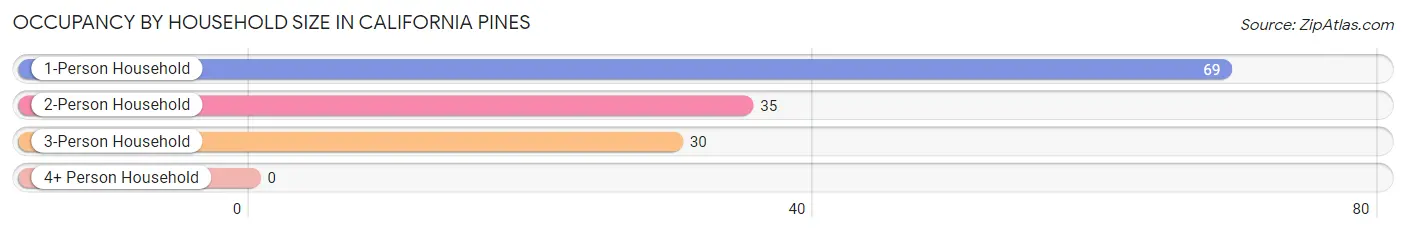
| Household Size | # Housing Units | % Housing Units |
| 1-Person Household | 69 | 51.5% |
| 2-Person Household | 35 | 26.1% |
| 3-Person Household | 30 | 22.4% |
| 4+ Person Household | 0 | 0.0% |
| Total Housing Units | 134 | 100.0% |
Occupancy by Ownership by Household Size in California Pines
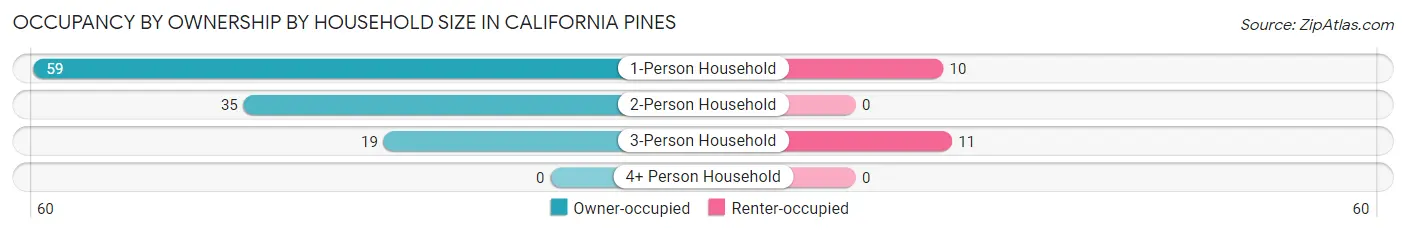
| Household Size | Owner-occupied | Renter-occupied |
| 1-Person Household | 59 (85.5%) | 10 (14.5%) |
| 2-Person Household | 35 (100.0%) | 0 (0.0%) |
| 3-Person Household | 19 (63.3%) | 11 (36.7%) |
| 4+ Person Household | 0 (0.0%) | 0 (0.0%) |
| Total Housing Units | 113 (84.3%) | 21 (15.7%) |
Occupancy by Educational Attainment in California Pines
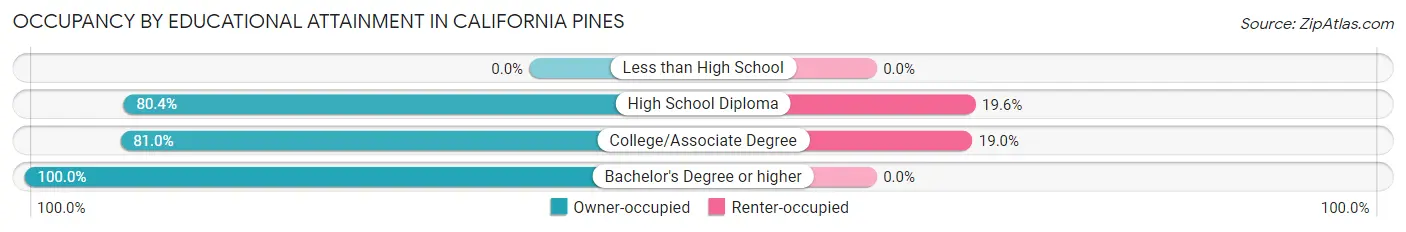
| Household Size | Owner-occupied | Renter-occupied |
| Less than High School | 0 (0.0%) | 0 (0.0%) |
| High School Diploma | 41 (80.4%) | 10 (19.6%) |
| College/Associate Degree | 47 (81.0%) | 11 (19.0%) |
| Bachelor's Degree or higher | 25 (100.0%) | 0 (0.0%) |
Occupancy by Age of Householder in California Pines
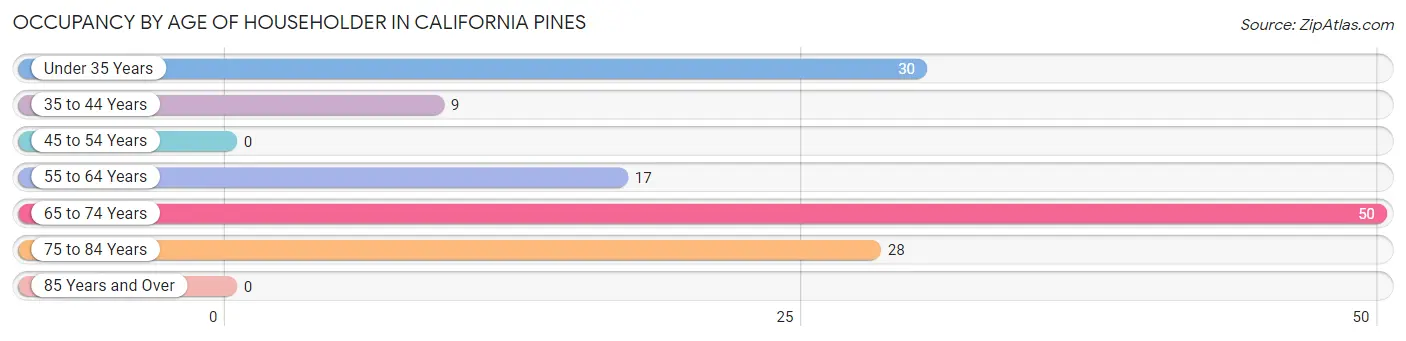
| Age Bracket | # Households | % Households |
| Under 35 Years | 30 | 22.4% |
| 35 to 44 Years | 9 | 6.7% |
| 45 to 54 Years | 0 | 0.0% |
| 55 to 64 Years | 17 | 12.7% |
| 65 to 74 Years | 50 | 37.3% |
| 75 to 84 Years | 28 | 20.9% |
| 85 Years and Over | 0 | 0.0% |
| Total | 134 | 100.0% |
Housing Finances in California Pines
Median Income by Occupancy in California Pines
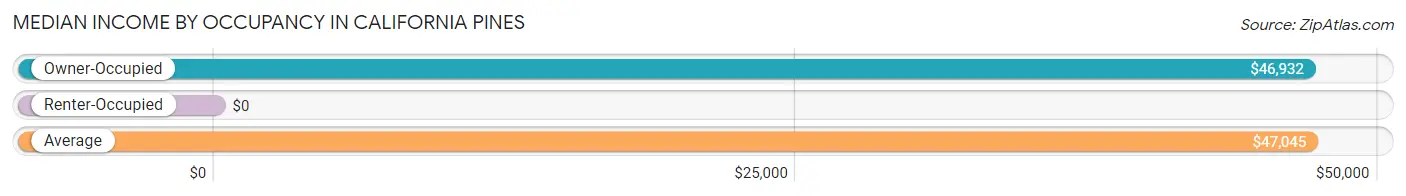
| Occupancy Type | # Households | Median Income |
| Owner-Occupied | 113 (84.3%) | $46,932 |
| Renter-Occupied | 21 (15.7%) | $0 |
| Average | 134 (100.0%) | $47,045 |
Occupancy by Householder Income Bracket in California Pines
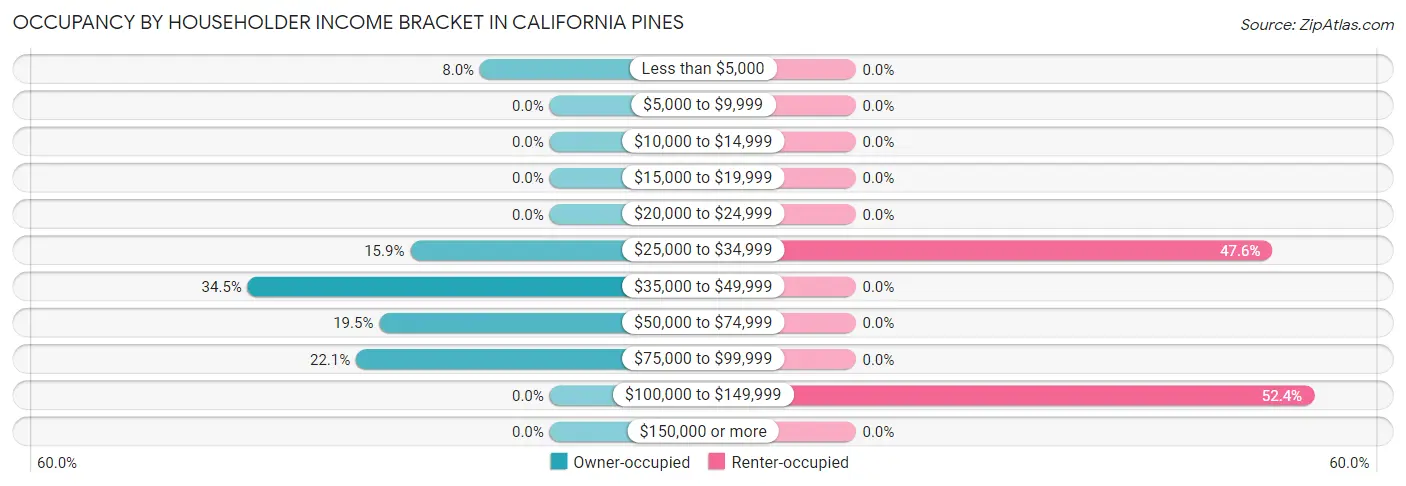
| Income Bracket | Owner-occupied | Renter-occupied |
| Less than $5,000 | 9 (8.0%) | 0 (0.0%) |
| $5,000 to $9,999 | 0 (0.0%) | 0 (0.0%) |
| $10,000 to $14,999 | 0 (0.0%) | 0 (0.0%) |
| $15,000 to $19,999 | 0 (0.0%) | 0 (0.0%) |
| $20,000 to $24,999 | 0 (0.0%) | 0 (0.0%) |
| $25,000 to $34,999 | 18 (15.9%) | 10 (47.6%) |
| $35,000 to $49,999 | 39 (34.5%) | 0 (0.0%) |
| $50,000 to $74,999 | 22 (19.5%) | 0 (0.0%) |
| $75,000 to $99,999 | 25 (22.1%) | 0 (0.0%) |
| $100,000 to $149,999 | 0 (0.0%) | 11 (52.4%) |
| $150,000 or more | 0 (0.0%) | 0 (0.0%) |
| Total | 113 (100.0%) | 21 (100.0%) |
Monthly Housing Cost Tiers in California Pines
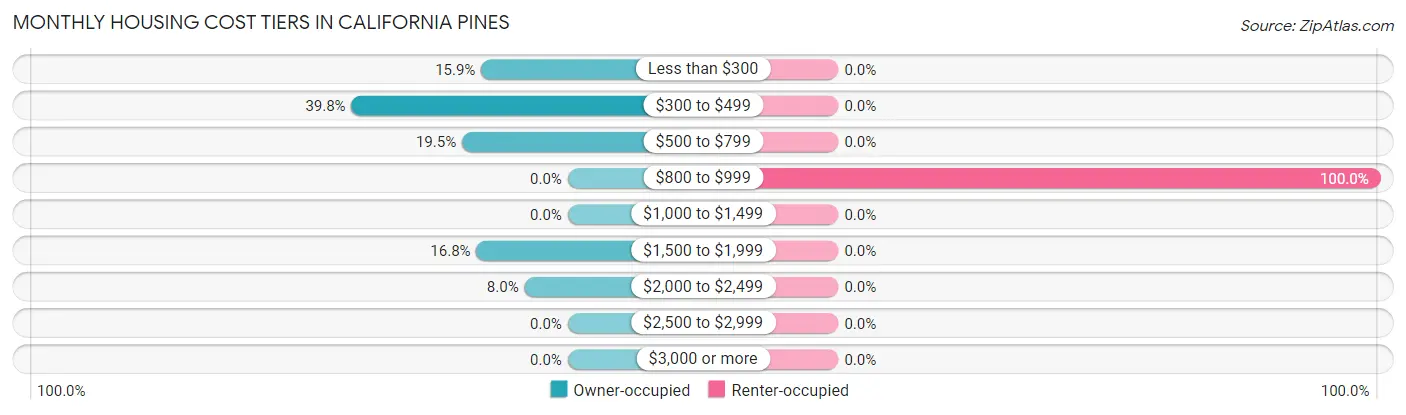
| Monthly Cost | Owner-occupied | Renter-occupied |
| Less than $300 | 18 (15.9%) | 0 (0.0%) |
| $300 to $499 | 45 (39.8%) | 0 (0.0%) |
| $500 to $799 | 22 (19.5%) | 0 (0.0%) |
| $800 to $999 | 0 (0.0%) | 21 (100.0%) |
| $1,000 to $1,499 | 0 (0.0%) | 0 (0.0%) |
| $1,500 to $1,999 | 19 (16.8%) | 0 (0.0%) |
| $2,000 to $2,499 | 9 (8.0%) | 0 (0.0%) |
| $2,500 to $2,999 | 0 (0.0%) | 0 (0.0%) |
| $3,000 or more | 0 (0.0%) | 0 (0.0%) |
| Total | 113 (100.0%) | 21 (100.0%) |
Physical Housing Characteristics in California Pines
Housing Structures in California Pines
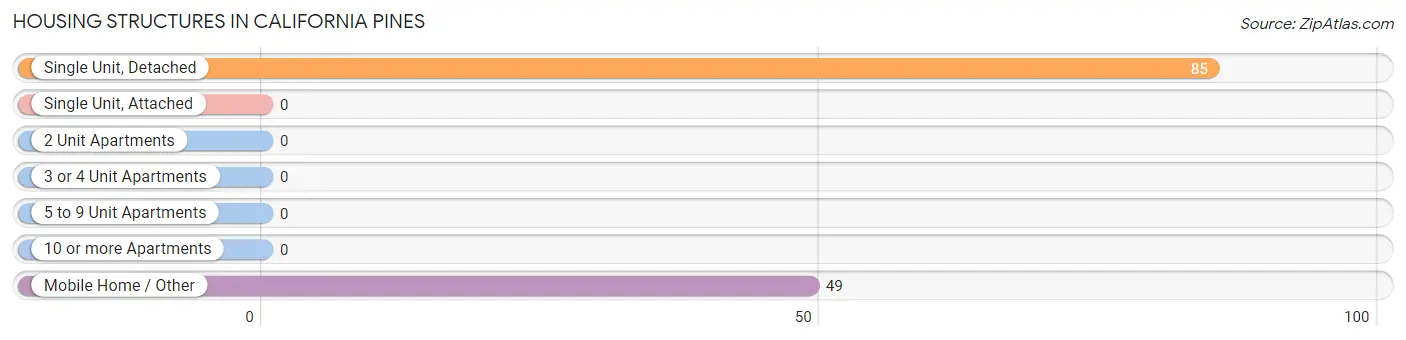
| Structure Type | # Housing Units | % Housing Units |
| Single Unit, Detached | 85 | 63.4% |
| Single Unit, Attached | 0 | 0.0% |
| 2 Unit Apartments | 0 | 0.0% |
| 3 or 4 Unit Apartments | 0 | 0.0% |
| 5 to 9 Unit Apartments | 0 | 0.0% |
| 10 or more Apartments | 0 | 0.0% |
| Mobile Home / Other | 49 | 36.6% |
| Total | 134 | 100.0% |
Housing Structures by Occupancy in California Pines
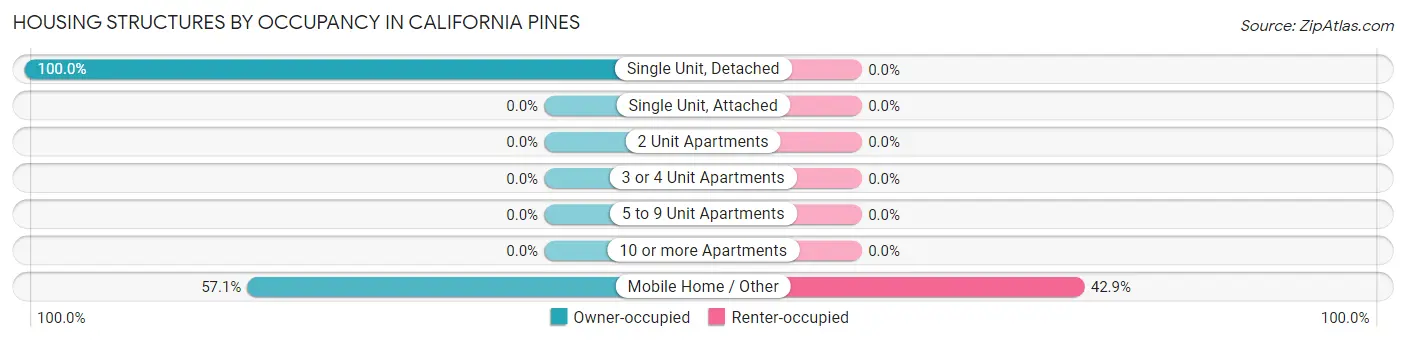
| Structure Type | Owner-occupied | Renter-occupied |
| Single Unit, Detached | 85 (100.0%) | 0 (0.0%) |
| Single Unit, Attached | 0 (0.0%) | 0 (0.0%) |
| 2 Unit Apartments | 0 (0.0%) | 0 (0.0%) |
| 3 or 4 Unit Apartments | 0 (0.0%) | 0 (0.0%) |
| 5 to 9 Unit Apartments | 0 (0.0%) | 0 (0.0%) |
| 10 or more Apartments | 0 (0.0%) | 0 (0.0%) |
| Mobile Home / Other | 28 (57.1%) | 21 (42.9%) |
| Total | 113 (84.3%) | 21 (15.7%) |
Housing Structures by Number of Rooms in California Pines
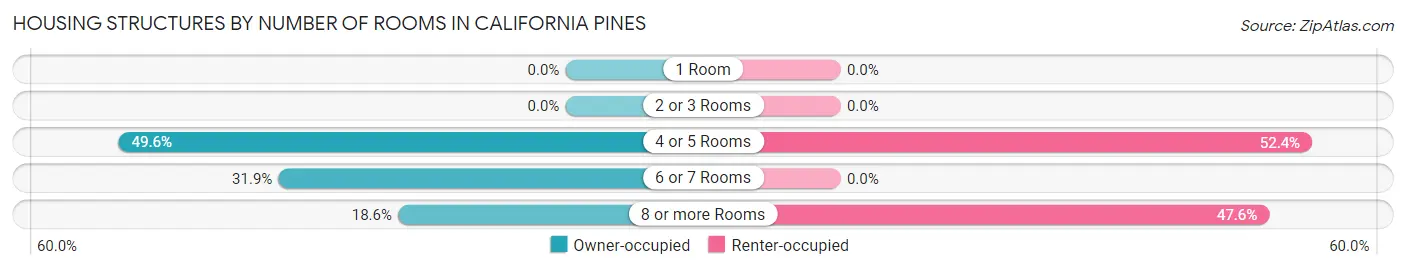
| Number of Rooms | Owner-occupied | Renter-occupied |
| 1 Room | 0 (0.0%) | 0 (0.0%) |
| 2 or 3 Rooms | 0 (0.0%) | 0 (0.0%) |
| 4 or 5 Rooms | 56 (49.6%) | 11 (52.4%) |
| 6 or 7 Rooms | 36 (31.9%) | 0 (0.0%) |
| 8 or more Rooms | 21 (18.6%) | 10 (47.6%) |
| Total | 113 (100.0%) | 21 (100.0%) |
Housing Structure by Heating Type in California Pines
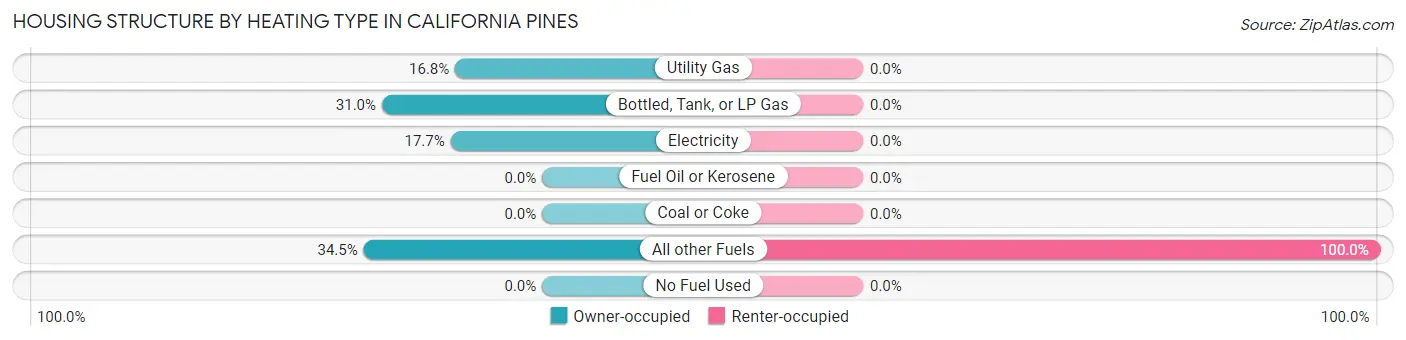
| Heating Type | Owner-occupied | Renter-occupied |
| Utility Gas | 19 (16.8%) | 0 (0.0%) |
| Bottled, Tank, or LP Gas | 35 (31.0%) | 0 (0.0%) |
| Electricity | 20 (17.7%) | 0 (0.0%) |
| Fuel Oil or Kerosene | 0 (0.0%) | 0 (0.0%) |
| Coal or Coke | 0 (0.0%) | 0 (0.0%) |
| All other Fuels | 39 (34.5%) | 21 (100.0%) |
| No Fuel Used | 0 (0.0%) | 0 (0.0%) |
| Total | 113 (100.0%) | 21 (100.0%) |
Household Vehicle Usage in California Pines
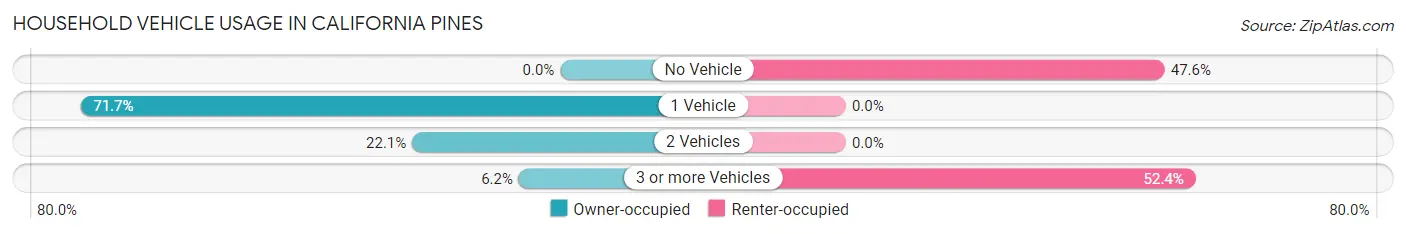
| Vehicles per Household | Owner-occupied | Renter-occupied |
| No Vehicle | 0 (0.0%) | 10 (47.6%) |
| 1 Vehicle | 81 (71.7%) | 0 (0.0%) |
| 2 Vehicles | 25 (22.1%) | 0 (0.0%) |
| 3 or more Vehicles | 7 (6.2%) | 11 (52.4%) |
| Total | 113 (100.0%) | 21 (100.0%) |
Real Estate & Mortgages in California Pines
Real Estate and Mortgage Overview in California Pines
| Characteristic | Without Mortgage | With Mortgage |
| Housing Units | 85 | 28 |
| Median Property Value | - | - |
| Median Household Income | $45,795 | $0 |
| Monthly Housing Costs | $366 | $0 |
| Real Estate Taxes | $1,413 | $0 |
Property Value by Mortgage Status in California Pines
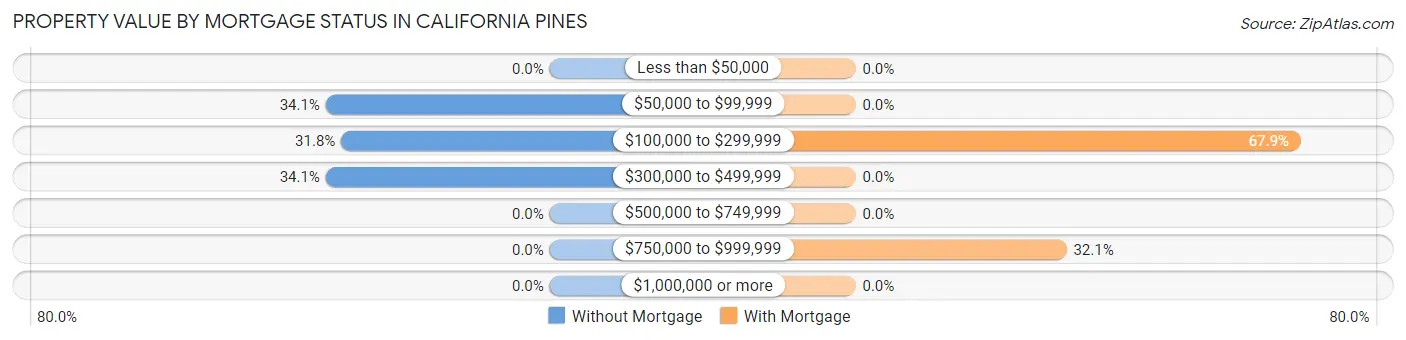
| Property Value | Without Mortgage | With Mortgage |
| Less than $50,000 | 0 (0.0%) | 0 (0.0%) |
| $50,000 to $99,999 | 29 (34.1%) | 0 (0.0%) |
| $100,000 to $299,999 | 27 (31.8%) | 19 (67.9%) |
| $300,000 to $499,999 | 29 (34.1%) | 0 (0.0%) |
| $500,000 to $749,999 | 0 (0.0%) | 0 (0.0%) |
| $750,000 to $999,999 | 0 (0.0%) | 9 (32.1%) |
| $1,000,000 or more | 0 (0.0%) | 0 (0.0%) |
| Total | 85 (100.0%) | 28 (100.0%) |
Household Income by Mortgage Status in California Pines
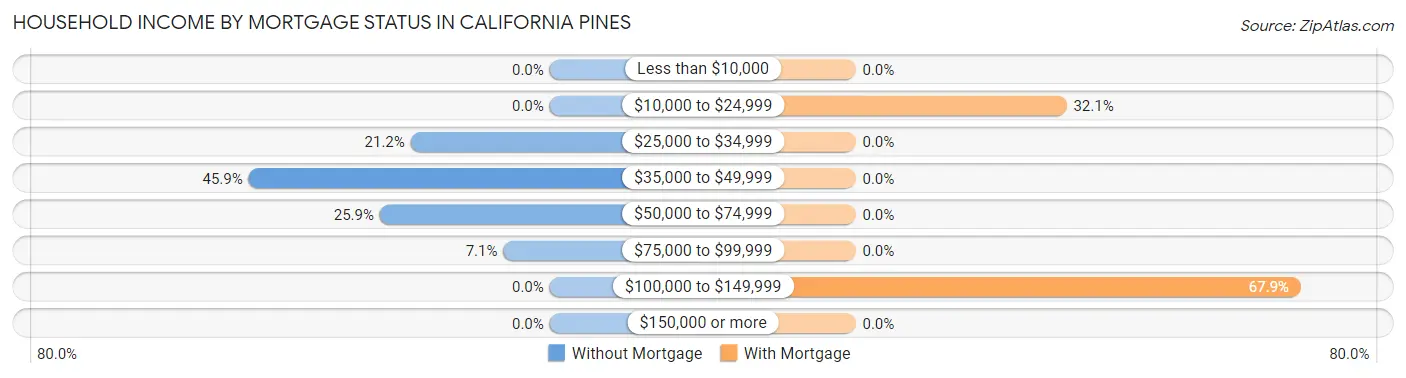
| Household Income | Without Mortgage | With Mortgage |
| Less than $10,000 | 0 (0.0%) | 0 (0.0%) |
| $10,000 to $24,999 | 0 (0.0%) | 9 (32.1%) |
| $25,000 to $34,999 | 18 (21.2%) | 0 (0.0%) |
| $35,000 to $49,999 | 39 (45.9%) | 0 (0.0%) |
| $50,000 to $74,999 | 22 (25.9%) | 0 (0.0%) |
| $75,000 to $99,999 | 6 (7.1%) | 0 (0.0%) |
| $100,000 to $149,999 | 0 (0.0%) | 19 (67.9%) |
| $150,000 or more | 0 (0.0%) | 0 (0.0%) |
| Total | 85 (100.0%) | 28 (100.0%) |
Property Value to Household Income Ratio in California Pines
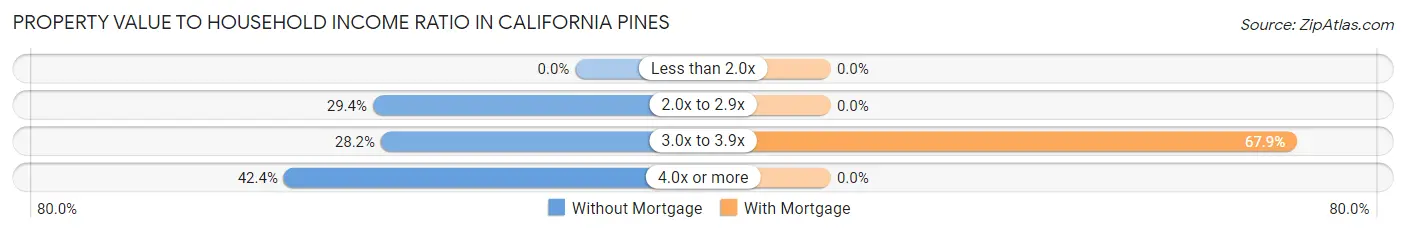
| Value-to-Income Ratio | Without Mortgage | With Mortgage |
| Less than 2.0x | 0 (0.0%) | 0 (0.0%) |
| 2.0x to 2.9x | 25 (29.4%) | 0 (0.0%) |
| 3.0x to 3.9x | 24 (28.2%) | 19 (67.9%) |
| 4.0x or more | 36 (42.3%) | 0 (0.0%) |
| Total | 85 (100.0%) | 28 (100.0%) |
Real Estate Taxes by Mortgage Status in California Pines
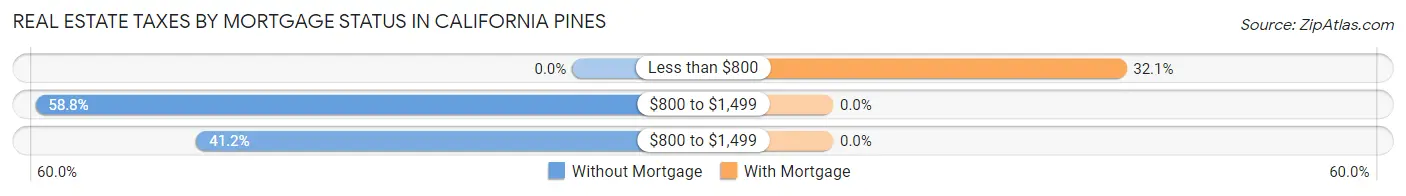
| Property Taxes | Without Mortgage | With Mortgage |
| Less than $800 | 0 (0.0%) | 9 (32.1%) |
| $800 to $1,499 | 50 (58.8%) | 0 (0.0%) |
| $800 to $1,499 | 35 (41.2%) | 0 (0.0%) |
| Total | 85 (100.0%) | 28 (100.0%) |
Health & Disability in California Pines
Health Insurance Coverage by Age in California Pines
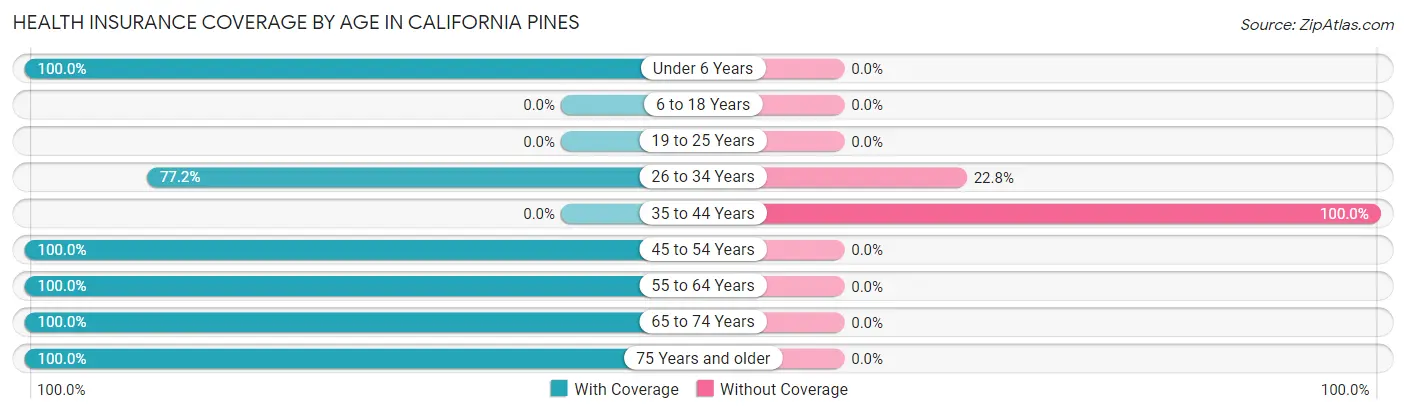
| Age Bracket | With Coverage | Without Coverage |
| Under 6 Years | 20 (100.0%) | 0 (0.0%) |
| 6 to 18 Years | 0 (0.0%) | 0 (0.0%) |
| 19 to 25 Years | 0 (0.0%) | 0 (0.0%) |
| 26 to 34 Years | 71 (77.2%) | 21 (22.8%) |
| 35 to 44 Years | 0 (0.0%) | 9 (100.0%) |
| 45 to 54 Years | 24 (100.0%) | 0 (0.0%) |
| 55 to 64 Years | 17 (100.0%) | 0 (0.0%) |
| 65 to 74 Years | 50 (100.0%) | 0 (0.0%) |
| 75 Years and older | 60 (100.0%) | 0 (0.0%) |
| Total | 242 (89.0%) | 30 (11.0%) |
Health Insurance Coverage by Citizenship Status in California Pines
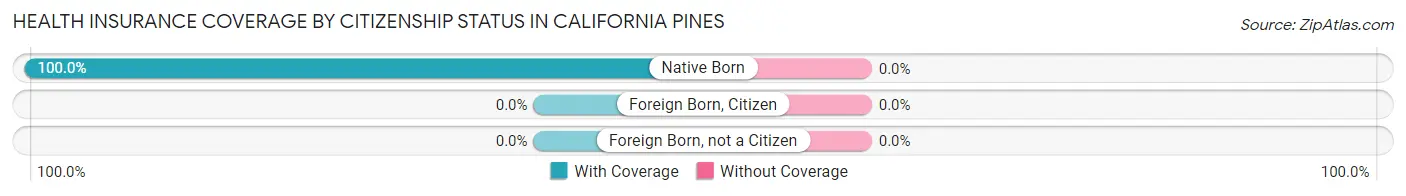
| Citizenship Status | With Coverage | Without Coverage |
| Native Born | 20 (100.0%) | 0 (0.0%) |
| Foreign Born, Citizen | 0 (0.0%) | 0 (0.0%) |
| Foreign Born, not a Citizen | 0 (0.0%) | 0 (0.0%) |
Health Insurance Coverage by Household Income in California Pines
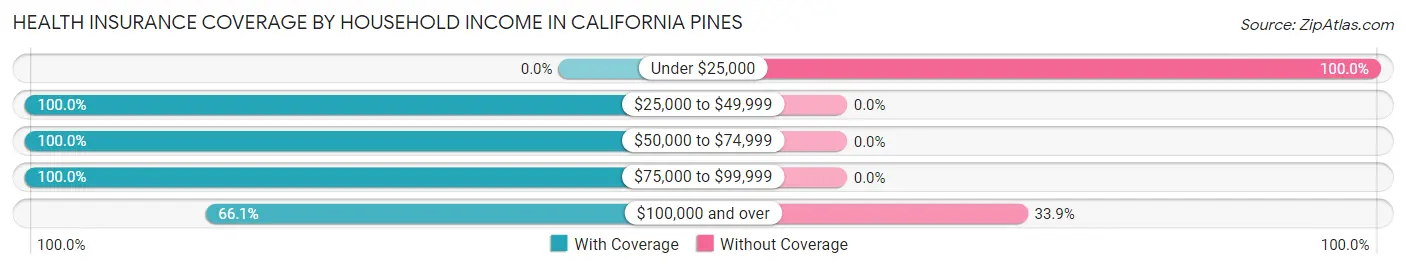
| Household Income | With Coverage | Without Coverage |
| Under $25,000 | 0 (0.0%) | 9 (100.0%) |
| $25,000 to $49,999 | 77 (100.0%) | 0 (0.0%) |
| $50,000 to $74,999 | 54 (100.0%) | 0 (0.0%) |
| $75,000 to $99,999 | 70 (100.0%) | 0 (0.0%) |
| $100,000 and over | 41 (66.1%) | 21 (33.9%) |
Public vs Private Health Insurance Coverage by Age in California Pines
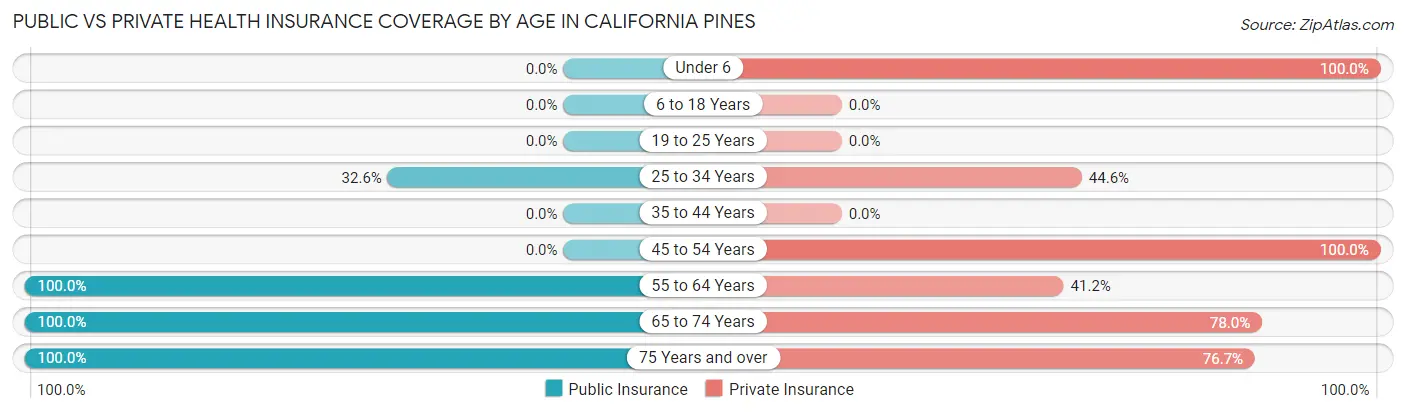
| Age Bracket | Public Insurance | Private Insurance |
| Under 6 | 0 (0.0%) | 20 (100.0%) |
| 6 to 18 Years | 0 (0.0%) | 0 (0.0%) |
| 19 to 25 Years | 0 (0.0%) | 0 (0.0%) |
| 25 to 34 Years | 30 (32.6%) | 41 (44.6%) |
| 35 to 44 Years | 0 (0.0%) | 0 (0.0%) |
| 45 to 54 Years | 0 (0.0%) | 24 (100.0%) |
| 55 to 64 Years | 17 (100.0%) | 7 (41.2%) |
| 65 to 74 Years | 50 (100.0%) | 39 (78.0%) |
| 75 Years and over | 60 (100.0%) | 46 (76.7%) |
| Total | 157 (57.7%) | 177 (65.1%) |
Disability Status by Sex by Age in California Pines
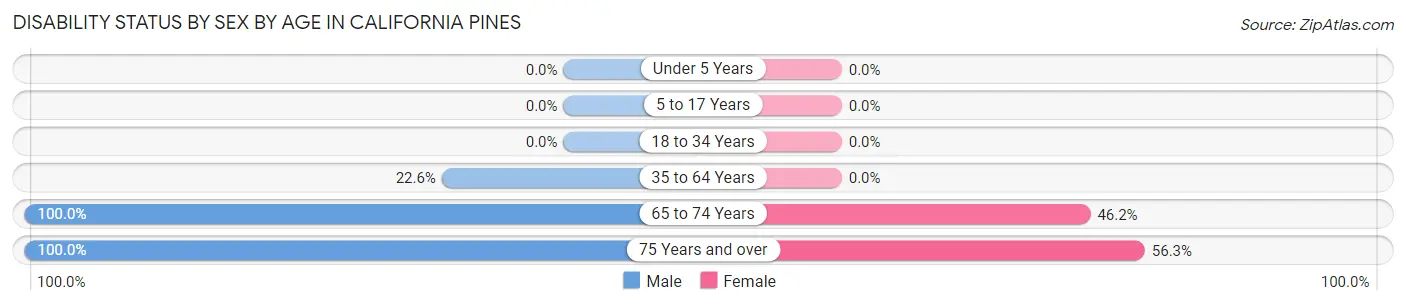
| Age Bracket | Male | Female |
| Under 5 Years | 0 (0.0%) | 0 (0.0%) |
| 5 to 17 Years | 0 (0.0%) | 0 (0.0%) |
| 18 to 34 Years | 0 (0.0%) | 0 (0.0%) |
| 35 to 64 Years | 7 (22.6%) | 0 (0.0%) |
| 65 to 74 Years | 11 (100.0%) | 18 (46.2%) |
| 75 Years and over | 28 (100.0%) | 18 (56.2%) |
Disability Class by Sex by Age in California Pines
Disability Class: Hearing Difficulty
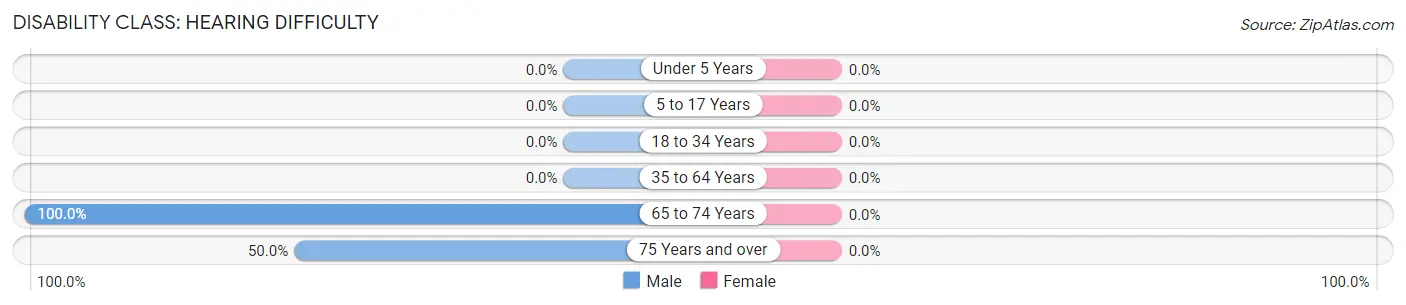
| Age Bracket | Male | Female |
| Under 5 Years | 0 (0.0%) | 0 (0.0%) |
| 5 to 17 Years | 0 (0.0%) | 0 (0.0%) |
| 18 to 34 Years | 0 (0.0%) | 0 (0.0%) |
| 35 to 64 Years | 0 (0.0%) | 0 (0.0%) |
| 65 to 74 Years | 11 (100.0%) | 0 (0.0%) |
| 75 Years and over | 14 (50.0%) | 0 (0.0%) |
Disability Class: Vision Difficulty
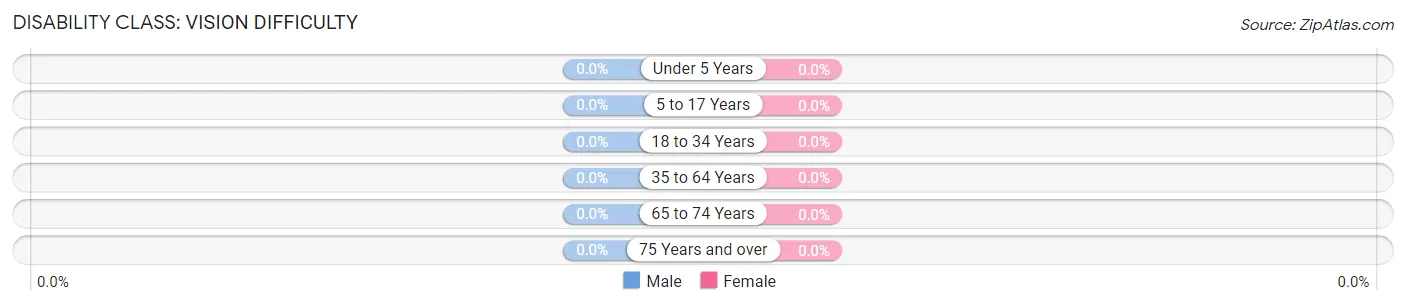
| Age Bracket | Male | Female |
| Under 5 Years | 0 (0.0%) | 0 (0.0%) |
| 5 to 17 Years | 0 (0.0%) | 0 (0.0%) |
| 18 to 34 Years | 0 (0.0%) | 0 (0.0%) |
| 35 to 64 Years | 0 (0.0%) | 0 (0.0%) |
| 65 to 74 Years | 0 (0.0%) | 0 (0.0%) |
| 75 Years and over | 0 (0.0%) | 0 (0.0%) |
Disability Class: Cognitive Difficulty
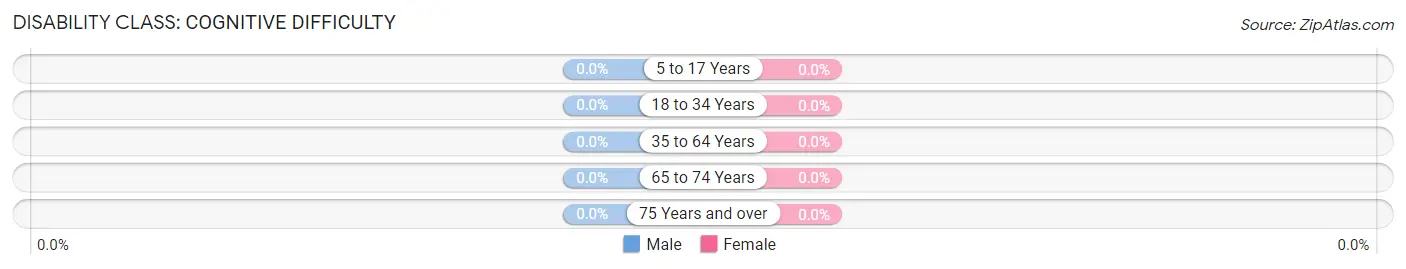
| Age Bracket | Male | Female |
| 5 to 17 Years | 0 (0.0%) | 0 (0.0%) |
| 18 to 34 Years | 0 (0.0%) | 0 (0.0%) |
| 35 to 64 Years | 0 (0.0%) | 0 (0.0%) |
| 65 to 74 Years | 0 (0.0%) | 0 (0.0%) |
| 75 Years and over | 0 (0.0%) | 0 (0.0%) |
Disability Class: Ambulatory Difficulty
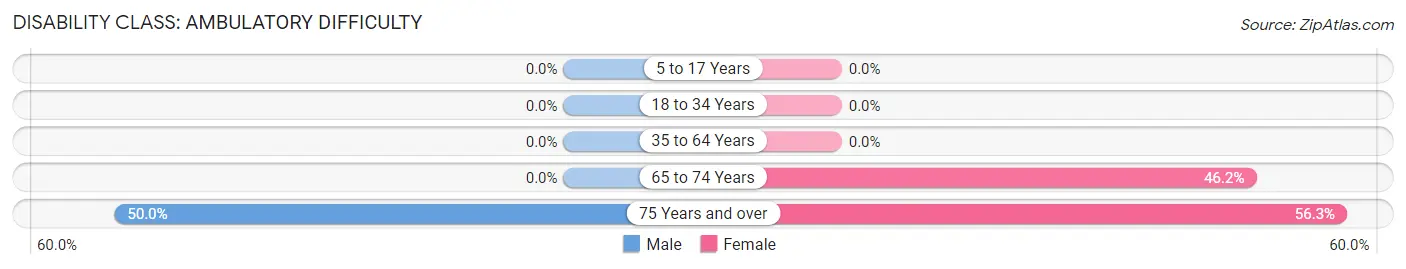
| Age Bracket | Male | Female |
| 5 to 17 Years | 0 (0.0%) | 0 (0.0%) |
| 18 to 34 Years | 0 (0.0%) | 0 (0.0%) |
| 35 to 64 Years | 0 (0.0%) | 0 (0.0%) |
| 65 to 74 Years | 0 (0.0%) | 18 (46.2%) |
| 75 Years and over | 14 (50.0%) | 18 (56.2%) |
Disability Class: Self-Care Difficulty
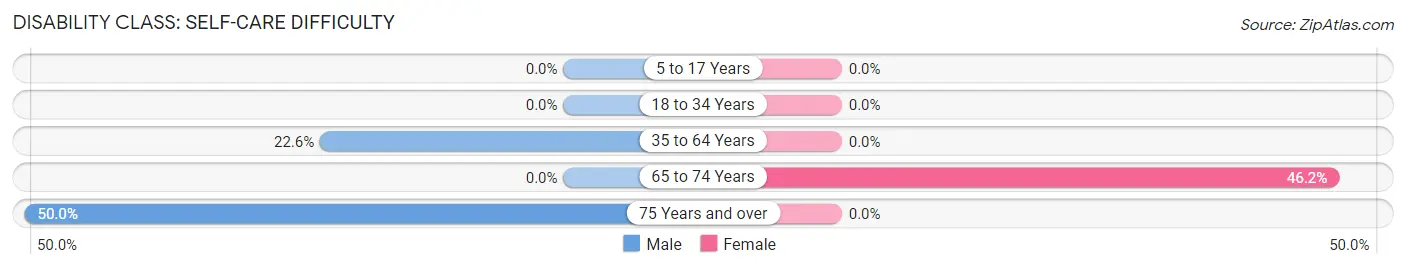
| Age Bracket | Male | Female |
| 5 to 17 Years | 0 (0.0%) | 0 (0.0%) |
| 18 to 34 Years | 0 (0.0%) | 0 (0.0%) |
| 35 to 64 Years | 7 (22.6%) | 0 (0.0%) |
| 65 to 74 Years | 0 (0.0%) | 18 (46.2%) |
| 75 Years and over | 14 (50.0%) | 0 (0.0%) |
Technology Access in California Pines
Computing Device Access in California Pines
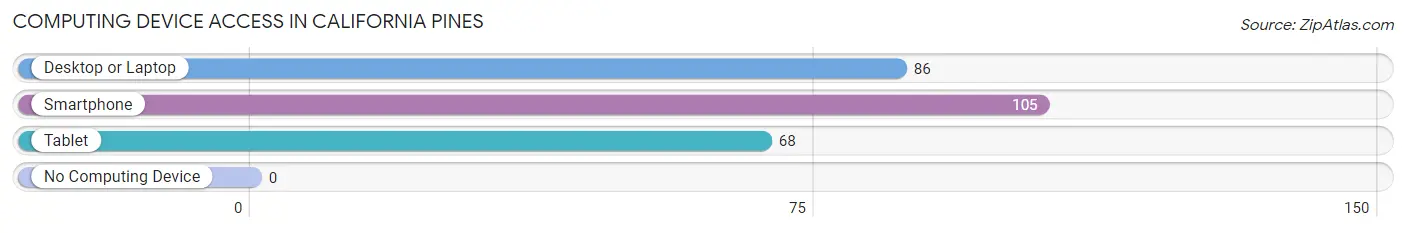
| Device Type | # Households | % Households |
| Desktop or Laptop | 86 | 64.2% |
| Smartphone | 105 | 78.4% |
| Tablet | 68 | 50.7% |
| No Computing Device | 0 | 0.0% |
| Total | 134 | 100.0% |
Internet Access in California Pines
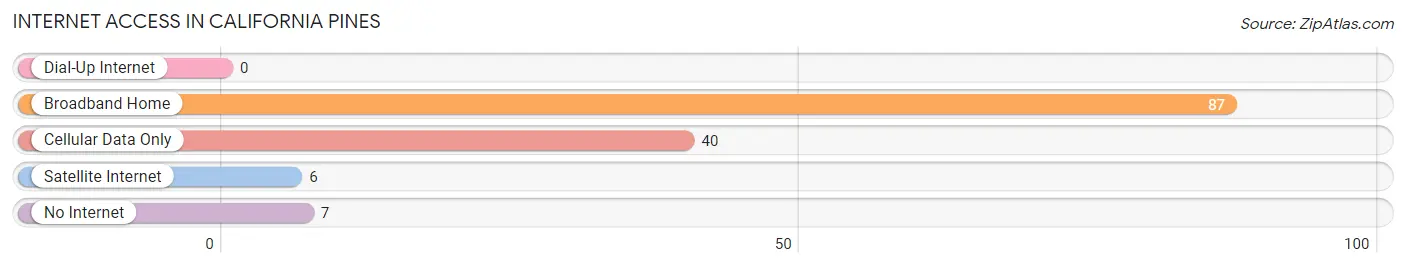
| Internet Type | # Households | % Households |
| Dial-Up Internet | 0 | 0.0% |
| Broadband Home | 87 | 64.9% |
| Cellular Data Only | 40 | 29.8% |
| Satellite Internet | 6 | 4.5% |
| No Internet | 7 | 5.2% |
| Total | 134 | 100.0% |
California Pines Summary
California Pines is a small unincorporated community located in Modoc County, California. It is situated in the far northeastern corner of the state, near the Oregon border. The community is located in the Warner Mountains, and is surrounded by the Modoc National Forest. The population of California Pines was estimated to be around 200 people in 2020.
History
The area that is now California Pines was first inhabited by the Modoc people, who lived in the area for thousands of years before the arrival of European settlers. The first Europeans to settle in the area were miners, who arrived in the late 1800s in search of gold. The town of California Pines was established in the early 1900s, and was named after the nearby Pines Creek.
The town grew slowly over the years, and by the 1950s had a population of around 200 people. The town was primarily supported by the logging industry, which provided jobs for many of the residents. In the late 1960s, the town began to decline as the logging industry began to decline. By the 1980s, the population had dropped to around 100 people.
Geography
California Pines is located in the far northeastern corner of California, near the Oregon border. The town is situated in the Warner Mountains, and is surrounded by the Modoc National Forest. The town is located at an elevation of 4,800 feet, and has a total area of 0.6 square miles. The climate in California Pines is semi-arid, with hot summers and cold winters.
Economy
The economy of California Pines is primarily supported by the logging industry. The town is home to several logging companies, which provide jobs for many of the residents. The town is also home to several small businesses, including a general store, a gas station, and a restaurant.
Demographics
The population of California Pines was estimated to be around 200 people in 2020. The town is predominantly white, with around 95% of the population identifying as white. The median household income in California Pines is around $30,000, and the median home value is around $100,000. The town has a high poverty rate, with around 25% of the population living below the poverty line.
Common Questions
What is Per Capita Income in California Pines?
Per Capita income in California Pines is $31,076.
What is the Median Family Income in California Pines?
Median Family Income in California Pines is $75,795.
What is the Median Household income in California Pines?
Median Household Income in California Pines is $47,045.
What is Income or Wage Gap in California Pines?
Income or Wage Gap in California Pines is 8.1%.
Women in California Pines earn 91.9 cents for every dollar earned by a man.
What is Inequality or Gini Index in California Pines?
Inequality or Gini Index in California Pines is 0.31.
What is the Total Population of California Pines?
Total Population of California Pines is 272.
What is the Total Male Population of California Pines?
Total Male Population of California Pines is 142.
What is the Total Female Population of California Pines?
Total Female Population of California Pines is 130.
What is the Ratio of Males per 100 Females in California Pines?
There are 109.23 Males per 100 Females in California Pines.
What is the Ratio of Females per 100 Males in California Pines?
There are 91.55 Females per 100 Males in California Pines.
What is the Median Population Age in California Pines?
Median Population Age in California Pines is 54.6 Years.
What is the Average Family Size in California Pines
Average Family Size in California Pines is 2.7 People.
What is the Average Household Size in California Pines
Average Household Size in California Pines is 2.0 People.
How Large is the Labor Force in California Pines?
There are 131 People in the Labor Forcein in California Pines.
What is the Percentage of People in the Labor Force in California Pines?
52.0% of People are in the Labor Force in California Pines.
What is the Unemployment Rate in California Pines?
Unemployment Rate in California Pines is 6.9%.