Cities with the Highest Percentage of Population Employed in Food Preparation & Serving in South Carolina
RELATED REPORTS & OPTIONS
Food Preparation & Serving
South Carolina
Compare Cities
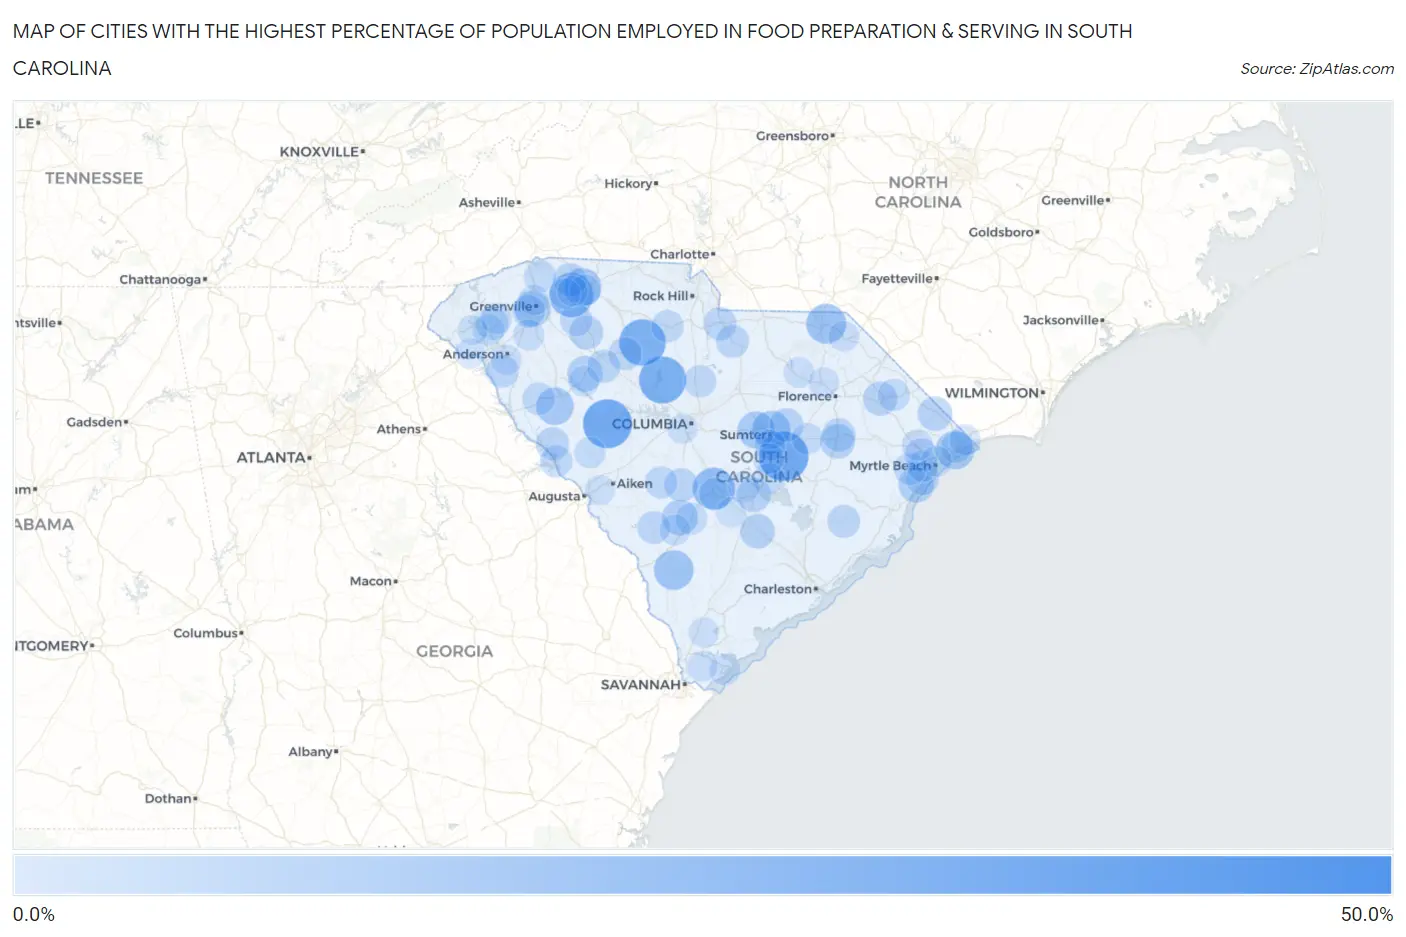
Map of Cities with the Highest Percentage of Population Employed in Food Preparation & Serving in South Carolina
0.0%
50.0%
Cities with the Highest Percentage of Population Employed in Food Preparation & Serving in South Carolina
| City | % Employed | vs State | vs National | |
| 1. | Zion | 48.3% | 5.8%(+42.5)#1 | 5.3%(+43.0)#128 |
| 2. | Alcolu | 36.8% | 5.8%(+31.0)#2 | 5.3%(+31.5)#225 |
| 3. | Saluda | 36.0% | 5.8%(+30.3)#3 | 5.3%(+30.7)#235 |
| 4. | Jenkinsville | 33.3% | 5.8%(+27.6)#4 | 5.3%(+28.0)#278 |
| 5. | Carlisle | 32.5% | 5.8%(+26.8)#5 | 5.3%(+27.2)#291 |
| 6. | Startex | 29.3% | 5.8%(+23.5)#6 | 5.3%(+24.0)#364 |
| 7. | Brookdale | 26.1% | 5.8%(+20.3)#7 | 5.3%(+20.8)#466 |
| 8. | North Santee | 25.2% | 5.8%(+19.4)#8 | 5.3%(+19.9)#495 |
| 9. | Homewood | 24.9% | 5.8%(+19.1)#9 | 5.3%(+19.6)#514 |
| 10. | Daviston | 23.7% | 5.8%(+17.9)#10 | 5.3%(+18.4)#570 |
| 11. | Wallace | 22.8% | 5.8%(+17.0)#11 | 5.3%(+17.5)#629 |
| 12. | Newtown | 22.8% | 5.8%(+17.0)#12 | 5.3%(+17.5)#631 |
| 13. | Brunson | 22.4% | 5.8%(+16.6)#13 | 5.3%(+17.1)#647 |
| 14. | Keowee Key | 21.4% | 5.8%(+15.6)#14 | 5.3%(+16.1)#718 |
| 15. | Atlantic Beach | 20.9% | 5.8%(+15.2)#15 | 5.3%(+15.6)#741 |
| 16. | Southern Shops | 20.3% | 5.8%(+14.5)#16 | 5.3%(+15.0)#810 |
| 17. | Mulberry | 20.2% | 5.8%(+14.5)#17 | 5.3%(+15.0)#811 |
| 18. | Promised Land | 19.5% | 5.8%(+13.7)#18 | 5.3%(+14.2)#893 |
| 19. | Cherryvale | 19.0% | 5.8%(+13.2)#19 | 5.3%(+13.7)#944 |
| 20. | Judson | 17.4% | 5.8%(+11.6)#20 | 5.3%(+12.1)#1,158 |
| 21. | Denmark | 16.6% | 5.8%(+10.8)#21 | 5.3%(+11.3)#1,282 |
| 22. | Mountville | 16.5% | 5.8%(+10.7)#22 | 5.3%(+11.2)#1,296 |
| 23. | Murrells Inlet | 16.3% | 5.8%(+10.5)#23 | 5.3%(+11.0)#1,339 |
| 24. | Centenary | 15.6% | 5.8%(+9.79)#24 | 5.3%(+10.3)#1,498 |
| 25. | Lake City | 15.4% | 5.8%(+9.64)#25 | 5.3%(+10.1)#1,523 |
| 26. | Harleyville | 15.3% | 5.8%(+9.52)#26 | 5.3%(+10.0)#1,561 |
| 27. | Loris | 15.1% | 5.8%(+9.34)#27 | 5.3%(+9.82)#1,595 |
| 28. | Arthurtown | 15.1% | 5.8%(+9.34)#28 | 5.3%(+9.82)#1,598 |
| 29. | Little Rock | 15.1% | 5.8%(+9.33)#29 | 5.3%(+9.82)#1,599 |
| 30. | Dunbar | 15.0% | 5.8%(+9.26)#30 | 5.3%(+9.74)#1,620 |
| 31. | Santee | 14.6% | 5.8%(+8.85)#31 | 5.3%(+9.34)#1,728 |
| 32. | Marion | 14.6% | 5.8%(+8.81)#32 | 5.3%(+9.29)#1,746 |
| 33. | Enoree | 14.6% | 5.8%(+8.80)#33 | 5.3%(+9.29)#1,748 |
| 34. | Mayesville | 14.1% | 5.8%(+8.38)#34 | 5.3%(+8.86)#1,870 |
| 35. | Inman Mills | 13.8% | 5.8%(+8.03)#35 | 5.3%(+8.52)#1,968 |
| 36. | Arkwright | 13.8% | 5.8%(+8.03)#36 | 5.3%(+8.51)#1,970 |
| 37. | Scranton | 13.8% | 5.8%(+8.01)#37 | 5.3%(+8.50)#1,975 |
| 38. | Livingston | 13.7% | 5.8%(+7.96)#38 | 5.3%(+8.44)#1,994 |
| 39. | Lancaster | 13.3% | 5.8%(+7.57)#39 | 5.3%(+8.05)#2,123 |
| 40. | Plum Branch | 13.3% | 5.8%(+7.56)#40 | 5.3%(+8.05)#2,132 |
| 41. | Heath Springs | 13.2% | 5.8%(+7.42)#41 | 5.3%(+7.90)#2,187 |
| 42. | Whitmire | 13.2% | 5.8%(+7.42)#42 | 5.3%(+7.90)#2,188 |
| 43. | Red Hill | 13.1% | 5.8%(+7.33)#43 | 5.3%(+7.82)#2,216 |
| 44. | Joanna | 13.1% | 5.8%(+7.31)#44 | 5.3%(+7.79)#2,223 |
| 45. | Barnwell | 12.8% | 5.8%(+7.03)#45 | 5.3%(+7.51)#2,349 |
| 46. | Jamestown | 12.8% | 5.8%(+7.00)#46 | 5.3%(+7.48)#2,368 |
| 47. | Clemson University | 12.7% | 5.8%(+6.97)#47 | 5.3%(+7.46)#2,373 |
| 48. | Garden City | 12.7% | 5.8%(+6.95)#48 | 5.3%(+7.44)#2,392 |
| 49. | Starr | 12.7% | 5.8%(+6.91)#49 | 5.3%(+7.39)#2,415 |
| 50. | Welcome | 12.6% | 5.8%(+6.80)#50 | 5.3%(+7.29)#2,455 |
| 51. | Modoc | 12.5% | 5.8%(+6.73)#51 | 5.3%(+7.21)#2,486 |
| 52. | Abbeville | 12.5% | 5.8%(+6.72)#52 | 5.3%(+7.21)#2,529 |
| 53. | Bucksport | 12.5% | 5.8%(+6.70)#53 | 5.3%(+7.18)#2,533 |
| 54. | Ridgeway | 12.4% | 5.8%(+6.63)#54 | 5.3%(+7.12)#2,559 |
| 55. | Woodruff | 12.4% | 5.8%(+6.61)#55 | 5.3%(+7.09)#2,571 |
| 56. | Whitney | 12.3% | 5.8%(+6.58)#56 | 5.3%(+7.06)#2,584 |
| 57. | Dovesville | 12.3% | 5.8%(+6.53)#57 | 5.3%(+7.01)#2,602 |
| 58. | Gayle Mill | 12.2% | 5.8%(+6.48)#58 | 5.3%(+6.96)#2,616 |
| 59. | Salley | 12.2% | 5.8%(+6.39)#59 | 5.3%(+6.88)#2,670 |
| 60. | Central | 12.0% | 5.8%(+6.24)#60 | 5.3%(+6.73)#2,751 |
| 61. | Mullins | 11.9% | 5.8%(+6.09)#61 | 5.3%(+6.57)#2,849 |
| 62. | Wilkinson Heights | 11.7% | 5.8%(+5.88)#62 | 5.3%(+6.37)#2,968 |
| 63. | Tigerville | 11.6% | 5.8%(+5.82)#63 | 5.3%(+6.31)#3,011 |
| 64. | Drayton | 11.5% | 5.8%(+5.72)#64 | 5.3%(+6.21)#3,075 |
| 65. | Dale | 11.5% | 5.8%(+5.71)#65 | 5.3%(+6.19)#3,080 |
| 66. | Bamberg | 11.2% | 5.8%(+5.45)#66 | 5.3%(+5.93)#3,253 |
| 67. | Clemson | 11.2% | 5.8%(+5.39)#67 | 5.3%(+5.88)#3,286 |
| 68. | Turbeville | 11.1% | 5.8%(+5.34)#68 | 5.3%(+5.83)#3,309 |
| 69. | Socastee | 10.9% | 5.8%(+5.17)#69 | 5.3%(+5.66)#3,423 |
| 70. | Summerton | 10.9% | 5.8%(+5.15)#70 | 5.3%(+5.63)#3,432 |
| 71. | North Myrtle Beach | 10.8% | 5.8%(+5.03)#71 | 5.3%(+5.51)#3,514 |
| 72. | Edgefield | 10.6% | 5.8%(+4.87)#72 | 5.3%(+5.36)#3,625 |
| 73. | Pelzer | 10.6% | 5.8%(+4.82)#73 | 5.3%(+5.30)#3,662 |
| 74. | Little River | 10.5% | 5.8%(+4.69)#74 | 5.3%(+5.17)#3,759 |
| 75. | Norris | 10.4% | 5.8%(+4.60)#75 | 5.3%(+5.08)#3,819 |
| 76. | Elloree | 10.2% | 5.8%(+4.46)#76 | 5.3%(+4.95)#3,913 |
| 77. | Conway | 10.2% | 5.8%(+4.42)#77 | 5.3%(+4.91)#3,946 |
| 78. | Lakewood | 10.2% | 5.8%(+4.42)#78 | 5.3%(+4.90)#3,953 |
| 79. | Myrtle Beach | 10.2% | 5.8%(+4.41)#79 | 5.3%(+4.89)#3,959 |
| 80. | Saxon | 10.2% | 5.8%(+4.40)#80 | 5.3%(+4.89)#3,966 |
| 81. | Paxville | 10.0% | 5.8%(+4.23)#81 | 5.3%(+4.71)#4,099 |
| 82. | Govan | 10.0% | 5.8%(+4.23)#82 | 5.3%(+4.71)#4,123 |
| 83. | Duncan | 9.8% | 5.8%(+4.06)#83 | 5.3%(+4.55)#4,239 |
| 84. | Pauline | 9.8% | 5.8%(+3.99)#84 | 5.3%(+4.47)#4,303 |
| 85. | Hartsville | 9.7% | 5.8%(+3.98)#85 | 5.3%(+4.46)#4,321 |
| 86. | Hilton Head Island | 9.7% | 5.8%(+3.96)#86 | 5.3%(+4.44)#4,334 |
| 87. | Bennettsville | 9.7% | 5.8%(+3.95)#87 | 5.3%(+4.44)#4,345 |
| 88. | Bluffton | 9.7% | 5.8%(+3.92)#88 | 5.3%(+4.40)#4,364 |
| 89. | Cross Hill | 9.7% | 5.8%(+3.91)#89 | 5.3%(+4.39)#4,371 |
| 90. | Darlington | 9.6% | 5.8%(+3.85)#90 | 5.3%(+4.34)#4,416 |
| 91. | Homeland Park | 9.6% | 5.8%(+3.82)#91 | 5.3%(+4.30)#4,456 |
| 92. | Sans Souci | 9.4% | 5.8%(+3.61)#92 | 5.3%(+4.09)#4,655 |
| 93. | Wellford | 9.3% | 5.8%(+3.54)#93 | 5.3%(+4.03)#4,733 |
| 94. | Ridgeland | 9.2% | 5.8%(+3.44)#94 | 5.3%(+3.92)#4,835 |
| 95. | Bowman | 9.2% | 5.8%(+3.41)#95 | 5.3%(+3.90)#4,853 |
| 96. | Fair Play | 9.2% | 5.8%(+3.39)#96 | 5.3%(+3.87)#4,883 |
| 97. | Springdale | 9.2% | 5.8%(+3.38)#97 | 5.3%(+3.87)#4,887 |
| 98. | Seneca | 9.1% | 5.8%(+3.32)#98 | 5.3%(+3.81)#4,937 |
| 99. | Finklea | 9.0% | 5.8%(+3.20)#99 | 5.3%(+3.69)#5,092 |
| 100. | Langley | 9.0% | 5.8%(+3.19)#100 | 5.3%(+3.68)#5,106 |
Common Questions
What are the Top 10 Cities with the Highest Percentage of Population Employed in Food Preparation & Serving in South Carolina?
Top 10 Cities with the Highest Percentage of Population Employed in Food Preparation & Serving in South Carolina are:
#1
36.8%
#2
36.0%
#3
33.3%
#4
32.5%
#5
29.3%
#6
26.1%
#7
22.8%
#8
22.4%
#9
20.9%
#10
20.3%
What city has the Highest Percentage of Population Employed in Food Preparation & Serving in South Carolina?
Alcolu has the Highest Percentage of Population Employed in Food Preparation & Serving in South Carolina with 36.8%.
What is the Percentage of Population Employed in Food Preparation & Serving in the State of South Carolina?
Percentage of Population Employed in Food Preparation & Serving in South Carolina is 5.8%.
What is the Percentage of Population Employed in Food Preparation & Serving in the United States?
Percentage of Population Employed in Food Preparation & Serving in the United States is 5.3%.