Meiners Oaks, CA Map & Demographics
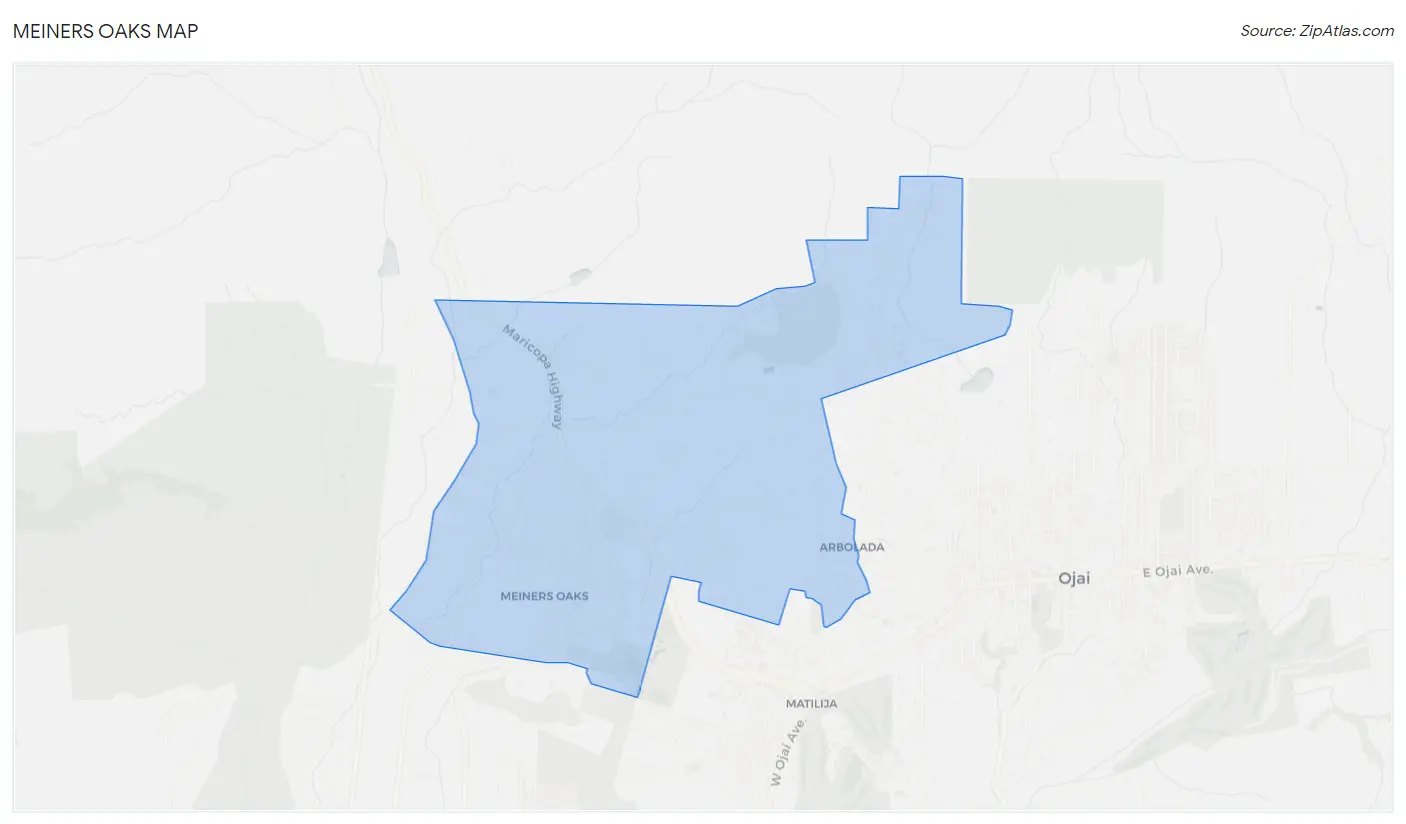
Meiners Oaks Map
Meiners Oaks Overview
$49,989
PER CAPITA INCOME
$93,750
AVG FAMILY INCOME
$87,567
AVG HOUSEHOLD INCOME
42.0%
WAGE / INCOME GAP [ % ]
58.0¢/ $1
WAGE / INCOME GAP [ $ ]
0.51
INEQUALITY / GINI INDEX
3,914
TOTAL POPULATION
1,862
MALE POPULATION
2,052
FEMALE POPULATION
90.74
MALES / 100 FEMALES
110.20
FEMALES / 100 MALES
43.5
MEDIAN AGE
3.1
AVG FAMILY SIZE
2.5
AVG HOUSEHOLD SIZE
1,770
LABOR FORCE [ PEOPLE ]
57.1%
PERCENT IN LABOR FORCE
2.6%
UNEMPLOYMENT RATE
Income in Meiners Oaks
Income Overview in Meiners Oaks
Per Capita Income in Meiners Oaks is $49,989, while median incomes of families and households are $93,750 and $87,567 respectively.
| Characteristic | Number | Measure |
| Per Capita Income | 3,914 | $49,989 |
| Median Family Income | 1,064 | $93,750 |
| Mean Family Income | 1,064 | $150,590 |
| Median Household Income | 1,513 | $87,567 |
| Mean Household Income | 1,513 | $127,140 |
| Income Deficit | 1,064 | $0 |
| Wage / Income Gap (%) | 3,914 | 42.04% |
| Wage / Income Gap ($) | 3,914 | 57.96¢ per $1 |
| Gini / Inequality Index | 3,914 | 0.51 |
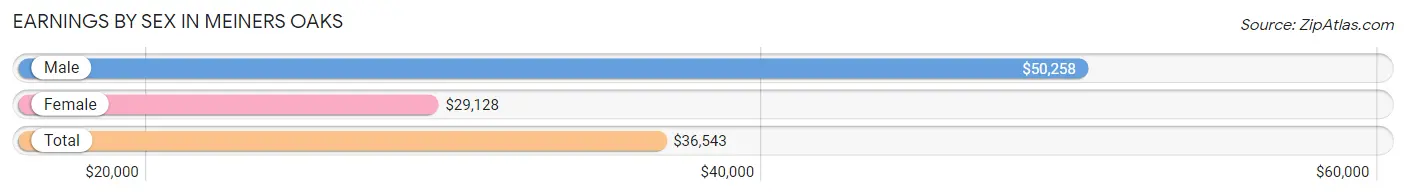
Earnings by Sex in Meiners Oaks
Average Earnings in Meiners Oaks are $36,543, $50,258 for men and $29,128 for women, a difference of 42.0%.
| Sex | Number | Average Earnings |
| Male | 866 (47.2%) | $50,258 |
| Female | 970 (52.8%) | $29,128 |
| Total | 1,836 (100.0%) | $36,543 |
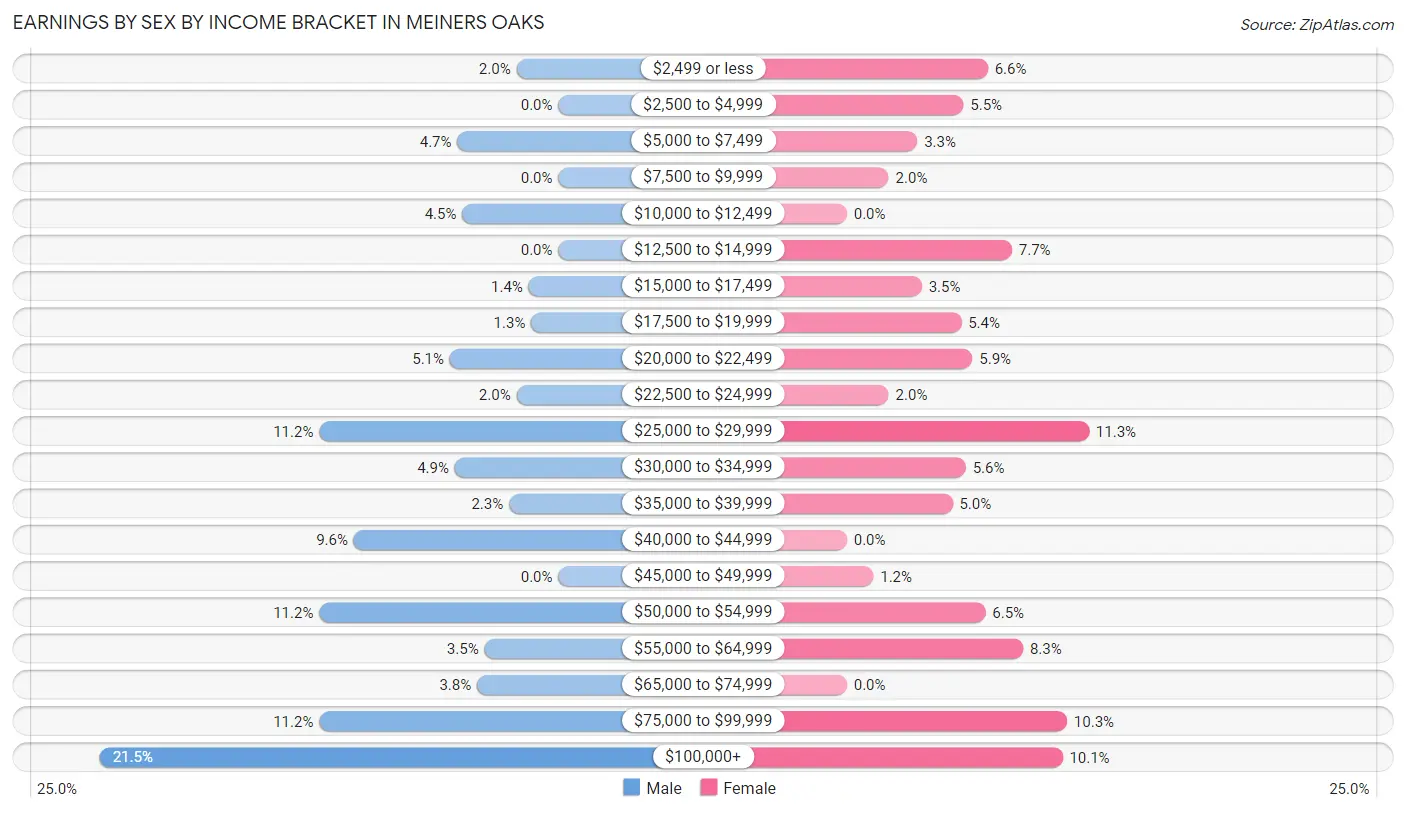
Earnings by Sex by Income Bracket in Meiners Oaks
The most common earnings brackets in Meiners Oaks are $100,000+ for men (186 | 21.5%) and $25,000 to $29,999 for women (110 | 11.3%).
| Income | Male | Female |
| $2,499 or less | 17 (2.0%) | 64 (6.6%) |
| $2,500 to $4,999 | 0 (0.0%) | 53 (5.5%) |
| $5,000 to $7,499 | 41 (4.7%) | 32 (3.3%) |
| $7,500 to $9,999 | 0 (0.0%) | 19 (2.0%) |
| $10,000 to $12,499 | 39 (4.5%) | 0 (0.0%) |
| $12,500 to $14,999 | 0 (0.0%) | 75 (7.7%) |
| $15,000 to $17,499 | 12 (1.4%) | 34 (3.5%) |
| $17,500 to $19,999 | 11 (1.3%) | 52 (5.4%) |
| $20,000 to $22,499 | 44 (5.1%) | 57 (5.9%) |
| $22,500 to $24,999 | 17 (2.0%) | 19 (2.0%) |
| $25,000 to $29,999 | 97 (11.2%) | 110 (11.3%) |
| $30,000 to $34,999 | 42 (4.9%) | 54 (5.6%) |
| $35,000 to $39,999 | 20 (2.3%) | 48 (5.0%) |
| $40,000 to $44,999 | 83 (9.6%) | 0 (0.0%) |
| $45,000 to $49,999 | 0 (0.0%) | 12 (1.2%) |
| $50,000 to $54,999 | 97 (11.2%) | 63 (6.5%) |
| $55,000 to $64,999 | 30 (3.5%) | 80 (8.3%) |
| $65,000 to $74,999 | 33 (3.8%) | 0 (0.0%) |
| $75,000 to $99,999 | 97 (11.2%) | 100 (10.3%) |
| $100,000+ | 186 (21.5%) | 98 (10.1%) |
| Total | 866 (100.0%) | 970 (100.0%) |
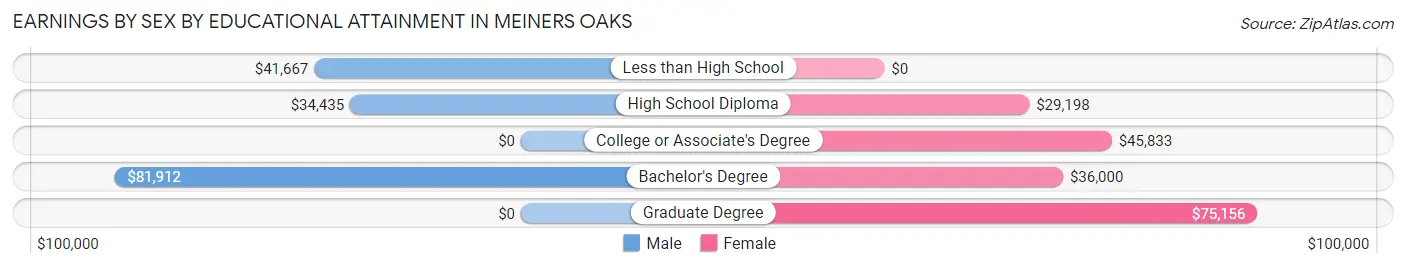
Earnings by Sex by Educational Attainment in Meiners Oaks
Average earnings in Meiners Oaks are $51,327 for men and $34,630 for women, a difference of 32.5%. Men with an educational attainment of bachelor's degree enjoy the highest average annual earnings of $81,912, while those with high school diploma education earn the least with $34,435. Women with an educational attainment of graduate degree earn the most with the average annual earnings of $75,156, while those with high school diploma education have the smallest earnings of $29,198.
| Educational Attainment | Male Income | Female Income |
| Less than High School | $41,667 | $0 |
| High School Diploma | $34,435 | $29,198 |
| College or Associate's Degree | - | - |
| Bachelor's Degree | $81,912 | $36,000 |
| Graduate Degree | - | - |
| Total | $51,327 | $34,630 |
Family Income in Meiners Oaks
Family Income Brackets in Meiners Oaks
According to the Meiners Oaks family income data, there are 262 families falling into the $100,000 to $149,999 income range, which is the most common income bracket and makes up 24.6% of all families.
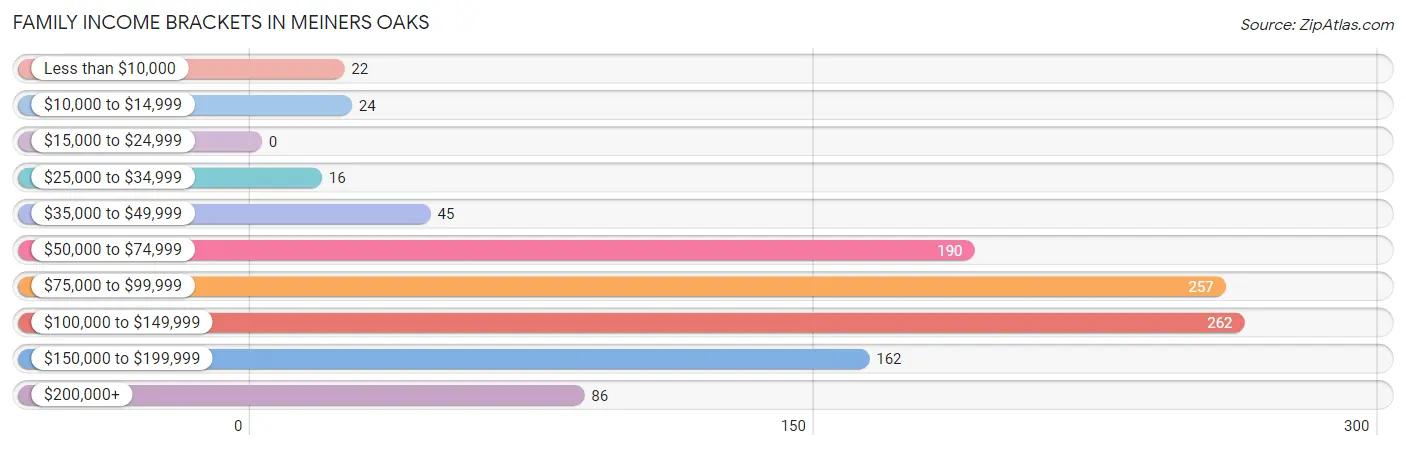
| Income Bracket | # Families | % Families |
| Less than $10,000 | 22 | 2.1% |
| $10,000 to $14,999 | 24 | 2.3% |
| $15,000 to $24,999 | 0 | 0.0% |
| $25,000 to $34,999 | 16 | 1.5% |
| $35,000 to $49,999 | 45 | 4.2% |
| $50,000 to $74,999 | 190 | 17.9% |
| $75,000 to $99,999 | 257 | 24.2% |
| $100,000 to $149,999 | 262 | 24.6% |
| $150,000 to $199,999 | 162 | 15.2% |
| $200,000+ | 86 | 8.1% |
Family Income by Famaliy Size in Meiners Oaks
4-person families (189 | 17.8%) account for the highest median family income in Meiners Oaks with $117,542 per family, while 2-person families (578 | 54.3%) have the highest median income of $44,358 per family member.
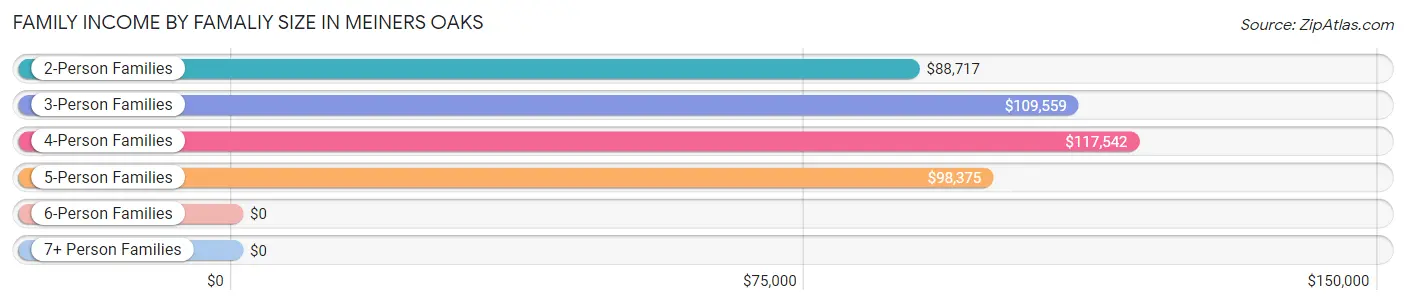
| Income Bracket | # Families | Median Income |
| 2-Person Families | 578 (54.3%) | $88,717 |
| 3-Person Families | 178 (16.7%) | $109,559 |
| 4-Person Families | 189 (17.8%) | $117,542 |
| 5-Person Families | 61 (5.7%) | $98,375 |
| 6-Person Families | 41 (3.8%) | $0 |
| 7+ Person Families | 17 (1.6%) | $0 |
| Total | 1,064 (100.0%) | $93,750 |
Family Income by Number of Earners in Meiners Oaks
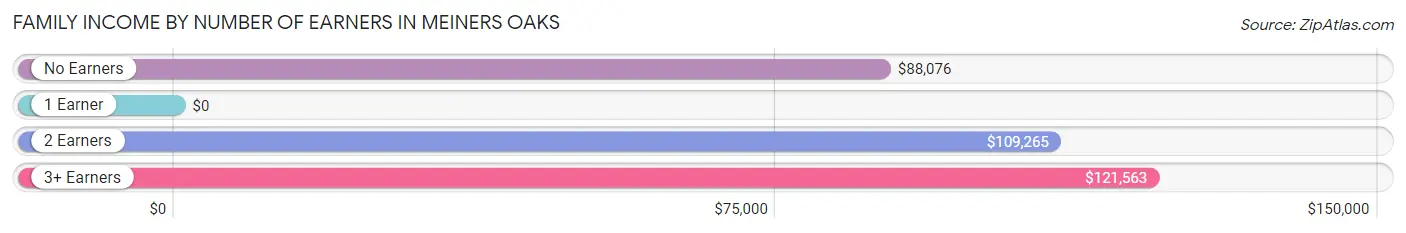
| Number of Earners | # Families | Median Income |
| No Earners | 257 (24.1%) | $88,076 |
| 1 Earner | 306 (28.8%) | $0 |
| 2 Earners | 368 (34.6%) | $109,265 |
| 3+ Earners | 133 (12.5%) | $121,563 |
| Total | 1,064 (100.0%) | $93,750 |
Household Income in Meiners Oaks
Household Income Brackets in Meiners Oaks
With 284 households falling in the category, the $75,000 to $99,999 income range is the most frequent in Meiners Oaks, accounting for 18.8% of all households. In contrast, only 23 households (1.5%) fall into the less than $10,000 income bracket, making it the least populous group.
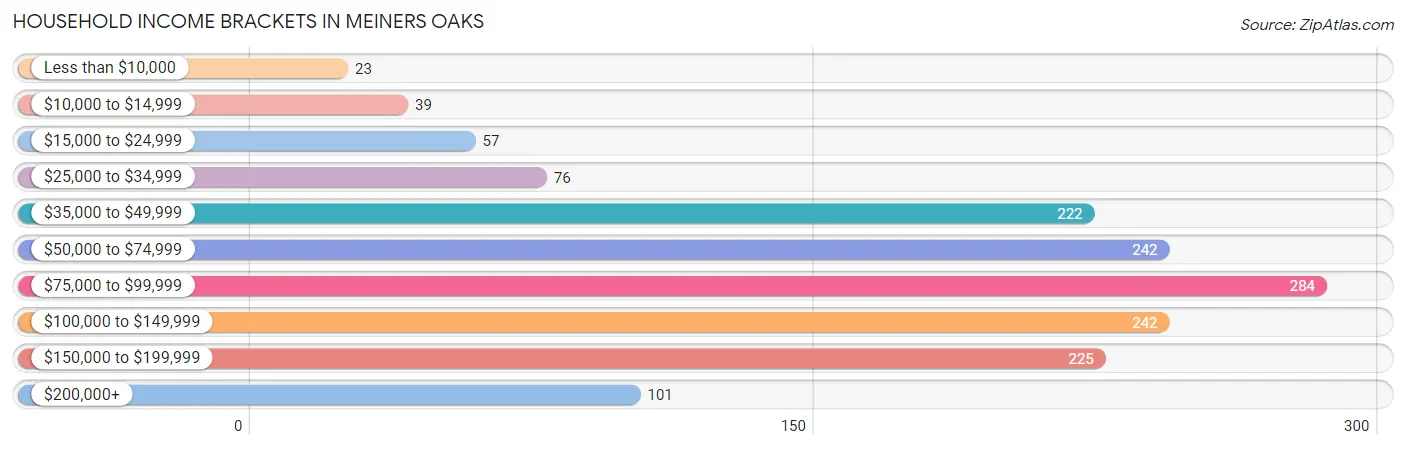
| Income Bracket | # Households | % Households |
| Less than $10,000 | 23 | 1.5% |
| $10,000 to $14,999 | 39 | 2.6% |
| $15,000 to $24,999 | 57 | 3.8% |
| $25,000 to $34,999 | 76 | 5.0% |
| $35,000 to $49,999 | 222 | 14.7% |
| $50,000 to $74,999 | 242 | 16.0% |
| $75,000 to $99,999 | 284 | 18.8% |
| $100,000 to $149,999 | 242 | 16.0% |
| $150,000 to $199,999 | 225 | 14.9% |
| $200,000+ | 101 | 6.7% |
Household Income by Householder Age in Meiners Oaks
The median household income in Meiners Oaks is $87,567, with the highest median household income of $109,706 found in the 45 to 64 years age bracket for the primary householder. A total of 408 households (27.0%) fall into this category.
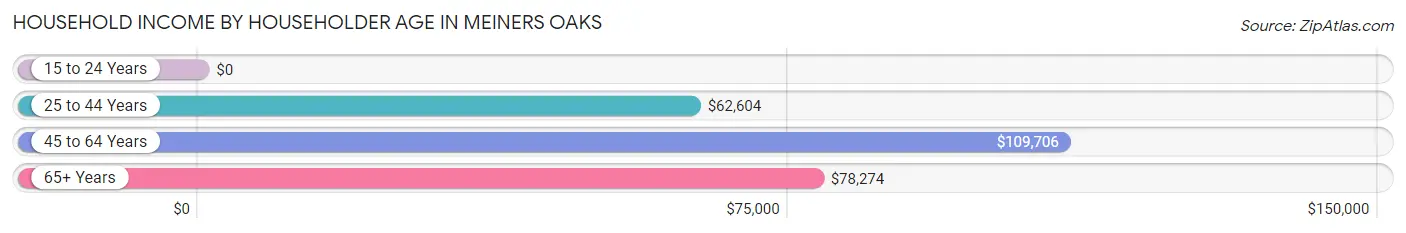
| Income Bracket | # Households | Median Income |
| 15 to 24 Years | 0 (0.0%) | $0 |
| 25 to 44 Years | 482 (31.9%) | $62,604 |
| 45 to 64 Years | 408 (27.0%) | $109,706 |
| 65+ Years | 623 (41.2%) | $78,274 |
| Total | 1,513 (100.0%) | $87,567 |
Poverty in Meiners Oaks
Income Below Poverty by Sex and Age in Meiners Oaks
With 5.5% poverty level for males and 4.8% for females among the residents of Meiners Oaks, under 5 year old males and 6 to 11 year old females are the most vulnerable to poverty, with 30 males (21.1%) and 28 females (22.4%) in their respective age groups living below the poverty level.
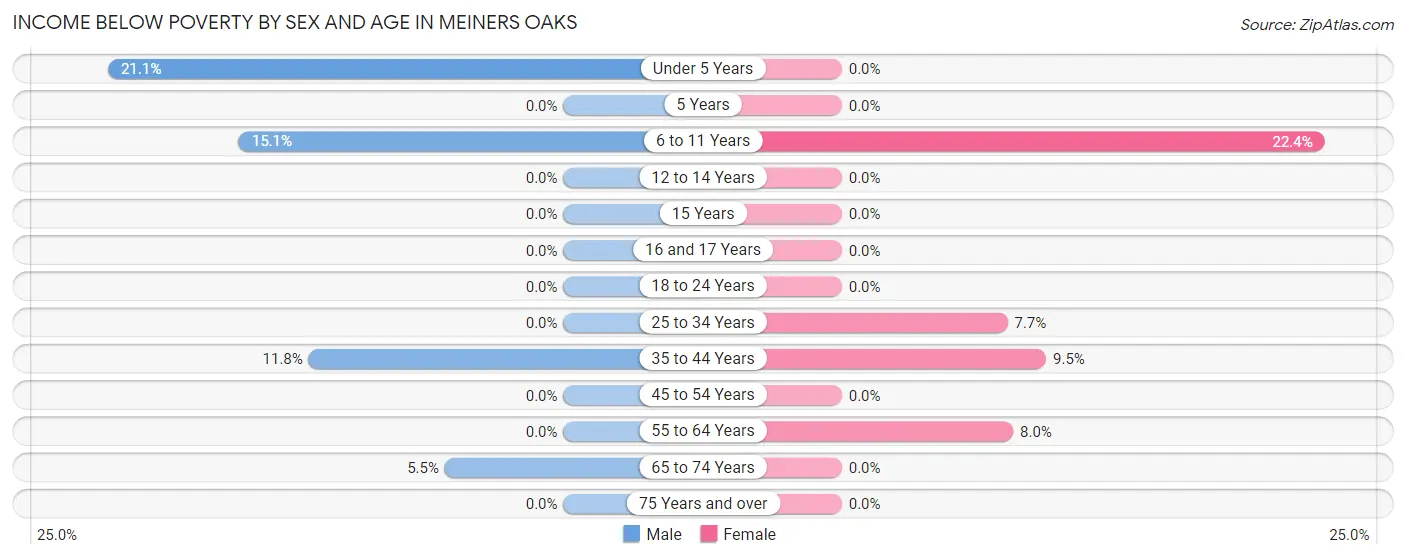
| Age Bracket | Male | Female |
| Under 5 Years | 30 (21.1%) | 0 (0.0%) |
| 5 Years | 0 (0.0%) | 0 (0.0%) |
| 6 to 11 Years | 25 (15.1%) | 28 (22.4%) |
| 12 to 14 Years | 0 (0.0%) | 0 (0.0%) |
| 15 Years | 0 (0.0%) | 0 (0.0%) |
| 16 and 17 Years | 0 (0.0%) | 0 (0.0%) |
| 18 to 24 Years | 0 (0.0%) | 0 (0.0%) |
| 25 to 34 Years | 0 (0.0%) | 24 (7.7%) |
| 35 to 44 Years | 26 (11.8%) | 22 (9.5%) |
| 45 to 54 Years | 0 (0.0%) | 0 (0.0%) |
| 55 to 64 Years | 0 (0.0%) | 24 (8.0%) |
| 65 to 74 Years | 21 (5.5%) | 0 (0.0%) |
| 75 Years and over | 0 (0.0%) | 0 (0.0%) |
| Total | 102 (5.5%) | 98 (4.8%) |
Income Above Poverty by Sex and Age in Meiners Oaks
According to the poverty statistics in Meiners Oaks, males aged 5 years and females aged under 5 years are the age groups that are most secure financially, with 100.0% of males and 100.0% of females in these age groups living above the poverty line.
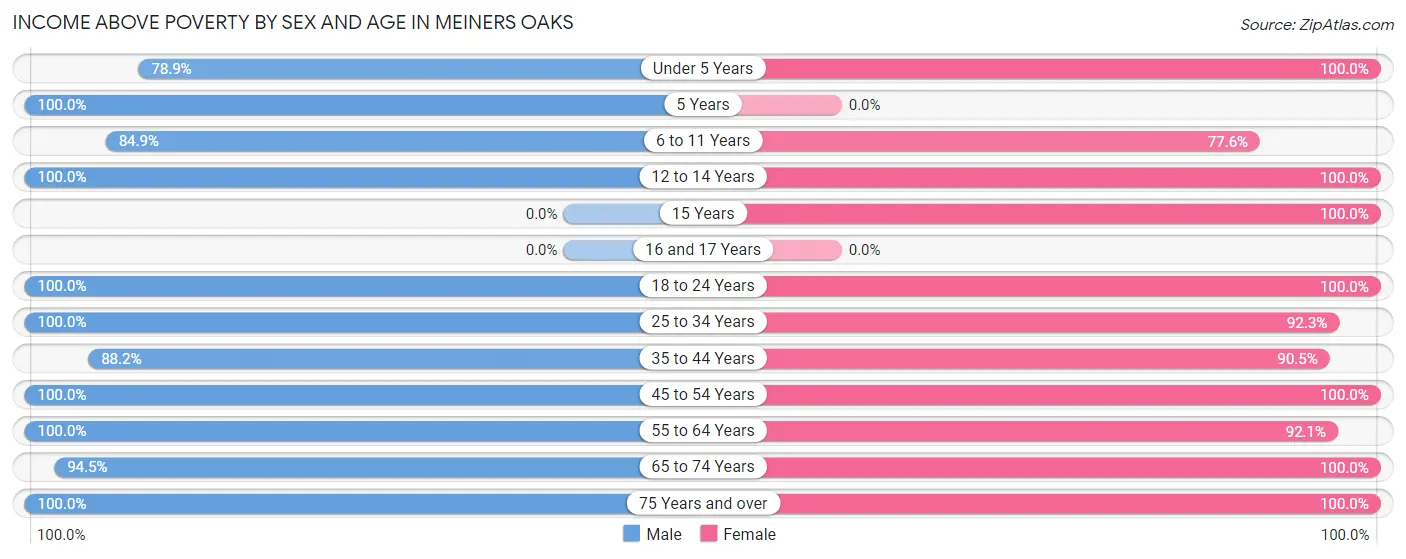
| Age Bracket | Male | Female |
| Under 5 Years | 112 (78.9%) | 168 (100.0%) |
| 5 Years | 18 (100.0%) | 0 (0.0%) |
| 6 to 11 Years | 141 (84.9%) | 97 (77.6%) |
| 12 to 14 Years | 77 (100.0%) | 83 (100.0%) |
| 15 Years | 0 (0.0%) | 35 (100.0%) |
| 16 and 17 Years | 0 (0.0%) | 0 (0.0%) |
| 18 to 24 Years | 83 (100.0%) | 152 (100.0%) |
| 25 to 34 Years | 205 (100.0%) | 288 (92.3%) |
| 35 to 44 Years | 194 (88.2%) | 210 (90.5%) |
| 45 to 54 Years | 102 (100.0%) | 188 (100.0%) |
| 55 to 64 Years | 183 (100.0%) | 278 (92.0%) |
| 65 to 74 Years | 361 (94.5%) | 344 (100.0%) |
| 75 Years and over | 284 (100.0%) | 111 (100.0%) |
| Total | 1,760 (94.5%) | 1,954 (95.2%) |
Income Below Poverty Among Married-Couple Families in Meiners Oaks
The poverty statistics for married-couple families in Meiners Oaks show that 2.6% or 24 of the total 921 families live below the poverty line. Families with 1 or 2 children have the highest poverty rate of 9.6%, comprising of 24 families. On the other hand, families with no children have the lowest poverty rate of 0.0%, which includes 0 families.
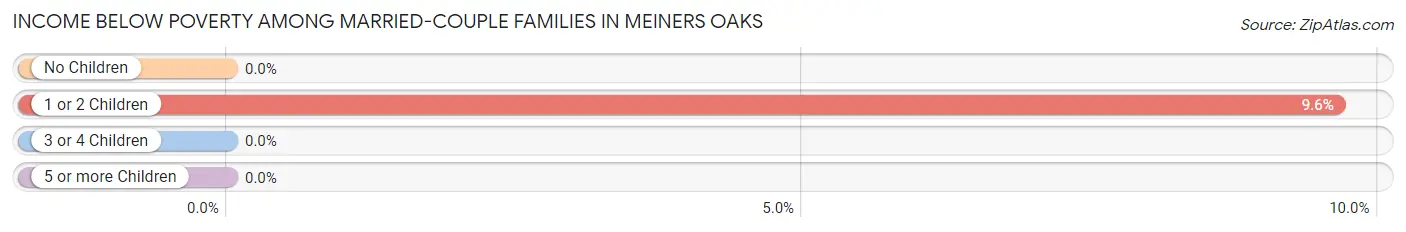
| Children | Above Poverty | Below Poverty |
| No Children | 604 (100.0%) | 0 (0.0%) |
| 1 or 2 Children | 225 (90.4%) | 24 (9.6%) |
| 3 or 4 Children | 68 (100.0%) | 0 (0.0%) |
| 5 or more Children | 0 (0.0%) | 0 (0.0%) |
| Total | 897 (97.4%) | 24 (2.6%) |
Income Below Poverty Among Single-Parent Households in Meiners Oaks
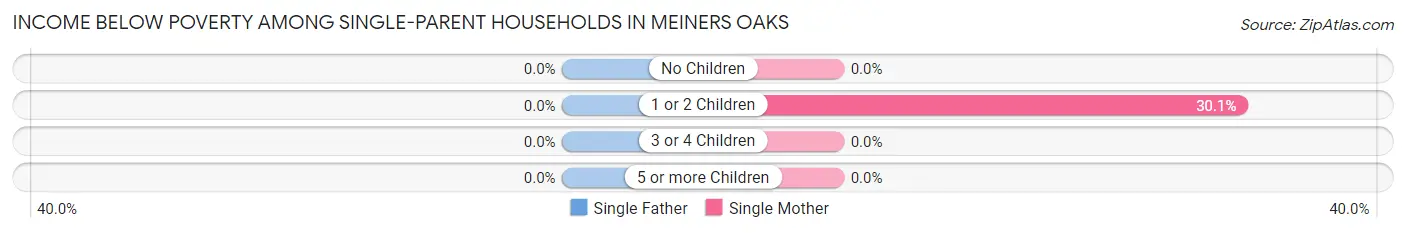
| Children | Single Father | Single Mother |
| No Children | 0 (0.0%) | 0 (0.0%) |
| 1 or 2 Children | 0 (0.0%) | 22 (30.1%) |
| 3 or 4 Children | 0 (0.0%) | 0 (0.0%) |
| 5 or more Children | 0 (0.0%) | 0 (0.0%) |
| Total | 0 (0.0%) | 22 (16.5%) |
Income Below Poverty Among Married-Couple vs Single-Parent Households in Meiners Oaks
The poverty data for Meiners Oaks shows that 24 of the married-couple family households (2.6%) and 22 of the single-parent households (15.4%) are living below the poverty level. Within the married-couple family households, those with 1 or 2 children have the highest poverty rate, with 24 households (9.6%) falling below the poverty line. Among the single-parent households, those with 1 or 2 children have the highest poverty rate, with 22 household (26.5%) living below poverty.
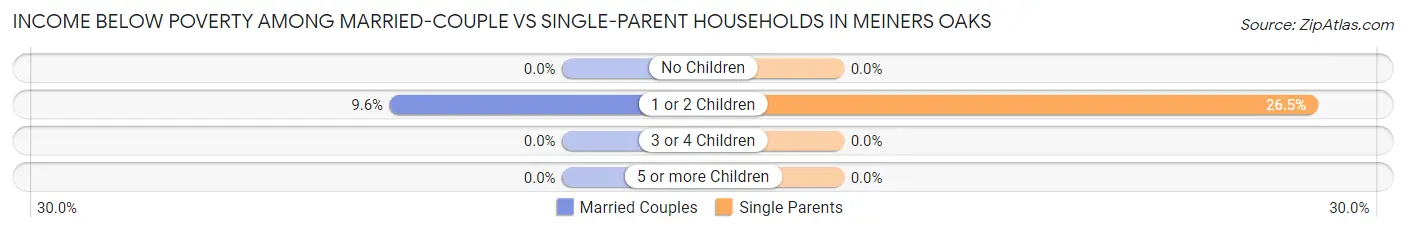
| Children | Married-Couple Families | Single-Parent Households |
| No Children | 0 (0.0%) | 0 (0.0%) |
| 1 or 2 Children | 24 (9.6%) | 22 (26.5%) |
| 3 or 4 Children | 0 (0.0%) | 0 (0.0%) |
| 5 or more Children | 0 (0.0%) | 0 (0.0%) |
| Total | 24 (2.6%) | 22 (15.4%) |
Race in Meiners Oaks
The most populous races in Meiners Oaks are White / Caucasian (3,160 | 80.7%), Hispanic or Latino (907 | 23.2%), and Two or more Races (461 | 11.8%).
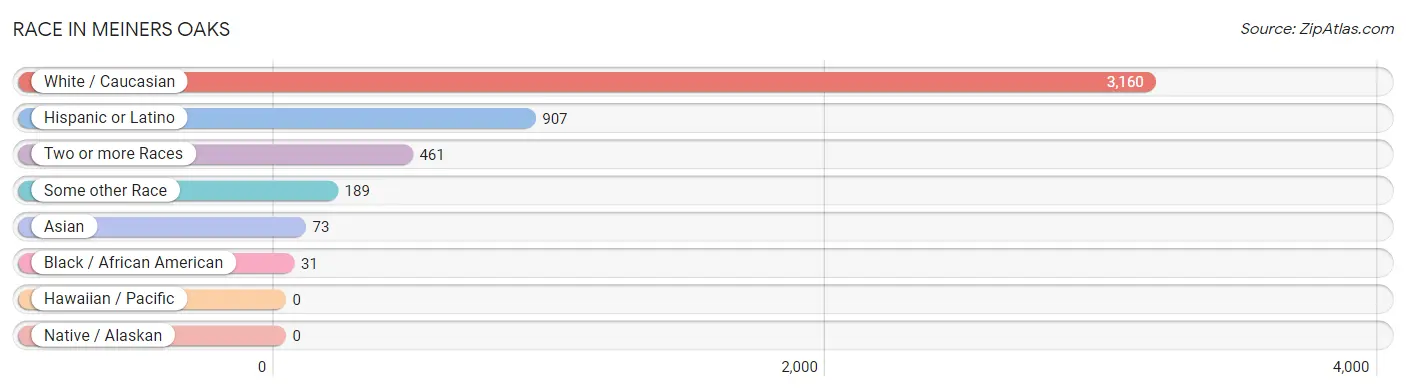
| Race | # Population | % Population |
| Asian | 73 | 1.9% |
| Black / African American | 31 | 0.8% |
| Hawaiian / Pacific | 0 | 0.0% |
| Hispanic or Latino | 907 | 23.2% |
| Native / Alaskan | 0 | 0.0% |
| White / Caucasian | 3,160 | 80.7% |
| Two or more Races | 461 | 11.8% |
| Some other Race | 189 | 4.8% |
| Total | 3,914 | 100.0% |
Ancestry in Meiners Oaks
The most populous ancestries reported in Meiners Oaks are German (741 | 18.9%), Mexican (734 | 18.8%), Irish (676 | 17.3%), English (489 | 12.5%), and American (452 | 11.6%), together accounting for 79.0% of all Meiners Oaks residents.
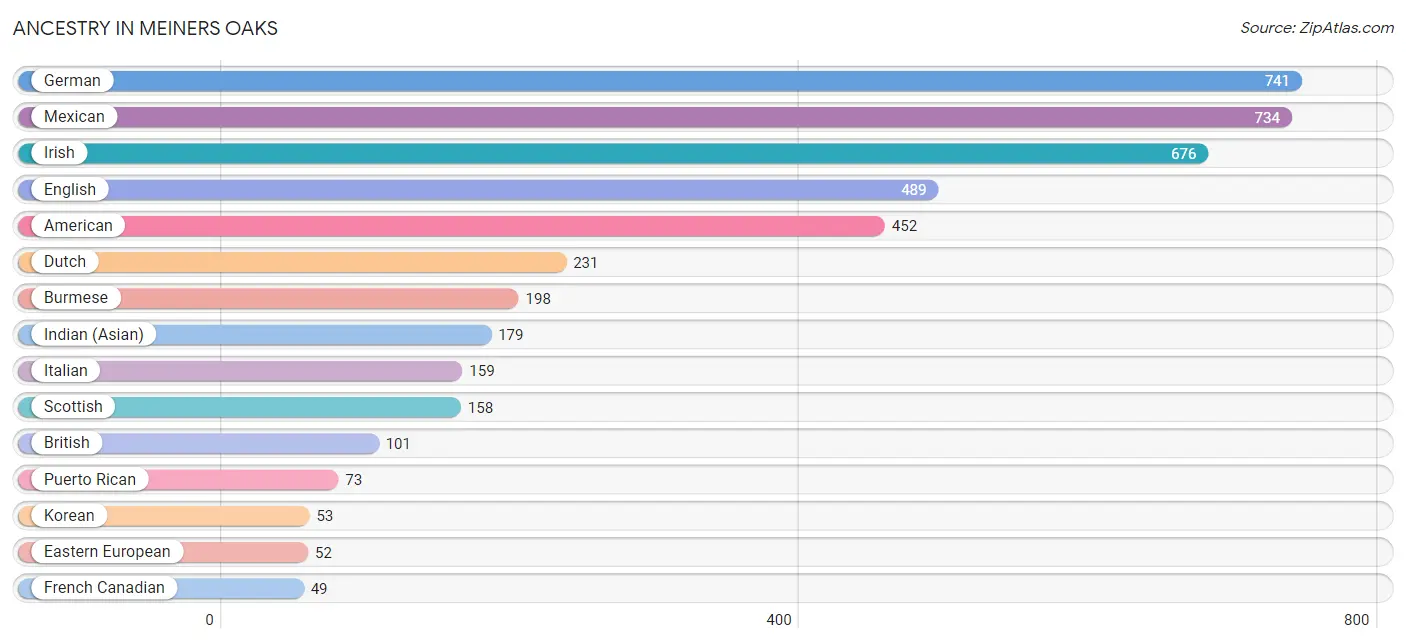
| Ancestry | # Population | % Population |
| American | 452 | 11.6% |
| Bhutanese | 14 | 0.4% |
| British | 101 | 2.6% |
| Burmese | 198 | 5.1% |
| Canadian | 13 | 0.3% |
| Colombian | 47 | 1.2% |
| Danish | 17 | 0.4% |
| Dutch | 231 | 5.9% |
| Eastern European | 52 | 1.3% |
| English | 489 | 12.5% |
| European | 36 | 0.9% |
| French Canadian | 49 | 1.3% |
| German | 741 | 18.9% |
| Indian (Asian) | 179 | 4.6% |
| Irish | 676 | 17.3% |
| Italian | 159 | 4.1% |
| Korean | 53 | 1.3% |
| Latvian | 17 | 0.4% |
| Mexican | 734 | 18.8% |
| Norwegian | 32 | 0.8% |
| Polish | 20 | 0.5% |
| Portuguese | 16 | 0.4% |
| Puerto Rican | 73 | 1.9% |
| Russian | 26 | 0.7% |
| Scandinavian | 32 | 0.8% |
| Scotch-Irish | 29 | 0.7% |
| Scottish | 158 | 4.0% |
| South American | 47 | 1.2% |
| Subsaharan African | 20 | 0.5% |
| Swedish | 43 | 1.1% |
| Welsh | 16 | 0.4% | View All 31 Rows |
Immigrants in Meiners Oaks
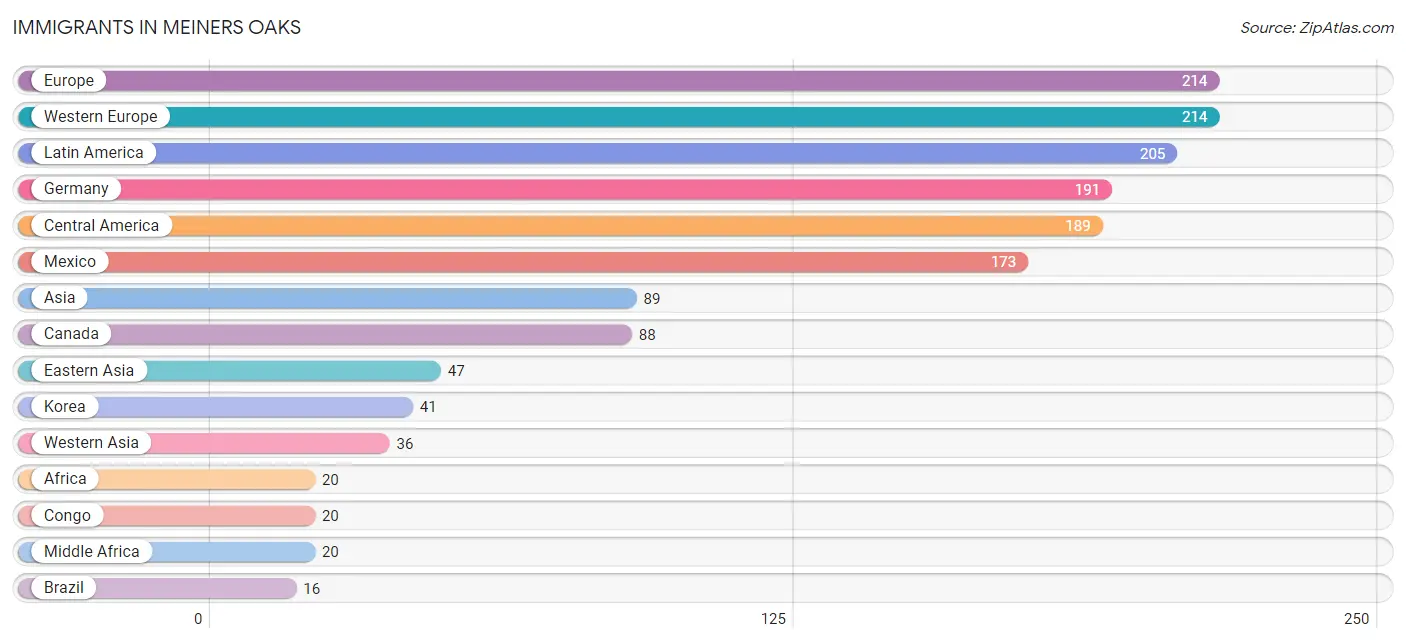
The most numerous immigrant groups reported in Meiners Oaks came from Europe (214 | 5.5%), Western Europe (214 | 5.5%), Latin America (205 | 5.2%), Germany (191 | 4.9%), and Central America (189 | 4.8%), together accounting for 25.9% of all Meiners Oaks residents.
| Immigration Origin | # Population | % Population |
| Africa | 20 | 0.5% |
| Asia | 89 | 2.3% |
| Brazil | 16 | 0.4% |
| Canada | 88 | 2.2% |
| Central America | 189 | 4.8% |
| China | 6 | 0.2% |
| Congo | 20 | 0.5% |
| Eastern Asia | 47 | 1.2% |
| El Salvador | 16 | 0.4% |
| Europe | 214 | 5.5% |
| Germany | 191 | 4.9% |
| Korea | 41 | 1.1% |
| Latin America | 205 | 5.2% |
| Mexico | 173 | 4.4% |
| Middle Africa | 20 | 0.5% |
| Netherlands | 7 | 0.2% |
| South America | 16 | 0.4% |
| South Eastern Asia | 6 | 0.2% |
| Switzerland | 16 | 0.4% |
| Vietnam | 6 | 0.2% |
| Western Asia | 36 | 0.9% |
| Western Europe | 214 | 5.5% | View All 22 Rows |
Sex and Age in Meiners Oaks
Sex and Age in Meiners Oaks
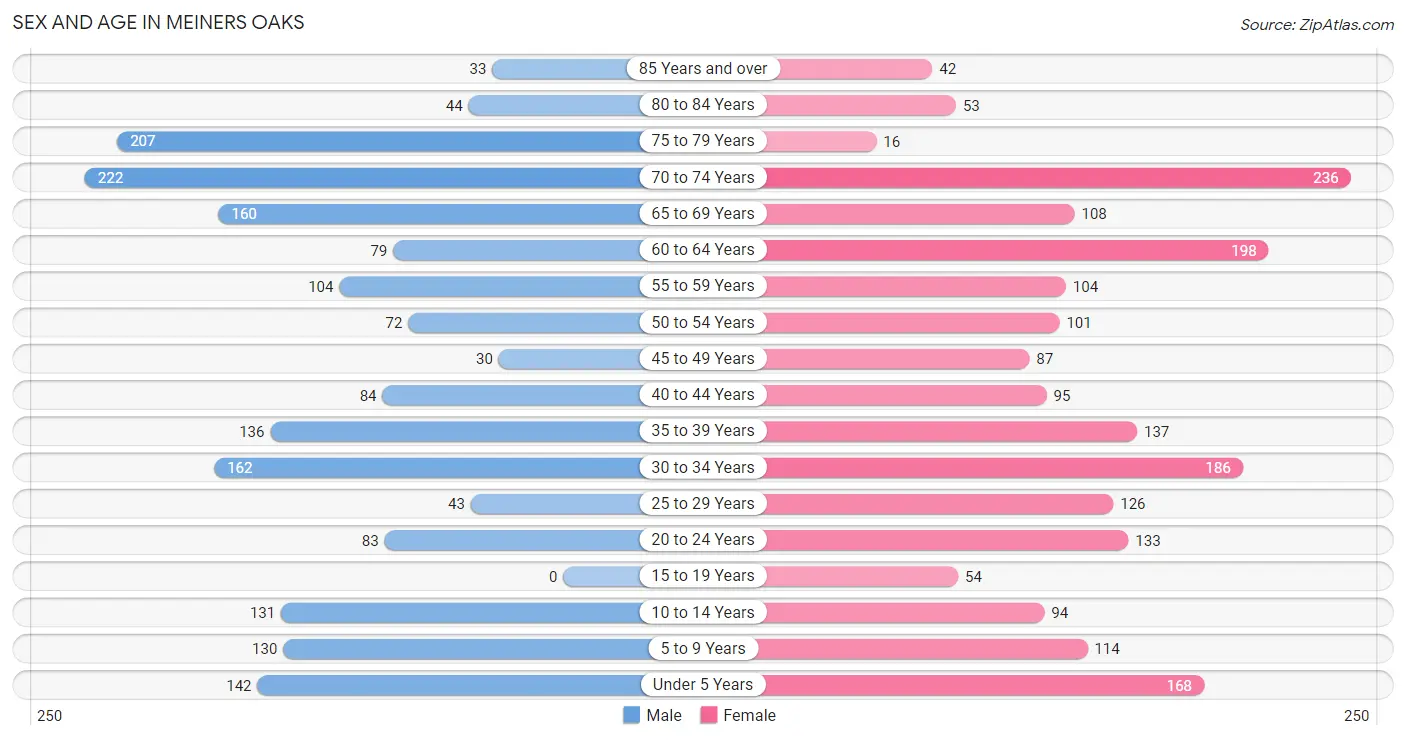
The most populous age groups in Meiners Oaks are 70 to 74 Years (222 | 11.9%) for men and 70 to 74 Years (236 | 11.5%) for women.
| Age Bracket | Male | Female |
| Under 5 Years | 142 (7.6%) | 168 (8.2%) |
| 5 to 9 Years | 130 (7.0%) | 114 (5.6%) |
| 10 to 14 Years | 131 (7.0%) | 94 (4.6%) |
| 15 to 19 Years | 0 (0.0%) | 54 (2.6%) |
| 20 to 24 Years | 83 (4.5%) | 133 (6.5%) |
| 25 to 29 Years | 43 (2.3%) | 126 (6.1%) |
| 30 to 34 Years | 162 (8.7%) | 186 (9.1%) |
| 35 to 39 Years | 136 (7.3%) | 137 (6.7%) |
| 40 to 44 Years | 84 (4.5%) | 95 (4.6%) |
| 45 to 49 Years | 30 (1.6%) | 87 (4.2%) |
| 50 to 54 Years | 72 (3.9%) | 101 (4.9%) |
| 55 to 59 Years | 104 (5.6%) | 104 (5.1%) |
| 60 to 64 Years | 79 (4.2%) | 198 (9.7%) |
| 65 to 69 Years | 160 (8.6%) | 108 (5.3%) |
| 70 to 74 Years | 222 (11.9%) | 236 (11.5%) |
| 75 to 79 Years | 207 (11.1%) | 16 (0.8%) |
| 80 to 84 Years | 44 (2.4%) | 53 (2.6%) |
| 85 Years and over | 33 (1.8%) | 42 (2.1%) |
| Total | 1,862 (100.0%) | 2,052 (100.0%) |
Families and Households in Meiners Oaks
Median Family Size in Meiners Oaks
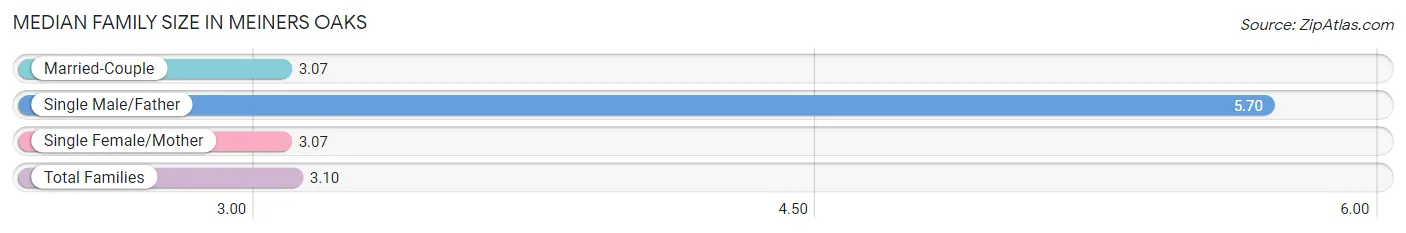
The median family size in Meiners Oaks is 3.10 persons per family, with single male/father families (10 | 0.9%) accounting for the largest median family size of 5.7 persons per family. On the other hand, married-couple families (921 | 86.6%) represent the smallest median family size with 3.07 persons per family.
| Family Type | # Families | Family Size |
| Married-Couple | 921 (86.6%) | 3.07 |
| Single Male/Father | 10 (0.9%) | 5.70 |
| Single Female/Mother | 133 (12.5%) | 3.07 |
| Total Families | 1,064 (100.0%) | 3.10 |
Median Household Size in Meiners Oaks
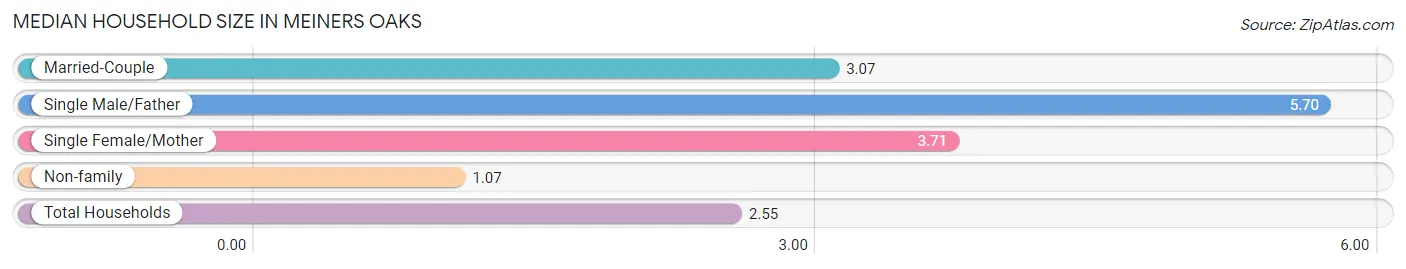
The median household size in Meiners Oaks is 2.55 persons per household, with single male/father households (10 | 0.7%) accounting for the largest median household size of 5.7 persons per household. non-family households (449 | 29.7%) represent the smallest median household size with 1.07 persons per household.
| Household Type | # Households | Household Size |
| Married-Couple | 921 (60.9%) | 3.07 |
| Single Male/Father | 10 (0.7%) | 5.70 |
| Single Female/Mother | 133 (8.8%) | 3.71 |
| Non-family | 449 (29.7%) | 1.07 |
| Total Households | 1,513 (100.0%) | 2.55 |
Household Size by Marriage Status in Meiners Oaks
Out of a total of 1,513 households in Meiners Oaks, 1,064 (70.3%) are family households, while 449 (29.7%) are nonfamily households. The most numerous type of family households are 2-person households, comprising 557, and the most common type of nonfamily households are 1-person households, comprising 417.
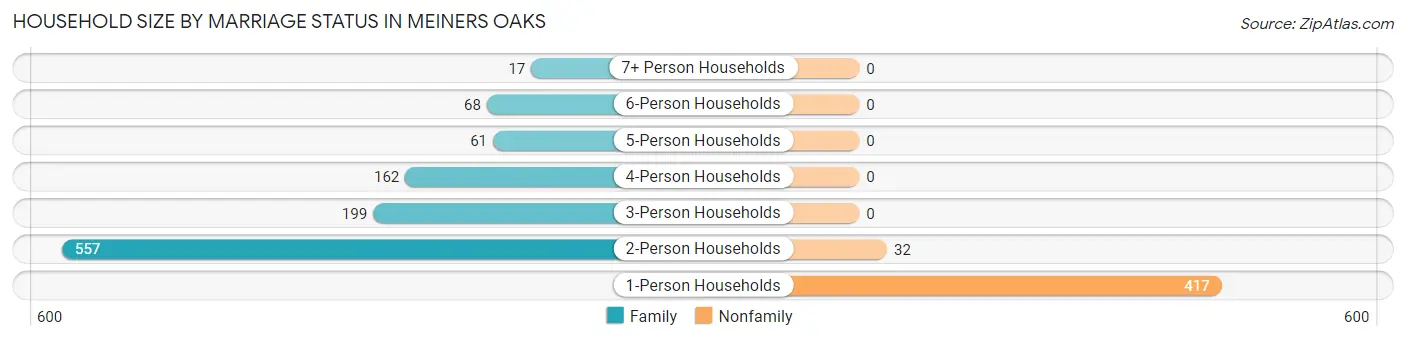
| Household Size | Family Households | Nonfamily Households |
| 1-Person Households | - | 417 (27.6%) |
| 2-Person Households | 557 (36.8%) | 32 (2.1%) |
| 3-Person Households | 199 (13.2%) | 0 (0.0%) |
| 4-Person Households | 162 (10.7%) | 0 (0.0%) |
| 5-Person Households | 61 (4.0%) | 0 (0.0%) |
| 6-Person Households | 68 (4.5%) | 0 (0.0%) |
| 7+ Person Households | 17 (1.1%) | 0 (0.0%) |
| Total | 1,064 (70.3%) | 449 (29.7%) |
Female Fertility in Meiners Oaks
Fertility by Age in Meiners Oaks
Average fertility rate in Meiners Oaks is 149.0 births per 1,000 women. Women in the age bracket of 20 to 34 years have the highest fertility rate with 285.0 births per 1,000 women. Women in the age bracket of 20 to 34 years acount for 100.0% of all women with births.
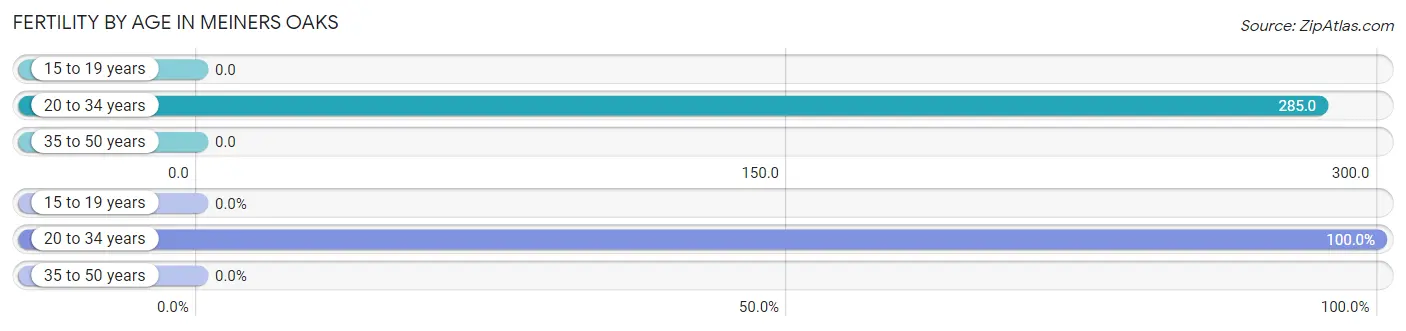
| Age Bracket | Women with Births | Births / 1,000 Women |
| 15 to 19 years | 0 (0.0%) | 0.0 |
| 20 to 34 years | 127 (100.0%) | 285.0 |
| 35 to 50 years | 0 (0.0%) | 0.0 |
| Total | 127 (100.0%) | 149.0 |
Fertility by Age by Marriage Status in Meiners Oaks
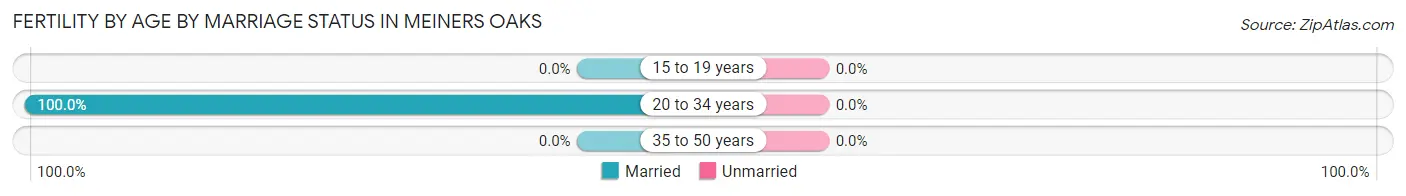
| Age Bracket | Married | Unmarried |
| 15 to 19 years | 0 (0.0%) | 0 (0.0%) |
| 20 to 34 years | 127 (100.0%) | 0 (0.0%) |
| 35 to 50 years | 0 (0.0%) | 0 (0.0%) |
| Total | 127 (100.0%) | 0 (0.0%) |
Fertility by Education in Meiners Oaks
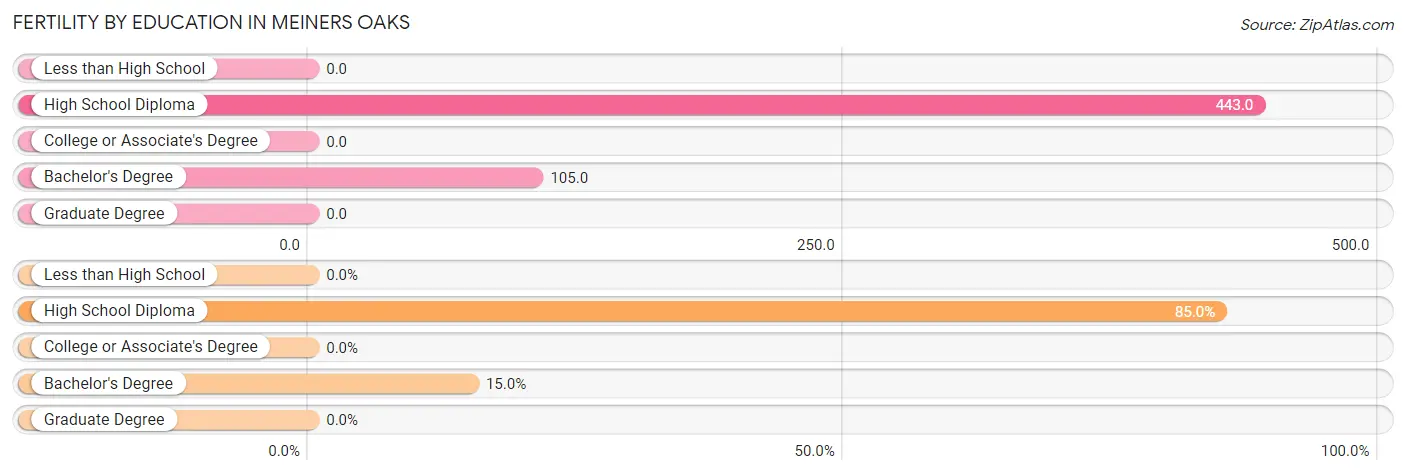
| Educational Attainment | Women with Births | Births / 1,000 Women |
| Less than High School | 0 (0.0%) | 0.0 |
| High School Diploma | 108 (85.0%) | 443.0 |
| College or Associate's Degree | 0 (0.0%) | 0.0 |
| Bachelor's Degree | 19 (15.0%) | 105.0 |
| Graduate Degree | 0 (0.0%) | 0.0 |
| Total | 127 (100.0%) | 149.0 |
Fertility by Education by Marriage Status in Meiners Oaks
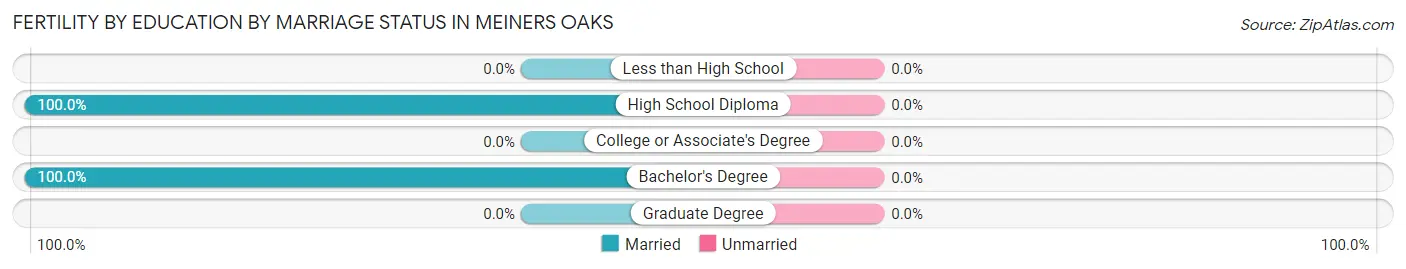
| Educational Attainment | Married | Unmarried |
| Less than High School | 0 (0.0%) | 0 (0.0%) |
| High School Diploma | 108 (100.0%) | 0 (0.0%) |
| College or Associate's Degree | 0 (0.0%) | 0 (0.0%) |
| Bachelor's Degree | 19 (100.0%) | 0 (0.0%) |
| Graduate Degree | 0 (0.0%) | 0 (0.0%) |
| Total | 127 (100.0%) | 0 (0.0%) |
Employment Characteristics in Meiners Oaks
Employment by Class of Employer in Meiners Oaks
Among the 1,636 employed individuals in Meiners Oaks, private company employees (1,011 | 61.8%), self-employed (not incorporated) (222 | 13.6%), and not-for-profit organizations (181 | 11.1%) make up the most common classes of employment.
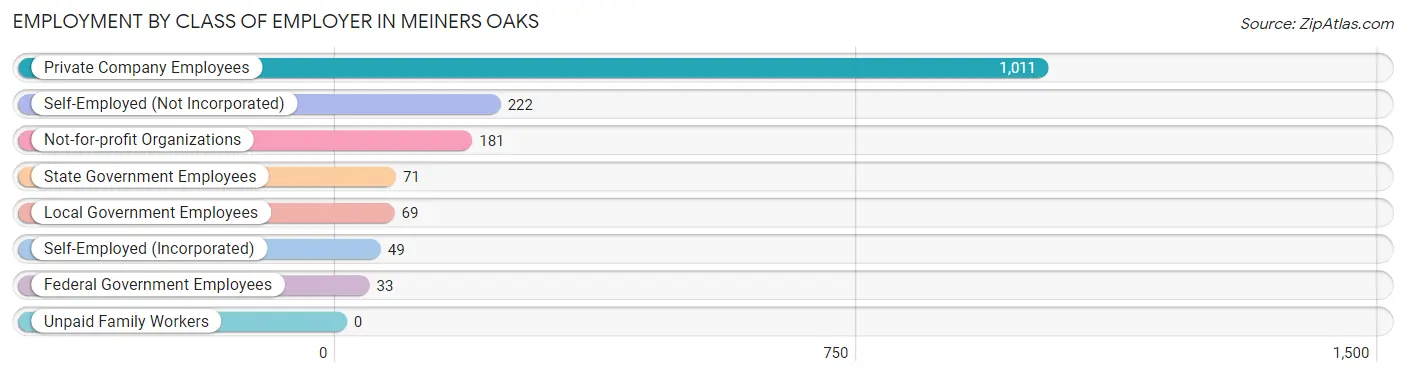
| Employer Class | # Employees | % Employees |
| Private Company Employees | 1,011 | 61.8% |
| Self-Employed (Incorporated) | 49 | 3.0% |
| Self-Employed (Not Incorporated) | 222 | 13.6% |
| Not-for-profit Organizations | 181 | 11.1% |
| Local Government Employees | 69 | 4.2% |
| State Government Employees | 71 | 4.3% |
| Federal Government Employees | 33 | 2.0% |
| Unpaid Family Workers | 0 | 0.0% |
| Total | 1,636 | 100.0% |
Employment Status by Age in Meiners Oaks
According to the labor force statistics for Meiners Oaks, out of the total population over 16 years of age (3,100), 57.1% or 1,770 individuals are in the labor force, with 2.6% or 46 of them unemployed. The age group with the highest labor force participation rate is 16 to 19 years, with 100.0% or 19 individuals in the labor force. Within the labor force, the 25 to 29 years age range has the highest percentage of unemployed individuals, with 19.5% or 23 of them being unemployed.
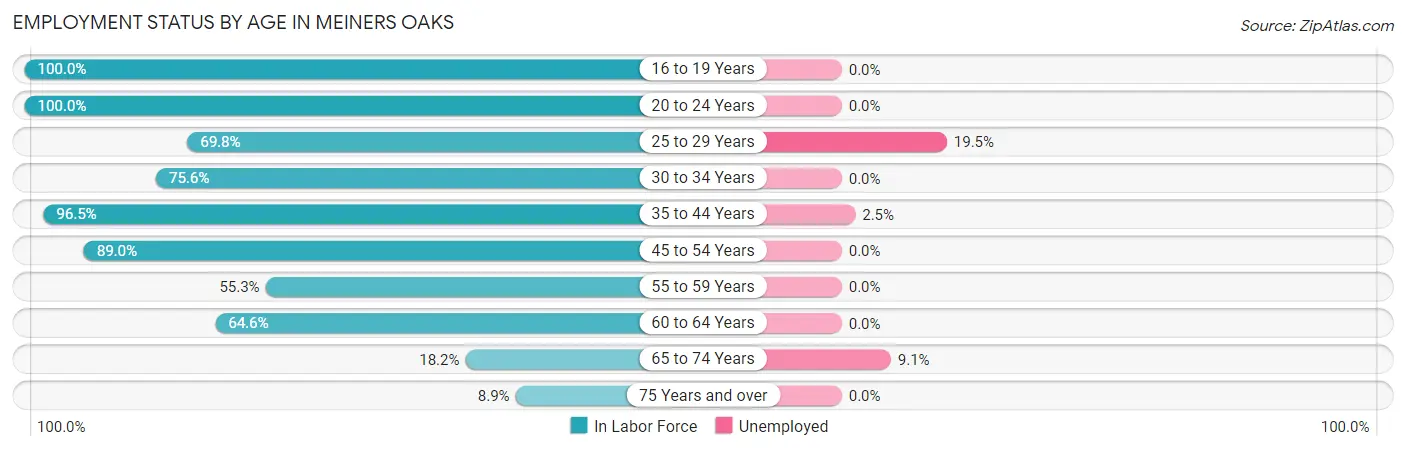
| Age Bracket | In Labor Force | Unemployed |
| 16 to 19 Years | 19 (100.0%) | 0 (0.0%) |
| 20 to 24 Years | 216 (100.0%) | 0 (0.0%) |
| 25 to 29 Years | 118 (69.8%) | 23 (19.5%) |
| 30 to 34 Years | 263 (75.6%) | 0 (0.0%) |
| 35 to 44 Years | 436 (96.5%) | 11 (2.5%) |
| 45 to 54 Years | 258 (89.0%) | 0 (0.0%) |
| 55 to 59 Years | 115 (55.3%) | 0 (0.0%) |
| 60 to 64 Years | 179 (64.6%) | 0 (0.0%) |
| 65 to 74 Years | 132 (18.2%) | 12 (9.1%) |
| 75 Years and over | 35 (8.9%) | 0 (0.0%) |
| Total | 1,770 (57.1%) | 46 (2.6%) |
Employment Status by Educational Attainment in Meiners Oaks
According to labor force statistics for Meiners Oaks, 78.5% of individuals (1,369) out of the total population between 25 and 64 years of age (1,744) are in the labor force, with 2.5% or 34 of them being unemployed. The group with the highest labor force participation rate are those with the educational attainment of bachelor's degree or higher, with 86.0% or 412 individuals in the labor force. Within the labor force, individuals with college / associate degree education have the highest percentage of unemployment, with 4.2% or 23 of them being unemployed.
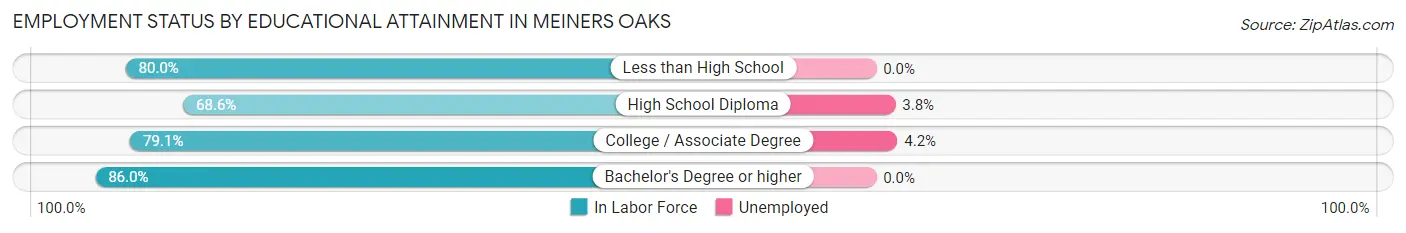
| Educational Attainment | In Labor Force | Unemployed |
| Less than High School | 112 (80.0%) | 0 (0.0%) |
| High School Diploma | 293 (68.6%) | 16 (3.8%) |
| College / Associate Degree | 552 (79.1%) | 29 (4.2%) |
| Bachelor's Degree or higher | 412 (86.0%) | 0 (0.0%) |
| Total | 1,369 (78.5%) | 44 (2.5%) |
Employment Occupations by Sex in Meiners Oaks
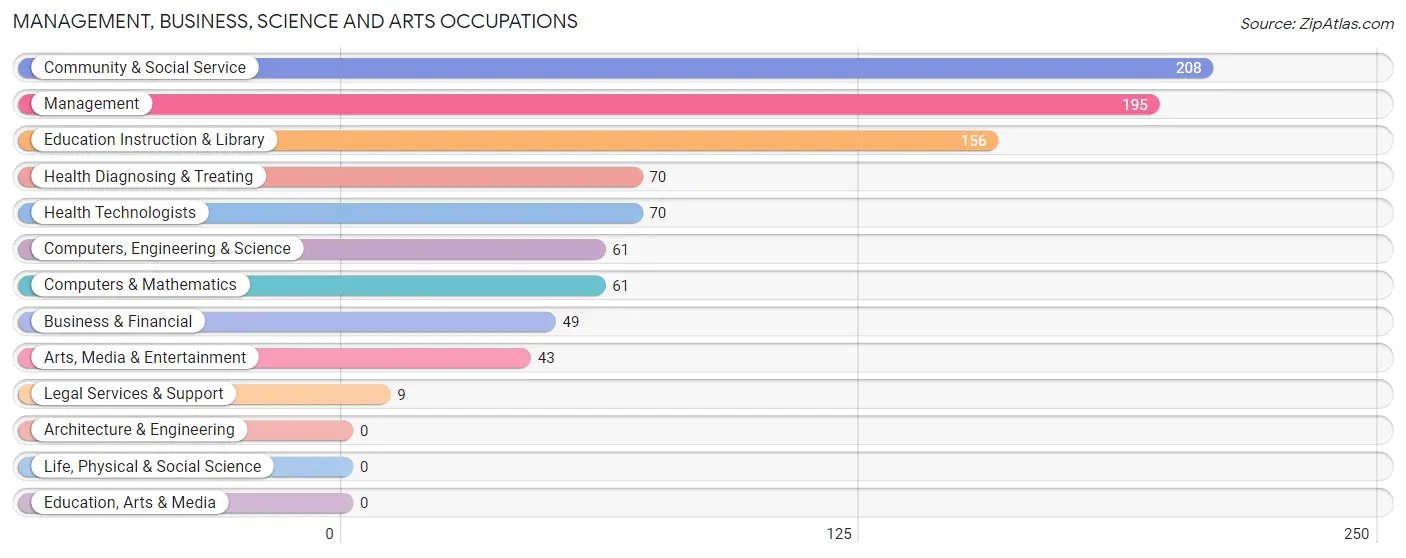
Management, Business, Science and Arts Occupations
The most common Management, Business, Science and Arts occupations in Meiners Oaks are Community & Social Service (208 | 12.1%), Management (195 | 11.3%), Education Instruction & Library (156 | 9.0%), Health Diagnosing & Treating (70 | 4.1%), and Health Technologists (70 | 4.1%).
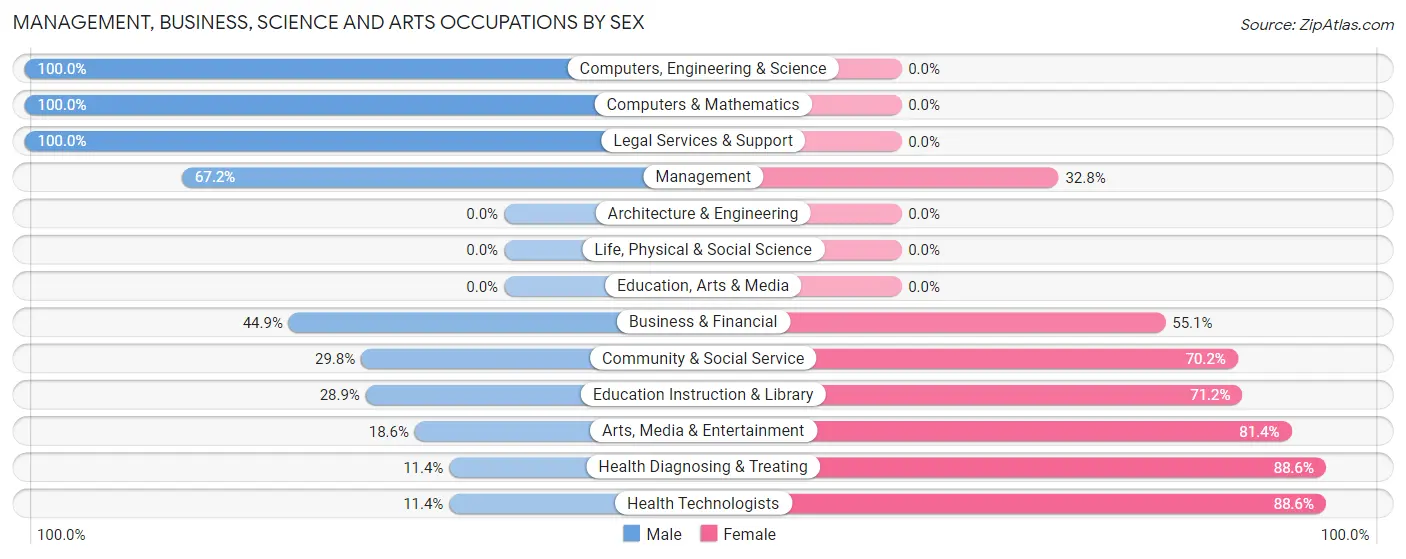
Management, Business, Science and Arts Occupations by Sex
Within the Management, Business, Science and Arts occupations in Meiners Oaks, the most male-oriented occupations are Computers, Engineering & Science (100.0%), Computers & Mathematics (100.0%), and Legal Services & Support (100.0%), while the most female-oriented occupations are Health Diagnosing & Treating (88.6%), Health Technologists (88.6%), and Arts, Media & Entertainment (81.4%).
| Occupation | Male | Female |
| Management | 131 (67.2%) | 64 (32.8%) |
| Business & Financial | 22 (44.9%) | 27 (55.1%) |
| Computers, Engineering & Science | 61 (100.0%) | 0 (0.0%) |
| Computers & Mathematics | 61 (100.0%) | 0 (0.0%) |
| Architecture & Engineering | 0 (0.0%) | 0 (0.0%) |
| Life, Physical & Social Science | 0 (0.0%) | 0 (0.0%) |
| Community & Social Service | 62 (29.8%) | 146 (70.2%) |
| Education, Arts & Media | 0 (0.0%) | 0 (0.0%) |
| Legal Services & Support | 9 (100.0%) | 0 (0.0%) |
| Education Instruction & Library | 45 (28.8%) | 111 (71.2%) |
| Arts, Media & Entertainment | 8 (18.6%) | 35 (81.4%) |
| Health Diagnosing & Treating | 8 (11.4%) | 62 (88.6%) |
| Health Technologists | 8 (11.4%) | 62 (88.6%) |
| Total (Category) | 284 (48.7%) | 299 (51.3%) |
| Total (Overall) | 774 (44.9%) | 951 (55.1%) |
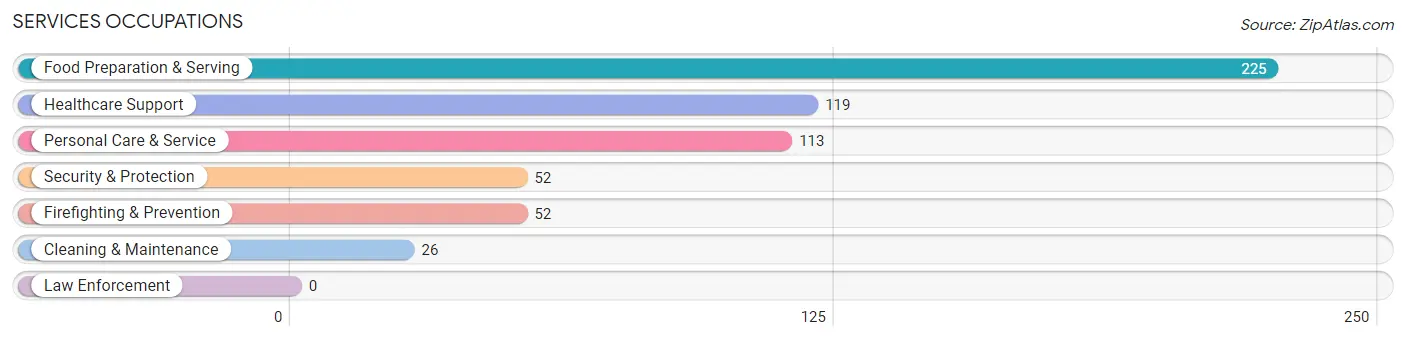
Services Occupations
The most common Services occupations in Meiners Oaks are Food Preparation & Serving (225 | 13.0%), Healthcare Support (119 | 6.9%), Personal Care & Service (113 | 6.6%), Security & Protection (52 | 3.0%), and Firefighting & Prevention (52 | 3.0%).
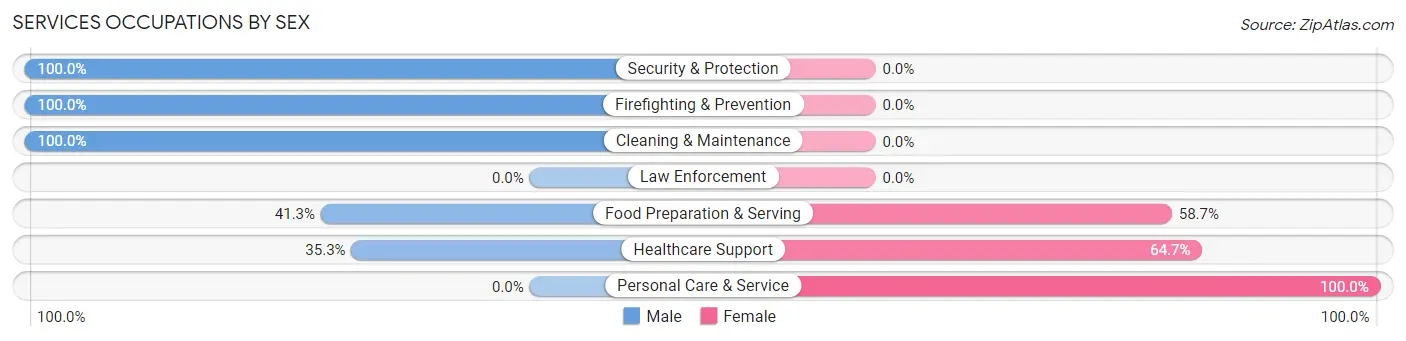
Services Occupations by Sex
Within the Services occupations in Meiners Oaks, the most male-oriented occupations are Security & Protection (100.0%), Firefighting & Prevention (100.0%), and Cleaning & Maintenance (100.0%), while the most female-oriented occupations are Personal Care & Service (100.0%), Healthcare Support (64.7%), and Food Preparation & Serving (58.7%).
| Occupation | Male | Female |
| Healthcare Support | 42 (35.3%) | 77 (64.7%) |
| Security & Protection | 52 (100.0%) | 0 (0.0%) |
| Firefighting & Prevention | 52 (100.0%) | 0 (0.0%) |
| Law Enforcement | 0 (0.0%) | 0 (0.0%) |
| Food Preparation & Serving | 93 (41.3%) | 132 (58.7%) |
| Cleaning & Maintenance | 26 (100.0%) | 0 (0.0%) |
| Personal Care & Service | 0 (0.0%) | 113 (100.0%) |
| Total (Category) | 213 (39.8%) | 322 (60.2%) |
| Total (Overall) | 774 (44.9%) | 951 (55.1%) |
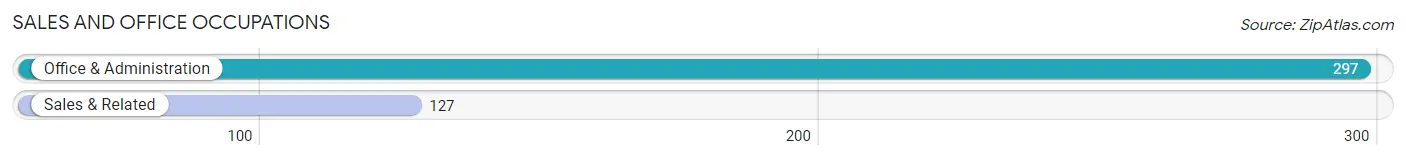
Sales and Office Occupations
The most common Sales and Office occupations in Meiners Oaks are Office & Administration (297 | 17.2%), and Sales & Related (127 | 7.4%).
Sales and Office Occupations by Sex
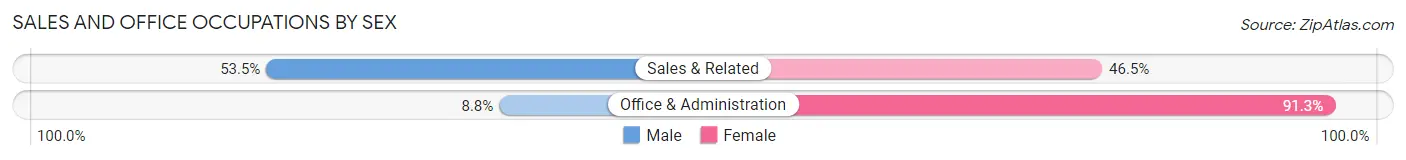
| Occupation | Male | Female |
| Sales & Related | 68 (53.5%) | 59 (46.5%) |
| Office & Administration | 26 (8.7%) | 271 (91.2%) |
| Total (Category) | 94 (22.2%) | 330 (77.8%) |
| Total (Overall) | 774 (44.9%) | 951 (55.1%) |
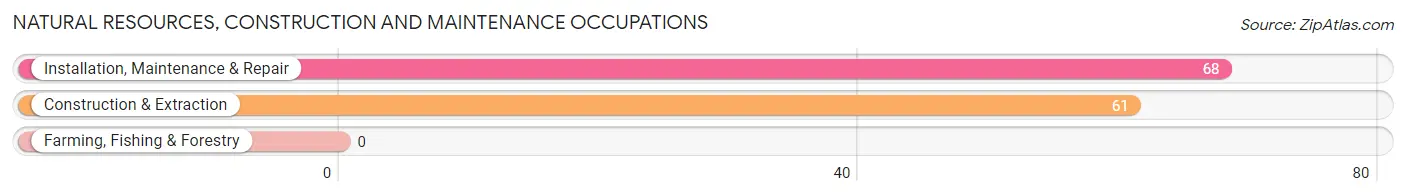
Natural Resources, Construction and Maintenance Occupations
The most common Natural Resources, Construction and Maintenance occupations in Meiners Oaks are Installation, Maintenance & Repair (68 | 3.9%), and Construction & Extraction (61 | 3.5%).
Natural Resources, Construction and Maintenance Occupations by Sex
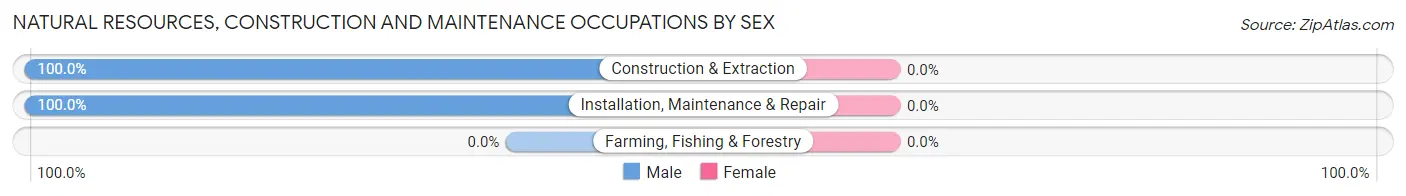
| Occupation | Male | Female |
| Farming, Fishing & Forestry | 0 (0.0%) | 0 (0.0%) |
| Construction & Extraction | 61 (100.0%) | 0 (0.0%) |
| Installation, Maintenance & Repair | 68 (100.0%) | 0 (0.0%) |
| Total (Category) | 129 (100.0%) | 0 (0.0%) |
| Total (Overall) | 774 (44.9%) | 951 (55.1%) |
Production, Transportation and Moving Occupations
The most common Production, Transportation and Moving occupations in Meiners Oaks are Production (34 | 2.0%), and Transportation (20 | 1.2%).
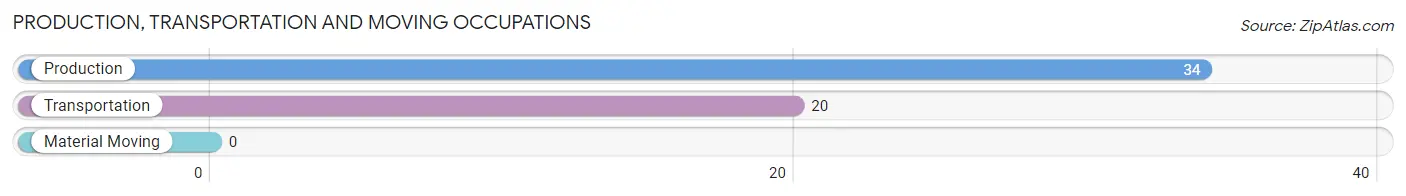
Production, Transportation and Moving Occupations by Sex
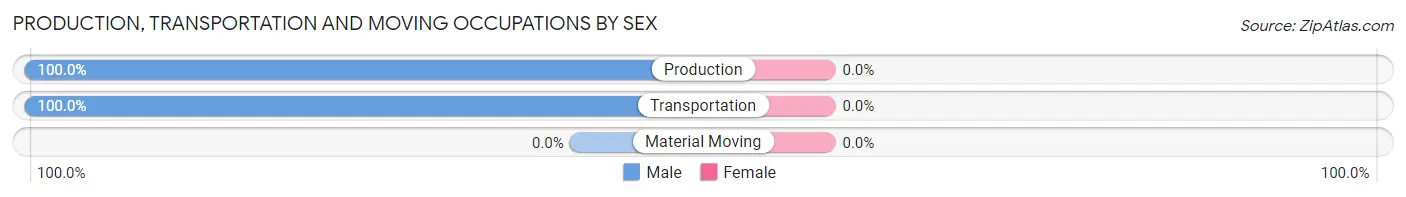
| Occupation | Male | Female |
| Production | 34 (100.0%) | 0 (0.0%) |
| Transportation | 20 (100.0%) | 0 (0.0%) |
| Material Moving | 0 (0.0%) | 0 (0.0%) |
| Total (Category) | 54 (100.0%) | 0 (0.0%) |
| Total (Overall) | 774 (44.9%) | 951 (55.1%) |
Employment Industries by Sex in Meiners Oaks
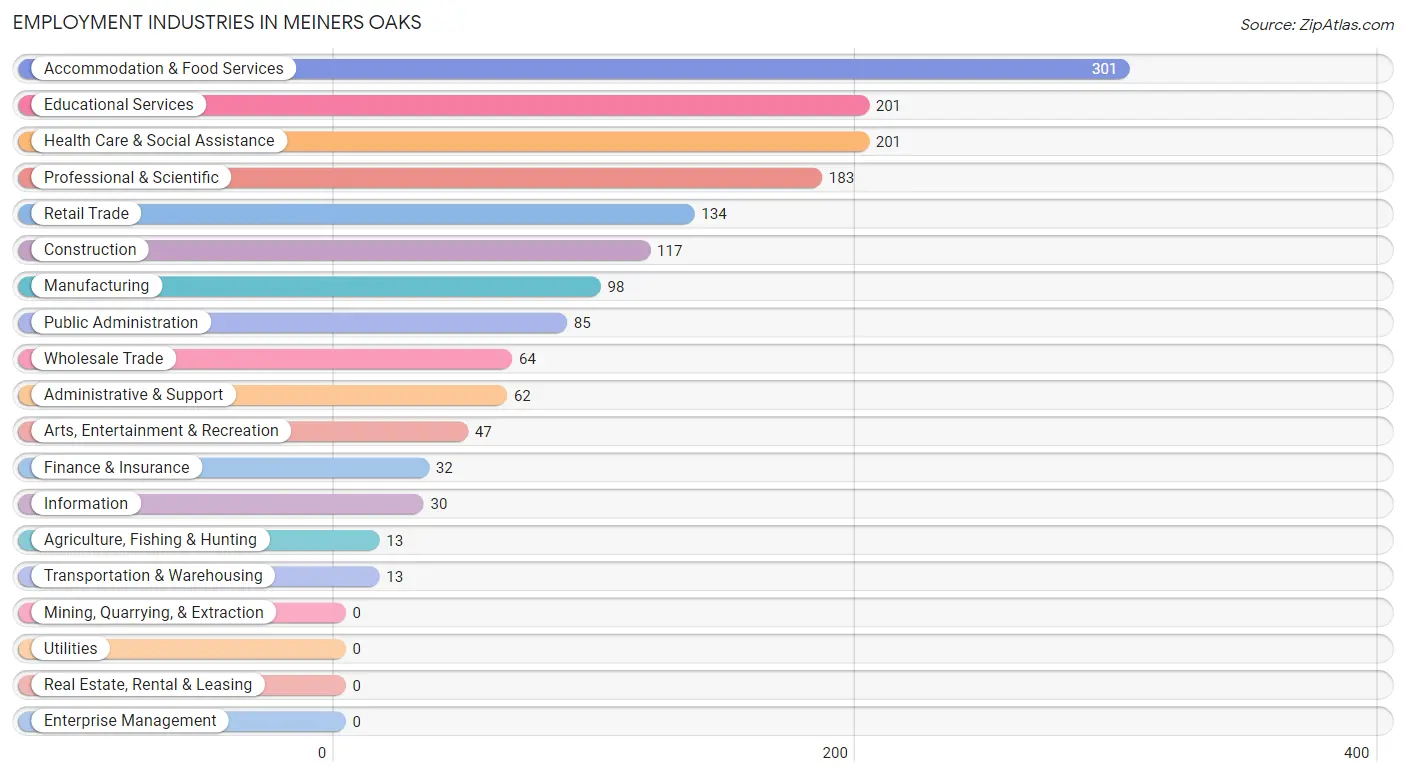
Employment Industries in Meiners Oaks
The major employment industries in Meiners Oaks include Accommodation & Food Services (301 | 17.4%), Educational Services (201 | 11.7%), Health Care & Social Assistance (201 | 11.7%), Professional & Scientific (183 | 10.6%), and Retail Trade (134 | 7.8%).
Employment Industries by Sex in Meiners Oaks
The Meiners Oaks industries that see more men than women are Agriculture, Fishing & Hunting (100.0%), Manufacturing (100.0%), and Construction (79.5%), whereas the industries that tend to have a higher number of women are Transportation & Warehousing (100.0%), Health Care & Social Assistance (91.5%), and Information (73.3%).
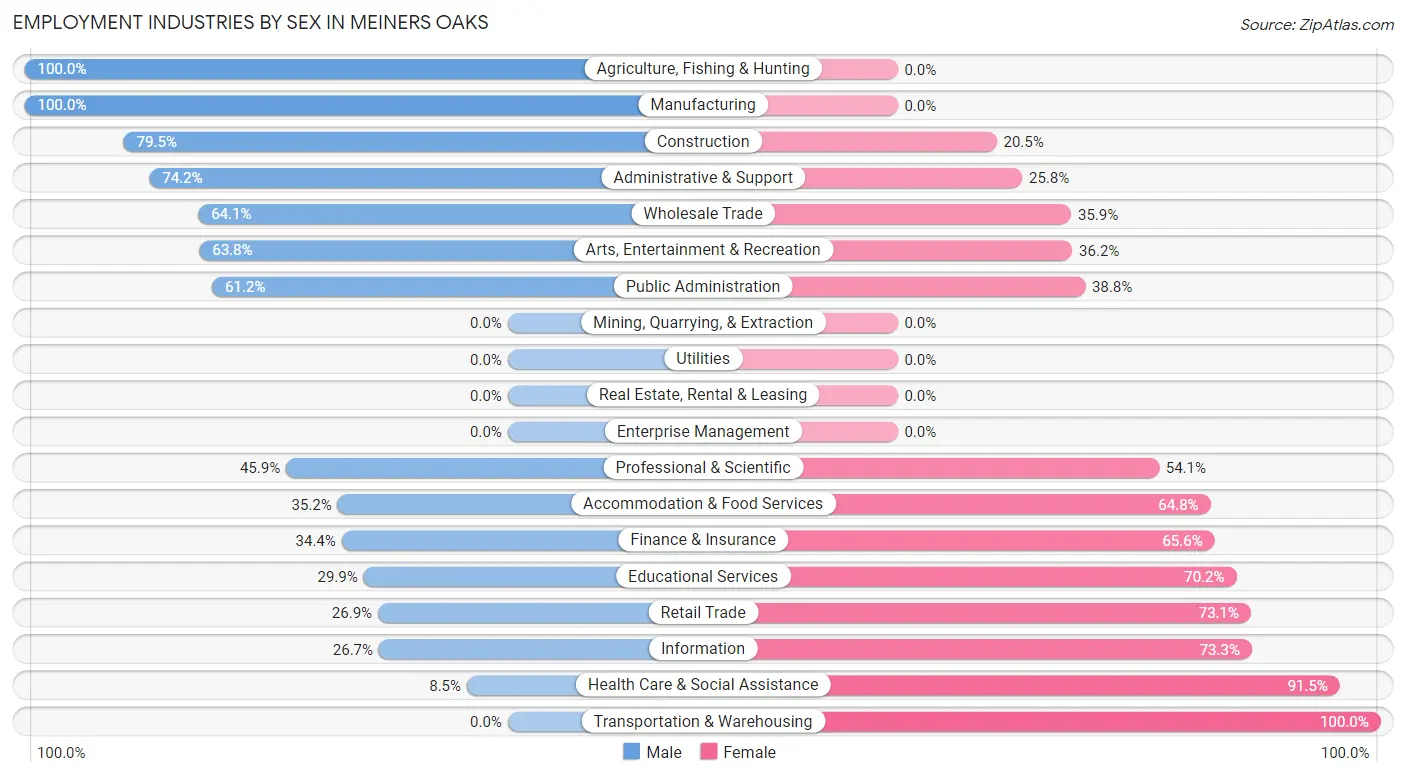
| Industry | Male | Female |
| Agriculture, Fishing & Hunting | 13 (100.0%) | 0 (0.0%) |
| Mining, Quarrying, & Extraction | 0 (0.0%) | 0 (0.0%) |
| Construction | 93 (79.5%) | 24 (20.5%) |
| Manufacturing | 98 (100.0%) | 0 (0.0%) |
| Wholesale Trade | 41 (64.1%) | 23 (35.9%) |
| Retail Trade | 36 (26.9%) | 98 (73.1%) |
| Transportation & Warehousing | 0 (0.0%) | 13 (100.0%) |
| Utilities | 0 (0.0%) | 0 (0.0%) |
| Information | 8 (26.7%) | 22 (73.3%) |
| Finance & Insurance | 11 (34.4%) | 21 (65.6%) |
| Real Estate, Rental & Leasing | 0 (0.0%) | 0 (0.0%) |
| Professional & Scientific | 84 (45.9%) | 99 (54.1%) |
| Enterprise Management | 0 (0.0%) | 0 (0.0%) |
| Administrative & Support | 46 (74.2%) | 16 (25.8%) |
| Educational Services | 60 (29.8%) | 141 (70.2%) |
| Health Care & Social Assistance | 17 (8.5%) | 184 (91.5%) |
| Arts, Entertainment & Recreation | 30 (63.8%) | 17 (36.2%) |
| Accommodation & Food Services | 106 (35.2%) | 195 (64.8%) |
| Public Administration | 52 (61.2%) | 33 (38.8%) |
| Total | 774 (44.9%) | 951 (55.1%) |
Education in Meiners Oaks
School Enrollment in Meiners Oaks
The most common levels of schooling among the 759 students in Meiners Oaks are elementary school (226 | 29.8%), college / undergraduate (169 | 22.3%), and middle school (148 | 19.5%).
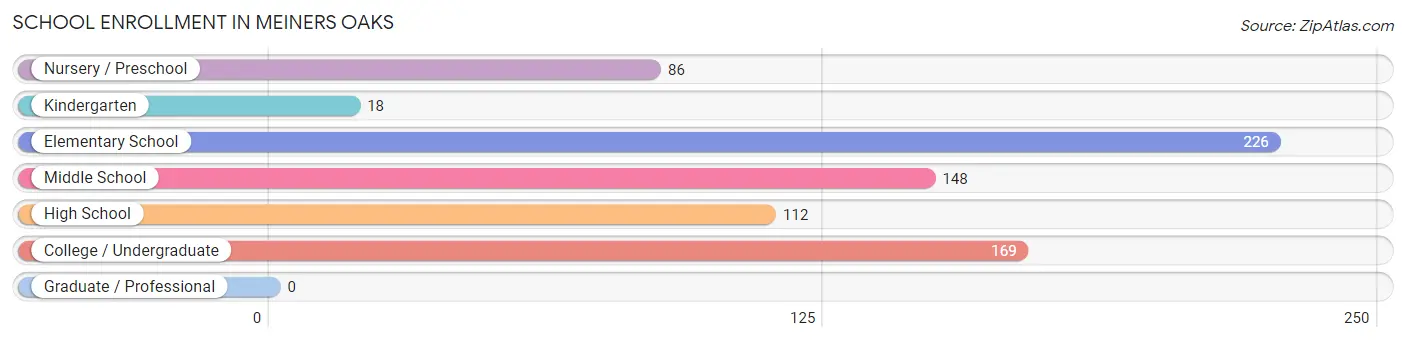
| School Level | # Students | % Students |
| Nursery / Preschool | 86 | 11.3% |
| Kindergarten | 18 | 2.4% |
| Elementary School | 226 | 29.8% |
| Middle School | 148 | 19.5% |
| High School | 112 | 14.8% |
| College / Undergraduate | 169 | 22.3% |
| Graduate / Professional | 0 | 0.0% |
| Total | 759 | 100.0% |
School Enrollment by Age by Funding Source in Meiners Oaks
Out of a total of 759 students who are enrolled in schools in Meiners Oaks, 267 (35.2%) attend a private institution, while the remaining 492 (64.8%) are enrolled in public schools. The age group of 3 to 4 year olds has the highest likelihood of being enrolled in private schools, with 66 (76.7% in the age bracket) enrolled. Conversely, the age group of 18 to 19 year olds has the lowest likelihood of being enrolled in a private school, with 19 (100.0% in the age bracket) attending a public institution.
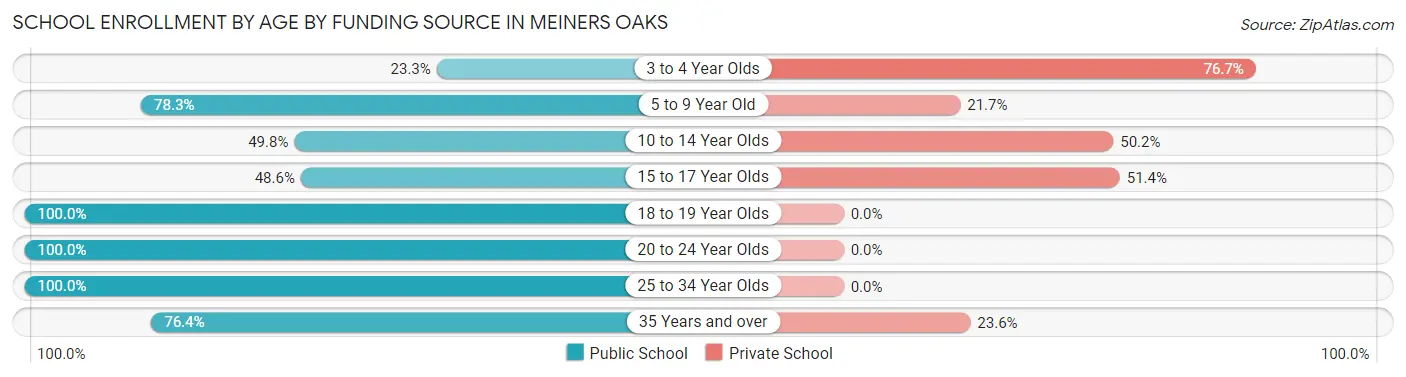
| Age Bracket | Public School | Private School |
| 3 to 4 Year Olds | 20 (23.3%) | 66 (76.7%) |
| 5 to 9 Year Old | 191 (78.3%) | 53 (21.7%) |
| 10 to 14 Year Olds | 112 (49.8%) | 113 (50.2%) |
| 15 to 17 Year Olds | 17 (48.6%) | 18 (51.4%) |
| 18 to 19 Year Olds | 19 (100.0%) | 0 (0.0%) |
| 20 to 24 Year Olds | 40 (100.0%) | 0 (0.0%) |
| 25 to 34 Year Olds | 38 (100.0%) | 0 (0.0%) |
| 35 Years and over | 55 (76.4%) | 17 (23.6%) |
| Total | 492 (64.8%) | 267 (35.2%) |
Educational Attainment by Field of Study in Meiners Oaks
Business (118 | 14.3%), social sciences (96 | 11.6%), science & technology (95 | 11.5%), bio, nature & agricultural (92 | 11.1%), and liberal arts & history (80 | 9.7%) are the most common fields of study among 826 individuals in Meiners Oaks who have obtained a bachelor's degree or higher.
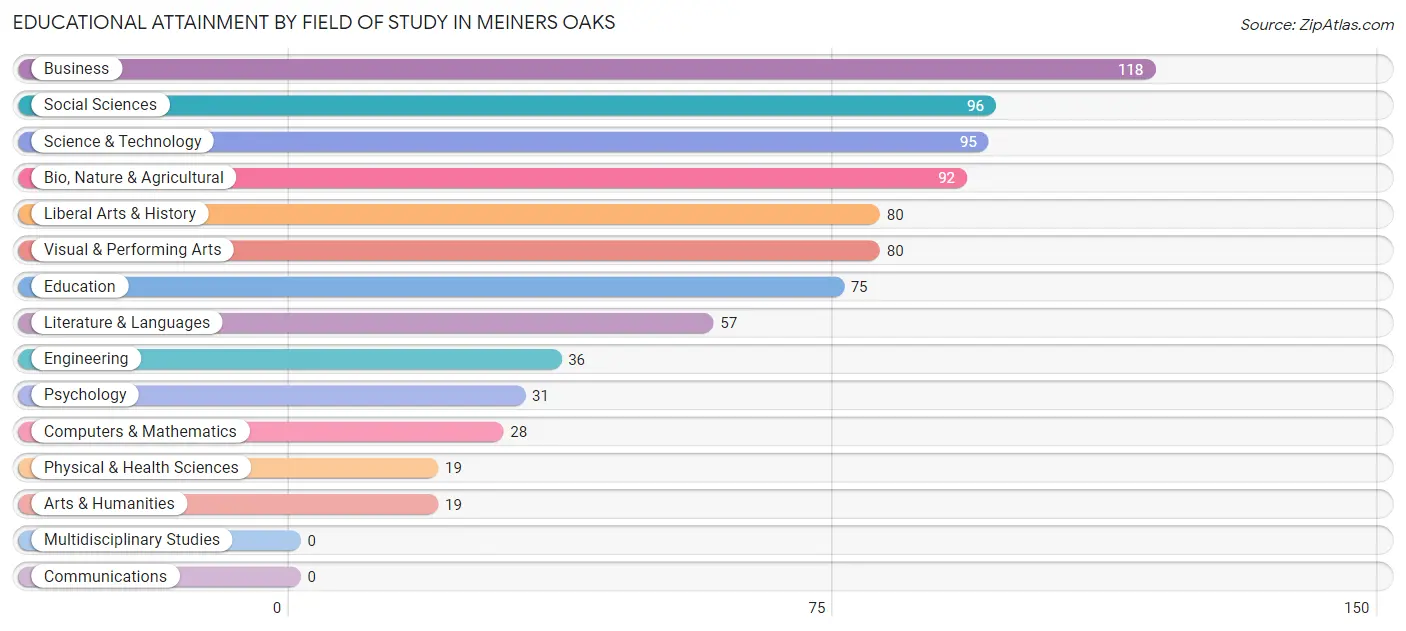
| Field of Study | # Graduates | % Graduates |
| Computers & Mathematics | 28 | 3.4% |
| Bio, Nature & Agricultural | 92 | 11.1% |
| Physical & Health Sciences | 19 | 2.3% |
| Psychology | 31 | 3.7% |
| Social Sciences | 96 | 11.6% |
| Engineering | 36 | 4.4% |
| Multidisciplinary Studies | 0 | 0.0% |
| Science & Technology | 95 | 11.5% |
| Business | 118 | 14.3% |
| Education | 75 | 9.1% |
| Literature & Languages | 57 | 6.9% |
| Liberal Arts & History | 80 | 9.7% |
| Visual & Performing Arts | 80 | 9.7% |
| Communications | 0 | 0.0% |
| Arts & Humanities | 19 | 2.3% |
| Total | 826 | 100.0% |
Transportation & Commute in Meiners Oaks
Vehicle Availability by Sex in Meiners Oaks
The most prevalent vehicle ownership categories in Meiners Oaks are males with 2 vehicles (323, accounting for 48.4%) and females with 2 vehicles (218, making up 35.2%).
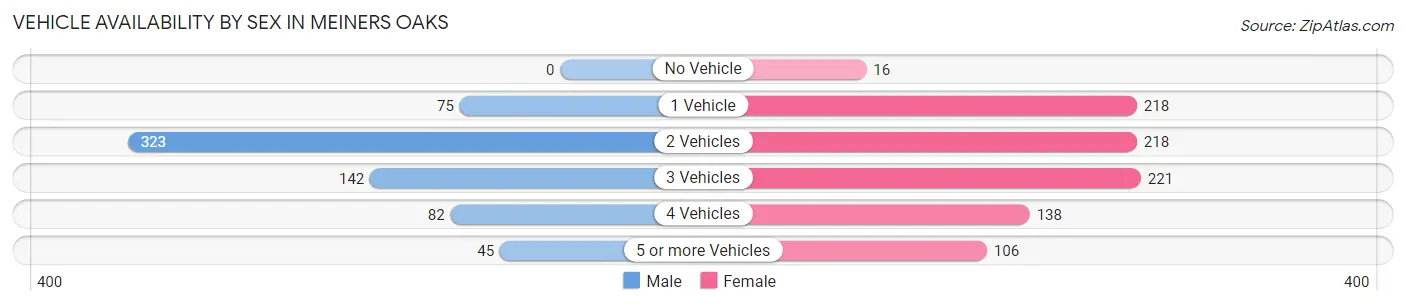
| Vehicles Available | Male | Female |
| No Vehicle | 0 (0.0%) | 16 (1.7%) |
| 1 Vehicle | 75 (11.2%) | 218 (23.8%) |
| 2 Vehicles | 323 (48.4%) | 218 (23.8%) |
| 3 Vehicles | 142 (21.3%) | 221 (24.1%) |
| 4 Vehicles | 82 (12.3%) | 138 (15.0%) |
| 5 or more Vehicles | 45 (6.8%) | 106 (11.6%) |
| Total | 667 (100.0%) | 917 (100.0%) |
Commute Time in Meiners Oaks
The most frequently occuring commute durations in Meiners Oaks are 5 to 9 minutes (342 commuters, 25.2%), 10 to 14 minutes (195 commuters, 14.4%), and 30 to 34 minutes (171 commuters, 12.6%).
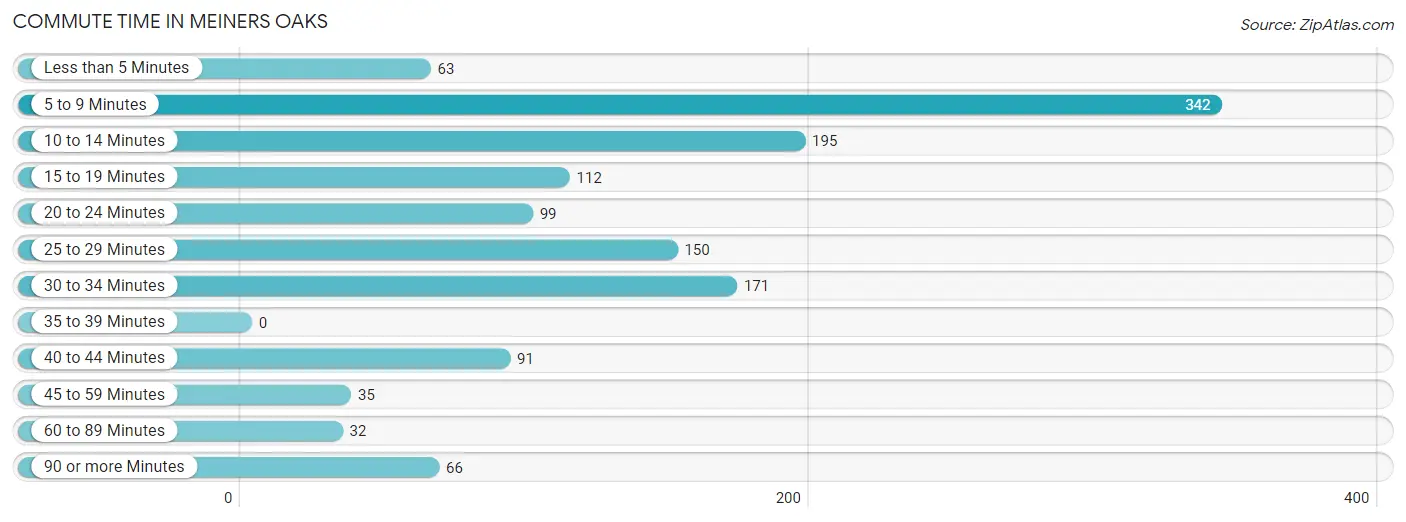
| Commute Time | # Commuters | % Commuters |
| Less than 5 Minutes | 63 | 4.6% |
| 5 to 9 Minutes | 342 | 25.2% |
| 10 to 14 Minutes | 195 | 14.4% |
| 15 to 19 Minutes | 112 | 8.3% |
| 20 to 24 Minutes | 99 | 7.3% |
| 25 to 29 Minutes | 150 | 11.1% |
| 30 to 34 Minutes | 171 | 12.6% |
| 35 to 39 Minutes | 0 | 0.0% |
| 40 to 44 Minutes | 91 | 6.7% |
| 45 to 59 Minutes | 35 | 2.6% |
| 60 to 89 Minutes | 32 | 2.4% |
| 90 or more Minutes | 66 | 4.9% |
Commute Time by Sex in Meiners Oaks
The most common commute times in Meiners Oaks are 5 to 9 minutes (115 commuters, 20.3%) for males and 5 to 9 minutes (227 commuters, 28.7%) for females.
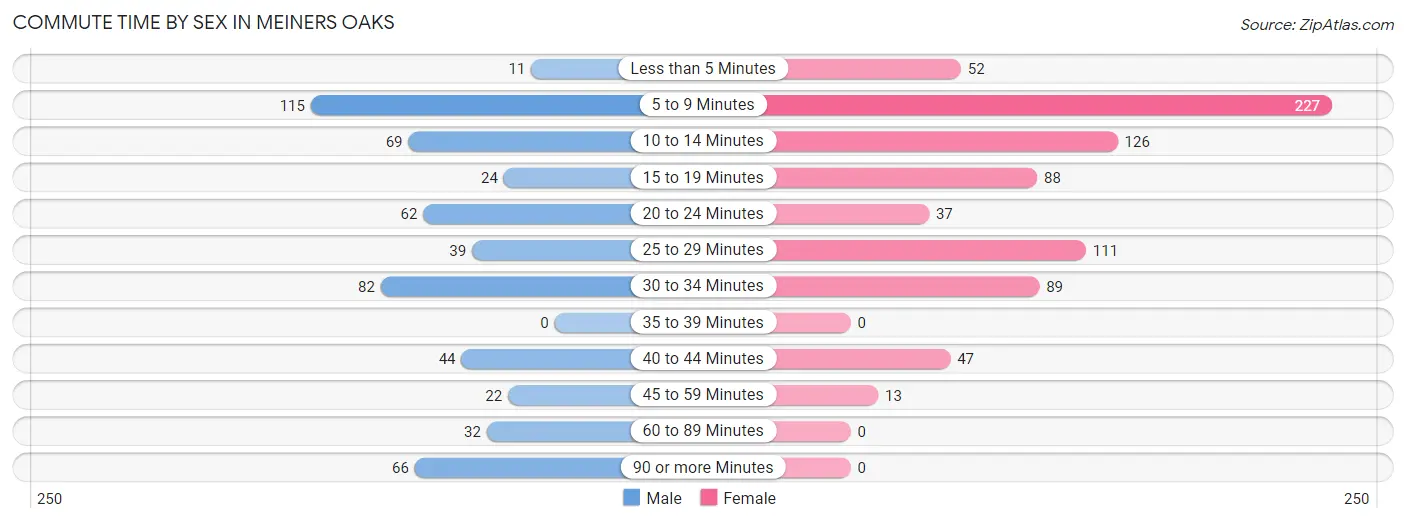
| Commute Time | Male | Female |
| Less than 5 Minutes | 11 (1.9%) | 52 (6.6%) |
| 5 to 9 Minutes | 115 (20.3%) | 227 (28.7%) |
| 10 to 14 Minutes | 69 (12.2%) | 126 (16.0%) |
| 15 to 19 Minutes | 24 (4.2%) | 88 (11.1%) |
| 20 to 24 Minutes | 62 (11.0%) | 37 (4.7%) |
| 25 to 29 Minutes | 39 (6.9%) | 111 (14.1%) |
| 30 to 34 Minutes | 82 (14.5%) | 89 (11.3%) |
| 35 to 39 Minutes | 0 (0.0%) | 0 (0.0%) |
| 40 to 44 Minutes | 44 (7.8%) | 47 (5.9%) |
| 45 to 59 Minutes | 22 (3.9%) | 13 (1.7%) |
| 60 to 89 Minutes | 32 (5.7%) | 0 (0.0%) |
| 90 or more Minutes | 66 (11.7%) | 0 (0.0%) |
Time of Departure to Work by Sex in Meiners Oaks
The most frequent times of departure to work in Meiners Oaks are 6:30 AM to 6:59 AM (109, 19.3%) for males and 4:00 PM to 11:59 PM (109, 13.8%) for females.
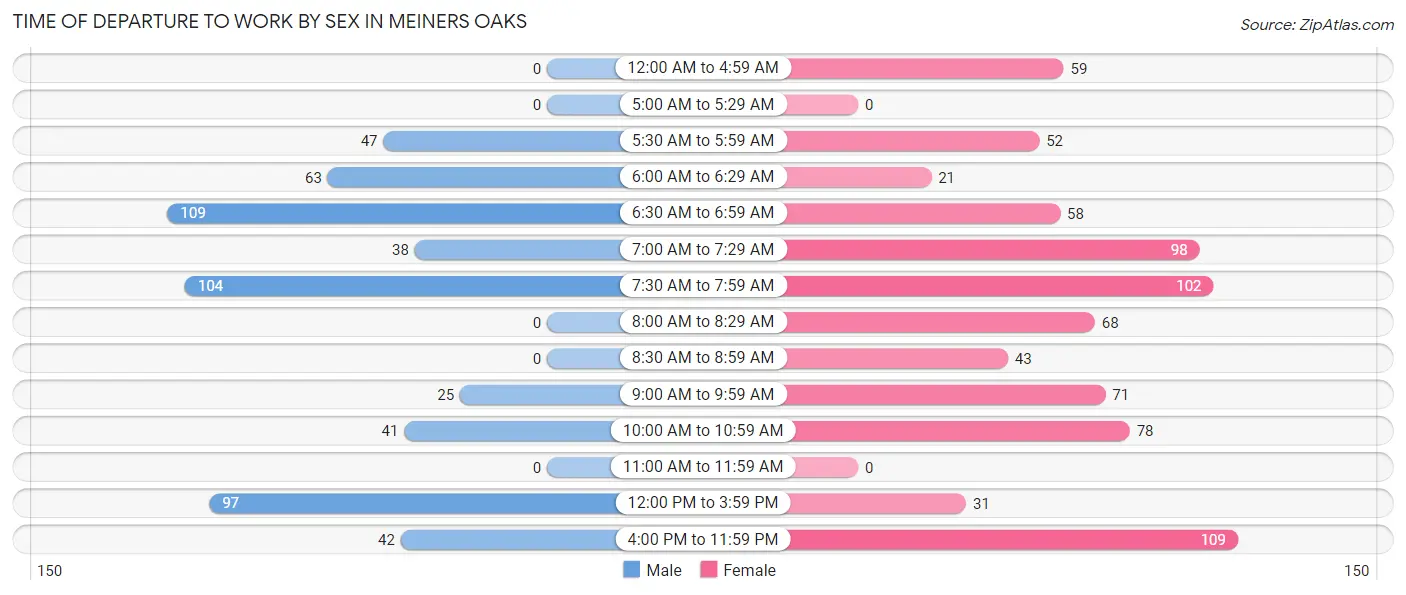
| Time of Departure | Male | Female |
| 12:00 AM to 4:59 AM | 0 (0.0%) | 59 (7.5%) |
| 5:00 AM to 5:29 AM | 0 (0.0%) | 0 (0.0%) |
| 5:30 AM to 5:59 AM | 47 (8.3%) | 52 (6.6%) |
| 6:00 AM to 6:29 AM | 63 (11.1%) | 21 (2.7%) |
| 6:30 AM to 6:59 AM | 109 (19.3%) | 58 (7.3%) |
| 7:00 AM to 7:29 AM | 38 (6.7%) | 98 (12.4%) |
| 7:30 AM to 7:59 AM | 104 (18.4%) | 102 (12.9%) |
| 8:00 AM to 8:29 AM | 0 (0.0%) | 68 (8.6%) |
| 8:30 AM to 8:59 AM | 0 (0.0%) | 43 (5.4%) |
| 9:00 AM to 9:59 AM | 25 (4.4%) | 71 (9.0%) |
| 10:00 AM to 10:59 AM | 41 (7.2%) | 78 (9.9%) |
| 11:00 AM to 11:59 AM | 0 (0.0%) | 0 (0.0%) |
| 12:00 PM to 3:59 PM | 97 (17.1%) | 31 (3.9%) |
| 4:00 PM to 11:59 PM | 42 (7.4%) | 109 (13.8%) |
| Total | 566 (100.0%) | 790 (100.0%) |
Housing Occupancy in Meiners Oaks
Occupancy by Ownership in Meiners Oaks
Of the total 1,513 dwellings in Meiners Oaks, owner-occupied units account for 1,042 (68.9%), while renter-occupied units make up 471 (31.1%).
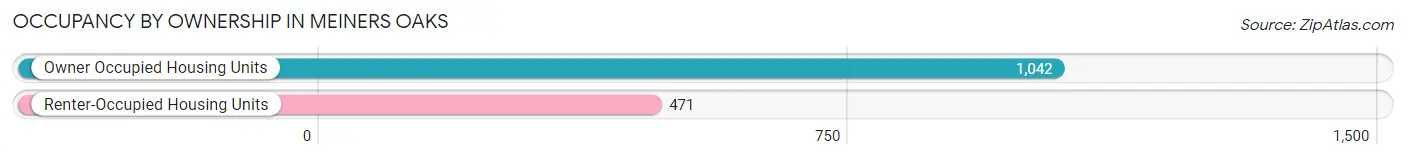
| Occupancy | # Housing Units | % Housing Units |
| Owner Occupied Housing Units | 1,042 | 68.9% |
| Renter-Occupied Housing Units | 471 | 31.1% |
| Total Occupied Housing Units | 1,513 | 100.0% |
Occupancy by Household Size in Meiners Oaks
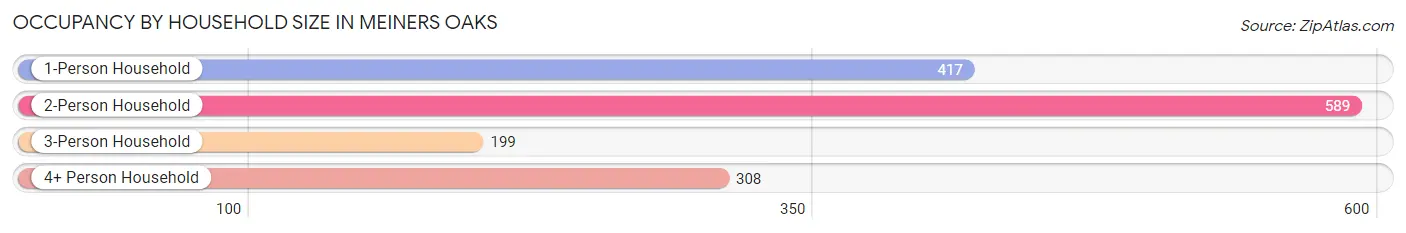
| Household Size | # Housing Units | % Housing Units |
| 1-Person Household | 417 | 27.6% |
| 2-Person Household | 589 | 38.9% |
| 3-Person Household | 199 | 13.2% |
| 4+ Person Household | 308 | 20.4% |
| Total Housing Units | 1,513 | 100.0% |
Occupancy by Ownership by Household Size in Meiners Oaks
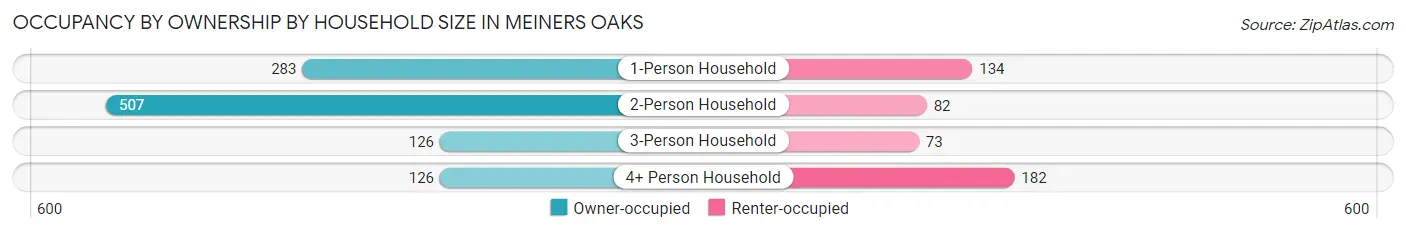
| Household Size | Owner-occupied | Renter-occupied |
| 1-Person Household | 283 (67.9%) | 134 (32.1%) |
| 2-Person Household | 507 (86.1%) | 82 (13.9%) |
| 3-Person Household | 126 (63.3%) | 73 (36.7%) |
| 4+ Person Household | 126 (40.9%) | 182 (59.1%) |
| Total Housing Units | 1,042 (68.9%) | 471 (31.1%) |
Occupancy by Educational Attainment in Meiners Oaks
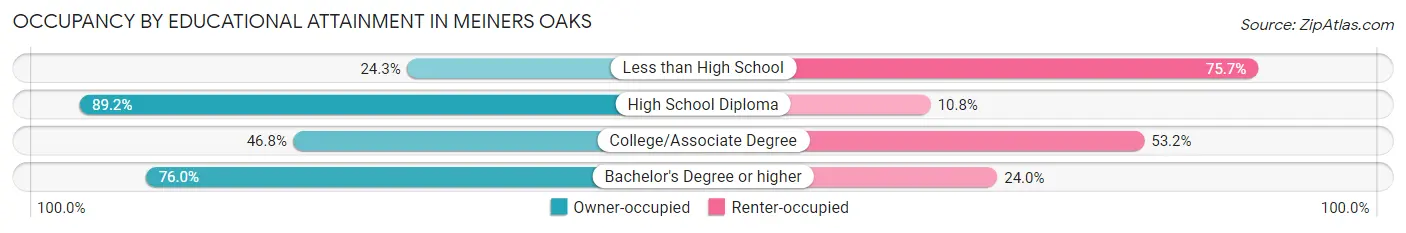
| Household Size | Owner-occupied | Renter-occupied |
| Less than High School | 17 (24.3%) | 53 (75.7%) |
| High School Diploma | 421 (89.2%) | 51 (10.8%) |
| College/Associate Degree | 215 (46.8%) | 244 (53.2%) |
| Bachelor's Degree or higher | 389 (76.0%) | 123 (24.0%) |
Occupancy by Age of Householder in Meiners Oaks
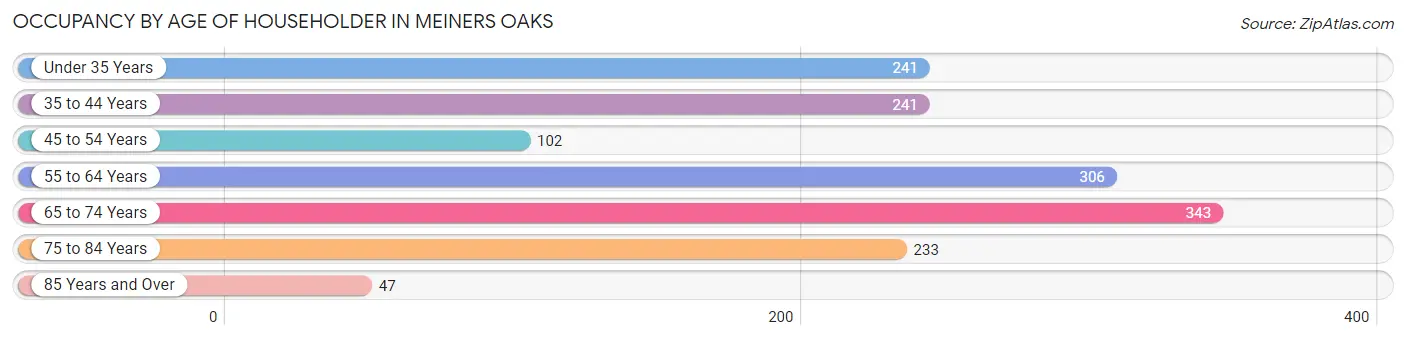
| Age Bracket | # Households | % Households |
| Under 35 Years | 241 | 15.9% |
| 35 to 44 Years | 241 | 15.9% |
| 45 to 54 Years | 102 | 6.7% |
| 55 to 64 Years | 306 | 20.2% |
| 65 to 74 Years | 343 | 22.7% |
| 75 to 84 Years | 233 | 15.4% |
| 85 Years and Over | 47 | 3.1% |
| Total | 1,513 | 100.0% |
Housing Finances in Meiners Oaks
Median Income by Occupancy in Meiners Oaks
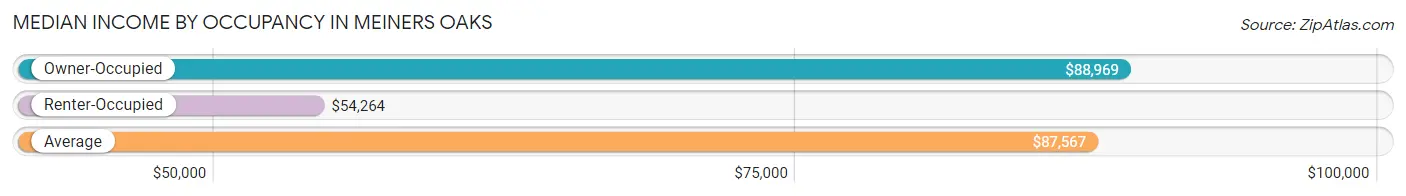
| Occupancy Type | # Households | Median Income |
| Owner-Occupied | 1,042 (68.9%) | $88,969 |
| Renter-Occupied | 471 (31.1%) | $54,264 |
| Average | 1,513 (100.0%) | $87,567 |
Occupancy by Householder Income Bracket in Meiners Oaks
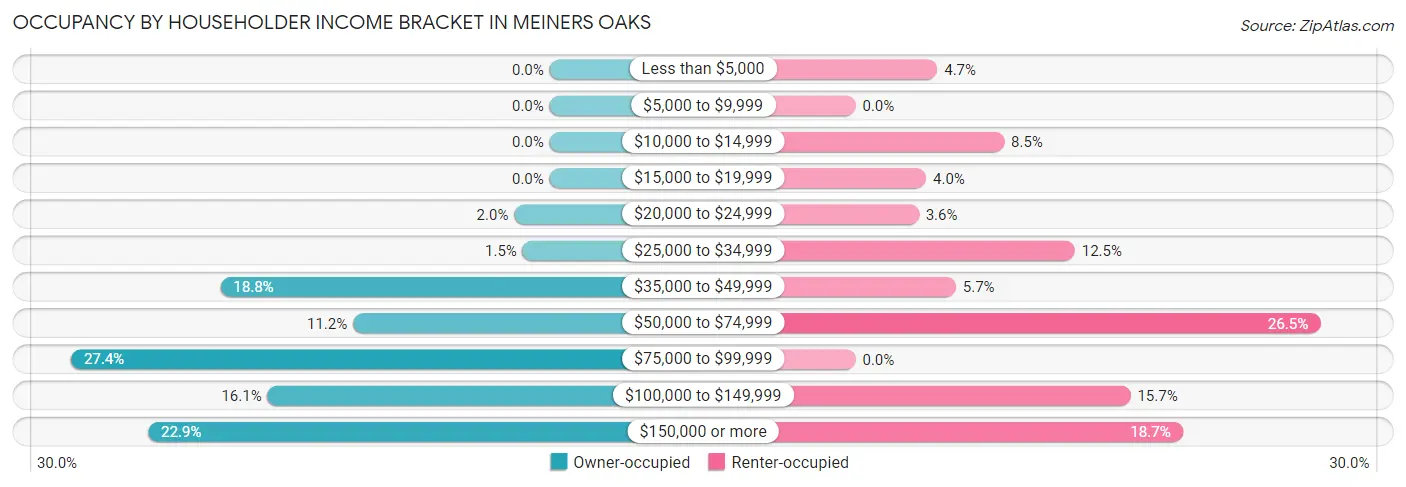
| Income Bracket | Owner-occupied | Renter-occupied |
| Less than $5,000 | 0 (0.0%) | 22 (4.7%) |
| $5,000 to $9,999 | 0 (0.0%) | 0 (0.0%) |
| $10,000 to $14,999 | 0 (0.0%) | 40 (8.5%) |
| $15,000 to $19,999 | 0 (0.0%) | 19 (4.0%) |
| $20,000 to $24,999 | 21 (2.0%) | 17 (3.6%) |
| $25,000 to $34,999 | 16 (1.5%) | 59 (12.5%) |
| $35,000 to $49,999 | 196 (18.8%) | 27 (5.7%) |
| $50,000 to $74,999 | 117 (11.2%) | 125 (26.5%) |
| $75,000 to $99,999 | 285 (27.4%) | 0 (0.0%) |
| $100,000 to $149,999 | 168 (16.1%) | 74 (15.7%) |
| $150,000 or more | 239 (22.9%) | 88 (18.7%) |
| Total | 1,042 (100.0%) | 471 (100.0%) |
Monthly Housing Cost Tiers in Meiners Oaks
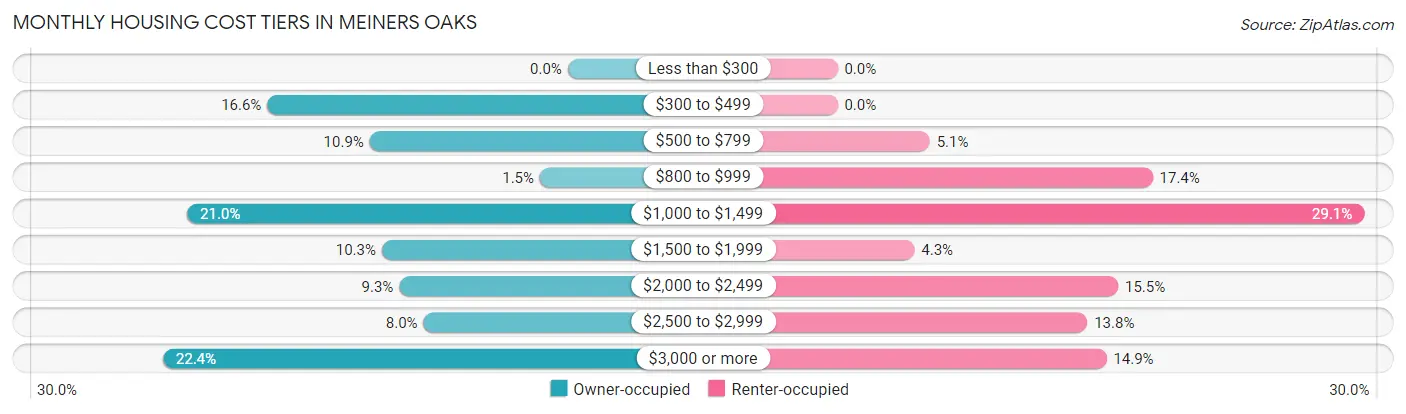
| Monthly Cost | Owner-occupied | Renter-occupied |
| Less than $300 | 0 (0.0%) | 0 (0.0%) |
| $300 to $499 | 173 (16.6%) | 0 (0.0%) |
| $500 to $799 | 114 (10.9%) | 24 (5.1%) |
| $800 to $999 | 16 (1.5%) | 82 (17.4%) |
| $1,000 to $1,499 | 219 (21.0%) | 137 (29.1%) |
| $1,500 to $1,999 | 107 (10.3%) | 20 (4.3%) |
| $2,000 to $2,499 | 97 (9.3%) | 73 (15.5%) |
| $2,500 to $2,999 | 83 (8.0%) | 65 (13.8%) |
| $3,000 or more | 233 (22.4%) | 70 (14.9%) |
| Total | 1,042 (100.0%) | 471 (100.0%) |
Physical Housing Characteristics in Meiners Oaks
Housing Structures in Meiners Oaks
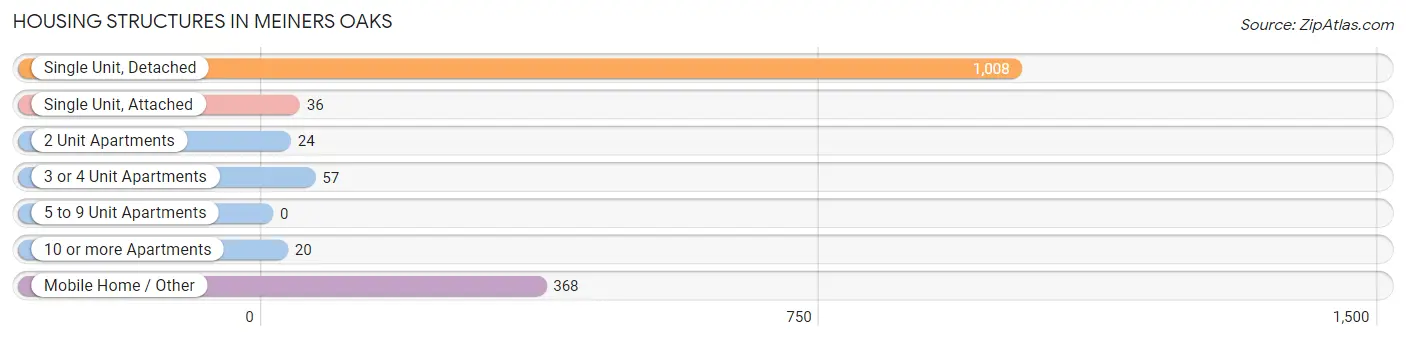
| Structure Type | # Housing Units | % Housing Units |
| Single Unit, Detached | 1,008 | 66.6% |
| Single Unit, Attached | 36 | 2.4% |
| 2 Unit Apartments | 24 | 1.6% |
| 3 or 4 Unit Apartments | 57 | 3.8% |
| 5 to 9 Unit Apartments | 0 | 0.0% |
| 10 or more Apartments | 20 | 1.3% |
| Mobile Home / Other | 368 | 24.3% |
| Total | 1,513 | 100.0% |
Housing Structures by Occupancy in Meiners Oaks
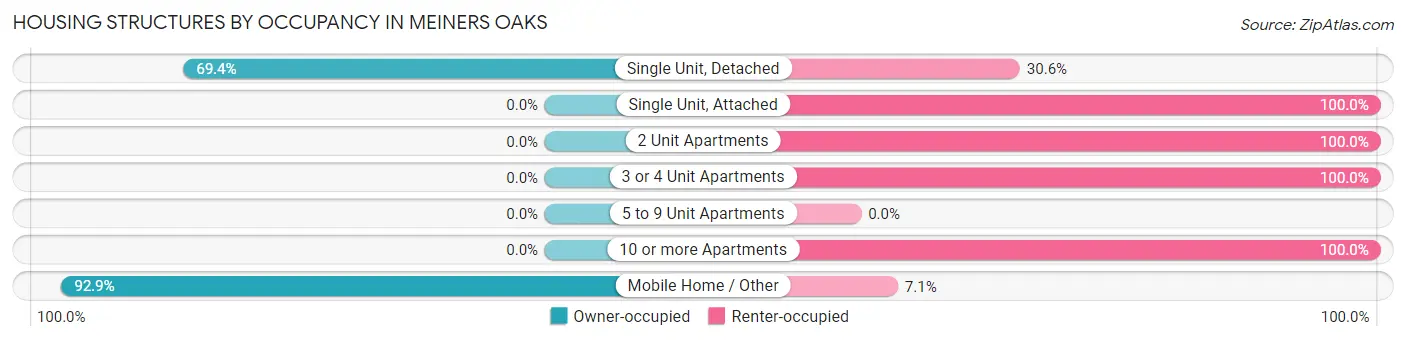
| Structure Type | Owner-occupied | Renter-occupied |
| Single Unit, Detached | 700 (69.4%) | 308 (30.6%) |
| Single Unit, Attached | 0 (0.0%) | 36 (100.0%) |
| 2 Unit Apartments | 0 (0.0%) | 24 (100.0%) |
| 3 or 4 Unit Apartments | 0 (0.0%) | 57 (100.0%) |
| 5 to 9 Unit Apartments | 0 (0.0%) | 0 (0.0%) |
| 10 or more Apartments | 0 (0.0%) | 20 (100.0%) |
| Mobile Home / Other | 342 (92.9%) | 26 (7.1%) |
| Total | 1,042 (68.9%) | 471 (31.1%) |
Housing Structures by Number of Rooms in Meiners Oaks
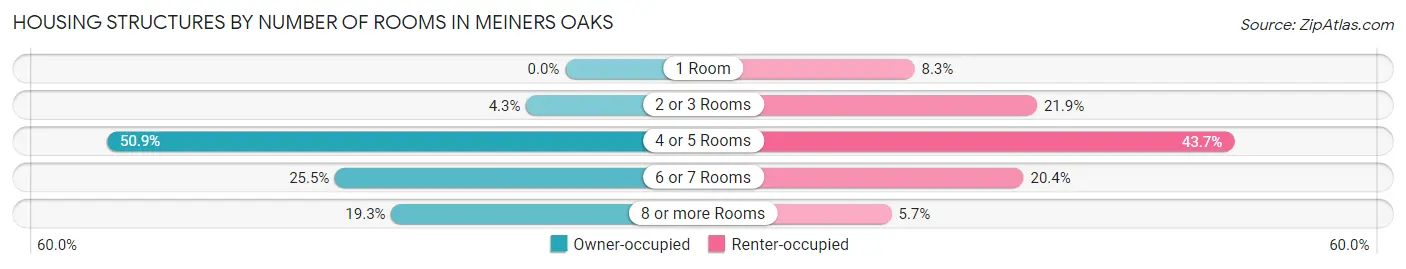
| Number of Rooms | Owner-occupied | Renter-occupied |
| 1 Room | 0 (0.0%) | 39 (8.3%) |
| 2 or 3 Rooms | 45 (4.3%) | 103 (21.9%) |
| 4 or 5 Rooms | 530 (50.9%) | 206 (43.7%) |
| 6 or 7 Rooms | 266 (25.5%) | 96 (20.4%) |
| 8 or more Rooms | 201 (19.3%) | 27 (5.7%) |
| Total | 1,042 (100.0%) | 471 (100.0%) |
Housing Structure by Heating Type in Meiners Oaks
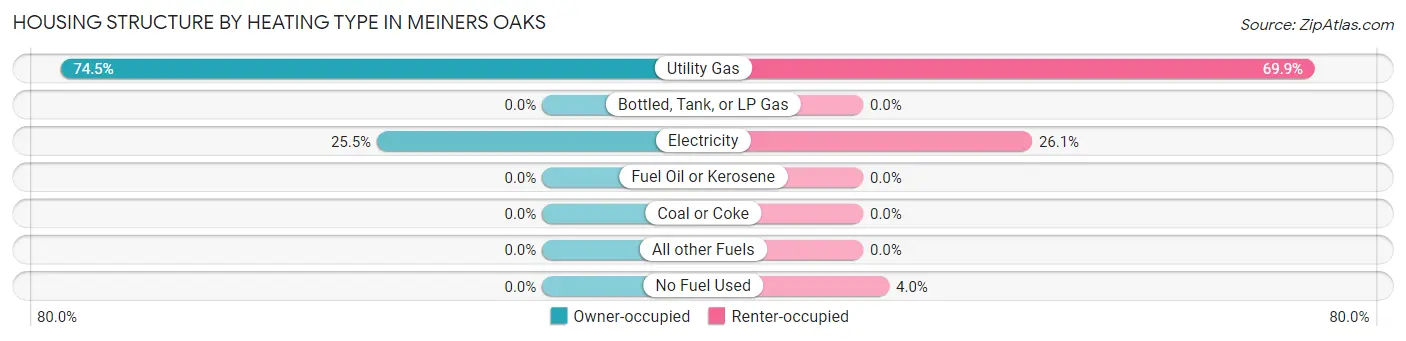
| Heating Type | Owner-occupied | Renter-occupied |
| Utility Gas | 776 (74.5%) | 329 (69.9%) |
| Bottled, Tank, or LP Gas | 0 (0.0%) | 0 (0.0%) |
| Electricity | 266 (25.5%) | 123 (26.1%) |
| Fuel Oil or Kerosene | 0 (0.0%) | 0 (0.0%) |
| Coal or Coke | 0 (0.0%) | 0 (0.0%) |
| All other Fuels | 0 (0.0%) | 0 (0.0%) |
| No Fuel Used | 0 (0.0%) | 19 (4.0%) |
| Total | 1,042 (100.0%) | 471 (100.0%) |
Household Vehicle Usage in Meiners Oaks
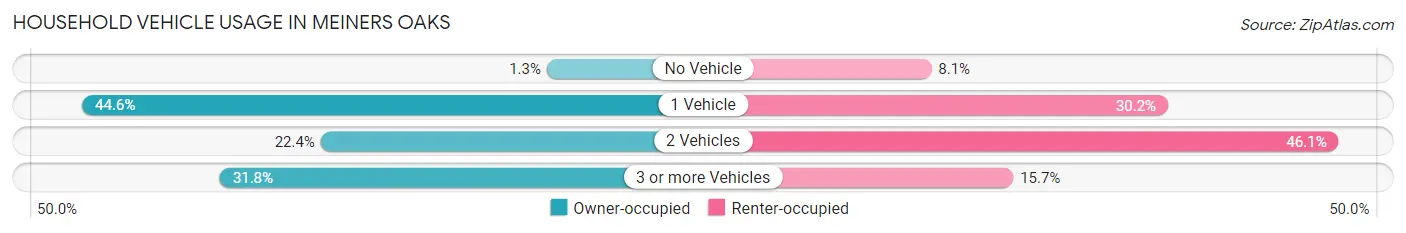
| Vehicles per Household | Owner-occupied | Renter-occupied |
| No Vehicle | 13 (1.3%) | 38 (8.1%) |
| 1 Vehicle | 465 (44.6%) | 142 (30.1%) |
| 2 Vehicles | 233 (22.4%) | 217 (46.1%) |
| 3 or more Vehicles | 331 (31.8%) | 74 (15.7%) |
| Total | 1,042 (100.0%) | 471 (100.0%) |
Real Estate & Mortgages in Meiners Oaks
Real Estate and Mortgage Overview in Meiners Oaks
| Characteristic | Without Mortgage | With Mortgage |
| Housing Units | 608 | 434 |
| Median Property Value | - | - |
| Median Household Income | $80,702 | $159 |
| Monthly Housing Costs | $1,002 | $233 |
| Real Estate Taxes | - | - |
Property Value by Mortgage Status in Meiners Oaks
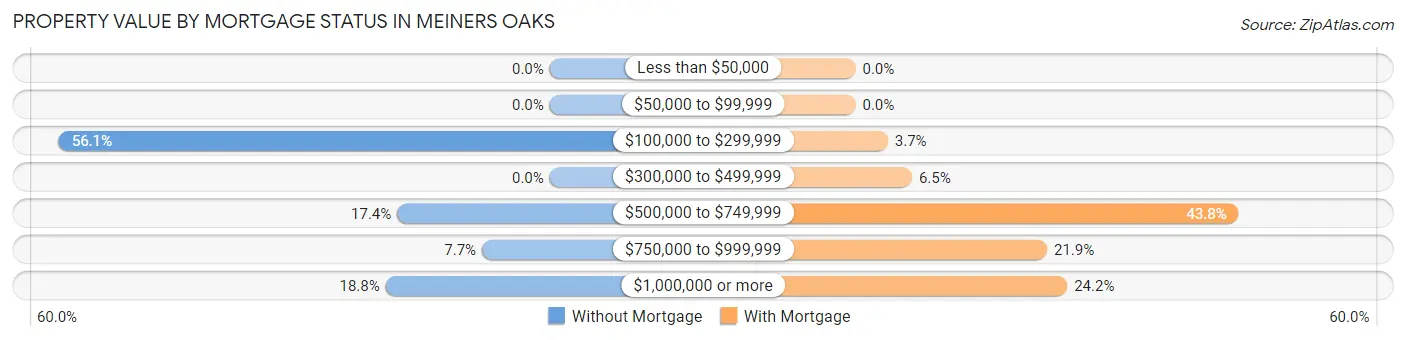
| Property Value | Without Mortgage | With Mortgage |
| Less than $50,000 | 0 (0.0%) | 0 (0.0%) |
| $50,000 to $99,999 | 0 (0.0%) | 0 (0.0%) |
| $100,000 to $299,999 | 341 (56.1%) | 16 (3.7%) |
| $300,000 to $499,999 | 0 (0.0%) | 28 (6.5%) |
| $500,000 to $749,999 | 106 (17.4%) | 190 (43.8%) |
| $750,000 to $999,999 | 47 (7.7%) | 95 (21.9%) |
| $1,000,000 or more | 114 (18.8%) | 105 (24.2%) |
| Total | 608 (100.0%) | 434 (100.0%) |
Household Income by Mortgage Status in Meiners Oaks
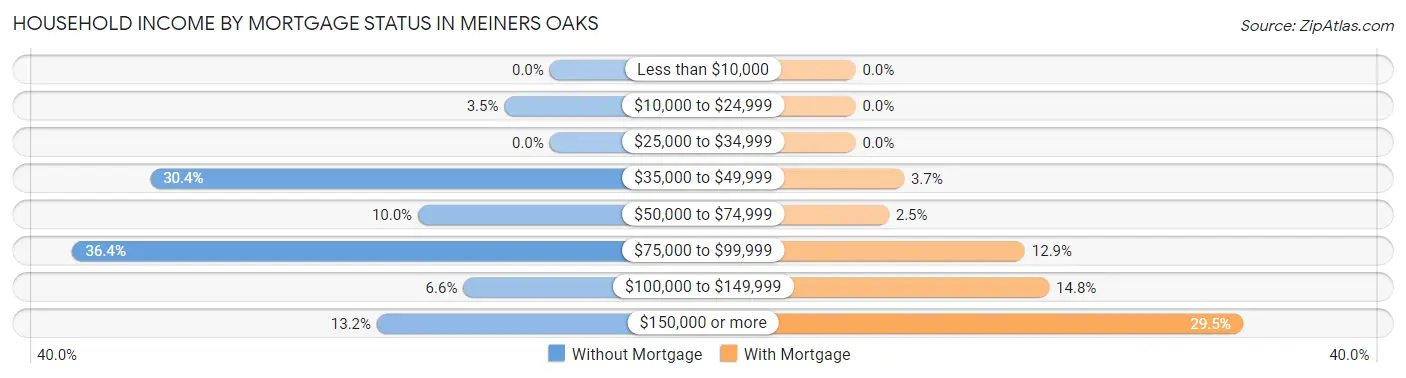
| Household Income | Without Mortgage | With Mortgage |
| Less than $10,000 | 0 (0.0%) | 0 (0.0%) |
| $10,000 to $24,999 | 21 (3.5%) | 0 (0.0%) |
| $25,000 to $34,999 | 0 (0.0%) | 0 (0.0%) |
| $35,000 to $49,999 | 185 (30.4%) | 16 (3.7%) |
| $50,000 to $74,999 | 61 (10.0%) | 11 (2.5%) |
| $75,000 to $99,999 | 221 (36.3%) | 56 (12.9%) |
| $100,000 to $149,999 | 40 (6.6%) | 64 (14.7%) |
| $150,000 or more | 80 (13.2%) | 128 (29.5%) |
| Total | 608 (100.0%) | 434 (100.0%) |
Property Value to Household Income Ratio in Meiners Oaks
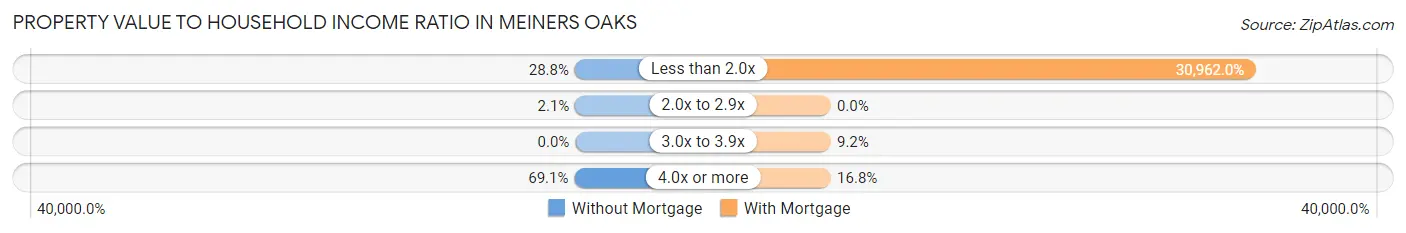
| Value-to-Income Ratio | Without Mortgage | With Mortgage |
| Less than 2.0x | 175 (28.8%) | 134,375 (30,962.0%) |
| 2.0x to 2.9x | 13 (2.1%) | 0 (0.0%) |
| 3.0x to 3.9x | 0 (0.0%) | 40 (9.2%) |
| 4.0x or more | 420 (69.1%) | 73 (16.8%) |
| Total | 608 (100.0%) | 434 (100.0%) |
Real Estate Taxes by Mortgage Status in Meiners Oaks
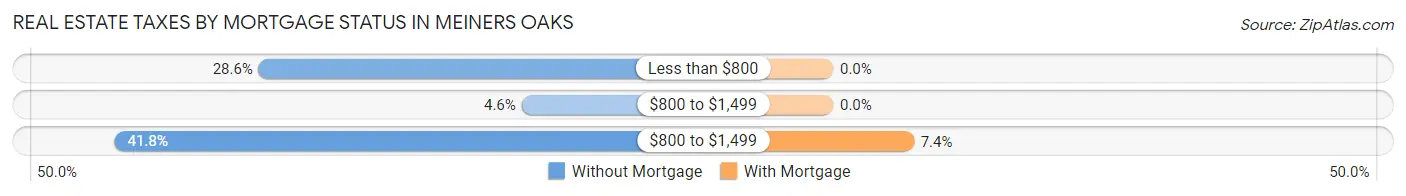
| Property Taxes | Without Mortgage | With Mortgage |
| Less than $800 | 174 (28.6%) | 0 (0.0%) |
| $800 to $1,499 | 28 (4.6%) | 0 (0.0%) |
| $800 to $1,499 | 254 (41.8%) | 32 (7.4%) |
| Total | 608 (100.0%) | 434 (100.0%) |
Health & Disability in Meiners Oaks
Health Insurance Coverage by Age in Meiners Oaks
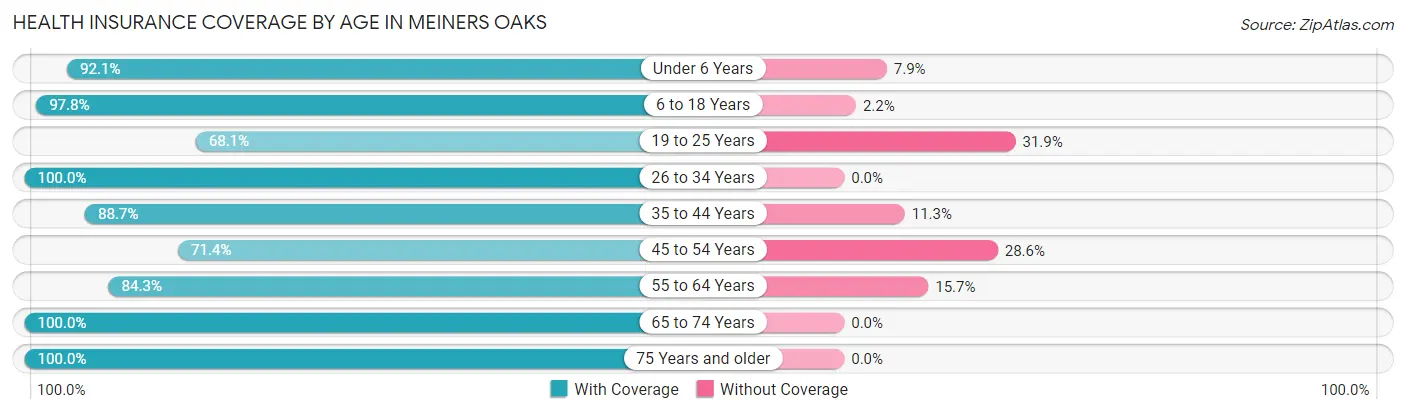
| Age Bracket | With Coverage | Without Coverage |
| Under 6 Years | 302 (92.1%) | 26 (7.9%) |
| 6 to 18 Years | 494 (97.8%) | 11 (2.2%) |
| 19 to 25 Years | 147 (68.1%) | 69 (31.9%) |
| 26 to 34 Years | 517 (100.0%) | 0 (0.0%) |
| 35 to 44 Years | 401 (88.7%) | 51 (11.3%) |
| 45 to 54 Years | 207 (71.4%) | 83 (28.6%) |
| 55 to 64 Years | 409 (84.3%) | 76 (15.7%) |
| 65 to 74 Years | 726 (100.0%) | 0 (0.0%) |
| 75 Years and older | 395 (100.0%) | 0 (0.0%) |
| Total | 3,598 (91.9%) | 316 (8.1%) |
Health Insurance Coverage by Citizenship Status in Meiners Oaks
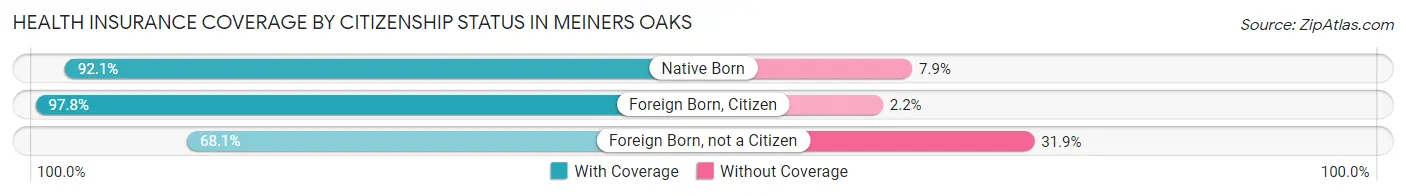
| Citizenship Status | With Coverage | Without Coverage |
| Native Born | 302 (92.1%) | 26 (7.9%) |
| Foreign Born, Citizen | 494 (97.8%) | 11 (2.2%) |
| Foreign Born, not a Citizen | 147 (68.1%) | 69 (31.9%) |
Health Insurance Coverage by Household Income in Meiners Oaks
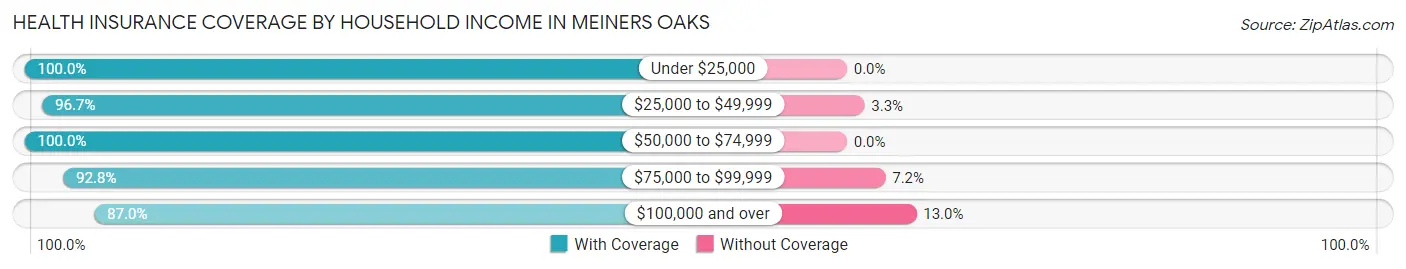
| Household Income | With Coverage | Without Coverage |
| Under $25,000 | 228 (100.0%) | 0 (0.0%) |
| $25,000 to $49,999 | 471 (96.7%) | 16 (3.3%) |
| $50,000 to $74,999 | 546 (100.0%) | 0 (0.0%) |
| $75,000 to $99,999 | 618 (92.8%) | 48 (7.2%) |
| $100,000 and over | 1,683 (87.0%) | 252 (13.0%) |
Public vs Private Health Insurance Coverage by Age in Meiners Oaks
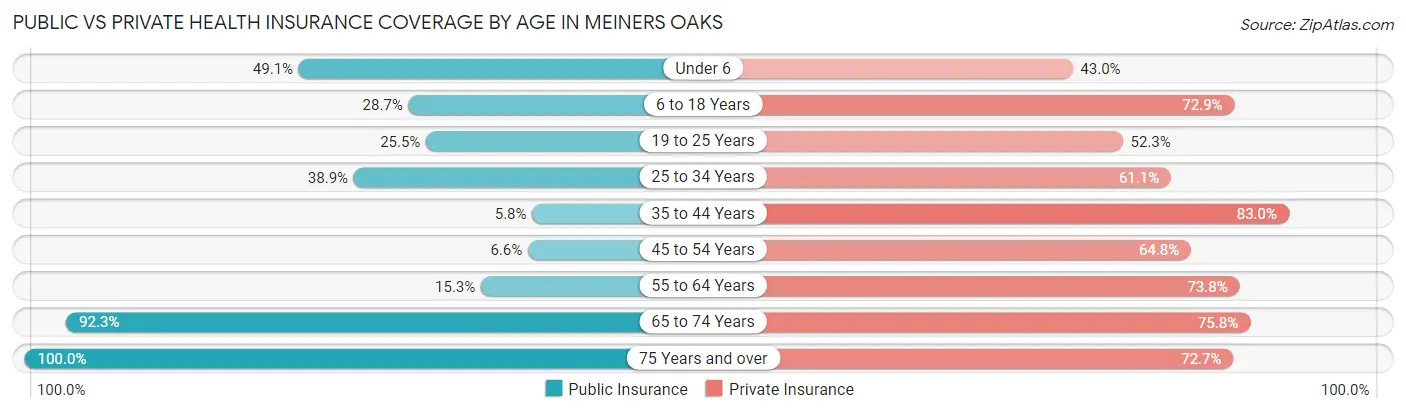
| Age Bracket | Public Insurance | Private Insurance |
| Under 6 | 161 (49.1%) | 141 (43.0%) |
| 6 to 18 Years | 145 (28.7%) | 368 (72.9%) |
| 19 to 25 Years | 55 (25.5%) | 113 (52.3%) |
| 25 to 34 Years | 201 (38.9%) | 316 (61.1%) |
| 35 to 44 Years | 26 (5.8%) | 375 (83.0%) |
| 45 to 54 Years | 19 (6.6%) | 188 (64.8%) |
| 55 to 64 Years | 74 (15.3%) | 358 (73.8%) |
| 65 to 74 Years | 670 (92.3%) | 550 (75.8%) |
| 75 Years and over | 395 (100.0%) | 287 (72.7%) |
| Total | 1,746 (44.6%) | 2,696 (68.9%) |
Disability Status by Sex by Age in Meiners Oaks
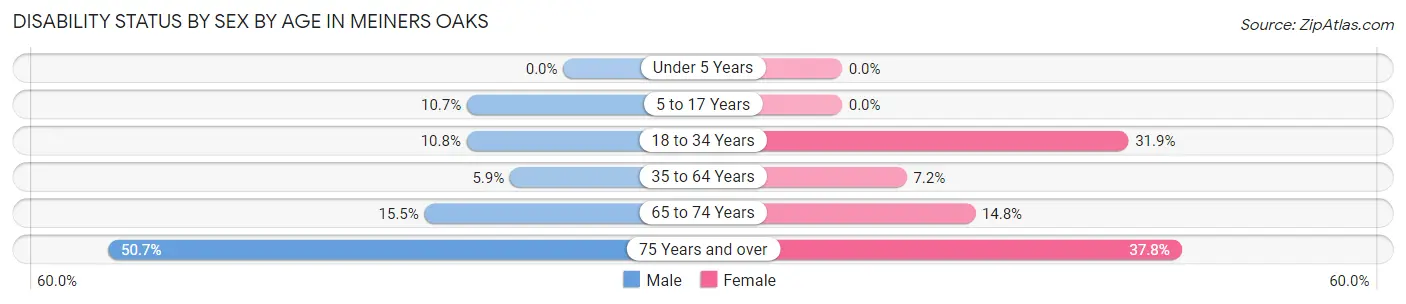
| Age Bracket | Male | Female |
| Under 5 Years | 0 (0.0%) | 0 (0.0%) |
| 5 to 17 Years | 28 (10.7%) | 0 (0.0%) |
| 18 to 34 Years | 31 (10.8%) | 148 (31.9%) |
| 35 to 64 Years | 30 (5.9%) | 52 (7.2%) |
| 65 to 74 Years | 59 (15.4%) | 51 (14.8%) |
| 75 Years and over | 144 (50.7%) | 42 (37.8%) |
Disability Class by Sex by Age in Meiners Oaks
Disability Class: Hearing Difficulty
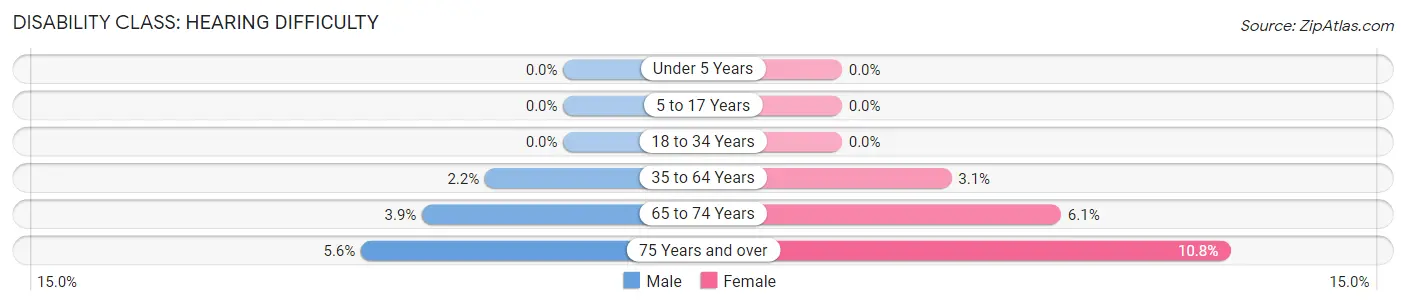
| Age Bracket | Male | Female |
| Under 5 Years | 0 (0.0%) | 0 (0.0%) |
| 5 to 17 Years | 0 (0.0%) | 0 (0.0%) |
| 18 to 34 Years | 0 (0.0%) | 0 (0.0%) |
| 35 to 64 Years | 11 (2.2%) | 22 (3.0%) |
| 65 to 74 Years | 15 (3.9%) | 21 (6.1%) |
| 75 Years and over | 16 (5.6%) | 12 (10.8%) |
Disability Class: Vision Difficulty
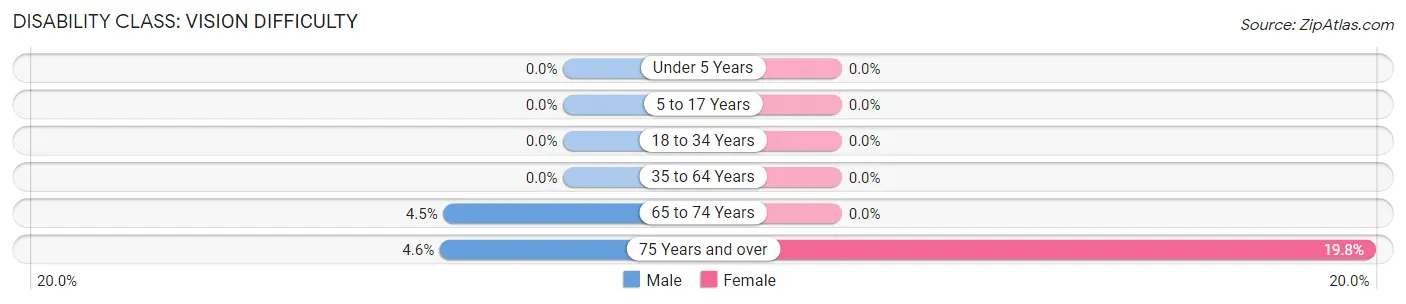
| Age Bracket | Male | Female |
| Under 5 Years | 0 (0.0%) | 0 (0.0%) |
| 5 to 17 Years | 0 (0.0%) | 0 (0.0%) |
| 18 to 34 Years | 0 (0.0%) | 0 (0.0%) |
| 35 to 64 Years | 0 (0.0%) | 0 (0.0%) |
| 65 to 74 Years | 17 (4.4%) | 0 (0.0%) |
| 75 Years and over | 13 (4.6%) | 22 (19.8%) |
Disability Class: Cognitive Difficulty
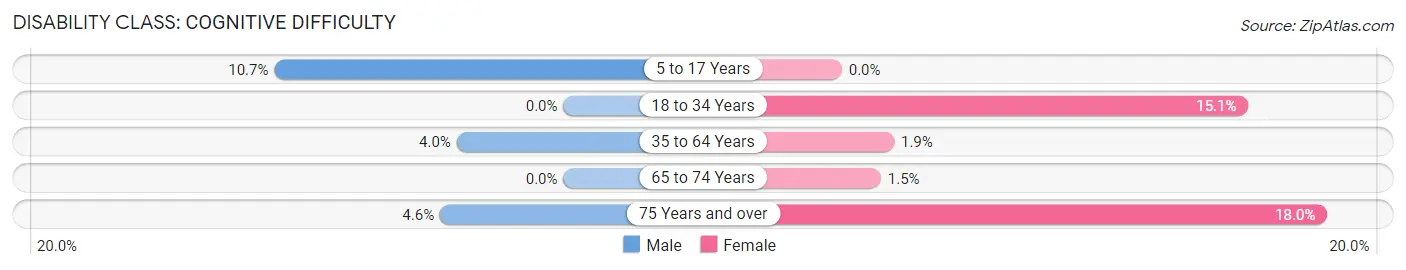
| Age Bracket | Male | Female |
| 5 to 17 Years | 28 (10.7%) | 0 (0.0%) |
| 18 to 34 Years | 0 (0.0%) | 70 (15.1%) |
| 35 to 64 Years | 20 (4.0%) | 14 (1.9%) |
| 65 to 74 Years | 0 (0.0%) | 5 (1.5%) |
| 75 Years and over | 13 (4.6%) | 20 (18.0%) |
Disability Class: Ambulatory Difficulty
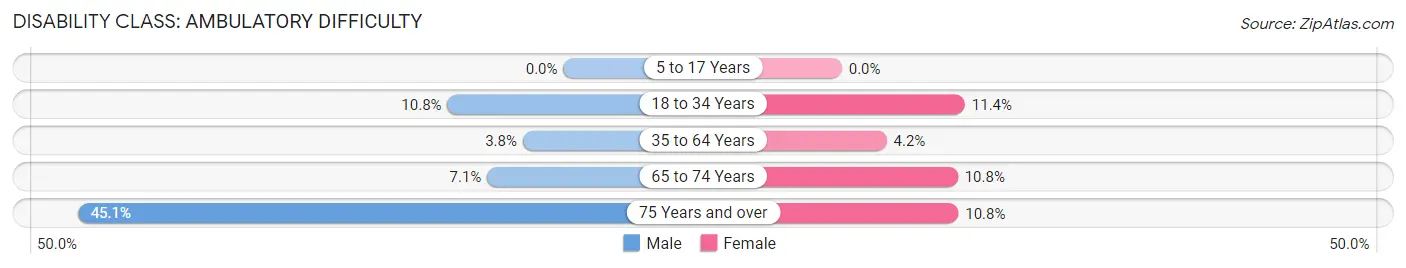
| Age Bracket | Male | Female |
| 5 to 17 Years | 0 (0.0%) | 0 (0.0%) |
| 18 to 34 Years | 31 (10.8%) | 53 (11.4%) |
| 35 to 64 Years | 19 (3.8%) | 30 (4.2%) |
| 65 to 74 Years | 27 (7.1%) | 37 (10.8%) |
| 75 Years and over | 128 (45.1%) | 12 (10.8%) |
Disability Class: Self-Care Difficulty
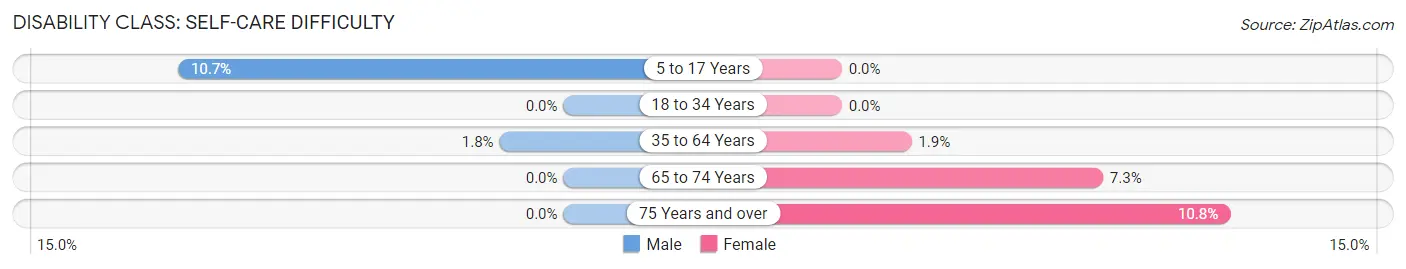
| Age Bracket | Male | Female |
| 5 to 17 Years | 28 (10.7%) | 0 (0.0%) |
| 18 to 34 Years | 0 (0.0%) | 0 (0.0%) |
| 35 to 64 Years | 9 (1.8%) | 14 (1.9%) |
| 65 to 74 Years | 0 (0.0%) | 25 (7.3%) |
| 75 Years and over | 0 (0.0%) | 12 (10.8%) |
Technology Access in Meiners Oaks
Computing Device Access in Meiners Oaks
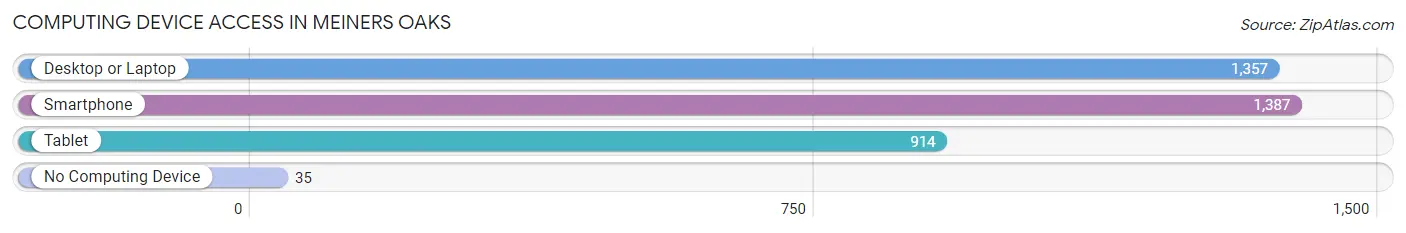
| Device Type | # Households | % Households |
| Desktop or Laptop | 1,357 | 89.7% |
| Smartphone | 1,387 | 91.7% |
| Tablet | 914 | 60.4% |
| No Computing Device | 35 | 2.3% |
| Total | 1,513 | 100.0% |
Internet Access in Meiners Oaks
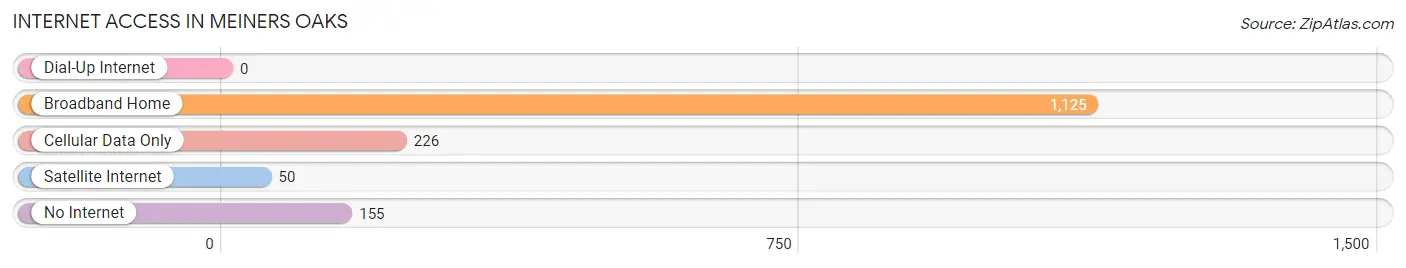
| Internet Type | # Households | % Households |
| Dial-Up Internet | 0 | 0.0% |
| Broadband Home | 1,125 | 74.4% |
| Cellular Data Only | 226 | 14.9% |
| Satellite Internet | 50 | 3.3% |
| No Internet | 155 | 10.2% |
| Total | 1,513 | 100.0% |
Meiners Oaks Summary
Meiners Oaks is a small unincorporated community located in the Ojai Valley of Ventura County, California. It is situated in the foothills of the Topatopa Mountains, approximately 8 miles (13 km) east of the city of Ojai. The population of Meiners Oaks was estimated to be 1,845 in 2019.
History
Meiners Oaks was founded in 1874 by German immigrant August Meiners. Meiners purchased the land from the Chumash Indians and established a ranch, which he named “Oaks Ranch”. The town was later renamed Meiners Oaks in his honor.
In the early 1900s, Meiners Oaks was a popular destination for tourists and vacationers. The town was known for its hot springs, which were believed to have healing properties. The hot springs were eventually closed due to health concerns.
In the 1920s, Meiners Oaks became a popular destination for Hollywood celebrities. Many of the town’s buildings were used as sets for movies and television shows.
Geography
Meiners Oaks is located in the Ojai Valley of Ventura County, California. It is situated in the foothills of the Topatopa Mountains, approximately 8 miles (13 km) east of the city of Ojai. The town is bordered by the Los Padres National Forest to the north and east, and the Ventura River to the south.
The climate in Meiners Oaks is Mediterranean, with hot, dry summers and mild, wet winters. The average annual temperature is 68°F (20°C).
Economy
Meiners Oaks is primarily a residential community, with a small commercial district. The town is home to several small businesses, including restaurants, cafes, and shops.
The town is also home to several wineries including the Ojai Vineyard and the Topa Mountain Winery
Demographics
As of 2019, the population of Meiners Oaks was estimated to be 1,845. The racial makeup of the town was 79.3% White, 0.7% African American, 0.7% Native American, 0.7% Asian, 0.2% Pacific Islander, and 17.2% from other races. The median household income was $60,938.
Conclusion
Meiners Oaks is a small unincorporated community located in the Ojai Valley of Ventura County, California. It was founded in 1874 by German immigrant August Meiners and was originally named “Oaks Ranch”. The town is primarily a residential community, with a small commercial district. The population of Meiners Oaks was estimated to be 1,845 in 2019. The town is home to several small businesses, wineries, and restaurants.
Common Questions
What is Per Capita Income in Meiners Oaks?
Per Capita income in Meiners Oaks is $49,989.
What is the Median Family Income in Meiners Oaks?
Median Family Income in Meiners Oaks is $93,750.
What is the Median Household income in Meiners Oaks?
Median Household Income in Meiners Oaks is $87,567.
What is Income or Wage Gap in Meiners Oaks?
Income or Wage Gap in Meiners Oaks is 42.0%.
Women in Meiners Oaks earn 58.0 cents for every dollar earned by a man.
What is Inequality or Gini Index in Meiners Oaks?
Inequality or Gini Index in Meiners Oaks is 0.51.
What is the Total Population of Meiners Oaks?
Total Population of Meiners Oaks is 3,914.
What is the Total Male Population of Meiners Oaks?
Total Male Population of Meiners Oaks is 1,862.
What is the Total Female Population of Meiners Oaks?
Total Female Population of Meiners Oaks is 2,052.
What is the Ratio of Males per 100 Females in Meiners Oaks?
There are 90.74 Males per 100 Females in Meiners Oaks.
What is the Ratio of Females per 100 Males in Meiners Oaks?
There are 110.20 Females per 100 Males in Meiners Oaks.
What is the Median Population Age in Meiners Oaks?
Median Population Age in Meiners Oaks is 43.5 Years.
What is the Average Family Size in Meiners Oaks
Average Family Size in Meiners Oaks is 3.1 People.
What is the Average Household Size in Meiners Oaks
Average Household Size in Meiners Oaks is 2.5 People.
How Large is the Labor Force in Meiners Oaks?
There are 1,770 People in the Labor Forcein in Meiners Oaks.
What is the Percentage of People in the Labor Force in Meiners Oaks?
57.1% of People are in the Labor Force in Meiners Oaks.
What is the Unemployment Rate in Meiners Oaks?
Unemployment Rate in Meiners Oaks is 2.6%.