Baker, CA Map & Demographics
Baker Map
Baker Overview
$20,306
PER CAPITA INCOME
$75,321
AVG FAMILY INCOME
$31,786
AVG HOUSEHOLD INCOME
0.41
INEQUALITY / GINI INDEX
553
TOTAL POPULATION
273
MALE POPULATION
280
FEMALE POPULATION
97.50
MALES / 100 FEMALES
102.56
FEMALES / 100 MALES
28.3
MEDIAN AGE
3.1
AVG FAMILY SIZE
2.6
AVG HOUSEHOLD SIZE
328
LABOR FORCE [ PEOPLE ]
77.4%
PERCENT IN LABOR FORCE
4.0%
UNEMPLOYMENT RATE
Baker Zip Codes
Income in Baker
Income Overview in Baker
Per Capita Income in Baker is $20,306, while median incomes of families and households are $75,321 and $31,786 respectively.
| Characteristic | Number | Measure |
| Per Capita Income | 553 | $20,306 |
| Median Family Income | 137 | $75,321 |
| Mean Family Income | 137 | $66,331 |
| Median Household Income | 208 | $31,786 |
| Mean Household Income | 208 | $53,267 |
| Income Deficit | 137 | $0 |
| Wage / Income Gap (%) | 553 | 0.00% |
| Wage / Income Gap ($) | 553 | 100.00¢ per $1 |
| Gini / Inequality Index | 553 | 0.41 |
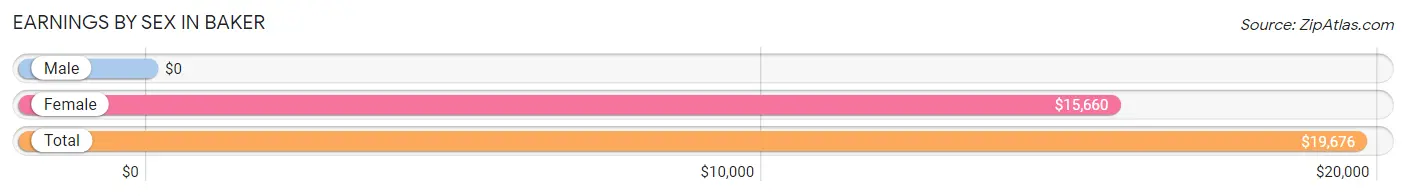
Earnings by Sex in Baker
| Sex | Number | Average Earnings |
| Male | 171 (50.4%) | $0 |
| Female | 168 (49.6%) | $15,660 |
| Total | 339 (100.0%) | $19,676 |
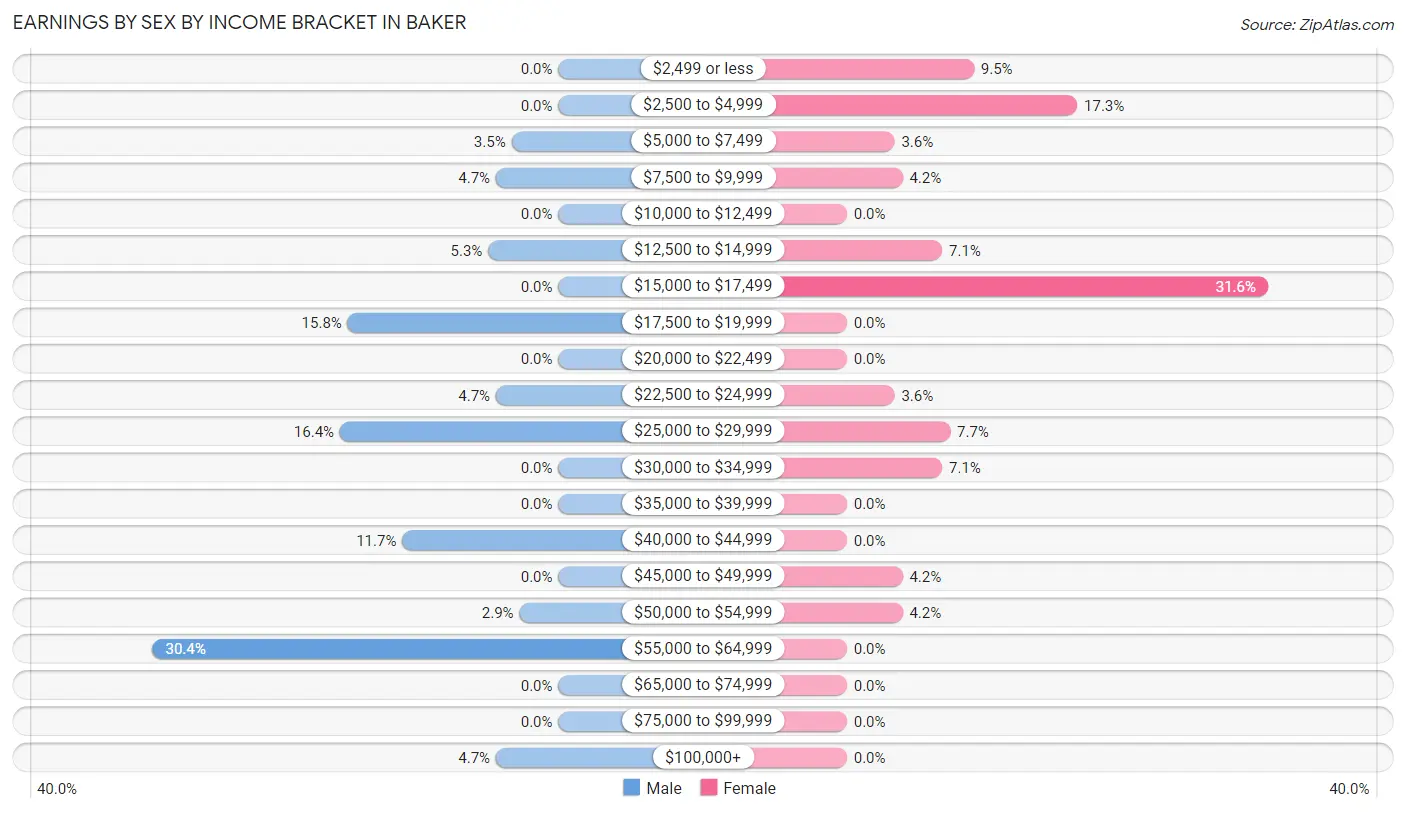
Earnings by Sex by Income Bracket in Baker
The most common earnings brackets in Baker are $55,000 to $64,999 for men (52 | 30.4%) and $15,000 to $17,499 for women (53 | 31.6%).
| Income | Male | Female |
| $2,499 or less | 0 (0.0%) | 16 (9.5%) |
| $2,500 to $4,999 | 0 (0.0%) | 29 (17.3%) |
| $5,000 to $7,499 | 6 (3.5%) | 6 (3.6%) |
| $7,500 to $9,999 | 8 (4.7%) | 7 (4.2%) |
| $10,000 to $12,499 | 0 (0.0%) | 0 (0.0%) |
| $12,500 to $14,999 | 9 (5.3%) | 12 (7.1%) |
| $15,000 to $17,499 | 0 (0.0%) | 53 (31.6%) |
| $17,500 to $19,999 | 27 (15.8%) | 0 (0.0%) |
| $20,000 to $22,499 | 0 (0.0%) | 0 (0.0%) |
| $22,500 to $24,999 | 8 (4.7%) | 6 (3.6%) |
| $25,000 to $29,999 | 28 (16.4%) | 13 (7.7%) |
| $30,000 to $34,999 | 0 (0.0%) | 12 (7.1%) |
| $35,000 to $39,999 | 0 (0.0%) | 0 (0.0%) |
| $40,000 to $44,999 | 20 (11.7%) | 0 (0.0%) |
| $45,000 to $49,999 | 0 (0.0%) | 7 (4.2%) |
| $50,000 to $54,999 | 5 (2.9%) | 7 (4.2%) |
| $55,000 to $64,999 | 52 (30.4%) | 0 (0.0%) |
| $65,000 to $74,999 | 0 (0.0%) | 0 (0.0%) |
| $75,000 to $99,999 | 0 (0.0%) | 0 (0.0%) |
| $100,000+ | 8 (4.7%) | 0 (0.0%) |
| Total | 171 (100.0%) | 168 (100.0%) |
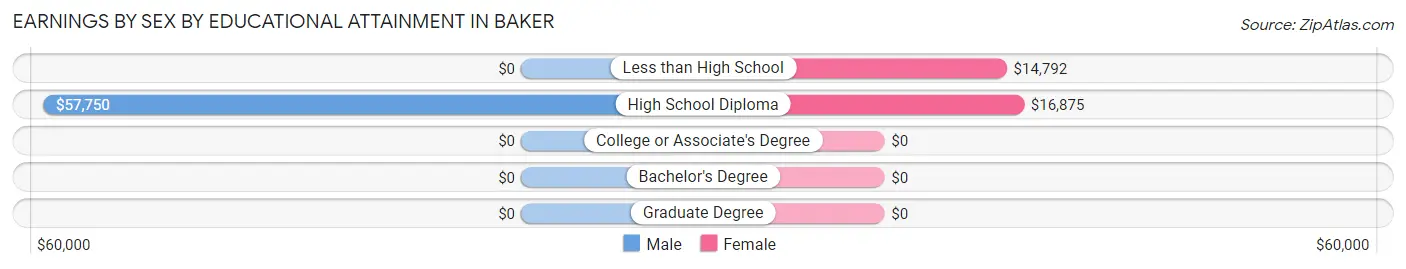
Earnings by Sex by Educational Attainment in Baker
Average earnings in Baker are $41,346 for men and $16,594 for women, a difference of 59.9%. Men with an educational attainment of high school diploma enjoy the highest average annual earnings of $57,750, while those with high school diploma education earn the least with $57,750. Women with an educational attainment of high school diploma earn the most with the average annual earnings of $16,875, while those with less than high school education have the smallest earnings of $14,792.
| Educational Attainment | Male Income | Female Income |
| Less than High School | - | - |
| High School Diploma | $57,750 | $16,875 |
| College or Associate's Degree | - | - |
| Bachelor's Degree | - | - |
| Graduate Degree | - | - |
| Total | $41,346 | $16,594 |
Family Income in Baker
Family Income Brackets in Baker
According to the Baker family income data, there are 57 families falling into the $75,000 to $99,999 income range, which is the most common income bracket and makes up 41.6% of all families.
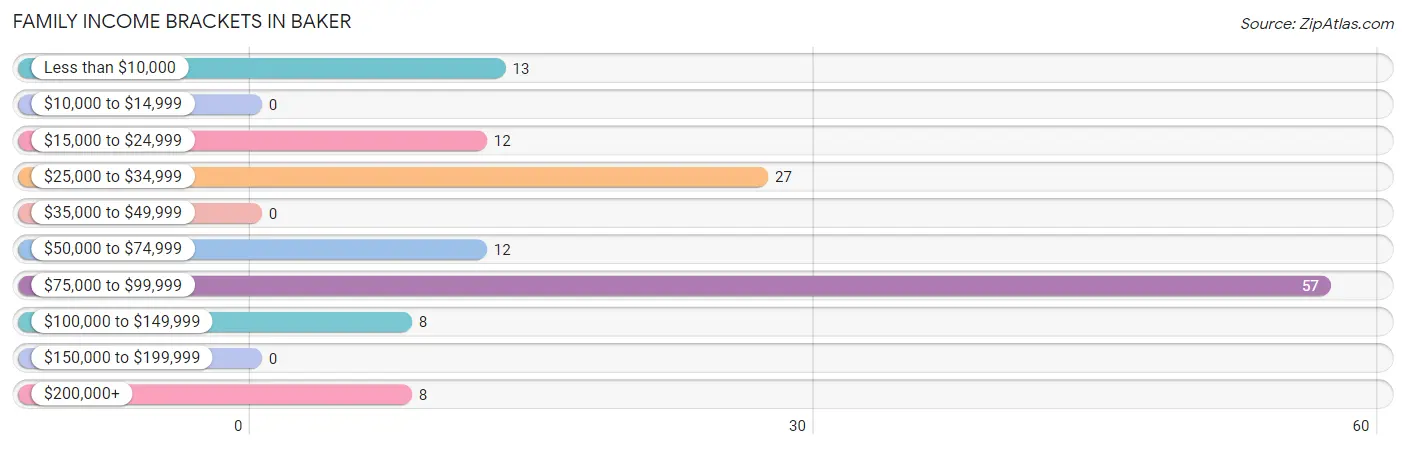
| Income Bracket | # Families | % Families |
| Less than $10,000 | 13 | 9.5% |
| $10,000 to $14,999 | 0 | 0.0% |
| $15,000 to $24,999 | 12 | 8.8% |
| $25,000 to $34,999 | 27 | 19.7% |
| $35,000 to $49,999 | 0 | 0.0% |
| $50,000 to $74,999 | 12 | 8.8% |
| $75,000 to $99,999 | 57 | 41.6% |
| $100,000 to $149,999 | 8 | 5.8% |
| $150,000 to $199,999 | 0 | 0.0% |
| $200,000+ | 8 | 5.8% |
Family Income by Famaliy Size in Baker
2-person families (74 | 54.0%) account for the highest median family income in Baker with $75,929 per family, while 2-person families (74 | 54.0%) have the highest median income of $37,964 per family member.
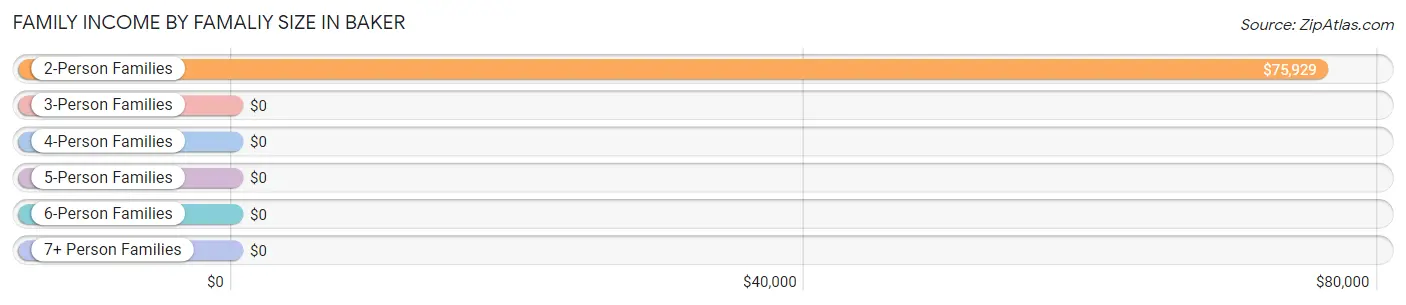
| Income Bracket | # Families | Median Income |
| 2-Person Families | 74 (54.0%) | $75,929 |
| 3-Person Families | 16 (11.7%) | $0 |
| 4-Person Families | 21 (15.3%) | $0 |
| 5-Person Families | 13 (9.5%) | $0 |
| 6-Person Families | 13 (9.5%) | $0 |
| 7+ Person Families | 0 (0.0%) | $0 |
| Total | 137 (100.0%) | $75,321 |
Family Income by Number of Earners in Baker
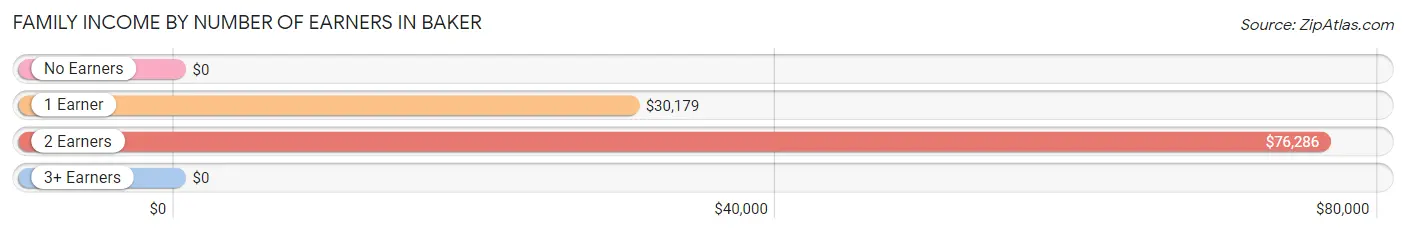
| Number of Earners | # Families | Median Income |
| No Earners | 16 (11.7%) | $0 |
| 1 Earner | 26 (19.0%) | $30,179 |
| 2 Earners | 74 (54.0%) | $76,286 |
| 3+ Earners | 21 (15.3%) | $0 |
| Total | 137 (100.0%) | $75,321 |
Household Income in Baker
Household Income Brackets in Baker
With 67 households falling in the category, the $25,000 to $34,999 income range is the most frequent in Baker, accounting for 32.2% of all households.
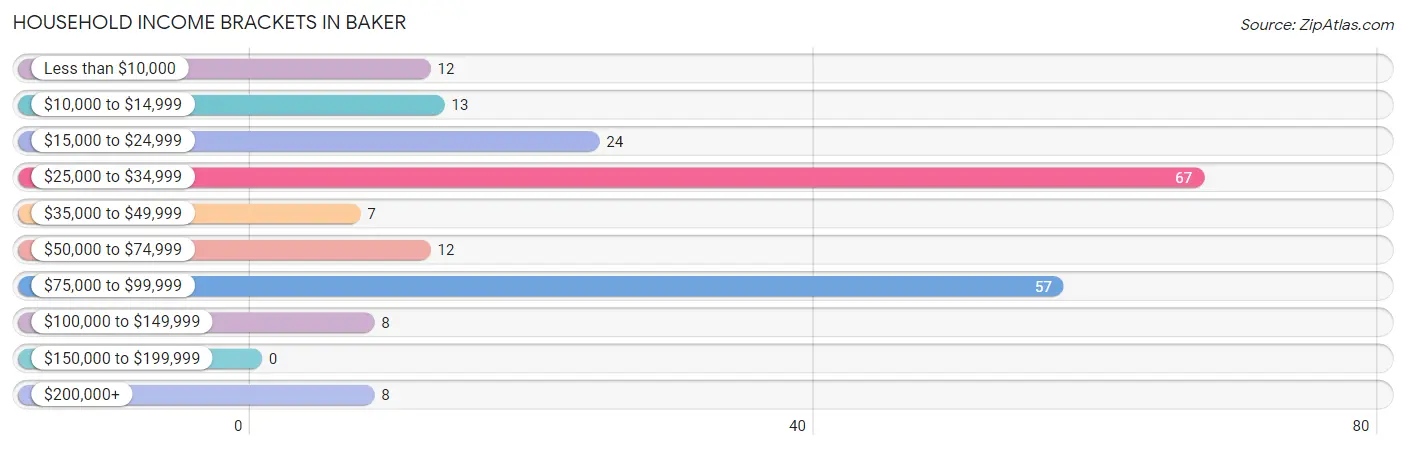
| Income Bracket | # Households | % Households |
| Less than $10,000 | 12 | 5.8% |
| $10,000 to $14,999 | 13 | 6.3% |
| $15,000 to $24,999 | 24 | 11.5% |
| $25,000 to $34,999 | 67 | 32.2% |
| $35,000 to $49,999 | 7 | 3.4% |
| $50,000 to $74,999 | 12 | 5.8% |
| $75,000 to $99,999 | 57 | 27.4% |
| $100,000 to $149,999 | 8 | 3.8% |
| $150,000 to $199,999 | 0 | 0.0% |
| $200,000+ | 8 | 3.8% |
Household Income by Householder Age in Baker
The median household income in Baker is $31,786, with the highest median household income of $66,667 found in the 45 to 64 years age bracket for the primary householder. A total of 74 households (35.6%) fall into this category. Meanwhile, the 25 to 44 years age bracket for the primary householder has the lowest median household income of $0, with 81 households (38.9%) in this group.
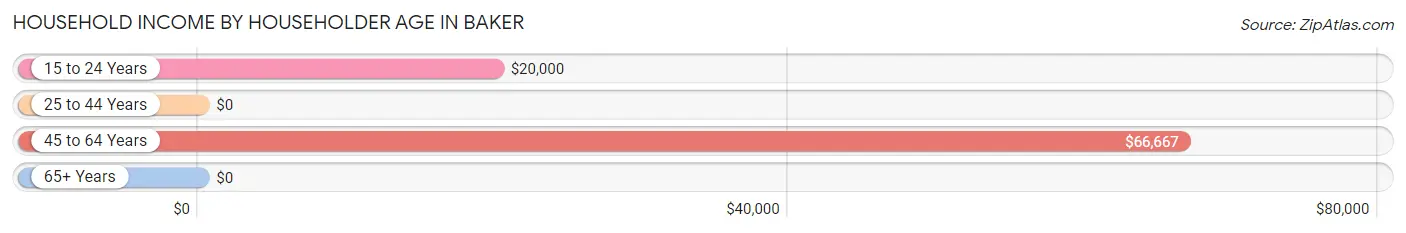
| Income Bracket | # Households | Median Income |
| 15 to 24 Years | 38 (18.3%) | $20,000 |
| 25 to 44 Years | 81 (38.9%) | $0 |
| 45 to 64 Years | 74 (35.6%) | $66,667 |
| 65+ Years | 15 (7.2%) | $0 |
| Total | 208 (100.0%) | $31,786 |
Poverty in Baker
Income Below Poverty by Sex and Age in Baker
With 24.2% poverty level for males and 37.6% for females among the residents of Baker, under 5 year old males and under 5 year old females are the most vulnerable to poverty, with 7 males (100.0%) and 31 females (68.9%) in their respective age groups living below the poverty level.
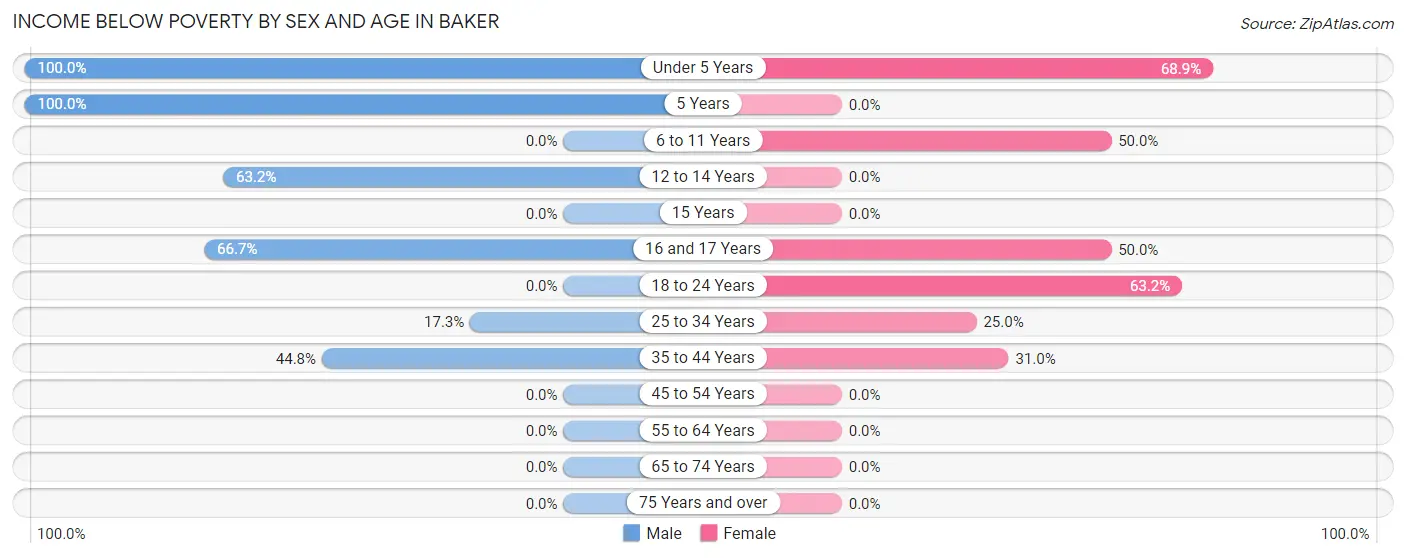
| Age Bracket | Male | Female |
| Under 5 Years | 7 (100.0%) | 31 (68.9%) |
| 5 Years | 13 (100.0%) | 0 (0.0%) |
| 6 to 11 Years | 0 (0.0%) | 7 (50.0%) |
| 12 to 14 Years | 12 (63.2%) | 0 (0.0%) |
| 15 Years | 0 (0.0%) | 0 (0.0%) |
| 16 and 17 Years | 12 (66.7%) | 6 (50.0%) |
| 18 to 24 Years | 0 (0.0%) | 36 (63.2%) |
| 25 to 34 Years | 9 (17.3%) | 8 (25.0%) |
| 35 to 44 Years | 13 (44.8%) | 13 (30.9%) |
| 45 to 54 Years | 0 (0.0%) | 0 (0.0%) |
| 55 to 64 Years | 0 (0.0%) | 0 (0.0%) |
| 65 to 74 Years | 0 (0.0%) | 0 (0.0%) |
| 75 Years and over | 0 (0.0%) | 0 (0.0%) |
| Total | 66 (24.2%) | 101 (37.6%) |
Income Above Poverty by Sex and Age in Baker
According to the poverty statistics in Baker, males aged 6 to 11 years and females aged 45 to 54 years are the age groups that are most secure financially, with 100.0% of males and 100.0% of females in these age groups living above the poverty line.
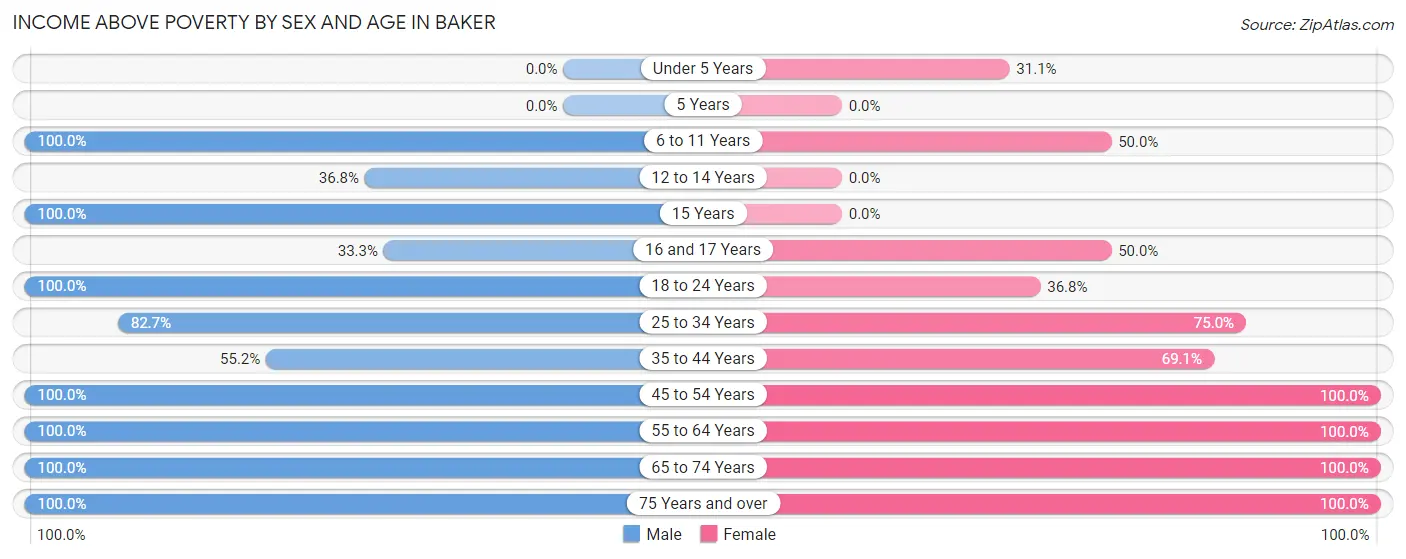
| Age Bracket | Male | Female |
| Under 5 Years | 0 (0.0%) | 14 (31.1%) |
| 5 Years | 0 (0.0%) | 0 (0.0%) |
| 6 to 11 Years | 14 (100.0%) | 7 (50.0%) |
| 12 to 14 Years | 7 (36.8%) | 0 (0.0%) |
| 15 Years | 6 (100.0%) | 0 (0.0%) |
| 16 and 17 Years | 6 (33.3%) | 6 (50.0%) |
| 18 to 24 Years | 25 (100.0%) | 21 (36.8%) |
| 25 to 34 Years | 43 (82.7%) | 24 (75.0%) |
| 35 to 44 Years | 16 (55.2%) | 29 (69.1%) |
| 45 to 54 Years | 17 (100.0%) | 6 (100.0%) |
| 55 to 64 Years | 60 (100.0%) | 46 (100.0%) |
| 65 to 74 Years | 10 (100.0%) | 6 (100.0%) |
| 75 Years and over | 3 (100.0%) | 9 (100.0%) |
| Total | 207 (75.8%) | 168 (62.5%) |
Income Below Poverty Among Married-Couple Families in Baker
The poverty statistics for married-couple families in Baker show that 8.2% or 7 of the total 85 families live below the poverty line. Families with 3 or 4 children have the highest poverty rate of 100.0%, comprising of 7 families. On the other hand, families with no children have the lowest poverty rate of 0.0%, which includes 0 families.
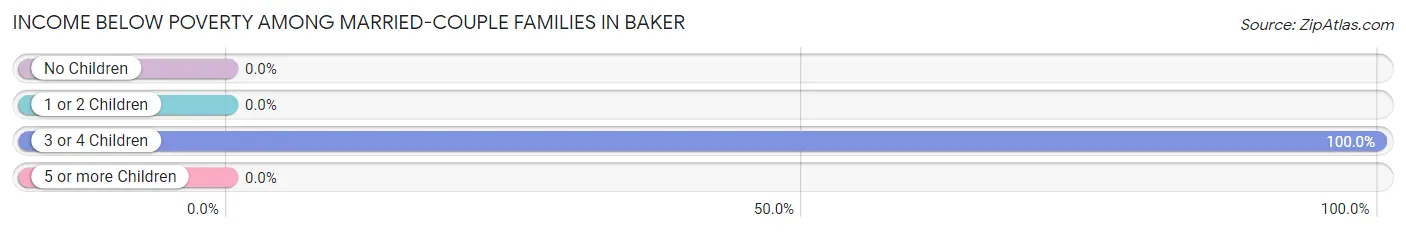
| Children | Above Poverty | Below Poverty |
| No Children | 70 (100.0%) | 0 (0.0%) |
| 1 or 2 Children | 8 (100.0%) | 0 (0.0%) |
| 3 or 4 Children | 0 (0.0%) | 7 (100.0%) |
| 5 or more Children | 0 (0.0%) | 0 (0.0%) |
| Total | 78 (91.8%) | 7 (8.2%) |
Income Below Poverty Among Single-Parent Households in Baker
According to the poverty data in Baker, 42.9% or 6 single-father households and 34.2% or 13 single-mother households are living below the poverty line. Among single-father households, those with 3 or 4 children have the highest poverty rate, with 6 households (100.0%) experiencing poverty. Likewise, among single-mother households, those with 1 or 2 children have the highest poverty rate, with 6 households (100.0%) falling below the poverty line.
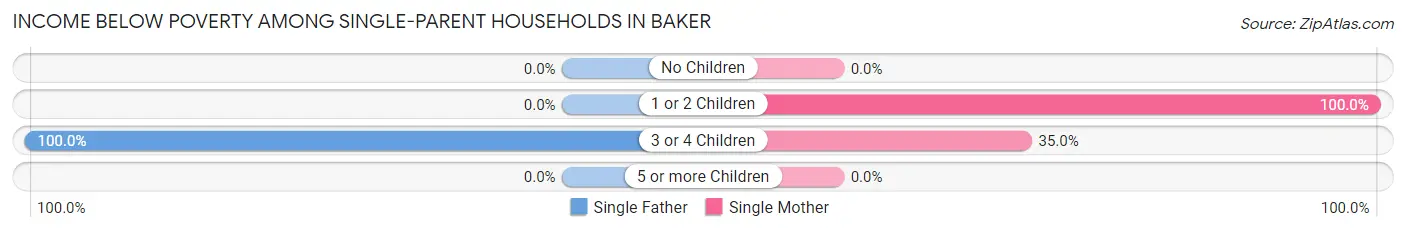
| Children | Single Father | Single Mother |
| No Children | 0 (0.0%) | 0 (0.0%) |
| 1 or 2 Children | 0 (0.0%) | 6 (100.0%) |
| 3 or 4 Children | 6 (100.0%) | 7 (35.0%) |
| 5 or more Children | 0 (0.0%) | 0 (0.0%) |
| Total | 6 (42.9%) | 13 (34.2%) |
Income Below Poverty Among Married-Couple vs Single-Parent Households in Baker
The poverty data for Baker shows that 7 of the married-couple family households (8.2%) and 19 of the single-parent households (36.5%) are living below the poverty level. Within the married-couple family households, those with 3 or 4 children have the highest poverty rate, with 7 households (100.0%) falling below the poverty line. Among the single-parent households, those with 3 or 4 children have the highest poverty rate, with 13 household (50.0%) living below poverty.
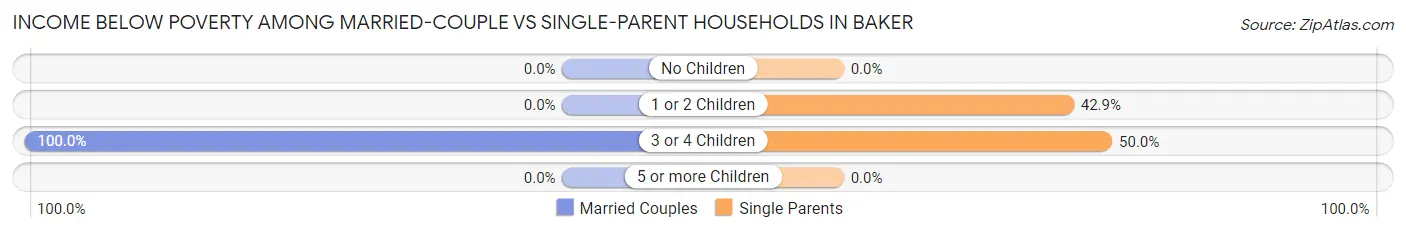
| Children | Married-Couple Families | Single-Parent Households |
| No Children | 0 (0.0%) | 0 (0.0%) |
| 1 or 2 Children | 0 (0.0%) | 6 (42.9%) |
| 3 or 4 Children | 7 (100.0%) | 13 (50.0%) |
| 5 or more Children | 0 (0.0%) | 0 (0.0%) |
| Total | 7 (8.2%) | 19 (36.5%) |
Race in Baker
The most populous races in Baker are Hispanic or Latino (478 | 86.4%), White / Caucasian (290 | 52.4%), and Two or more Races (117 | 21.2%).
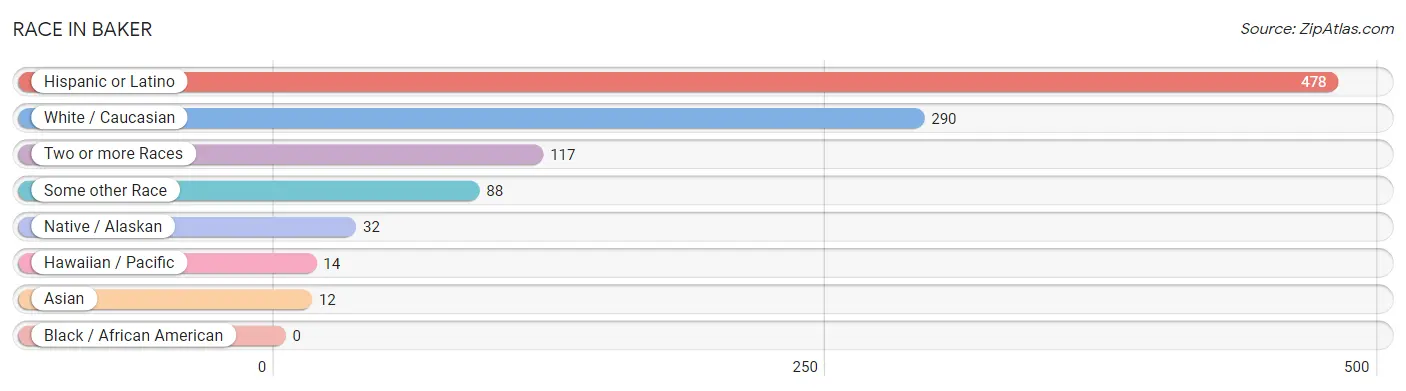
| Race | # Population | % Population |
| Asian | 12 | 2.2% |
| Black / African American | 0 | 0.0% |
| Hawaiian / Pacific | 14 | 2.5% |
| Hispanic or Latino | 478 | 86.4% |
| Native / Alaskan | 32 | 5.8% |
| White / Caucasian | 290 | 52.4% |
| Two or more Races | 117 | 21.2% |
| Some other Race | 88 | 15.9% |
| Total | 553 | 100.0% |
Ancestry in Baker
The most populous ancestries reported in Baker are Mexican (457 | 82.6%), American (81 | 14.6%), Mexican American Indian (32 | 5.8%), Central American (14 | 2.5%), and Guatemalan (14 | 2.5%), together accounting for 108.1% of all Baker residents.
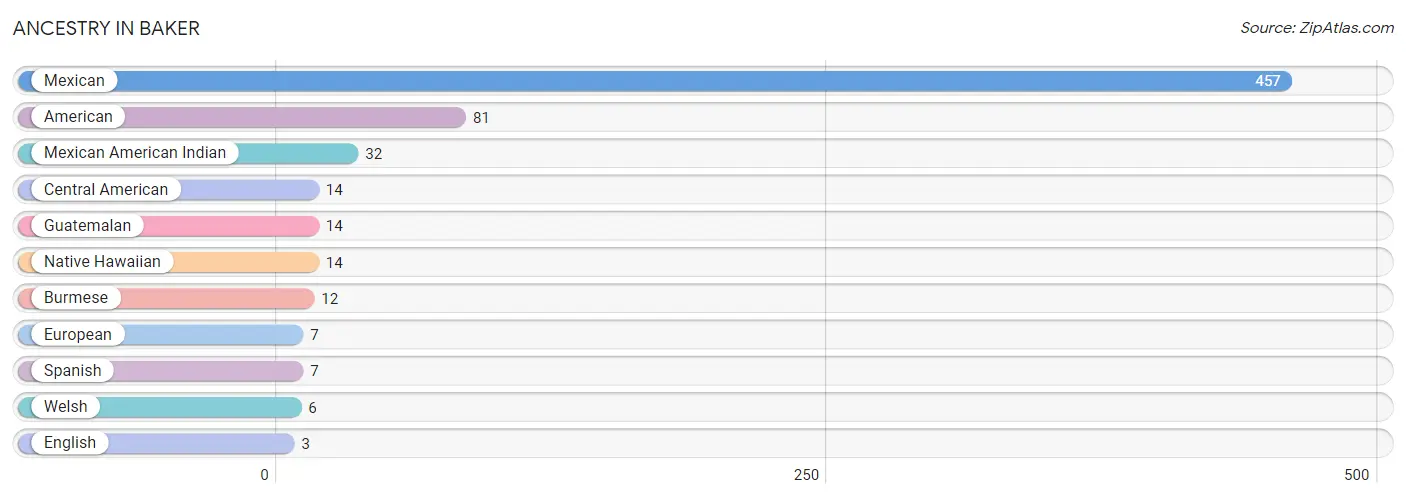
| Ancestry | # Population | % Population |
| American | 81 | 14.6% |
| Burmese | 12 | 2.2% |
| Central American | 14 | 2.5% |
| English | 3 | 0.5% |
| European | 7 | 1.3% |
| Guatemalan | 14 | 2.5% |
| Mexican | 457 | 82.6% |
| Mexican American Indian | 32 | 5.8% |
| Native Hawaiian | 14 | 2.5% |
| Spanish | 7 | 1.3% |
| Welsh | 6 | 1.1% | View All 11 Rows |
Immigrants in Baker
The most numerous immigrant groups reported in Baker came from Latin America (258 | 46.7%), Central America (251 | 45.4%), Mexico (251 | 45.4%), Asia (12 | 2.2%), and Eastern Asia (12 | 2.2%), together accounting for 141.8% of all Baker residents.
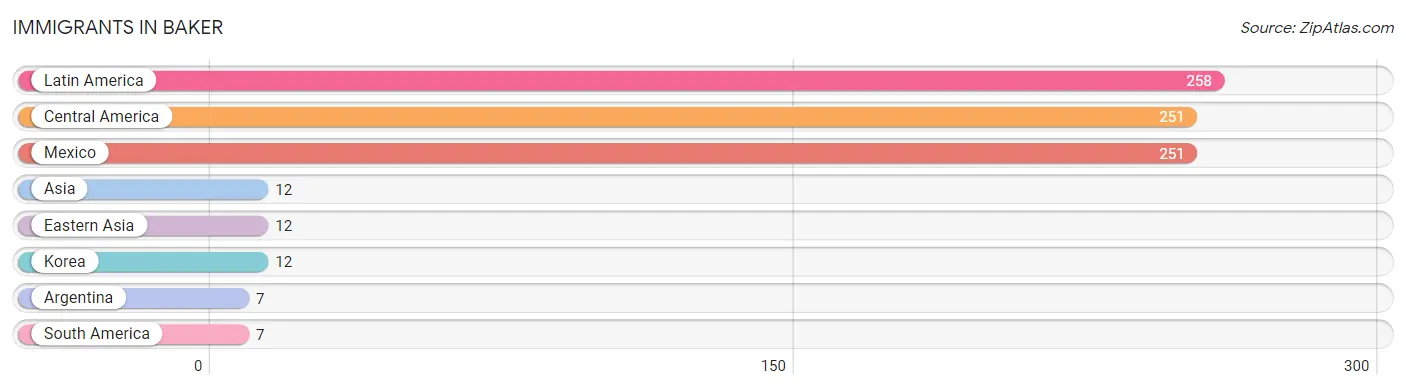
| Immigration Origin | # Population | % Population |
| Argentina | 7 | 1.3% |
| Asia | 12 | 2.2% |
| Central America | 251 | 45.4% |
| Eastern Asia | 12 | 2.2% |
| Korea | 12 | 2.2% |
| Latin America | 258 | 46.7% |
| Mexico | 251 | 45.4% |
| South America | 7 | 1.3% | View All 8 Rows |
Sex and Age in Baker
Sex and Age in Baker
The most populous age groups in Baker are 60 to 64 Years (60 | 22.0%) for men and Under 5 Years (56 | 20.0%) for women.
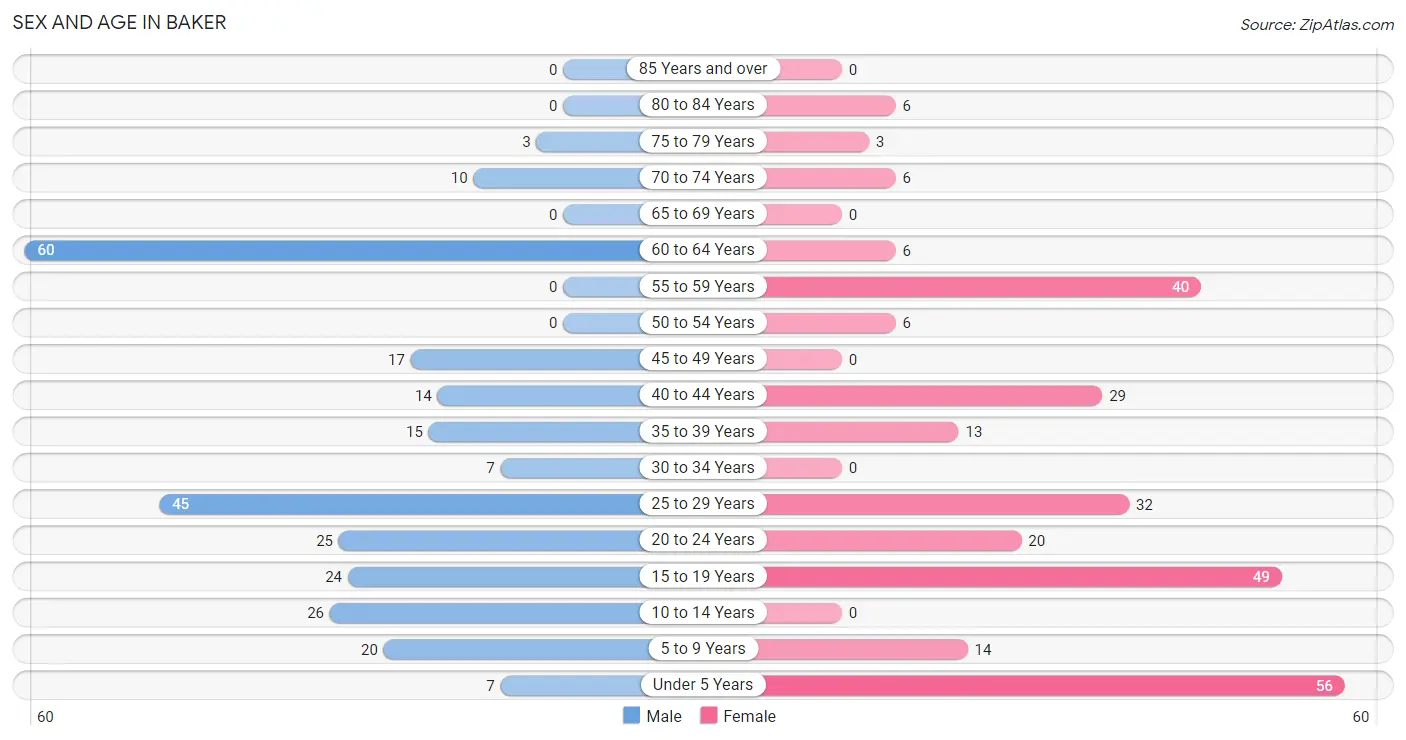
| Age Bracket | Male | Female |
| Under 5 Years | 7 (2.6%) | 56 (20.0%) |
| 5 to 9 Years | 20 (7.3%) | 14 (5.0%) |
| 10 to 14 Years | 26 (9.5%) | 0 (0.0%) |
| 15 to 19 Years | 24 (8.8%) | 49 (17.5%) |
| 20 to 24 Years | 25 (9.2%) | 20 (7.1%) |
| 25 to 29 Years | 45 (16.5%) | 32 (11.4%) |
| 30 to 34 Years | 7 (2.6%) | 0 (0.0%) |
| 35 to 39 Years | 15 (5.5%) | 13 (4.6%) |
| 40 to 44 Years | 14 (5.1%) | 29 (10.4%) |
| 45 to 49 Years | 17 (6.2%) | 0 (0.0%) |
| 50 to 54 Years | 0 (0.0%) | 6 (2.1%) |
| 55 to 59 Years | 0 (0.0%) | 40 (14.3%) |
| 60 to 64 Years | 60 (22.0%) | 6 (2.1%) |
| 65 to 69 Years | 0 (0.0%) | 0 (0.0%) |
| 70 to 74 Years | 10 (3.7%) | 6 (2.1%) |
| 75 to 79 Years | 3 (1.1%) | 3 (1.1%) |
| 80 to 84 Years | 0 (0.0%) | 6 (2.1%) |
| 85 Years and over | 0 (0.0%) | 0 (0.0%) |
| Total | 273 (100.0%) | 280 (100.0%) |
Families and Households in Baker
Median Family Size in Baker
The median family size in Baker is 3.15 persons per family, with single female/mother families (38 | 27.7%) accounting for the largest median family size of 4.47 persons per family. On the other hand, married-couple families (85 | 62.0%) represent the smallest median family size with 2.44 persons per family.
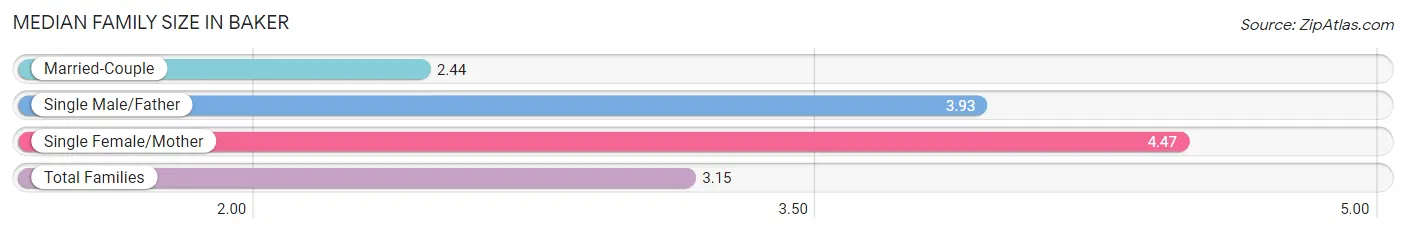
| Family Type | # Families | Family Size |
| Married-Couple | 85 (62.0%) | 2.44 |
| Single Male/Father | 14 (10.2%) | 3.93 |
| Single Female/Mother | 38 (27.7%) | 4.47 |
| Total Families | 137 (100.0%) | 3.15 |
Median Household Size in Baker
The median household size in Baker is 2.63 persons per household, with single female/mother households (38 | 18.3%) accounting for the largest median household size of 4.71 persons per household. non-family households (71 | 34.1%) represent the smallest median household size with 1.38 persons per household.
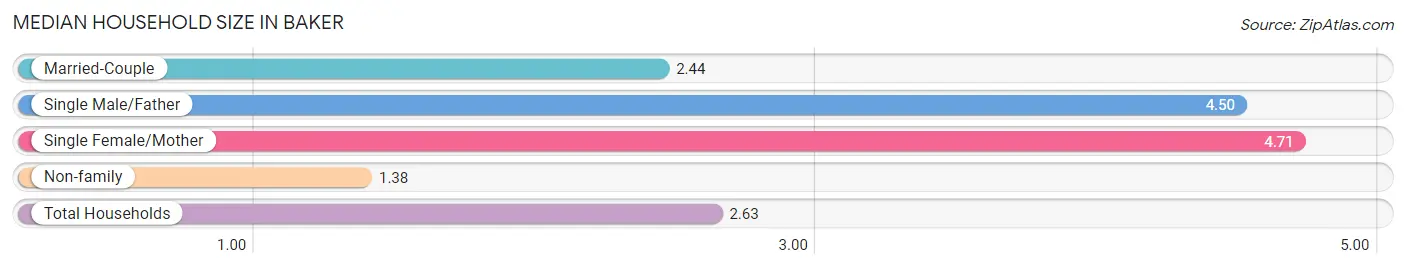
| Household Type | # Households | Household Size |
| Married-Couple | 85 (40.9%) | 2.44 |
| Single Male/Father | 14 (6.7%) | 4.50 |
| Single Female/Mother | 38 (18.3%) | 4.71 |
| Non-family | 71 (34.1%) | 1.38 |
| Total Households | 208 (100.0%) | 2.63 |
Household Size by Marriage Status in Baker
Out of a total of 208 households in Baker, 137 (65.9%) are family households, while 71 (34.1%) are nonfamily households. The most numerous type of family households are 2-person households, comprising 74, and the most common type of nonfamily households are 1-person households, comprising 59.
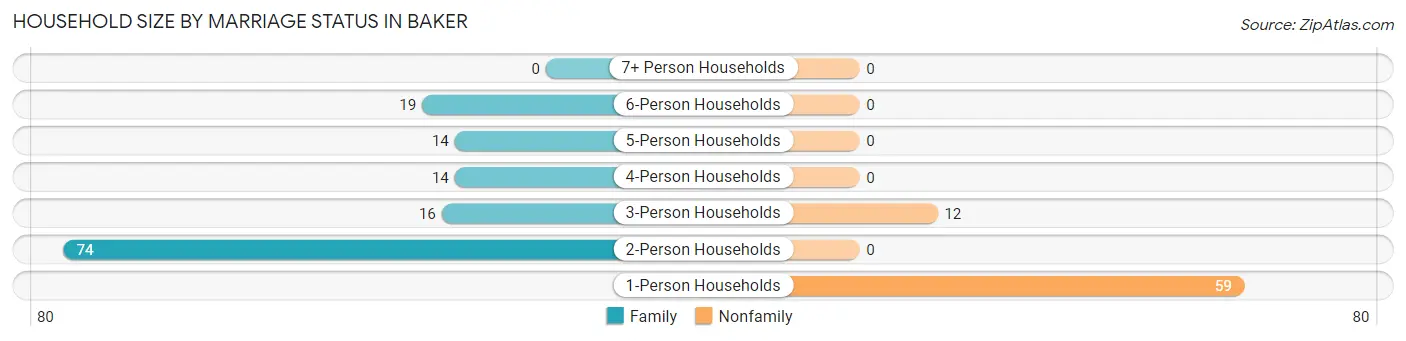
| Household Size | Family Households | Nonfamily Households |
| 1-Person Households | - | 59 (28.4%) |
| 2-Person Households | 74 (35.6%) | 0 (0.0%) |
| 3-Person Households | 16 (7.7%) | 12 (5.8%) |
| 4-Person Households | 14 (6.7%) | 0 (0.0%) |
| 5-Person Households | 14 (6.7%) | 0 (0.0%) |
| 6-Person Households | 19 (9.1%) | 0 (0.0%) |
| 7+ Person Households | 0 (0.0%) | 0 (0.0%) |
| Total | 137 (65.9%) | 71 (34.1%) |
Female Fertility in Baker
Fertility by Age in Baker
Average fertility rate in Baker is 49.0 births per 1,000 women. Women in the age bracket of 15 to 19 years have the highest fertility rate with 143.0 births per 1,000 women. Women in the age bracket of 15 to 19 years acount for 100.0% of all women with births.
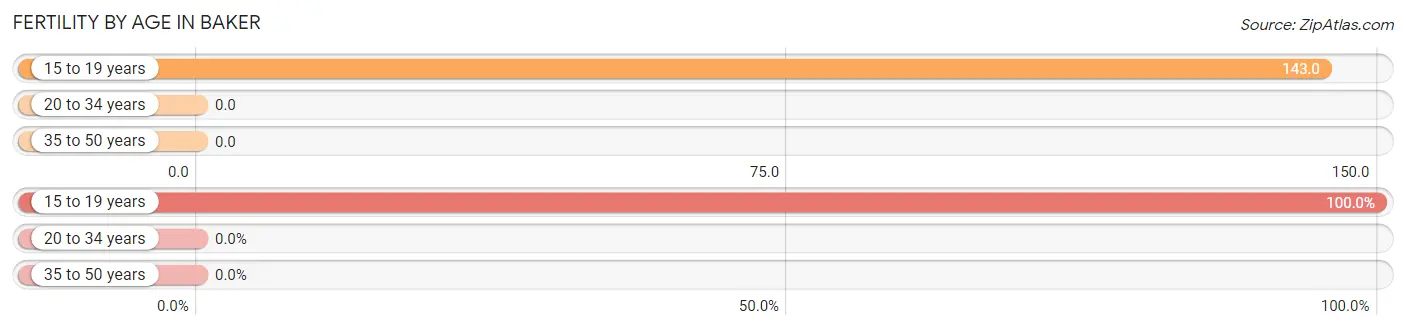
| Age Bracket | Women with Births | Births / 1,000 Women |
| 15 to 19 years | 7 (100.0%) | 143.0 |
| 20 to 34 years | 0 (0.0%) | 0.0 |
| 35 to 50 years | 0 (0.0%) | 0.0 |
| Total | 7 (100.0%) | 49.0 |
Fertility by Age by Marriage Status in Baker
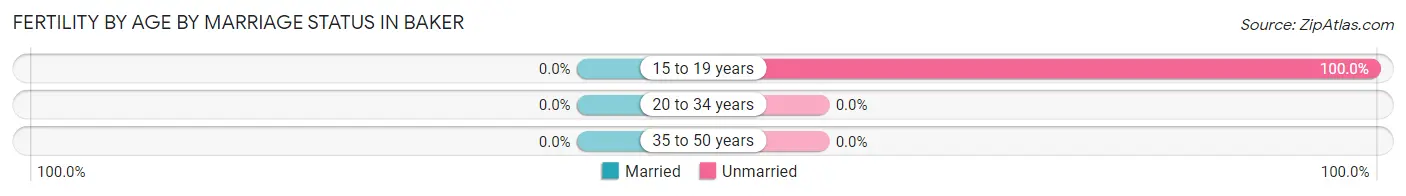
| Age Bracket | Married | Unmarried |
| 15 to 19 years | 0 (0.0%) | 7 (100.0%) |
| 20 to 34 years | 0 (0.0%) | 0 (0.0%) |
| 35 to 50 years | 0 (0.0%) | 0 (0.0%) |
| Total | 0 (0.0%) | 7 (100.0%) |
Fertility by Education in Baker
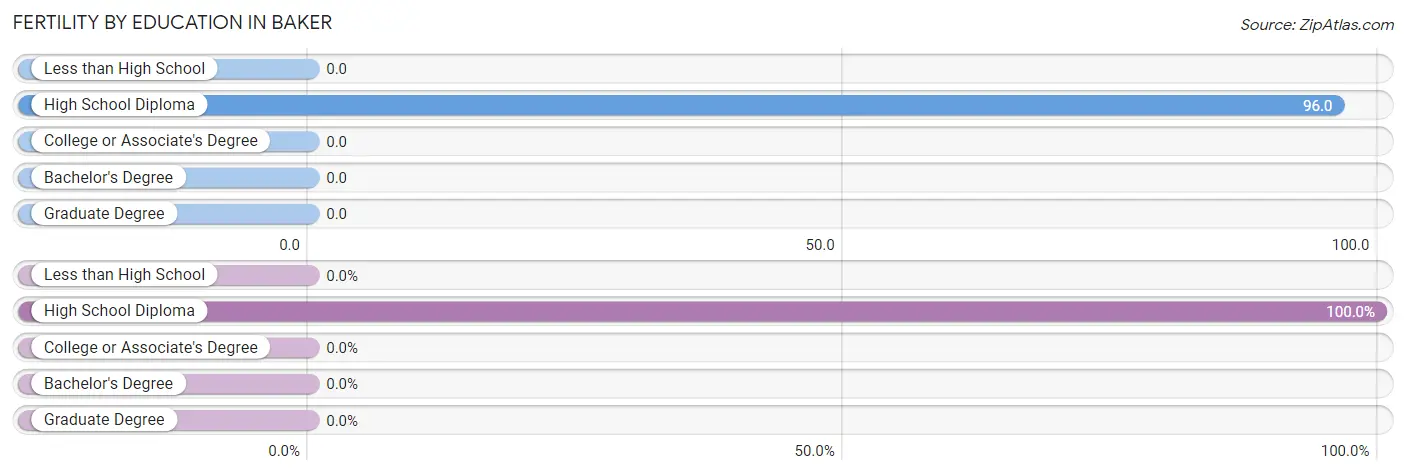
| Educational Attainment | Women with Births | Births / 1,000 Women |
| Less than High School | 0 (0.0%) | 0.0 |
| High School Diploma | 7 (100.0%) | 96.0 |
| College or Associate's Degree | 0 (0.0%) | 0.0 |
| Bachelor's Degree | 0 (0.0%) | 0.0 |
| Graduate Degree | 0 (0.0%) | 0.0 |
| Total | 7 (100.0%) | 49.0 |
Fertility by Education by Marriage Status in Baker
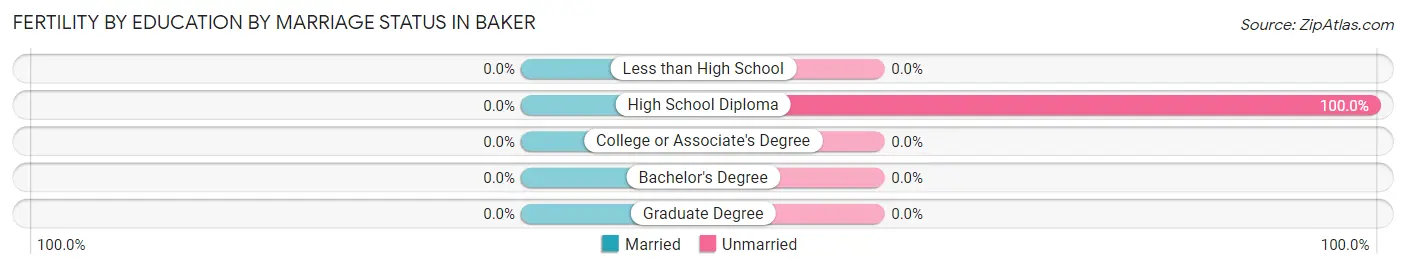
| Educational Attainment | Married | Unmarried |
| Less than High School | 0 (0.0%) | 0 (0.0%) |
| High School Diploma | 0 (0.0%) | 7 (100.0%) |
| College or Associate's Degree | 0 (0.0%) | 0 (0.0%) |
| Bachelor's Degree | 0 (0.0%) | 0 (0.0%) |
| Graduate Degree | 0 (0.0%) | 0 (0.0%) |
| Total | 0 (0.0%) | 7 (100.0%) |
Employment Characteristics in Baker
Employment by Class of Employer in Baker
Among the 308 employed individuals in Baker, private company employees (293 | 95.1%), self-employed (incorporated) (8 | 2.6%), and local government employees (7 | 2.3%) make up the most common classes of employment.
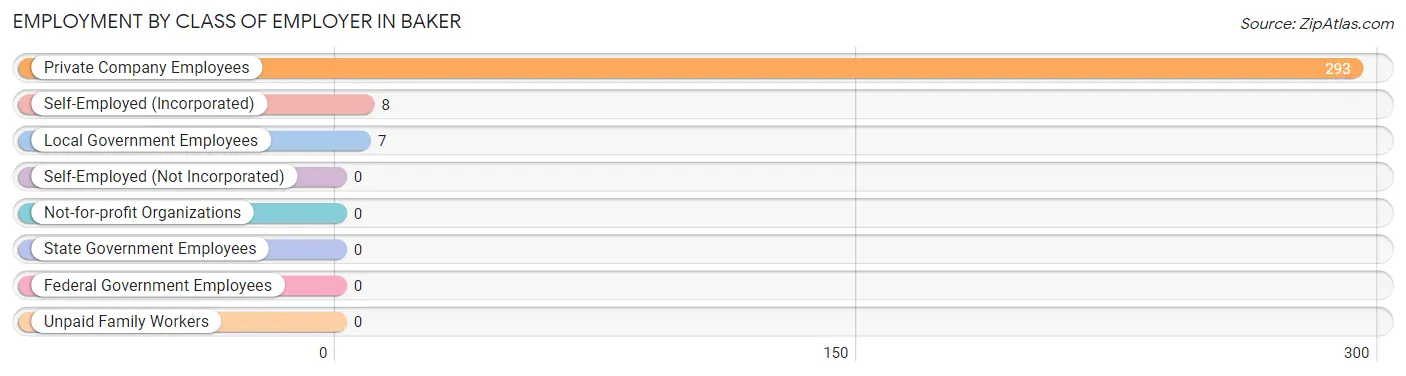
| Employer Class | # Employees | % Employees |
| Private Company Employees | 293 | 95.1% |
| Self-Employed (Incorporated) | 8 | 2.6% |
| Self-Employed (Not Incorporated) | 0 | 0.0% |
| Not-for-profit Organizations | 0 | 0.0% |
| Local Government Employees | 7 | 2.3% |
| State Government Employees | 0 | 0.0% |
| Federal Government Employees | 0 | 0.0% |
| Unpaid Family Workers | 0 | 0.0% |
| Total | 308 | 100.0% |
Employment Status by Age in Baker
According to the labor force statistics for Baker, out of the total population over 16 years of age (424), 77.4% or 328 individuals are in the labor force, with 4.0% or 13 of them unemployed. The age group with the highest labor force participation rate is 20 to 24 years, with 100.0% or 45 individuals in the labor force. Within the labor force, the 16 to 19 years age range has the highest percentage of unemployed individuals, with 23.1% or 6 of them being unemployed.
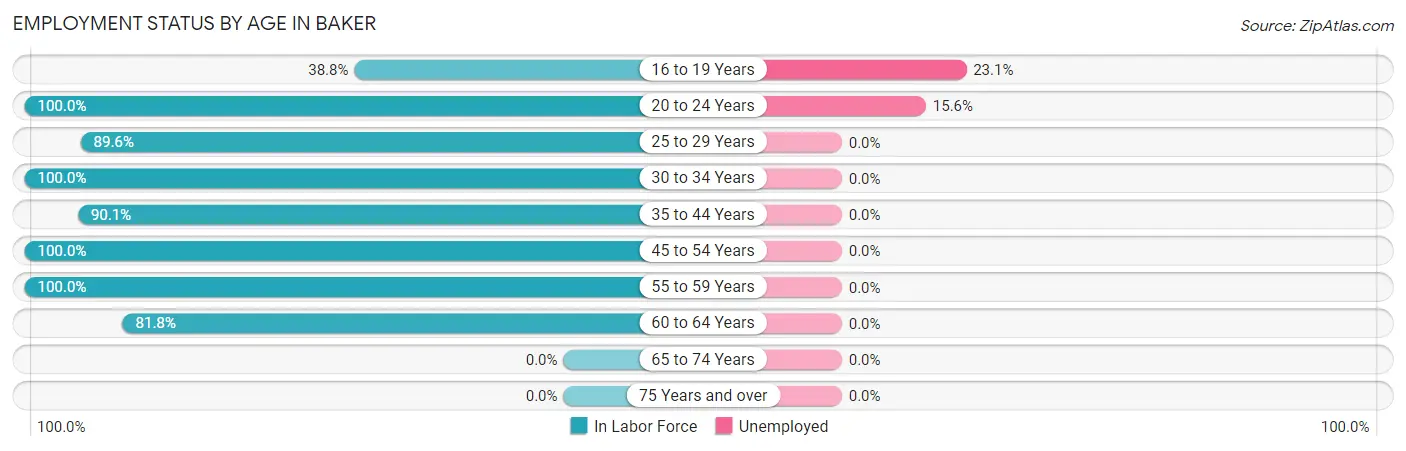
| Age Bracket | In Labor Force | Unemployed |
| 16 to 19 Years | 26 (38.8%) | 6 (23.1%) |
| 20 to 24 Years | 45 (100.0%) | 7 (15.6%) |
| 25 to 29 Years | 69 (89.6%) | 0 (0.0%) |
| 30 to 34 Years | 7 (100.0%) | 0 (0.0%) |
| 35 to 44 Years | 64 (90.1%) | 0 (0.0%) |
| 45 to 54 Years | 23 (100.0%) | 0 (0.0%) |
| 55 to 59 Years | 40 (100.0%) | 0 (0.0%) |
| 60 to 64 Years | 54 (81.8%) | 0 (0.0%) |
| 65 to 74 Years | 0 (0.0%) | 0 (0.0%) |
| 75 Years and over | 0 (0.0%) | 0 (0.0%) |
| Total | 328 (77.4%) | 13 (4.0%) |
Employment Status by Educational Attainment in Baker
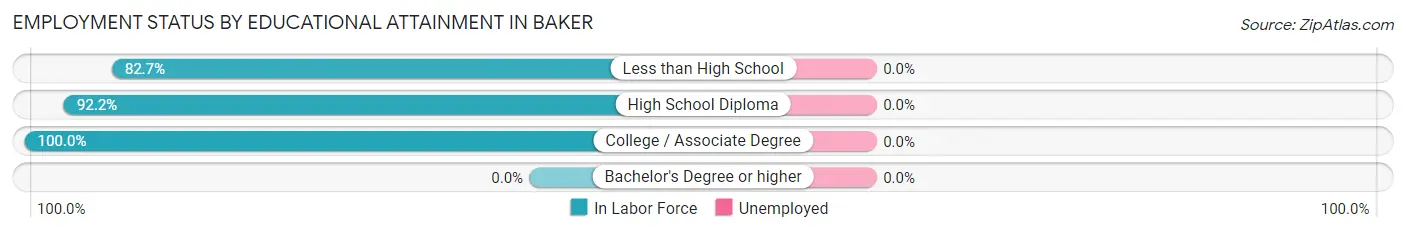
| Educational Attainment | In Labor Force | Unemployed |
| Less than High School | 62 (82.7%) | 0 (0.0%) |
| High School Diploma | 166 (92.2%) | 0 (0.0%) |
| College / Associate Degree | 29 (100.0%) | 0 (0.0%) |
| Bachelor's Degree or higher | 0 (0.0%) | 0 (0.0%) |
| Total | 257 (90.5%) | 0 (0.0%) |
Employment Occupations by Sex in Baker
Management, Business, Science and Arts Occupations
The most common Management, Business, Science and Arts occupations in Baker are , and Management (28 | 8.9%).
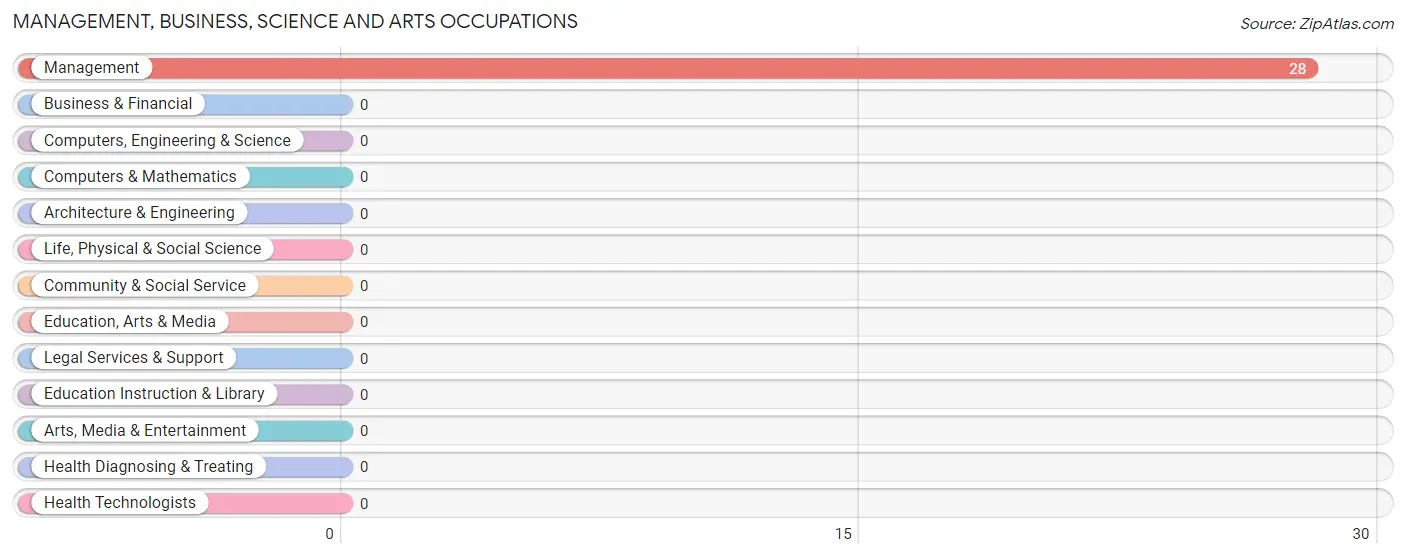
Management, Business, Science and Arts Occupations by Sex
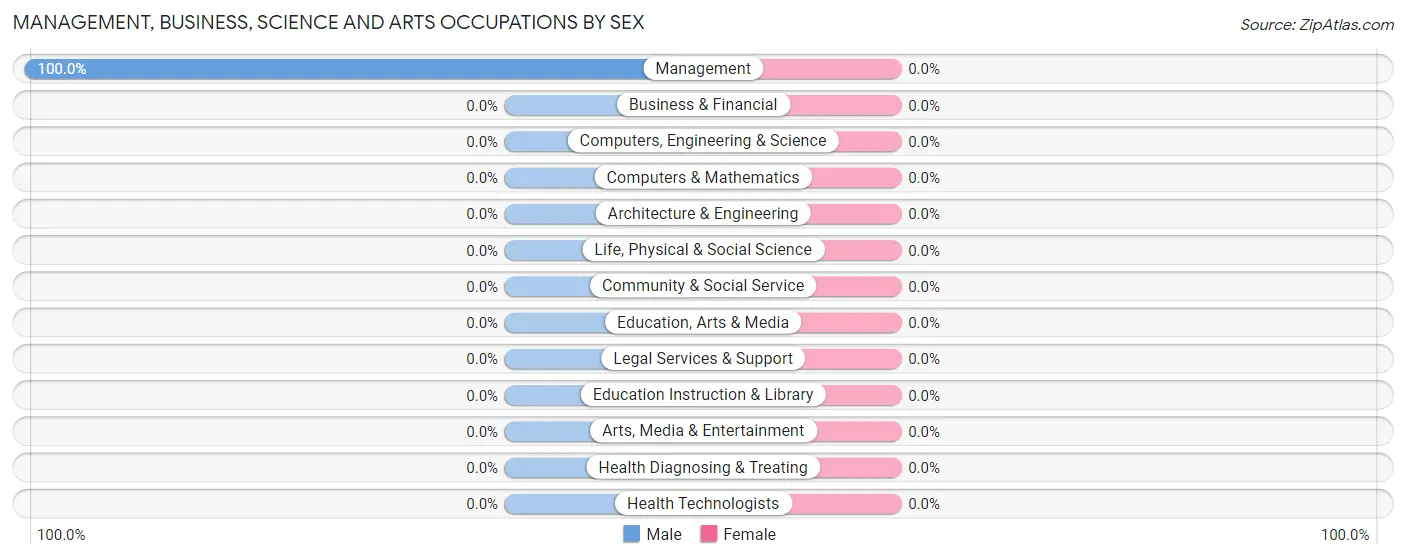
| Occupation | Male | Female |
| Management | 28 (100.0%) | 0 (0.0%) |
| Business & Financial | 0 (0.0%) | 0 (0.0%) |
| Computers, Engineering & Science | 0 (0.0%) | 0 (0.0%) |
| Computers & Mathematics | 0 (0.0%) | 0 (0.0%) |
| Architecture & Engineering | 0 (0.0%) | 0 (0.0%) |
| Life, Physical & Social Science | 0 (0.0%) | 0 (0.0%) |
| Community & Social Service | 0 (0.0%) | 0 (0.0%) |
| Education, Arts & Media | 0 (0.0%) | 0 (0.0%) |
| Legal Services & Support | 0 (0.0%) | 0 (0.0%) |
| Education Instruction & Library | 0 (0.0%) | 0 (0.0%) |
| Arts, Media & Entertainment | 0 (0.0%) | 0 (0.0%) |
| Health Diagnosing & Treating | 0 (0.0%) | 0 (0.0%) |
| Health Technologists | 0 (0.0%) | 0 (0.0%) |
| Total (Category) | 28 (100.0%) | 0 (0.0%) |
| Total (Overall) | 171 (54.3%) | 144 (45.7%) |
Services Occupations
The most common Services occupations in Baker are Food Preparation & Serving (123 | 39.1%), and Cleaning & Maintenance (6 | 1.9%).
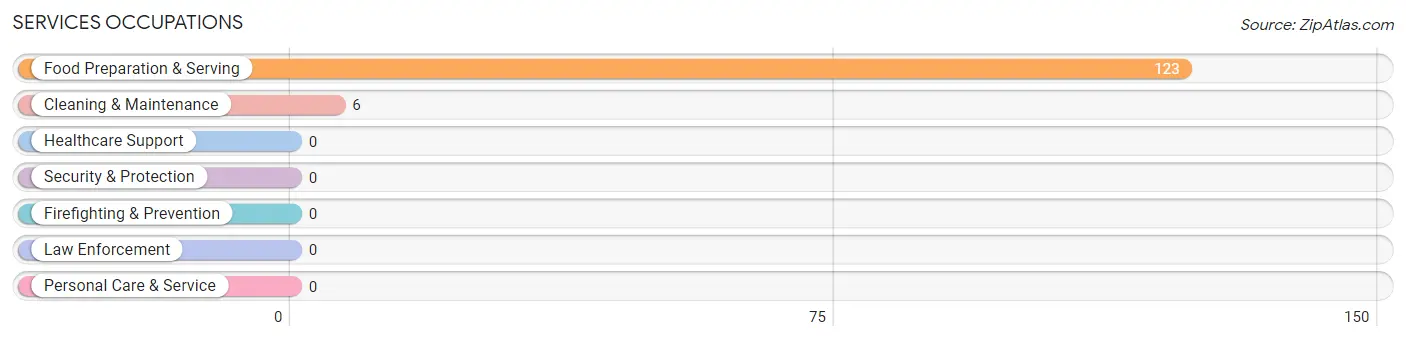
Services Occupations by Sex
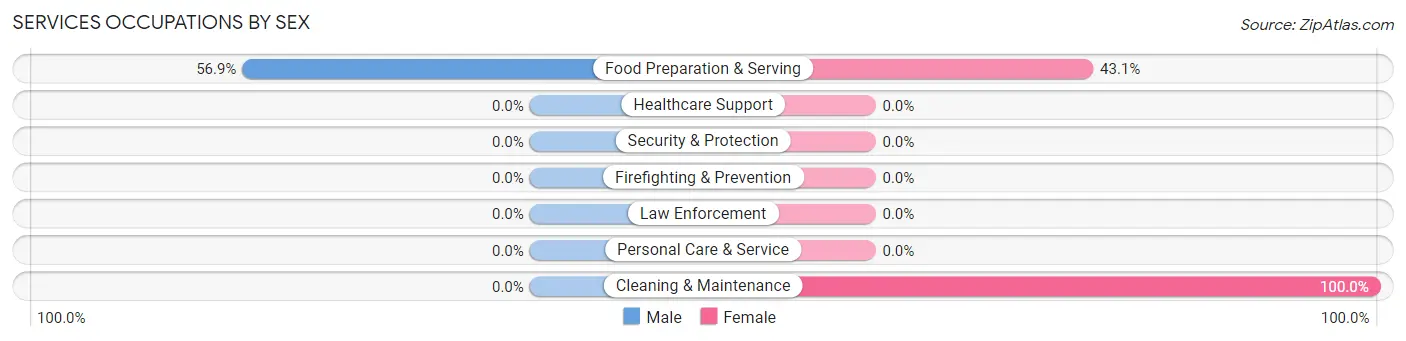
| Occupation | Male | Female |
| Healthcare Support | 0 (0.0%) | 0 (0.0%) |
| Security & Protection | 0 (0.0%) | 0 (0.0%) |
| Firefighting & Prevention | 0 (0.0%) | 0 (0.0%) |
| Law Enforcement | 0 (0.0%) | 0 (0.0%) |
| Food Preparation & Serving | 70 (56.9%) | 53 (43.1%) |
| Cleaning & Maintenance | 0 (0.0%) | 6 (100.0%) |
| Personal Care & Service | 0 (0.0%) | 0 (0.0%) |
| Total (Category) | 70 (54.3%) | 59 (45.7%) |
| Total (Overall) | 171 (54.3%) | 144 (45.7%) |
Sales and Office Occupations
The most common Sales and Office occupations in Baker are Sales & Related (106 | 33.7%), and Office & Administration (18 | 5.7%).
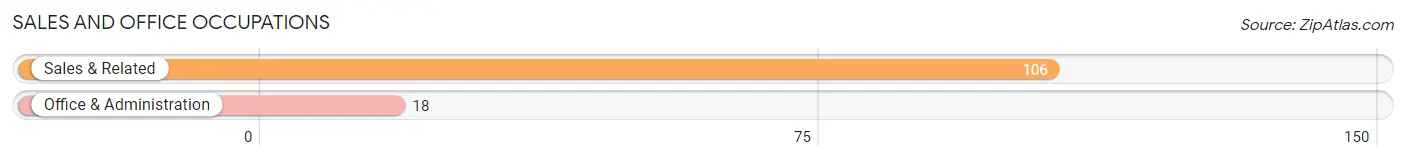
Sales and Office Occupations by Sex
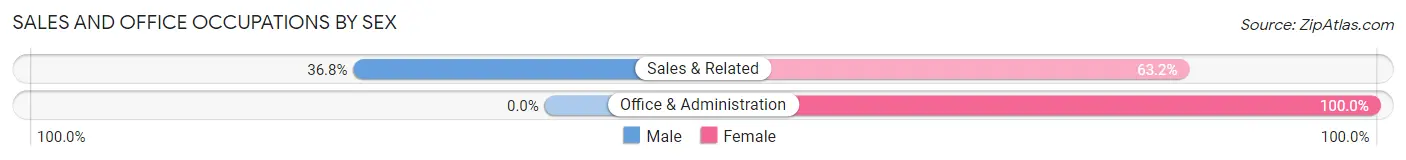
| Occupation | Male | Female |
| Sales & Related | 39 (36.8%) | 67 (63.2%) |
| Office & Administration | 0 (0.0%) | 18 (100.0%) |
| Total (Category) | 39 (31.5%) | 85 (68.5%) |
| Total (Overall) | 171 (54.3%) | 144 (45.7%) |
Natural Resources, Construction and Maintenance Occupations
The most common Natural Resources, Construction and Maintenance occupations in Baker are , and Construction & Extraction (5 | 1.6%).
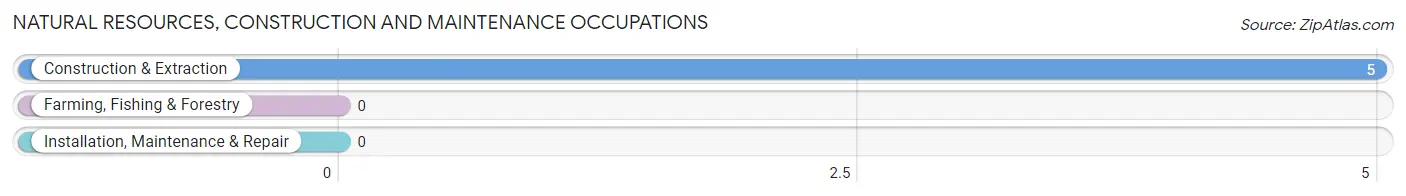
Natural Resources, Construction and Maintenance Occupations by Sex
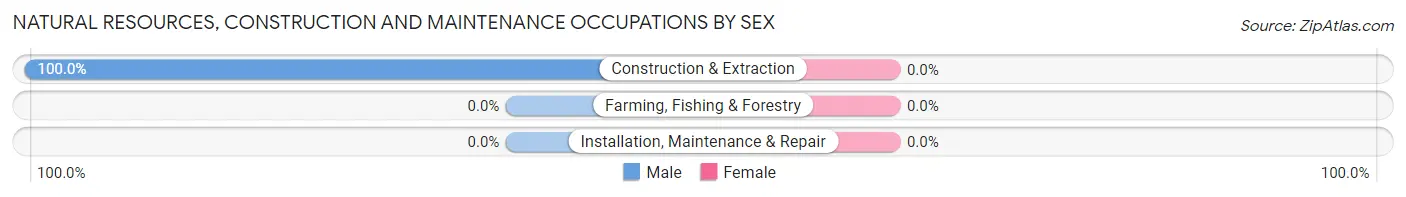
| Occupation | Male | Female |
| Farming, Fishing & Forestry | 0 (0.0%) | 0 (0.0%) |
| Construction & Extraction | 5 (100.0%) | 0 (0.0%) |
| Installation, Maintenance & Repair | 0 (0.0%) | 0 (0.0%) |
| Total (Category) | 5 (100.0%) | 0 (0.0%) |
| Total (Overall) | 171 (54.3%) | 144 (45.7%) |
Production, Transportation and Moving Occupations
The most common Production, Transportation and Moving occupations in Baker are , and Transportation (29 | 9.2%).
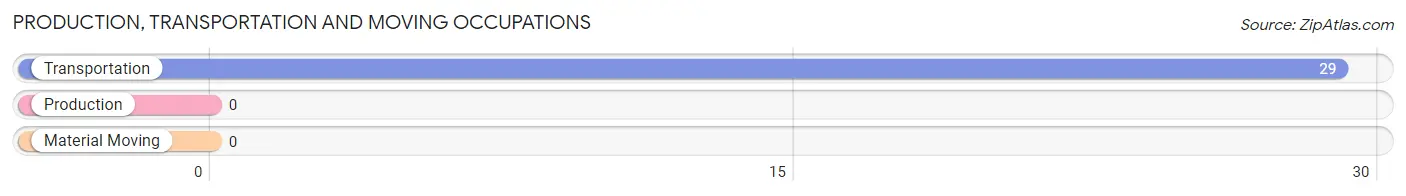
Production, Transportation and Moving Occupations by Sex
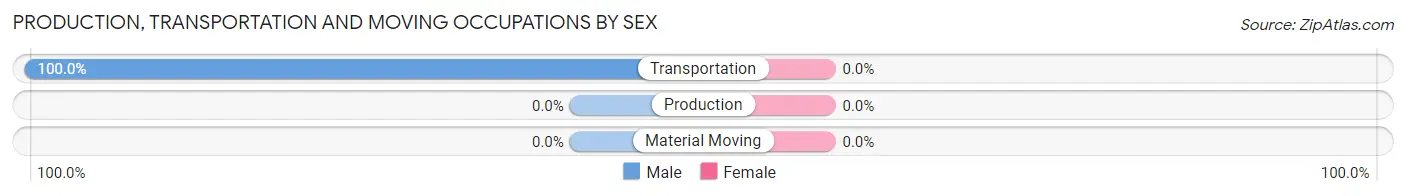
| Occupation | Male | Female |
| Production | 0 (0.0%) | 0 (0.0%) |
| Transportation | 29 (100.0%) | 0 (0.0%) |
| Material Moving | 0 (0.0%) | 0 (0.0%) |
| Total (Category) | 29 (100.0%) | 0 (0.0%) |
| Total (Overall) | 171 (54.3%) | 144 (45.7%) |
Employment Industries by Sex in Baker
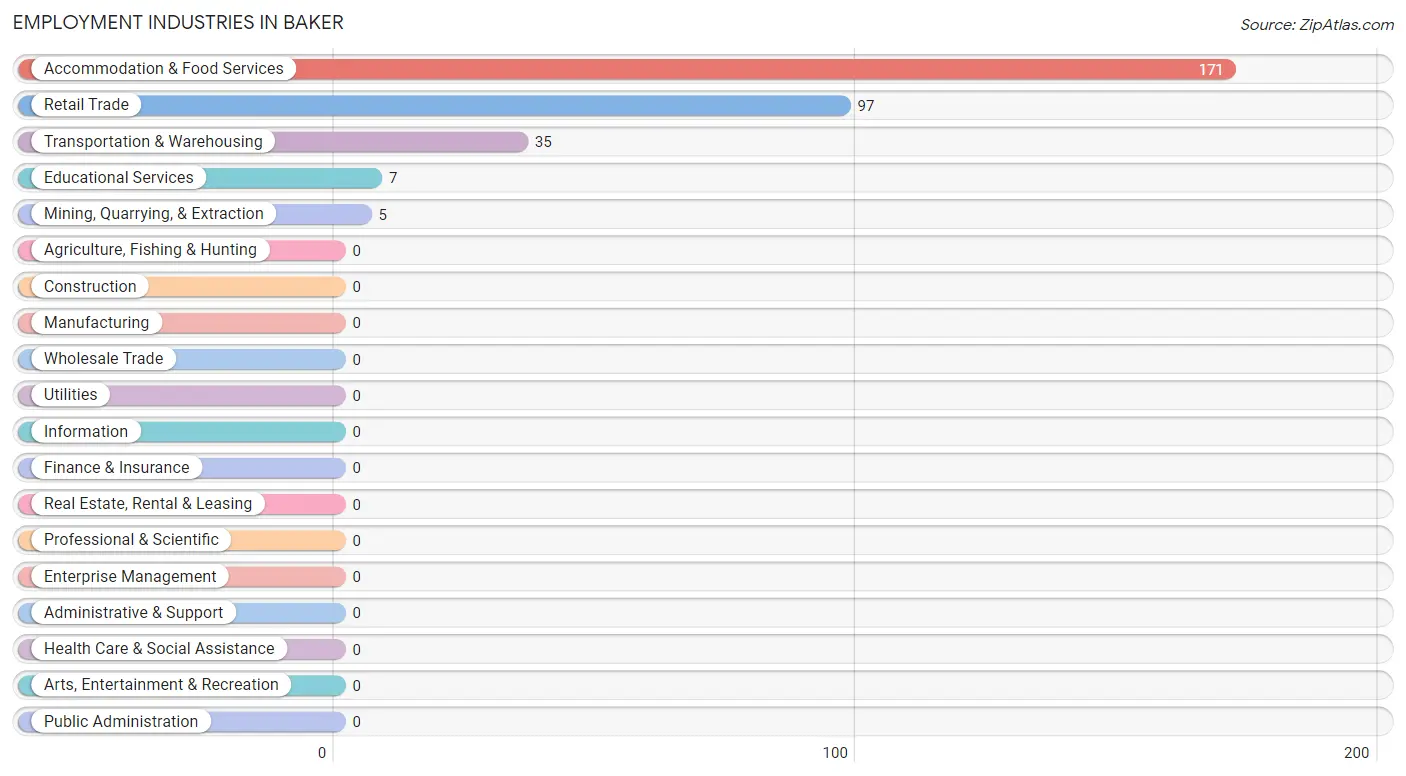
Employment Industries in Baker
The major employment industries in Baker include Accommodation & Food Services (171 | 54.3%), Retail Trade (97 | 30.8%), Transportation & Warehousing (35 | 11.1%), Educational Services (7 | 2.2%), and Mining, Quarrying, & Extraction (5 | 1.6%).
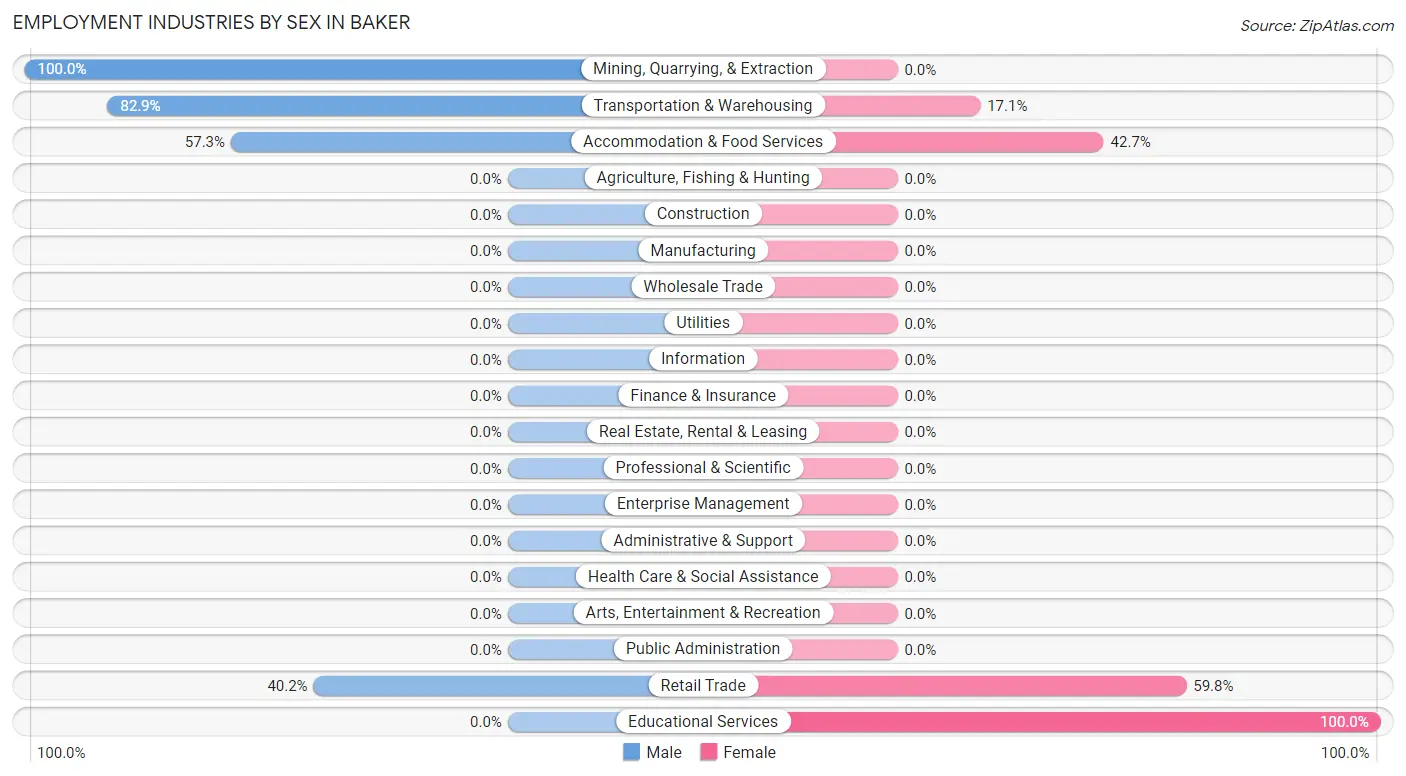
Employment Industries by Sex in Baker
The Baker industries that see more men than women are Mining, Quarrying, & Extraction (100.0%), Transportation & Warehousing (82.9%), and Accommodation & Food Services (57.3%), whereas the industries that tend to have a higher number of women are Educational Services (100.0%), Retail Trade (59.8%), and Accommodation & Food Services (42.7%).
| Industry | Male | Female |
| Agriculture, Fishing & Hunting | 0 (0.0%) | 0 (0.0%) |
| Mining, Quarrying, & Extraction | 5 (100.0%) | 0 (0.0%) |
| Construction | 0 (0.0%) | 0 (0.0%) |
| Manufacturing | 0 (0.0%) | 0 (0.0%) |
| Wholesale Trade | 0 (0.0%) | 0 (0.0%) |
| Retail Trade | 39 (40.2%) | 58 (59.8%) |
| Transportation & Warehousing | 29 (82.9%) | 6 (17.1%) |
| Utilities | 0 (0.0%) | 0 (0.0%) |
| Information | 0 (0.0%) | 0 (0.0%) |
| Finance & Insurance | 0 (0.0%) | 0 (0.0%) |
| Real Estate, Rental & Leasing | 0 (0.0%) | 0 (0.0%) |
| Professional & Scientific | 0 (0.0%) | 0 (0.0%) |
| Enterprise Management | 0 (0.0%) | 0 (0.0%) |
| Administrative & Support | 0 (0.0%) | 0 (0.0%) |
| Educational Services | 0 (0.0%) | 7 (100.0%) |
| Health Care & Social Assistance | 0 (0.0%) | 0 (0.0%) |
| Arts, Entertainment & Recreation | 0 (0.0%) | 0 (0.0%) |
| Accommodation & Food Services | 98 (57.3%) | 73 (42.7%) |
| Public Administration | 0 (0.0%) | 0 (0.0%) |
| Total | 171 (54.3%) | 144 (45.7%) |
Education in Baker
School Enrollment in Baker
The most common levels of schooling among the 110 students in Baker are high school (43 | 39.1%), kindergarten (20 | 18.2%), and elementary school (14 | 12.7%).
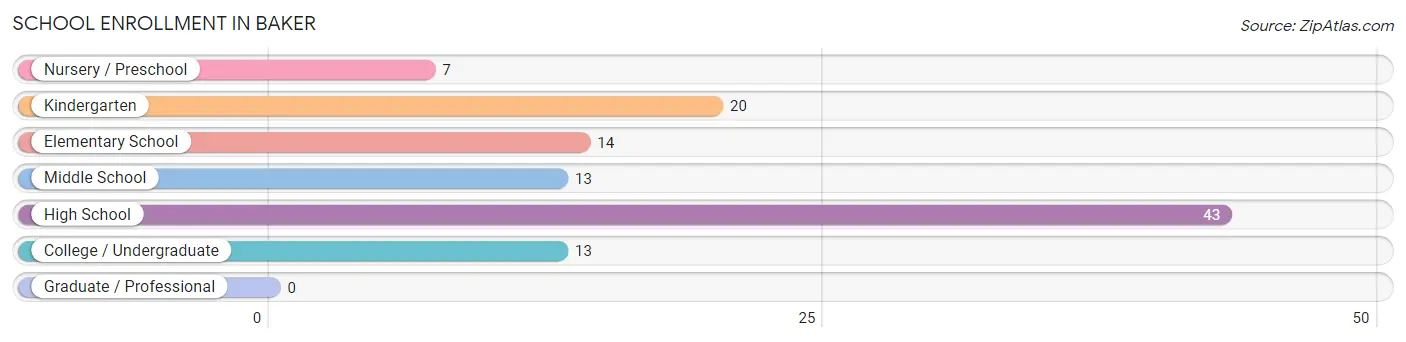
| School Level | # Students | % Students |
| Nursery / Preschool | 7 | 6.4% |
| Kindergarten | 20 | 18.2% |
| Elementary School | 14 | 12.7% |
| Middle School | 13 | 11.8% |
| High School | 43 | 39.1% |
| College / Undergraduate | 13 | 11.8% |
| Graduate / Professional | 0 | 0.0% |
| Total | 110 | 100.0% |
School Enrollment by Age by Funding Source in Baker
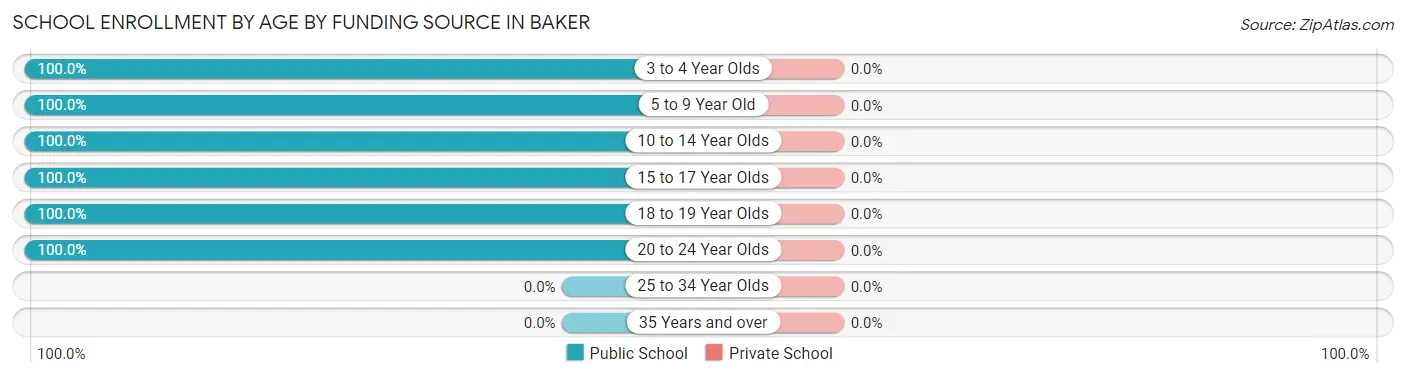
| Age Bracket | Public School | Private School |
| 3 to 4 Year Olds | 7 (100.0%) | 0 (0.0%) |
| 5 to 9 Year Old | 34 (100.0%) | 0 (0.0%) |
| 10 to 14 Year Olds | 26 (100.0%) | 0 (0.0%) |
| 15 to 17 Year Olds | 30 (100.0%) | 0 (0.0%) |
| 18 to 19 Year Olds | 7 (100.0%) | 0 (0.0%) |
| 20 to 24 Year Olds | 6 (100.0%) | 0 (0.0%) |
| 25 to 34 Year Olds | 0 (0.0%) | 0 (0.0%) |
| 35 Years and over | 0 (0.0%) | 0 (0.0%) |
| Total | 110 (100.0%) | 0 (0.0%) |
Educational Attainment by Field of Study in Baker
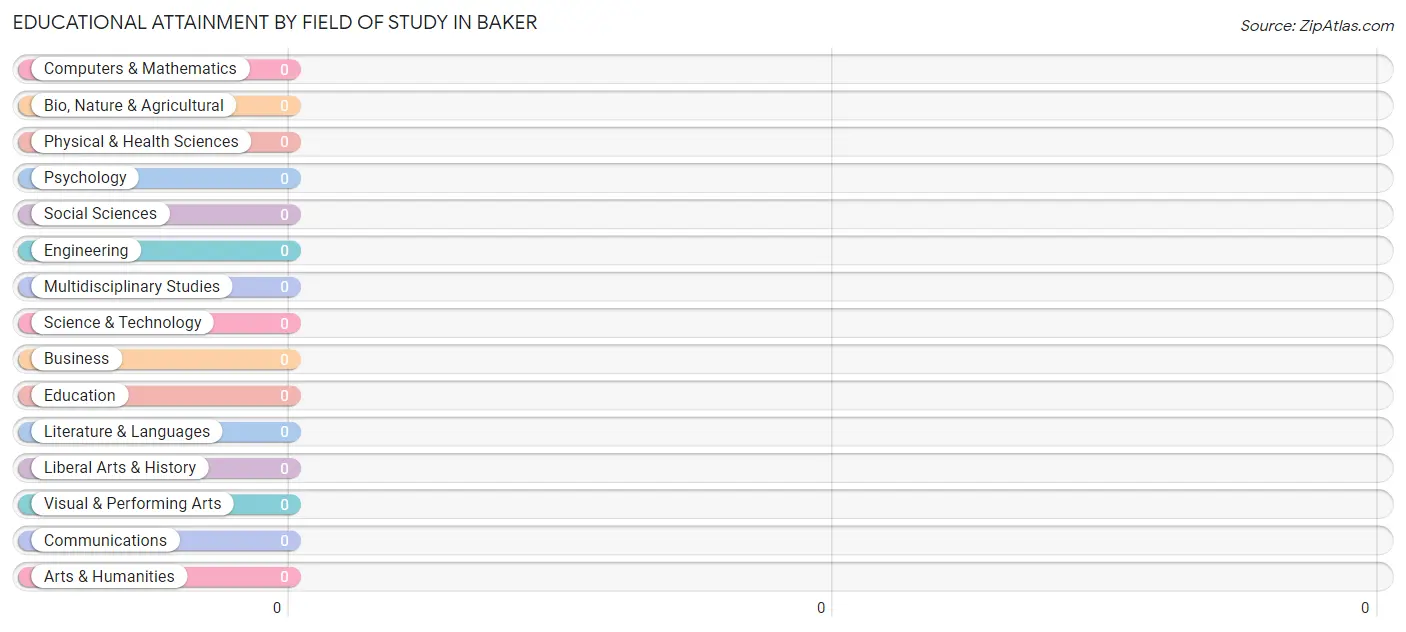
| Field of Study | # Graduates | % Graduates |
| Computers & Mathematics | 0 | 0.0% |
| Bio, Nature & Agricultural | 0 | 0.0% |
| Physical & Health Sciences | 0 | 0.0% |
| Psychology | 0 | 0.0% |
| Social Sciences | 0 | 0.0% |
| Engineering | 0 | 0.0% |
| Multidisciplinary Studies | 0 | 0.0% |
| Science & Technology | 0 | 0.0% |
| Business | 0 | 0.0% |
| Education | 0 | 0.0% |
| Literature & Languages | 0 | 0.0% |
| Liberal Arts & History | 0 | 0.0% |
| Visual & Performing Arts | 0 | 0.0% |
| Communications | 0 | 0.0% |
| Arts & Humanities | 0 | 0.0% |
| Total | 0 | 0.0% |
Transportation & Commute in Baker
Vehicle Availability by Sex in Baker
The most prevalent vehicle ownership categories in Baker are males with 1 vehicle (92, accounting for 56.1%) and females with 1 vehicle (60, making up 63.9%).
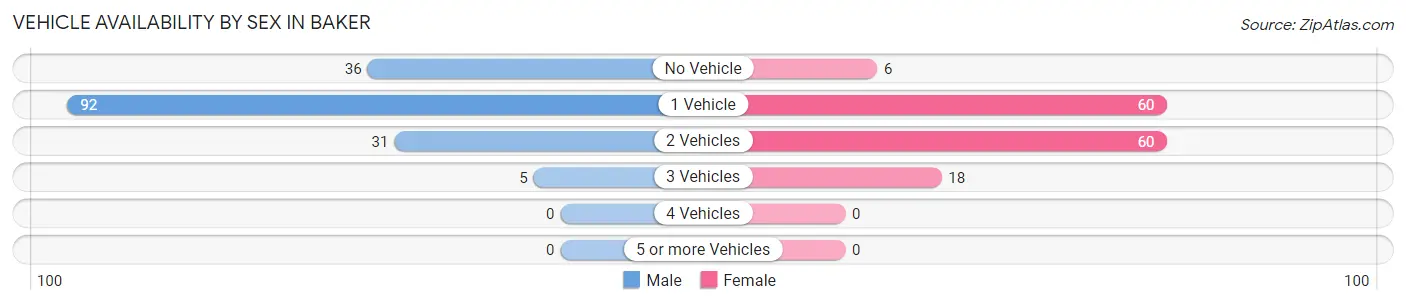
| Vehicles Available | Male | Female |
| No Vehicle | 36 (22.0%) | 6 (4.2%) |
| 1 Vehicle | 92 (56.1%) | 60 (41.7%) |
| 2 Vehicles | 31 (18.9%) | 60 (41.7%) |
| 3 Vehicles | 5 (3.0%) | 18 (12.5%) |
| 4 Vehicles | 0 (0.0%) | 0 (0.0%) |
| 5 or more Vehicles | 0 (0.0%) | 0 (0.0%) |
| Total | 164 (100.0%) | 144 (100.0%) |
Commute Time in Baker
The most frequently occuring commute durations in Baker are 5 to 9 minutes (145 commuters, 48.3%), 30 to 34 minutes (62 commuters, 20.7%), and less than 5 minutes (61 commuters, 20.3%).
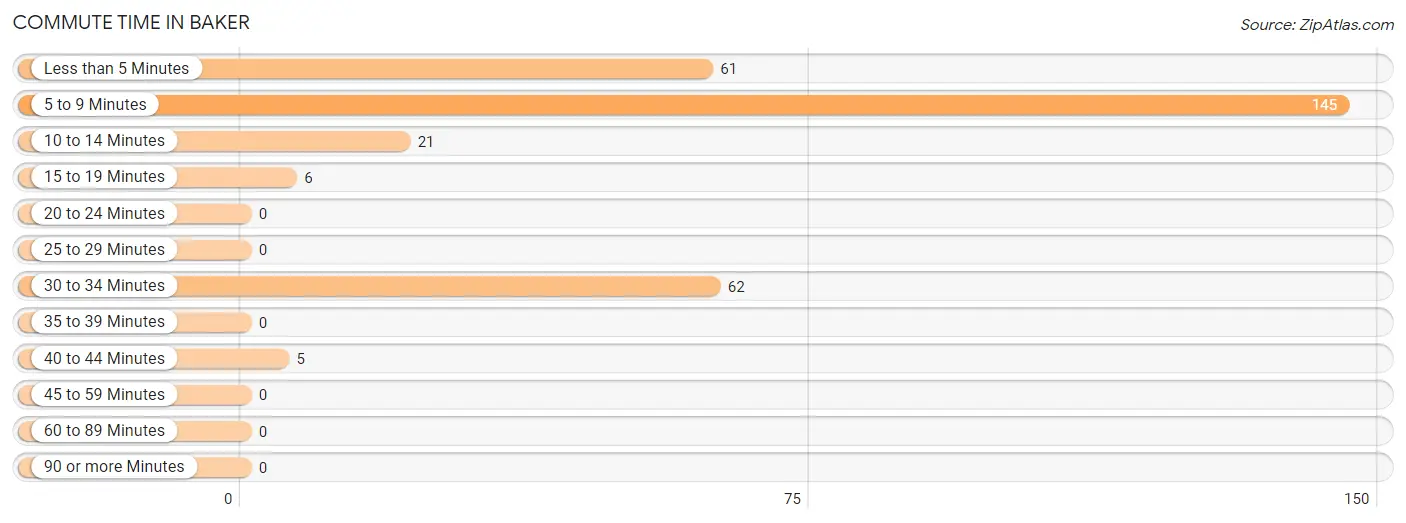
| Commute Time | # Commuters | % Commuters |
| Less than 5 Minutes | 61 | 20.3% |
| 5 to 9 Minutes | 145 | 48.3% |
| 10 to 14 Minutes | 21 | 7.0% |
| 15 to 19 Minutes | 6 | 2.0% |
| 20 to 24 Minutes | 0 | 0.0% |
| 25 to 29 Minutes | 0 | 0.0% |
| 30 to 34 Minutes | 62 | 20.7% |
| 35 to 39 Minutes | 0 | 0.0% |
| 40 to 44 Minutes | 5 | 1.7% |
| 45 to 59 Minutes | 0 | 0.0% |
| 60 to 89 Minutes | 0 | 0.0% |
| 90 or more Minutes | 0 | 0.0% |
Commute Time by Sex in Baker
The most common commute times in Baker are 5 to 9 minutes (102 commuters, 65.4%) for males and less than 5 minutes (48 commuters, 33.3%) for females.
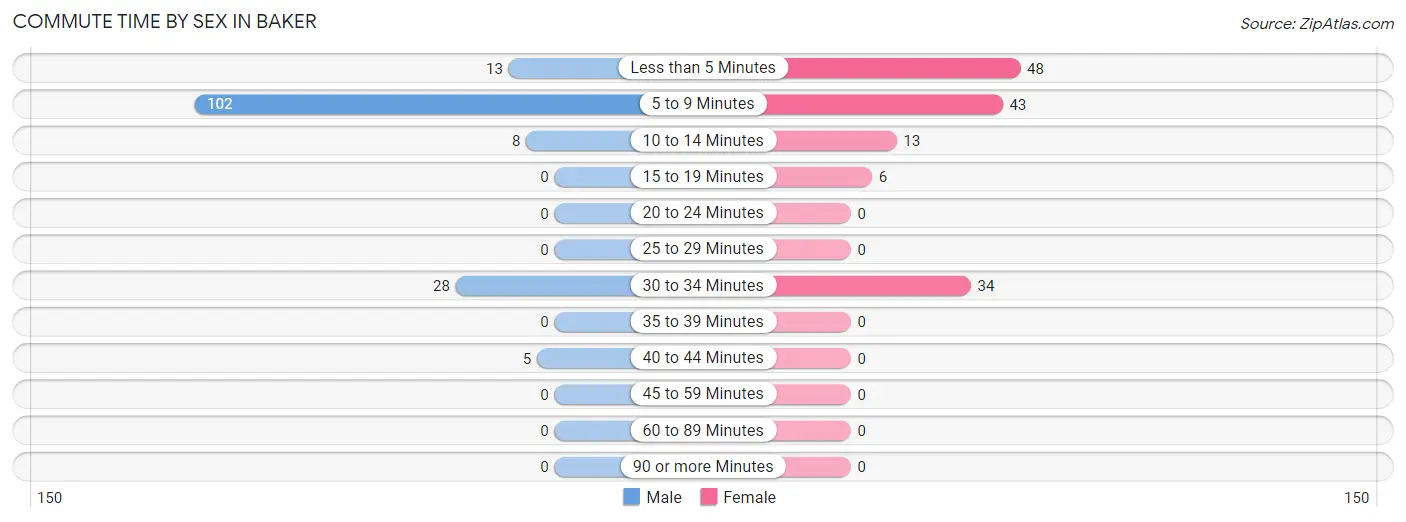
| Commute Time | Male | Female |
| Less than 5 Minutes | 13 (8.3%) | 48 (33.3%) |
| 5 to 9 Minutes | 102 (65.4%) | 43 (29.9%) |
| 10 to 14 Minutes | 8 (5.1%) | 13 (9.0%) |
| 15 to 19 Minutes | 0 (0.0%) | 6 (4.2%) |
| 20 to 24 Minutes | 0 (0.0%) | 0 (0.0%) |
| 25 to 29 Minutes | 0 (0.0%) | 0 (0.0%) |
| 30 to 34 Minutes | 28 (17.9%) | 34 (23.6%) |
| 35 to 39 Minutes | 0 (0.0%) | 0 (0.0%) |
| 40 to 44 Minutes | 5 (3.2%) | 0 (0.0%) |
| 45 to 59 Minutes | 0 (0.0%) | 0 (0.0%) |
| 60 to 89 Minutes | 0 (0.0%) | 0 (0.0%) |
| 90 or more Minutes | 0 (0.0%) | 0 (0.0%) |
Time of Departure to Work by Sex in Baker
The most frequent times of departure to work in Baker are 12:00 PM to 3:59 PM (55, 35.3%) for males and 9:00 AM to 9:59 AM (55, 38.2%) for females.
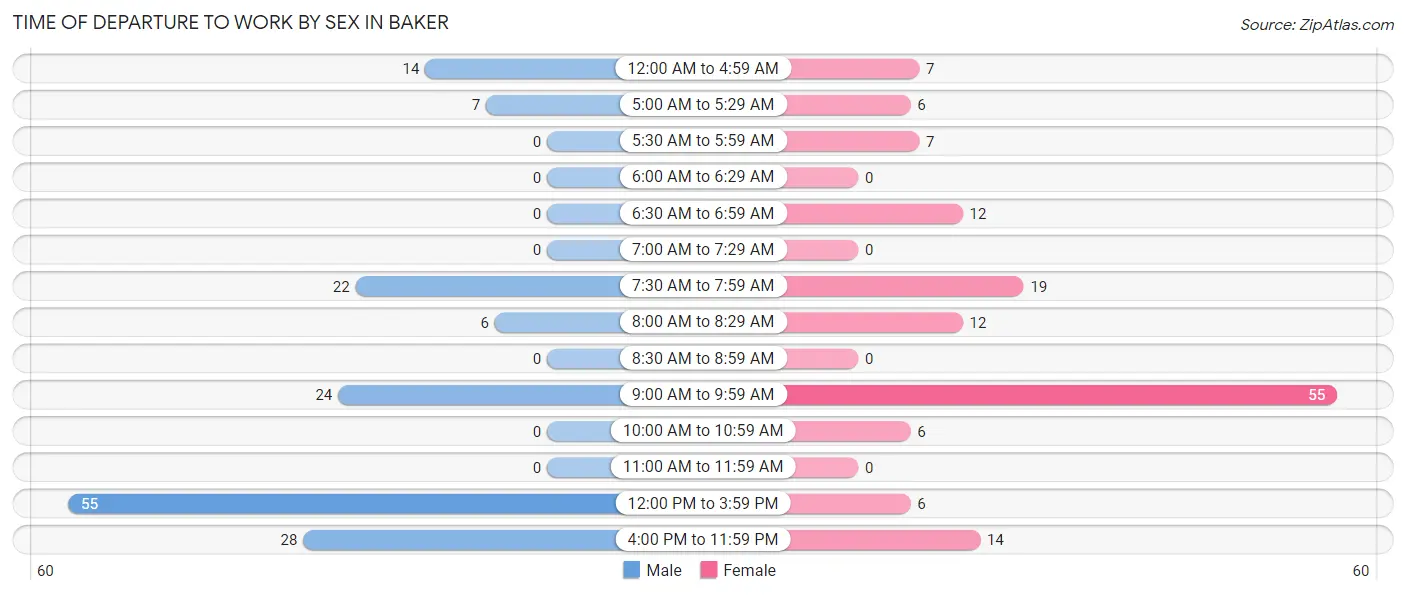
| Time of Departure | Male | Female |
| 12:00 AM to 4:59 AM | 14 (9.0%) | 7 (4.9%) |
| 5:00 AM to 5:29 AM | 7 (4.5%) | 6 (4.2%) |
| 5:30 AM to 5:59 AM | 0 (0.0%) | 7 (4.9%) |
| 6:00 AM to 6:29 AM | 0 (0.0%) | 0 (0.0%) |
| 6:30 AM to 6:59 AM | 0 (0.0%) | 12 (8.3%) |
| 7:00 AM to 7:29 AM | 0 (0.0%) | 0 (0.0%) |
| 7:30 AM to 7:59 AM | 22 (14.1%) | 19 (13.2%) |
| 8:00 AM to 8:29 AM | 6 (3.8%) | 12 (8.3%) |
| 8:30 AM to 8:59 AM | 0 (0.0%) | 0 (0.0%) |
| 9:00 AM to 9:59 AM | 24 (15.4%) | 55 (38.2%) |
| 10:00 AM to 10:59 AM | 0 (0.0%) | 6 (4.2%) |
| 11:00 AM to 11:59 AM | 0 (0.0%) | 0 (0.0%) |
| 12:00 PM to 3:59 PM | 55 (35.3%) | 6 (4.2%) |
| 4:00 PM to 11:59 PM | 28 (17.9%) | 14 (9.7%) |
| Total | 156 (100.0%) | 144 (100.0%) |
Housing Occupancy in Baker
Occupancy by Ownership in Baker
Of the total 208 dwellings in Baker, owner-occupied units account for 73 (35.1%), while renter-occupied units make up 135 (64.9%).
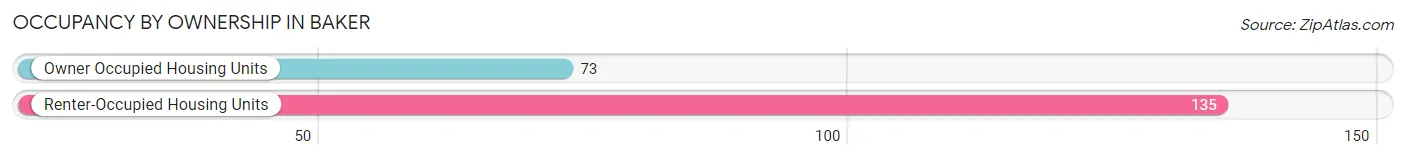
| Occupancy | # Housing Units | % Housing Units |
| Owner Occupied Housing Units | 73 | 35.1% |
| Renter-Occupied Housing Units | 135 | 64.9% |
| Total Occupied Housing Units | 208 | 100.0% |
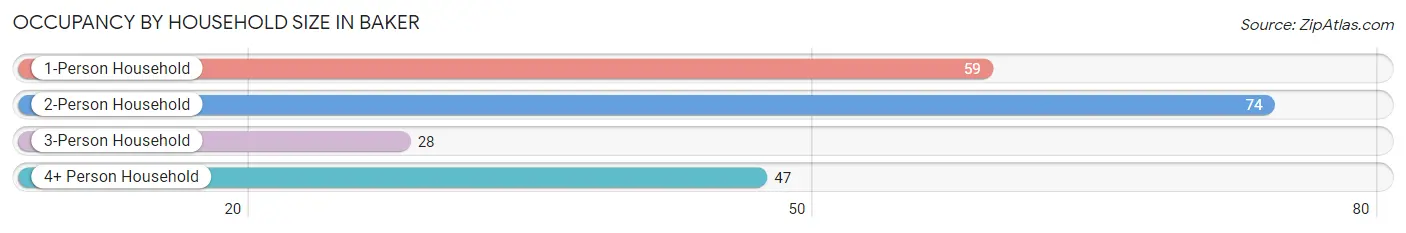
Occupancy by Household Size in Baker
| Household Size | # Housing Units | % Housing Units |
| 1-Person Household | 59 | 28.4% |
| 2-Person Household | 74 | 35.6% |
| 3-Person Household | 28 | 13.5% |
| 4+ Person Household | 47 | 22.6% |
| Total Housing Units | 208 | 100.0% |
Occupancy by Ownership by Household Size in Baker
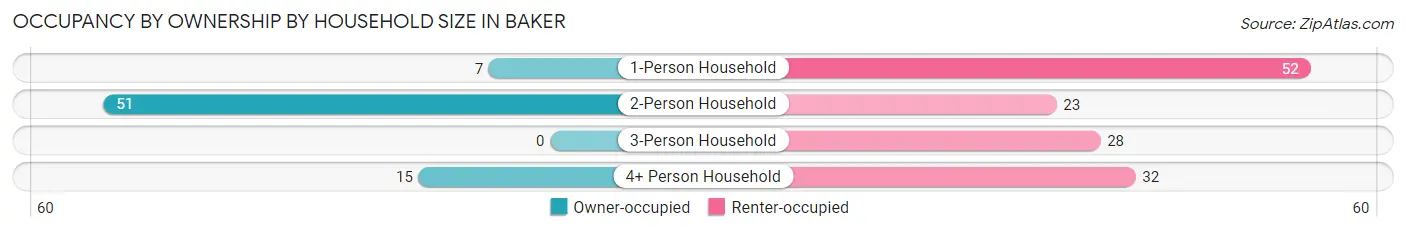
| Household Size | Owner-occupied | Renter-occupied |
| 1-Person Household | 7 (11.9%) | 52 (88.1%) |
| 2-Person Household | 51 (68.9%) | 23 (31.1%) |
| 3-Person Household | 0 (0.0%) | 28 (100.0%) |
| 4+ Person Household | 15 (31.9%) | 32 (68.1%) |
| Total Housing Units | 73 (35.1%) | 135 (64.9%) |
Occupancy by Educational Attainment in Baker
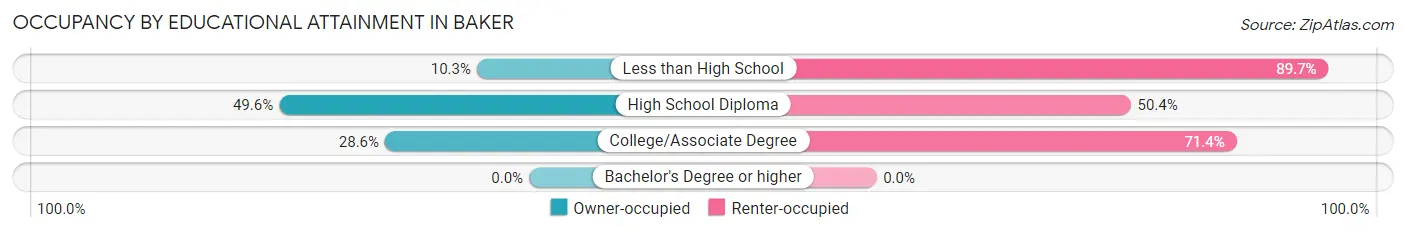
| Household Size | Owner-occupied | Renter-occupied |
| Less than High School | 6 (10.3%) | 52 (89.7%) |
| High School Diploma | 57 (49.6%) | 58 (50.4%) |
| College/Associate Degree | 10 (28.6%) | 25 (71.4%) |
| Bachelor's Degree or higher | 0 (0.0%) | 0 (0.0%) |
Occupancy by Age of Householder in Baker
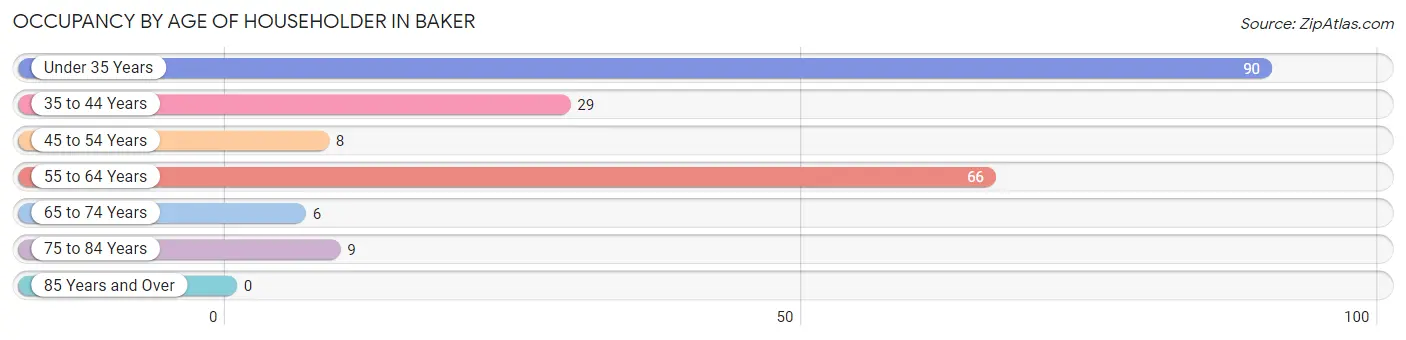
| Age Bracket | # Households | % Households |
| Under 35 Years | 90 | 43.3% |
| 35 to 44 Years | 29 | 13.9% |
| 45 to 54 Years | 8 | 3.8% |
| 55 to 64 Years | 66 | 31.7% |
| 65 to 74 Years | 6 | 2.9% |
| 75 to 84 Years | 9 | 4.3% |
| 85 Years and Over | 0 | 0.0% |
| Total | 208 | 100.0% |
Housing Finances in Baker
Median Income by Occupancy in Baker
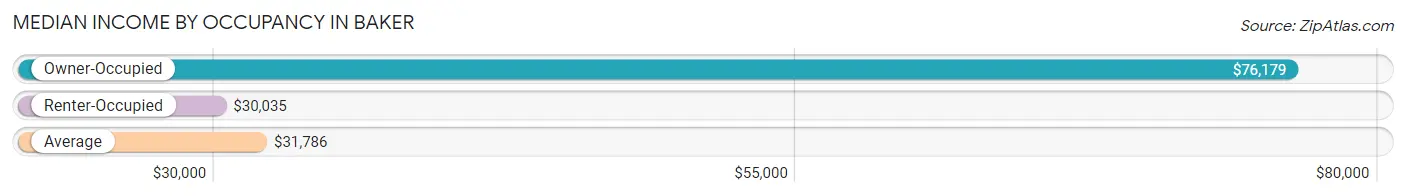
| Occupancy Type | # Households | Median Income |
| Owner-Occupied | 73 (35.1%) | $76,179 |
| Renter-Occupied | 135 (64.9%) | $30,035 |
| Average | 208 (100.0%) | $31,786 |
Occupancy by Householder Income Bracket in Baker
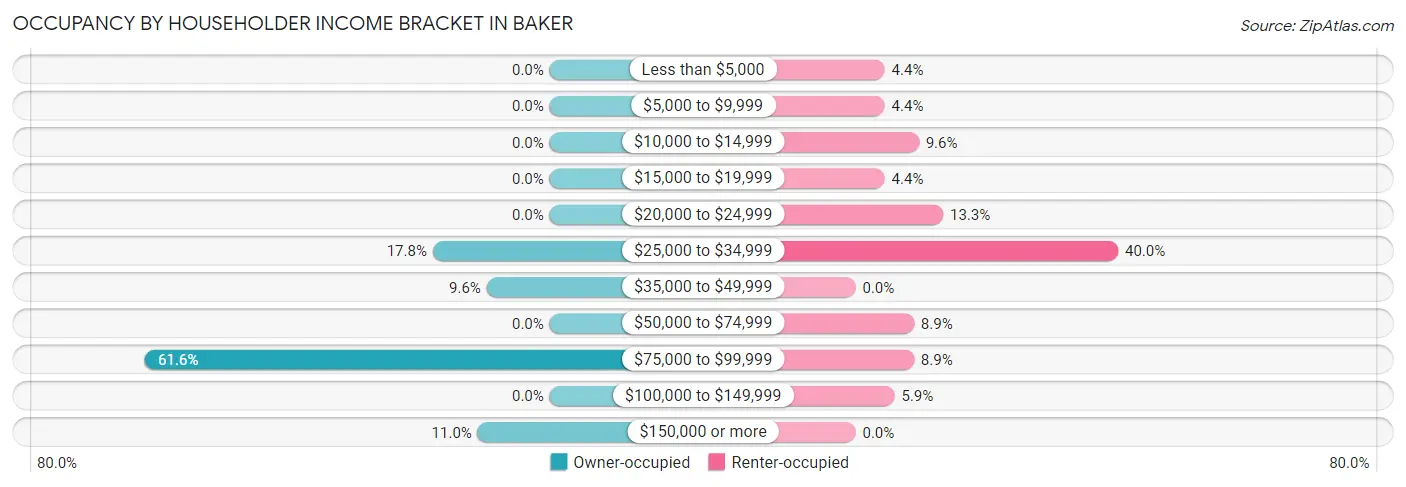
| Income Bracket | Owner-occupied | Renter-occupied |
| Less than $5,000 | 0 (0.0%) | 6 (4.4%) |
| $5,000 to $9,999 | 0 (0.0%) | 6 (4.4%) |
| $10,000 to $14,999 | 0 (0.0%) | 13 (9.6%) |
| $15,000 to $19,999 | 0 (0.0%) | 6 (4.4%) |
| $20,000 to $24,999 | 0 (0.0%) | 18 (13.3%) |
| $25,000 to $34,999 | 13 (17.8%) | 54 (40.0%) |
| $35,000 to $49,999 | 7 (9.6%) | 0 (0.0%) |
| $50,000 to $74,999 | 0 (0.0%) | 12 (8.9%) |
| $75,000 to $99,999 | 45 (61.6%) | 12 (8.9%) |
| $100,000 to $149,999 | 0 (0.0%) | 8 (5.9%) |
| $150,000 or more | 8 (11.0%) | 0 (0.0%) |
| Total | 73 (100.0%) | 135 (100.0%) |
Monthly Housing Cost Tiers in Baker
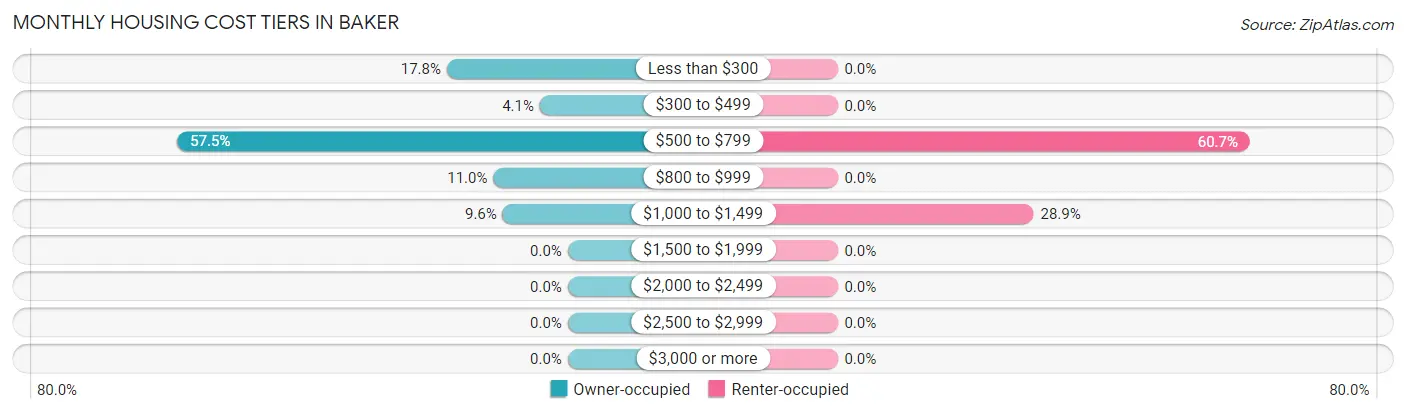
| Monthly Cost | Owner-occupied | Renter-occupied |
| Less than $300 | 13 (17.8%) | 0 (0.0%) |
| $300 to $499 | 3 (4.1%) | 0 (0.0%) |
| $500 to $799 | 42 (57.5%) | 82 (60.7%) |
| $800 to $999 | 8 (11.0%) | 0 (0.0%) |
| $1,000 to $1,499 | 7 (9.6%) | 39 (28.9%) |
| $1,500 to $1,999 | 0 (0.0%) | 0 (0.0%) |
| $2,000 to $2,499 | 0 (0.0%) | 0 (0.0%) |
| $2,500 to $2,999 | 0 (0.0%) | 0 (0.0%) |
| $3,000 or more | 0 (0.0%) | 0 (0.0%) |
| Total | 73 (100.0%) | 135 (100.0%) |
Physical Housing Characteristics in Baker
Housing Structures in Baker
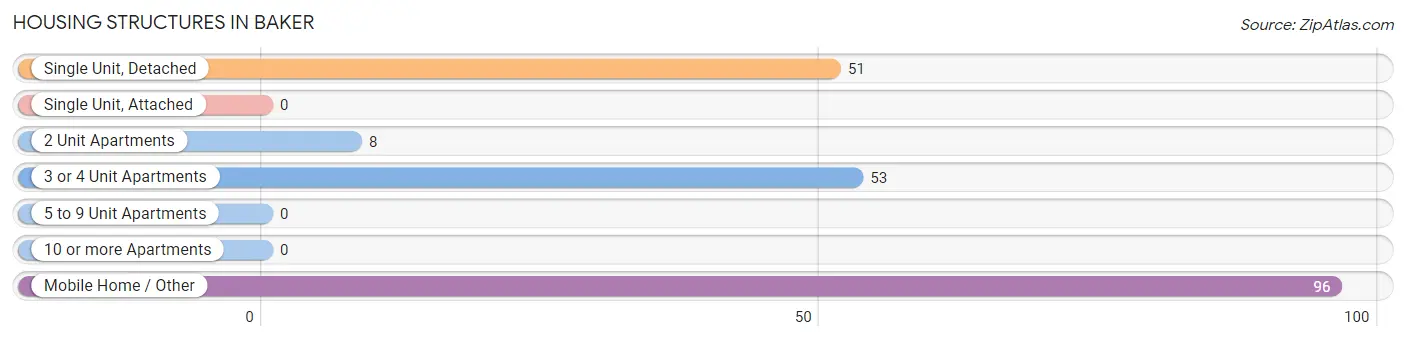
| Structure Type | # Housing Units | % Housing Units |
| Single Unit, Detached | 51 | 24.5% |
| Single Unit, Attached | 0 | 0.0% |
| 2 Unit Apartments | 8 | 3.8% |
| 3 or 4 Unit Apartments | 53 | 25.5% |
| 5 to 9 Unit Apartments | 0 | 0.0% |
| 10 or more Apartments | 0 | 0.0% |
| Mobile Home / Other | 96 | 46.2% |
| Total | 208 | 100.0% |
Housing Structures by Occupancy in Baker
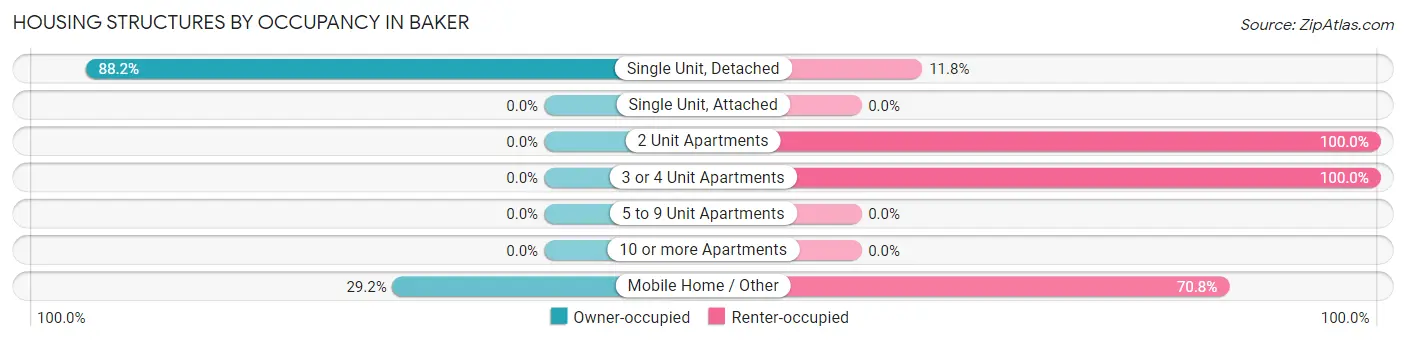
| Structure Type | Owner-occupied | Renter-occupied |
| Single Unit, Detached | 45 (88.2%) | 6 (11.8%) |
| Single Unit, Attached | 0 (0.0%) | 0 (0.0%) |
| 2 Unit Apartments | 0 (0.0%) | 8 (100.0%) |
| 3 or 4 Unit Apartments | 0 (0.0%) | 53 (100.0%) |
| 5 to 9 Unit Apartments | 0 (0.0%) | 0 (0.0%) |
| 10 or more Apartments | 0 (0.0%) | 0 (0.0%) |
| Mobile Home / Other | 28 (29.2%) | 68 (70.8%) |
| Total | 73 (35.1%) | 135 (64.9%) |
Housing Structures by Number of Rooms in Baker
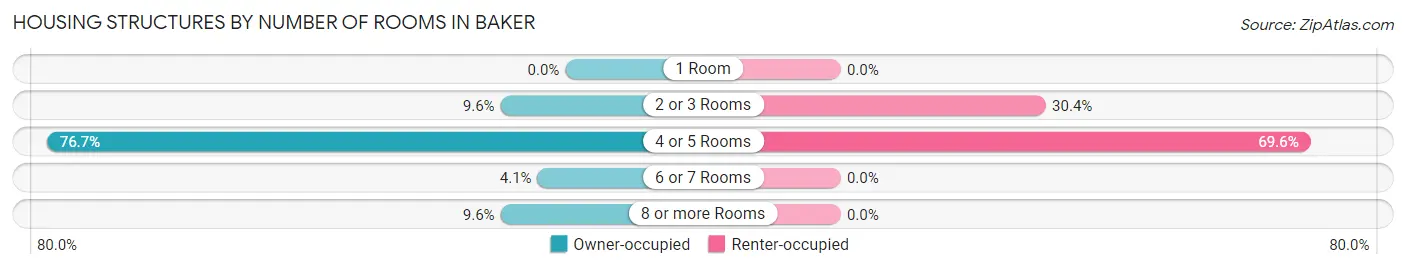
| Number of Rooms | Owner-occupied | Renter-occupied |
| 1 Room | 0 (0.0%) | 0 (0.0%) |
| 2 or 3 Rooms | 7 (9.6%) | 41 (30.4%) |
| 4 or 5 Rooms | 56 (76.7%) | 94 (69.6%) |
| 6 or 7 Rooms | 3 (4.1%) | 0 (0.0%) |
| 8 or more Rooms | 7 (9.6%) | 0 (0.0%) |
| Total | 73 (100.0%) | 135 (100.0%) |
Housing Structure by Heating Type in Baker
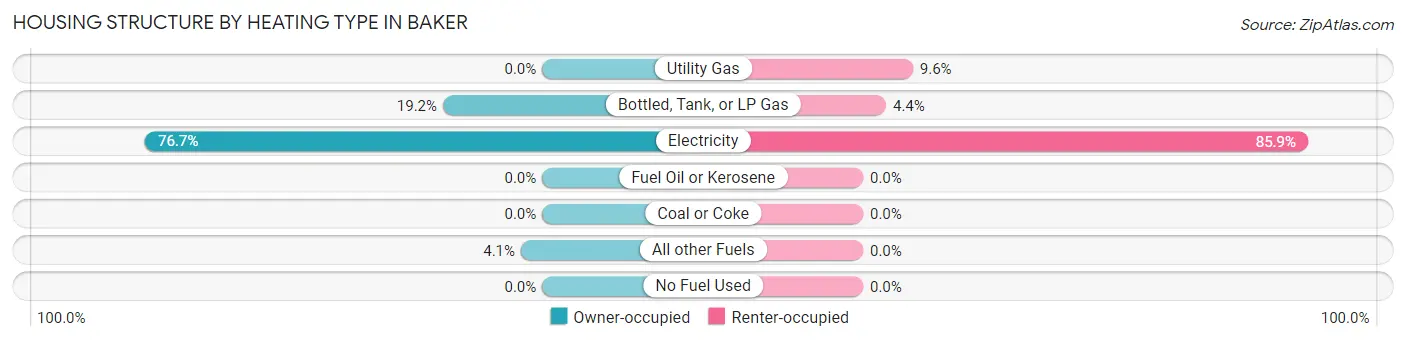
| Heating Type | Owner-occupied | Renter-occupied |
| Utility Gas | 0 (0.0%) | 13 (9.6%) |
| Bottled, Tank, or LP Gas | 14 (19.2%) | 6 (4.4%) |
| Electricity | 56 (76.7%) | 116 (85.9%) |
| Fuel Oil or Kerosene | 0 (0.0%) | 0 (0.0%) |
| Coal or Coke | 0 (0.0%) | 0 (0.0%) |
| All other Fuels | 3 (4.1%) | 0 (0.0%) |
| No Fuel Used | 0 (0.0%) | 0 (0.0%) |
| Total | 73 (100.0%) | 135 (100.0%) |
Household Vehicle Usage in Baker
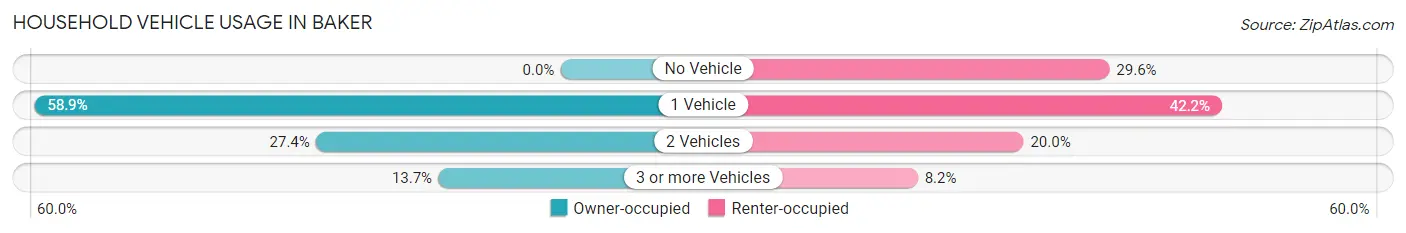
| Vehicles per Household | Owner-occupied | Renter-occupied |
| No Vehicle | 0 (0.0%) | 40 (29.6%) |
| 1 Vehicle | 43 (58.9%) | 57 (42.2%) |
| 2 Vehicles | 20 (27.4%) | 27 (20.0%) |
| 3 or more Vehicles | 10 (13.7%) | 11 (8.2%) |
| Total | 73 (100.0%) | 135 (100.0%) |
Real Estate & Mortgages in Baker
Real Estate and Mortgage Overview in Baker
| Characteristic | Without Mortgage | With Mortgage |
| Housing Units | 31 | 42 |
| Median Property Value | - | - |
| Median Household Income | $92,083 | $0 |
| Monthly Housing Costs | - | - |
| Real Estate Taxes | - | - |
Property Value by Mortgage Status in Baker
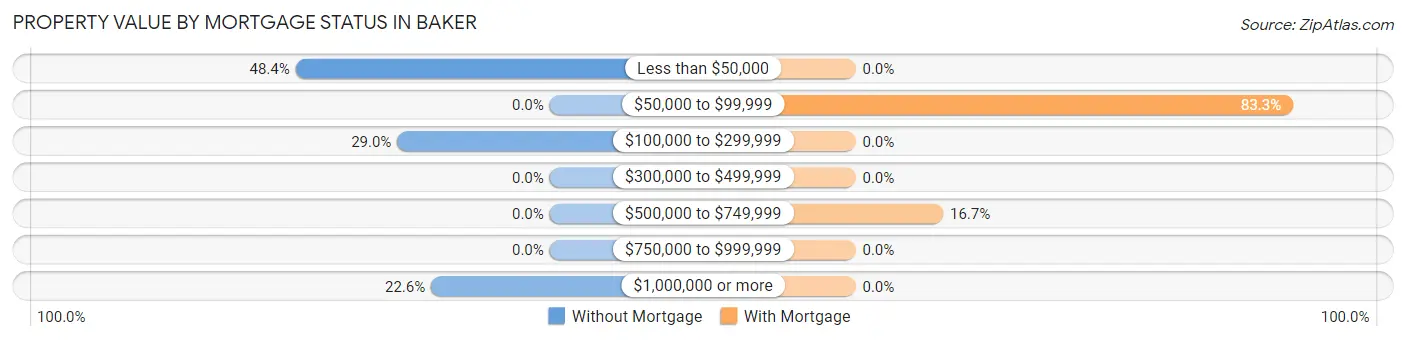
| Property Value | Without Mortgage | With Mortgage |
| Less than $50,000 | 15 (48.4%) | 0 (0.0%) |
| $50,000 to $99,999 | 0 (0.0%) | 35 (83.3%) |
| $100,000 to $299,999 | 9 (29.0%) | 0 (0.0%) |
| $300,000 to $499,999 | 0 (0.0%) | 0 (0.0%) |
| $500,000 to $749,999 | 0 (0.0%) | 7 (16.7%) |
| $750,000 to $999,999 | 0 (0.0%) | 0 (0.0%) |
| $1,000,000 or more | 7 (22.6%) | 0 (0.0%) |
| Total | 31 (100.0%) | 42 (100.0%) |
Household Income by Mortgage Status in Baker
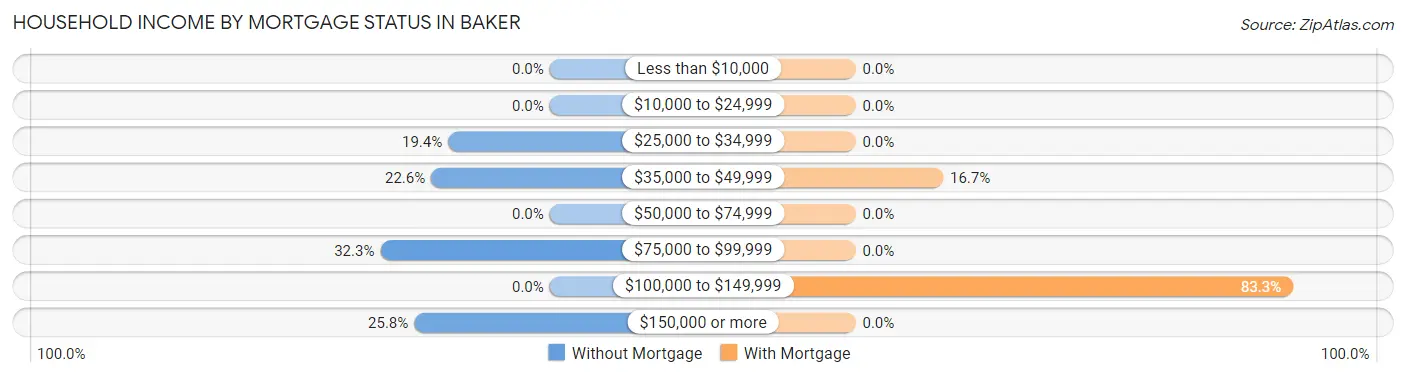
| Household Income | Without Mortgage | With Mortgage |
| Less than $10,000 | 0 (0.0%) | 0 (0.0%) |
| $10,000 to $24,999 | 0 (0.0%) | 0 (0.0%) |
| $25,000 to $34,999 | 6 (19.4%) | 0 (0.0%) |
| $35,000 to $49,999 | 7 (22.6%) | 7 (16.7%) |
| $50,000 to $74,999 | 0 (0.0%) | 0 (0.0%) |
| $75,000 to $99,999 | 10 (32.3%) | 0 (0.0%) |
| $100,000 to $149,999 | 0 (0.0%) | 35 (83.3%) |
| $150,000 or more | 8 (25.8%) | 0 (0.0%) |
| Total | 31 (100.0%) | 42 (100.0%) |
Property Value to Household Income Ratio in Baker
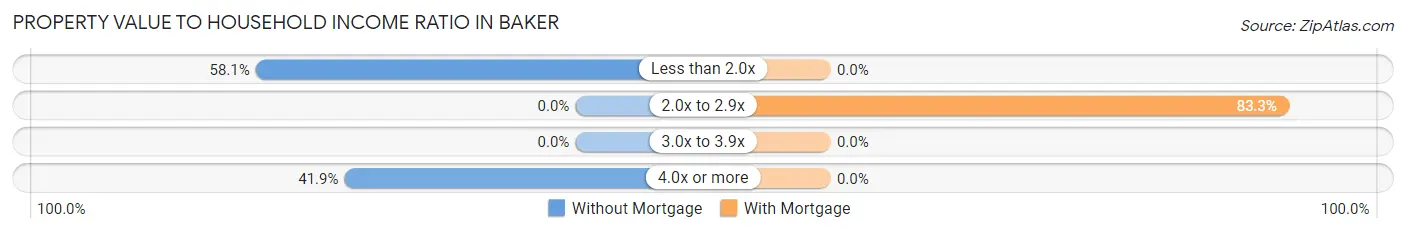
| Value-to-Income Ratio | Without Mortgage | With Mortgage |
| Less than 2.0x | 18 (58.1%) | 0 (0.0%) |
| 2.0x to 2.9x | 0 (0.0%) | 35 (83.3%) |
| 3.0x to 3.9x | 0 (0.0%) | 0 (0.0%) |
| 4.0x or more | 13 (41.9%) | 0 (0.0%) |
| Total | 31 (100.0%) | 42 (100.0%) |
Real Estate Taxes by Mortgage Status in Baker
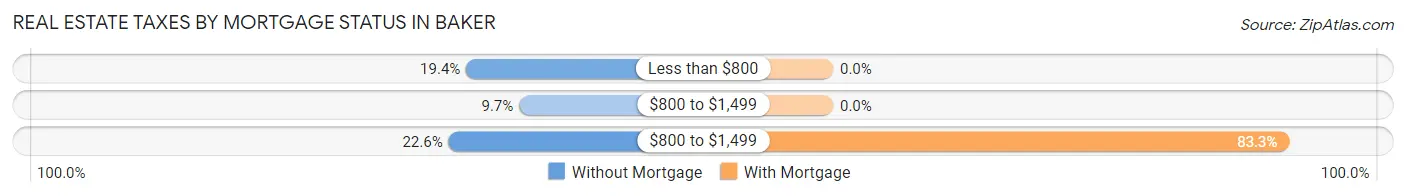
| Property Taxes | Without Mortgage | With Mortgage |
| Less than $800 | 6 (19.4%) | 0 (0.0%) |
| $800 to $1,499 | 3 (9.7%) | 0 (0.0%) |
| $800 to $1,499 | 7 (22.6%) | 35 (83.3%) |
| Total | 31 (100.0%) | 42 (100.0%) |
Health & Disability in Baker
Health Insurance Coverage by Age in Baker
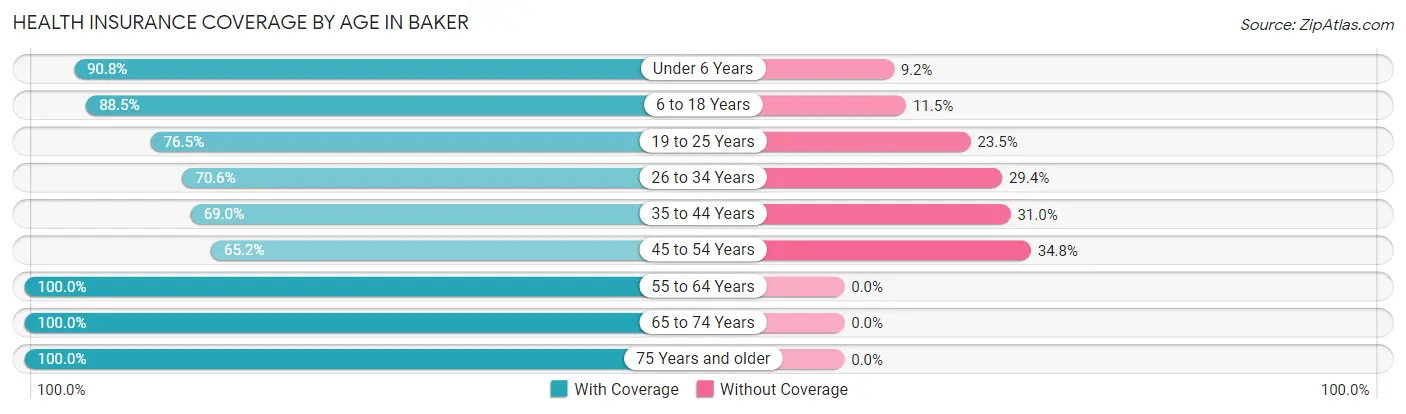
| Age Bracket | With Coverage | Without Coverage |
| Under 6 Years | 69 (90.8%) | 7 (9.2%) |
| 6 to 18 Years | 100 (88.5%) | 13 (11.5%) |
| 19 to 25 Years | 52 (76.5%) | 16 (23.5%) |
| 26 to 34 Years | 48 (70.6%) | 20 (29.4%) |
| 35 to 44 Years | 49 (69.0%) | 22 (31.0%) |
| 45 to 54 Years | 15 (65.2%) | 8 (34.8%) |
| 55 to 64 Years | 106 (100.0%) | 0 (0.0%) |
| 65 to 74 Years | 16 (100.0%) | 0 (0.0%) |
| 75 Years and older | 12 (100.0%) | 0 (0.0%) |
| Total | 467 (84.5%) | 86 (15.5%) |
Health Insurance Coverage by Citizenship Status in Baker
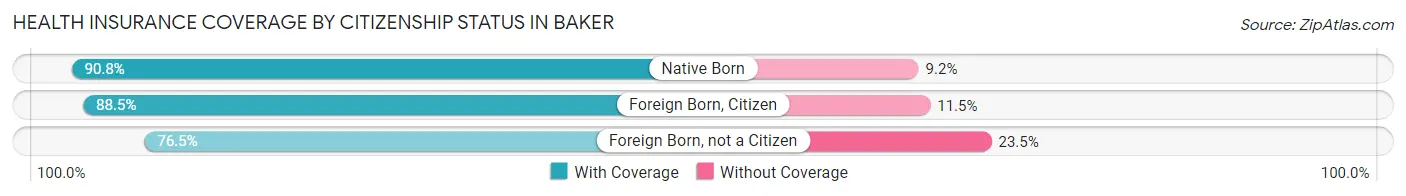
| Citizenship Status | With Coverage | Without Coverage |
| Native Born | 69 (90.8%) | 7 (9.2%) |
| Foreign Born, Citizen | 100 (88.5%) | 13 (11.5%) |
| Foreign Born, not a Citizen | 52 (76.5%) | 16 (23.5%) |
Health Insurance Coverage by Household Income in Baker
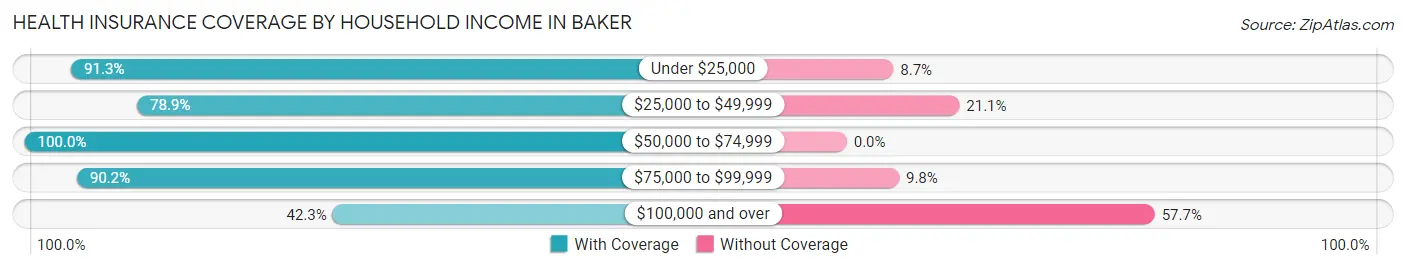
| Household Income | With Coverage | Without Coverage |
| Under $25,000 | 157 (91.3%) | 15 (8.7%) |
| $25,000 to $49,999 | 101 (78.9%) | 27 (21.1%) |
| $50,000 to $74,999 | 52 (100.0%) | 0 (0.0%) |
| $75,000 to $99,999 | 129 (90.2%) | 14 (9.8%) |
| $100,000 and over | 22 (42.3%) | 30 (57.7%) |
Public vs Private Health Insurance Coverage by Age in Baker
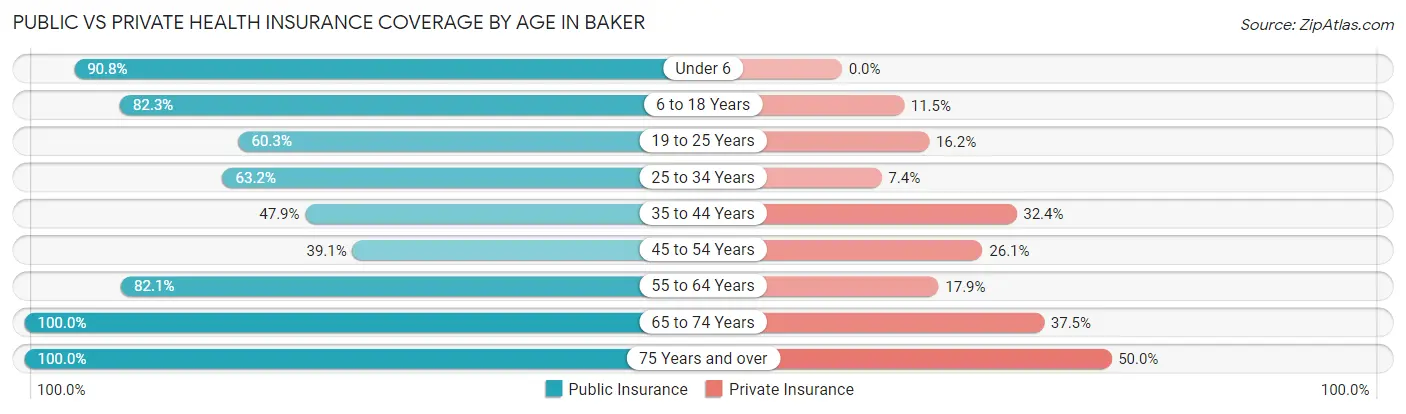
| Age Bracket | Public Insurance | Private Insurance |
| Under 6 | 69 (90.8%) | 0 (0.0%) |
| 6 to 18 Years | 93 (82.3%) | 13 (11.5%) |
| 19 to 25 Years | 41 (60.3%) | 11 (16.2%) |
| 25 to 34 Years | 43 (63.2%) | 5 (7.3%) |
| 35 to 44 Years | 34 (47.9%) | 23 (32.4%) |
| 45 to 54 Years | 9 (39.1%) | 6 (26.1%) |
| 55 to 64 Years | 87 (82.1%) | 19 (17.9%) |
| 65 to 74 Years | 16 (100.0%) | 6 (37.5%) |
| 75 Years and over | 12 (100.0%) | 6 (50.0%) |
| Total | 404 (73.1%) | 89 (16.1%) |
Disability Status by Sex by Age in Baker
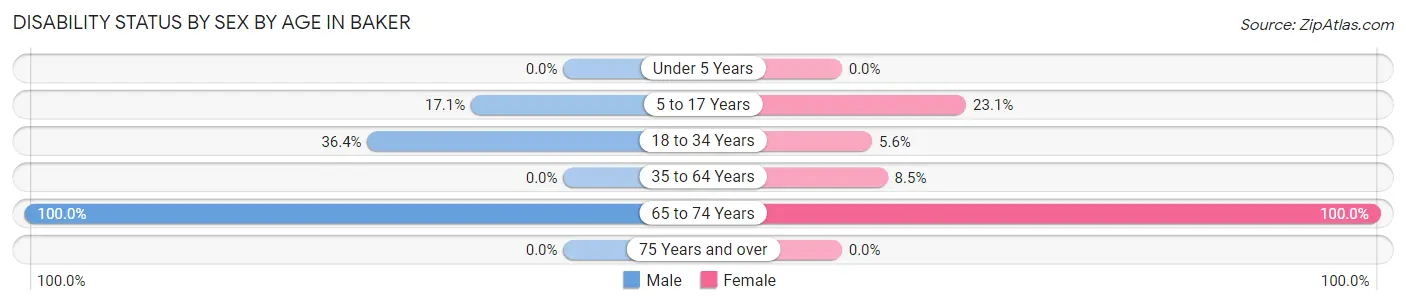
| Age Bracket | Male | Female |
| Under 5 Years | 0 (0.0%) | 0 (0.0%) |
| 5 to 17 Years | 12 (17.1%) | 6 (23.1%) |
| 18 to 34 Years | 28 (36.4%) | 5 (5.6%) |
| 35 to 64 Years | 0 (0.0%) | 8 (8.5%) |
| 65 to 74 Years | 10 (100.0%) | 6 (100.0%) |
| 75 Years and over | 0 (0.0%) | 0 (0.0%) |
Disability Class by Sex by Age in Baker
Disability Class: Hearing Difficulty
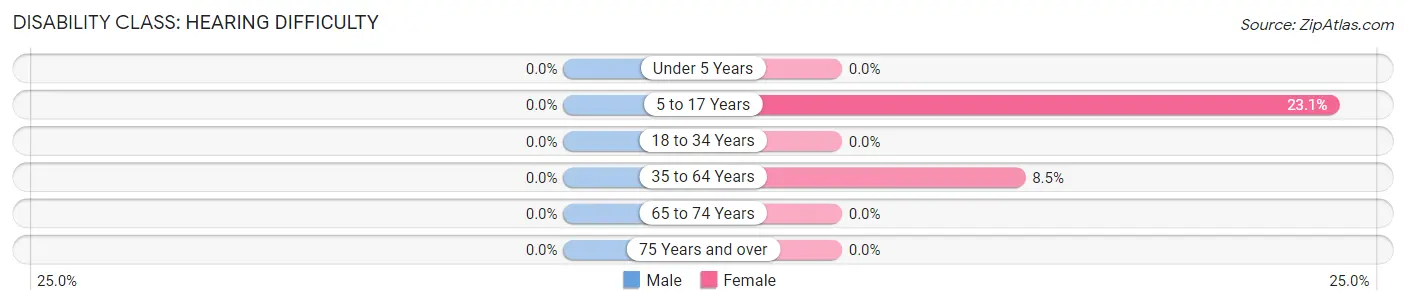
| Age Bracket | Male | Female |
| Under 5 Years | 0 (0.0%) | 0 (0.0%) |
| 5 to 17 Years | 0 (0.0%) | 6 (23.1%) |
| 18 to 34 Years | 0 (0.0%) | 0 (0.0%) |
| 35 to 64 Years | 0 (0.0%) | 8 (8.5%) |
| 65 to 74 Years | 0 (0.0%) | 0 (0.0%) |
| 75 Years and over | 0 (0.0%) | 0 (0.0%) |
Disability Class: Vision Difficulty
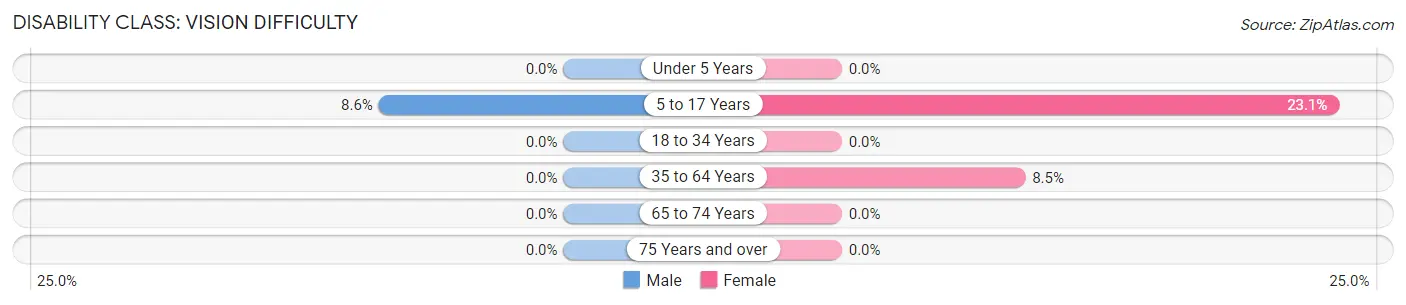
| Age Bracket | Male | Female |
| Under 5 Years | 0 (0.0%) | 0 (0.0%) |
| 5 to 17 Years | 6 (8.6%) | 6 (23.1%) |
| 18 to 34 Years | 0 (0.0%) | 0 (0.0%) |
| 35 to 64 Years | 0 (0.0%) | 8 (8.5%) |
| 65 to 74 Years | 0 (0.0%) | 0 (0.0%) |
| 75 Years and over | 0 (0.0%) | 0 (0.0%) |
Disability Class: Cognitive Difficulty
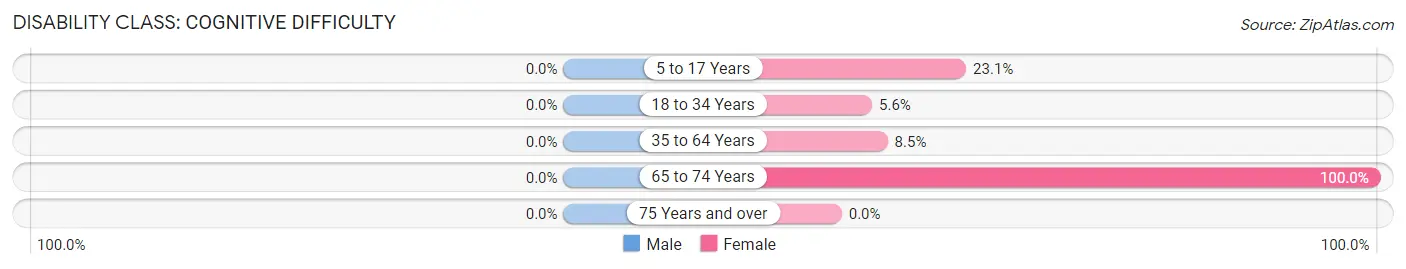
| Age Bracket | Male | Female |
| 5 to 17 Years | 0 (0.0%) | 6 (23.1%) |
| 18 to 34 Years | 0 (0.0%) | 5 (5.6%) |
| 35 to 64 Years | 0 (0.0%) | 8 (8.5%) |
| 65 to 74 Years | 0 (0.0%) | 6 (100.0%) |
| 75 Years and over | 0 (0.0%) | 0 (0.0%) |
Disability Class: Ambulatory Difficulty
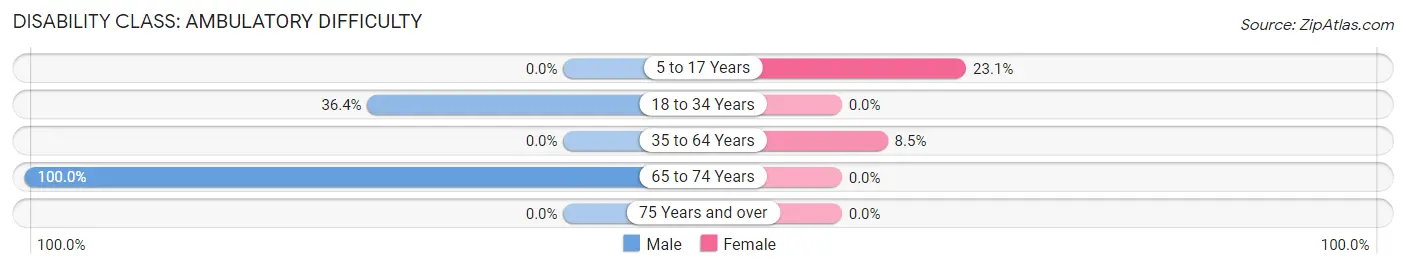
| Age Bracket | Male | Female |
| 5 to 17 Years | 0 (0.0%) | 6 (23.1%) |
| 18 to 34 Years | 28 (36.4%) | 0 (0.0%) |
| 35 to 64 Years | 0 (0.0%) | 8 (8.5%) |
| 65 to 74 Years | 10 (100.0%) | 0 (0.0%) |
| 75 Years and over | 0 (0.0%) | 0 (0.0%) |
Disability Class: Self-Care Difficulty
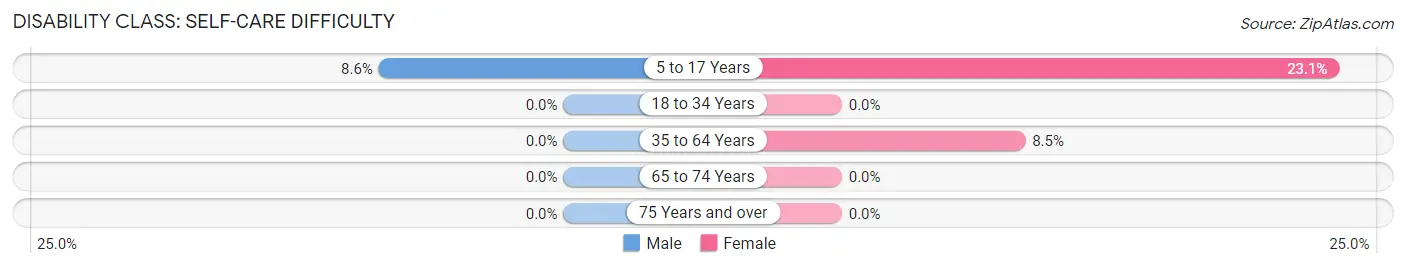
| Age Bracket | Male | Female |
| 5 to 17 Years | 6 (8.6%) | 6 (23.1%) |
| 18 to 34 Years | 0 (0.0%) | 0 (0.0%) |
| 35 to 64 Years | 0 (0.0%) | 8 (8.5%) |
| 65 to 74 Years | 0 (0.0%) | 0 (0.0%) |
| 75 Years and over | 0 (0.0%) | 0 (0.0%) |
Technology Access in Baker
Computing Device Access in Baker
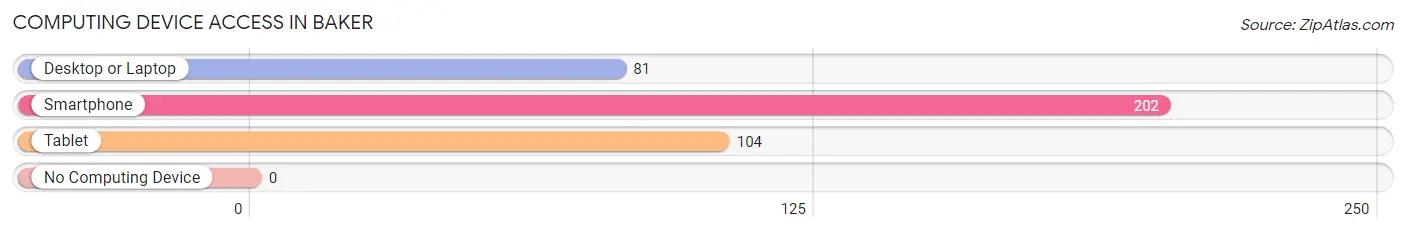
| Device Type | # Households | % Households |
| Desktop or Laptop | 81 | 38.9% |
| Smartphone | 202 | 97.1% |
| Tablet | 104 | 50.0% |
| No Computing Device | 0 | 0.0% |
| Total | 208 | 100.0% |
Internet Access in Baker
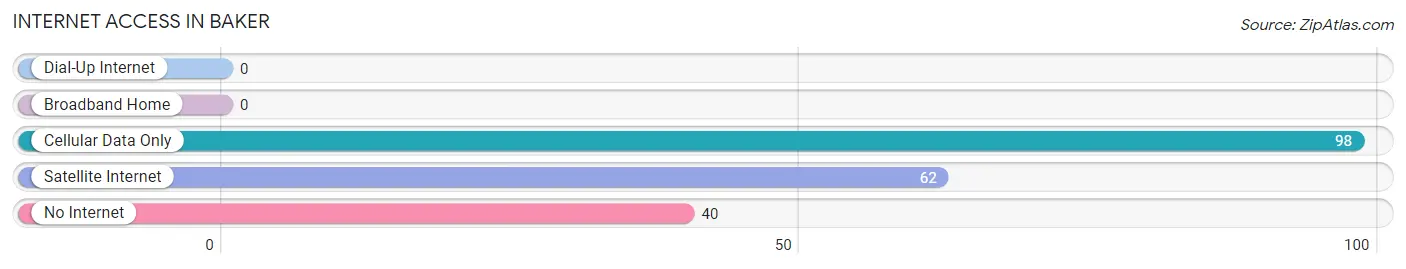
| Internet Type | # Households | % Households |
| Dial-Up Internet | 0 | 0.0% |
| Broadband Home | 0 | 0.0% |
| Cellular Data Only | 98 | 47.1% |
| Satellite Internet | 62 | 29.8% |
| No Internet | 40 | 19.2% |
| Total | 208 | 100.0% |
Baker Summary
Baker is a small city located in San Bernardino County, California. It is situated in the Mojave Desert, approximately 30 miles east of Barstow and about 100 miles northeast of Los Angeles. The city is located along Interstate 15, which is the main highway connecting Los Angeles and Las Vegas. Baker is known for its proximity to the world’s tallest thermometer, which stands at 134 feet tall and is located just outside of town.
History
The area that is now Baker was originally inhabited by the Chemehuevi Native Americans. The first European settlers arrived in the area in the late 19th century, and the town of Baker was established in 1908. The town was named after Richard C. Baker, who was a local rancher and businessman.
In the early 20th century, Baker became a popular stop for travelers on their way to Las Vegas. The town was also known for its mineral springs, which were believed to have healing properties.
In the 1950s, Baker began to experience a population boom due to the construction of the nearby military base, Fort Irwin. The base brought many new jobs to the area, and the population of Baker grew to over 1,000 people.
Geography
Baker is located in the Mojave Desert, at an elevation of 1,890 feet. The city is surrounded by the Avawatz Mountains to the west, the Old Woman Mountains to the east, and the Granite Mountains to the south. The climate in Baker is hot and dry, with temperatures reaching over 100 degrees Fahrenheit in the summer months.
Economy
The economy of Baker is largely based on tourism. The city is a popular stop for travelers on their way to Las Vegas, and it is also home to the world’s tallest thermometer. The city also has a few small businesses, including a gas station, a convenience store, and a few restaurants.
Demographics
As of the 2010 census, the population of Baker was 735 people. The racial makeup of the city was 75.3% White, 0.7% African American, 0.7% Native American, 0.7% Asian, 0.1% Pacific Islander, and 21.7% from other races. The median household income in Baker was $31,250, and the median age was 33 years.
Conclusion
Baker is a small city located in San Bernardino County, California. It is situated in the Mojave Desert, and is known for its proximity to the world’s tallest thermometer. The economy of Baker is largely based on tourism, and the city has a few small businesses. The population of Baker was 735 people as of the 2010 census, and the median household income was $31,250.
Common Questions
What is Per Capita Income in Baker?
Per Capita income in Baker is $20,306.
What is the Median Family Income in Baker?
Median Family Income in Baker is $75,321.
What is the Median Household income in Baker?
Median Household Income in Baker is $31,786.
What is Inequality or Gini Index in Baker?
Inequality or Gini Index in Baker is 0.41.
What is the Total Population of Baker?
Total Population of Baker is 553.
What is the Total Male Population of Baker?
Total Male Population of Baker is 273.
What is the Total Female Population of Baker?
Total Female Population of Baker is 280.
What is the Ratio of Males per 100 Females in Baker?
There are 97.50 Males per 100 Females in Baker.
What is the Ratio of Females per 100 Males in Baker?
There are 102.56 Females per 100 Males in Baker.
What is the Median Population Age in Baker?
Median Population Age in Baker is 28.3 Years.
What is the Average Family Size in Baker
Average Family Size in Baker is 3.1 People.
What is the Average Household Size in Baker
Average Household Size in Baker is 2.6 People.
How Large is the Labor Force in Baker?
There are 328 People in the Labor Forcein in Baker.
What is the Percentage of People in the Labor Force in Baker?
77.4% of People are in the Labor Force in Baker.
What is the Unemployment Rate in Baker?
Unemployment Rate in Baker is 4.0%.