Lake California, CA Map & Demographics
Lake California Map
Lake California Overview
$35,799
PER CAPITA INCOME
$96,465
AVG FAMILY INCOME
$93,750
AVG HOUSEHOLD INCOME
13.3%
WAGE / INCOME GAP [ % ]
86.7¢/ $1
WAGE / INCOME GAP [ $ ]
0.31
INEQUALITY / GINI INDEX
3,639
TOTAL POPULATION
1,861
MALE POPULATION
1,778
FEMALE POPULATION
104.67
MALES / 100 FEMALES
95.54
FEMALES / 100 MALES
38.8
MEDIAN AGE
3.2
AVG FAMILY SIZE
2.7
AVG HOUSEHOLD SIZE
1,634
LABOR FORCE [ PEOPLE ]
56.7%
PERCENT IN LABOR FORCE
6.6%
UNEMPLOYMENT RATE
Income in Lake California
Income Overview in Lake California
Per Capita Income in Lake California is $35,799, while median incomes of families and households are $96,465 and $93,750 respectively.
| Characteristic | Number | Measure |
| Per Capita Income | 3,639 | $35,799 |
| Median Family Income | 945 | $96,465 |
| Mean Family Income | 945 | $102,056 |
| Median Household Income | 1,325 | $93,750 |
| Mean Household Income | 1,325 | $91,111 |
| Income Deficit | 945 | $0 |
| Wage / Income Gap (%) | 3,639 | 13.29% |
| Wage / Income Gap ($) | 3,639 | 86.71¢ per $1 |
| Gini / Inequality Index | 3,639 | 0.31 |
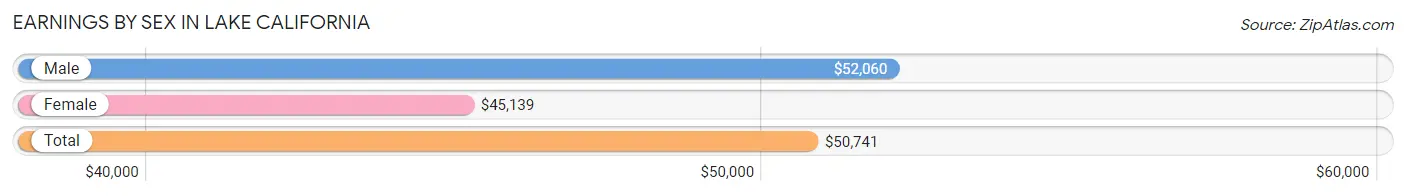
Earnings by Sex in Lake California
Average Earnings in Lake California are $50,741, $52,060 for men and $45,139 for women, a difference of 13.3%.
| Sex | Number | Average Earnings |
| Male | 985 (57.8%) | $52,060 |
| Female | 719 (42.2%) | $45,139 |
| Total | 1,704 (100.0%) | $50,741 |
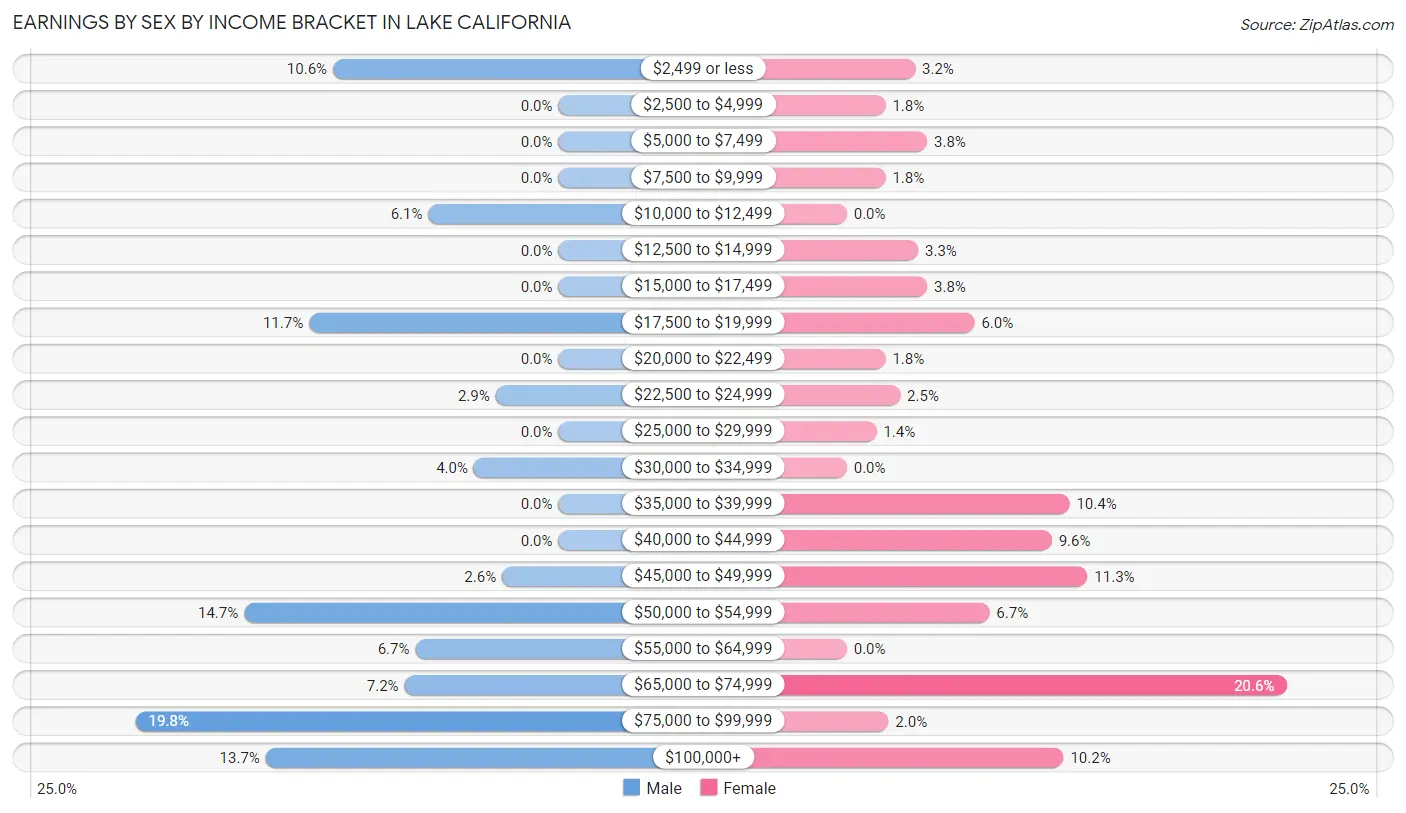
Earnings by Sex by Income Bracket in Lake California
The most common earnings brackets in Lake California are $75,000 to $99,999 for men (195 | 19.8%) and $65,000 to $74,999 for women (148 | 20.6%).
| Income | Male | Female |
| $2,499 or less | 104 (10.6%) | 23 (3.2%) |
| $2,500 to $4,999 | 0 (0.0%) | 13 (1.8%) |
| $5,000 to $7,499 | 0 (0.0%) | 27 (3.8%) |
| $7,500 to $9,999 | 0 (0.0%) | 13 (1.8%) |
| $10,000 to $12,499 | 60 (6.1%) | 0 (0.0%) |
| $12,500 to $14,999 | 0 (0.0%) | 24 (3.3%) |
| $15,000 to $17,499 | 0 (0.0%) | 27 (3.8%) |
| $17,500 to $19,999 | 115 (11.7%) | 43 (6.0%) |
| $20,000 to $22,499 | 0 (0.0%) | 13 (1.8%) |
| $22,500 to $24,999 | 29 (2.9%) | 18 (2.5%) |
| $25,000 to $29,999 | 0 (0.0%) | 10 (1.4%) |
| $30,000 to $34,999 | 39 (4.0%) | 0 (0.0%) |
| $35,000 to $39,999 | 0 (0.0%) | 75 (10.4%) |
| $40,000 to $44,999 | 0 (0.0%) | 69 (9.6%) |
| $45,000 to $49,999 | 26 (2.6%) | 81 (11.3%) |
| $50,000 to $54,999 | 145 (14.7%) | 48 (6.7%) |
| $55,000 to $64,999 | 66 (6.7%) | 0 (0.0%) |
| $65,000 to $74,999 | 71 (7.2%) | 148 (20.6%) |
| $75,000 to $99,999 | 195 (19.8%) | 14 (1.9%) |
| $100,000+ | 135 (13.7%) | 73 (10.2%) |
| Total | 985 (100.0%) | 719 (100.0%) |
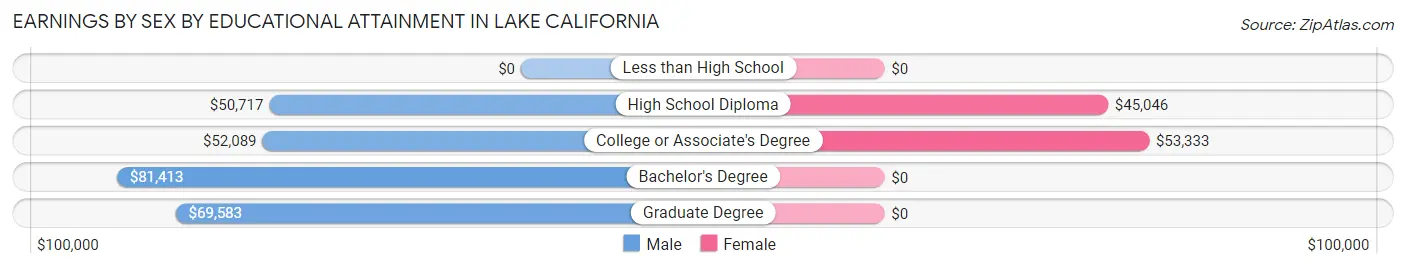
Earnings by Sex by Educational Attainment in Lake California
Average earnings in Lake California are $62,235 for men and $46,790 for women, a difference of 24.8%. Men with an educational attainment of bachelor's degree enjoy the highest average annual earnings of $81,413, while those with high school diploma education earn the least with $50,717. Women with an educational attainment of college or associate's degree earn the most with the average annual earnings of $53,333, while those with high school diploma education have the smallest earnings of $45,046.
| Educational Attainment | Male Income | Female Income |
| Less than High School | - | - |
| High School Diploma | $50,717 | $45,046 |
| College or Associate's Degree | $52,089 | $53,333 |
| Bachelor's Degree | $81,413 | $0 |
| Graduate Degree | $69,583 | $0 |
| Total | $62,235 | $46,790 |
Family Income in Lake California
Family Income Brackets in Lake California
According to the Lake California family income data, there are 317 families falling into the $100,000 to $149,999 income range, which is the most common income bracket and makes up 33.5% of all families.
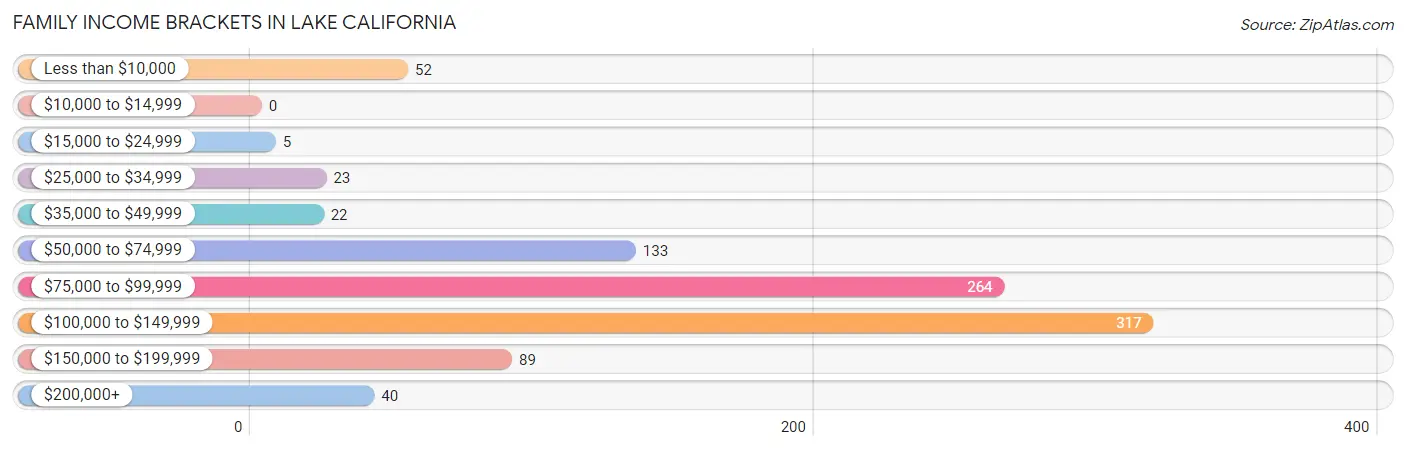
| Income Bracket | # Families | % Families |
| Less than $10,000 | 52 | 5.5% |
| $10,000 to $14,999 | 0 | 0.0% |
| $15,000 to $24,999 | 5 | 0.5% |
| $25,000 to $34,999 | 23 | 2.4% |
| $35,000 to $49,999 | 22 | 2.3% |
| $50,000 to $74,999 | 133 | 14.1% |
| $75,000 to $99,999 | 264 | 27.9% |
| $100,000 to $149,999 | 317 | 33.5% |
| $150,000 to $199,999 | 89 | 9.4% |
| $200,000+ | 40 | 4.2% |
Family Income by Famaliy Size in Lake California
2-person families (404 | 42.7%) account for the highest median family income in Lake California with $106,250 per family, while 2-person families (404 | 42.7%) have the highest median income of $53,125 per family member.
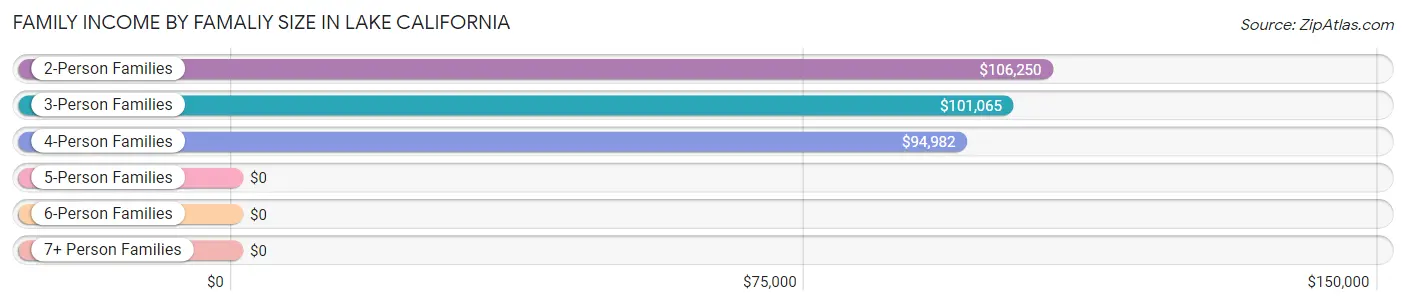
| Income Bracket | # Families | Median Income |
| 2-Person Families | 404 (42.7%) | $106,250 |
| 3-Person Families | 196 (20.7%) | $101,065 |
| 4-Person Families | 295 (31.2%) | $94,982 |
| 5-Person Families | 35 (3.7%) | $0 |
| 6-Person Families | 15 (1.6%) | $0 |
| 7+ Person Families | 0 (0.0%) | $0 |
| Total | 945 (100.0%) | $96,465 |
Family Income by Number of Earners in Lake California
The median family income in Lake California is $96,465, with families comprising 3+ earners (87) having the highest median family income of $129,375, while families with no earners (251) have the lowest median family income of $64,330, accounting for 9.2% and 26.6% of families, respectively.
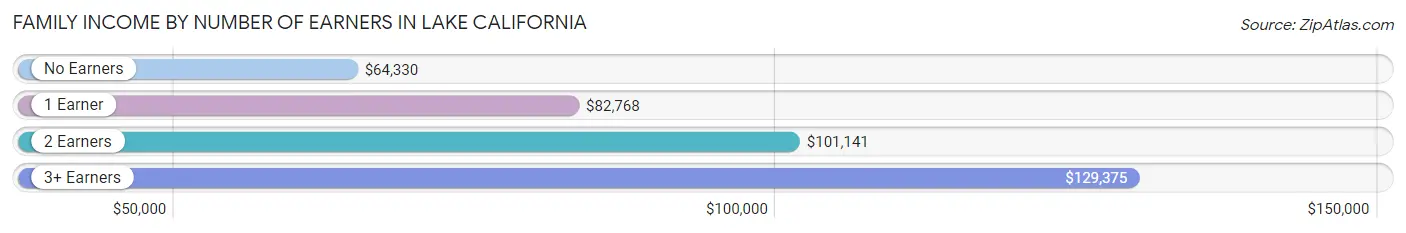
| Number of Earners | # Families | Median Income |
| No Earners | 251 (26.6%) | $64,330 |
| 1 Earner | 202 (21.4%) | $82,768 |
| 2 Earners | 405 (42.9%) | $101,141 |
| 3+ Earners | 87 (9.2%) | $129,375 |
| Total | 945 (100.0%) | $96,465 |
Household Income in Lake California
Household Income Brackets in Lake California
With 435 households falling in the category, the $100,000 to $149,999 income range is the most frequent in Lake California, accounting for 32.8% of all households. In contrast, only 16 households (1.2%) fall into the $15,000 to $24,999 income bracket, making it the least populous group.
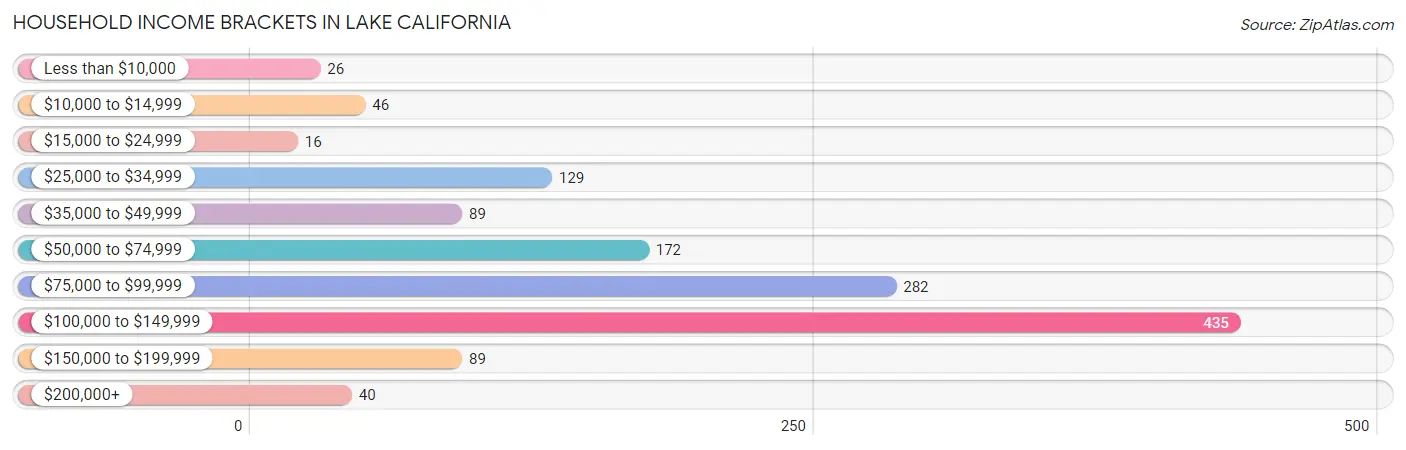
| Income Bracket | # Households | % Households |
| Less than $10,000 | 26 | 2.0% |
| $10,000 to $14,999 | 46 | 3.5% |
| $15,000 to $24,999 | 16 | 1.2% |
| $25,000 to $34,999 | 129 | 9.7% |
| $35,000 to $49,999 | 89 | 6.7% |
| $50,000 to $74,999 | 172 | 13.0% |
| $75,000 to $99,999 | 282 | 21.3% |
| $100,000 to $149,999 | 435 | 32.8% |
| $150,000 to $199,999 | 89 | 6.7% |
| $200,000+ | 40 | 3.0% |
Household Income by Householder Age in Lake California
The median household income in Lake California is $93,750, with the highest median household income of $101,891 found in the 45 to 64 years age bracket for the primary householder. A total of 544 households (41.1%) fall into this category.
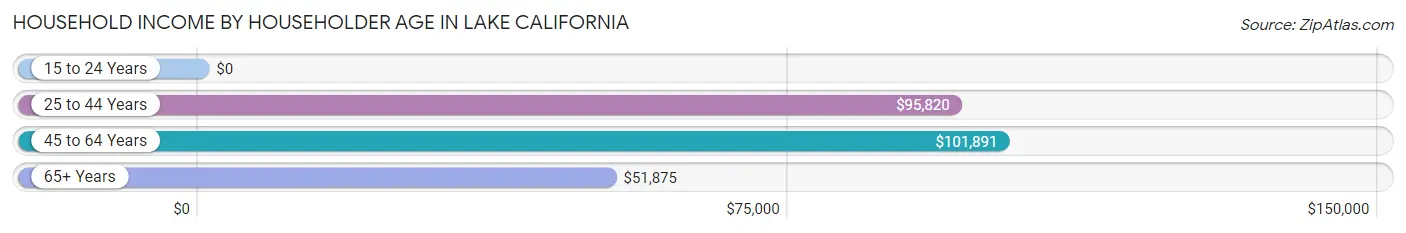
| Income Bracket | # Households | Median Income |
| 15 to 24 Years | 0 (0.0%) | $0 |
| 25 to 44 Years | 422 (31.9%) | $95,820 |
| 45 to 64 Years | 544 (41.1%) | $101,891 |
| 65+ Years | 359 (27.1%) | $51,875 |
| Total | 1,325 (100.0%) | $93,750 |
Poverty in Lake California
Income Below Poverty by Sex and Age in Lake California
With 22.0% poverty level for males and 5.3% for females among the residents of Lake California, 65 to 74 year old males and 35 to 44 year old females are the most vulnerable to poverty, with 187 males (74.5%) and 35 females (21.5%) in their respective age groups living below the poverty level.
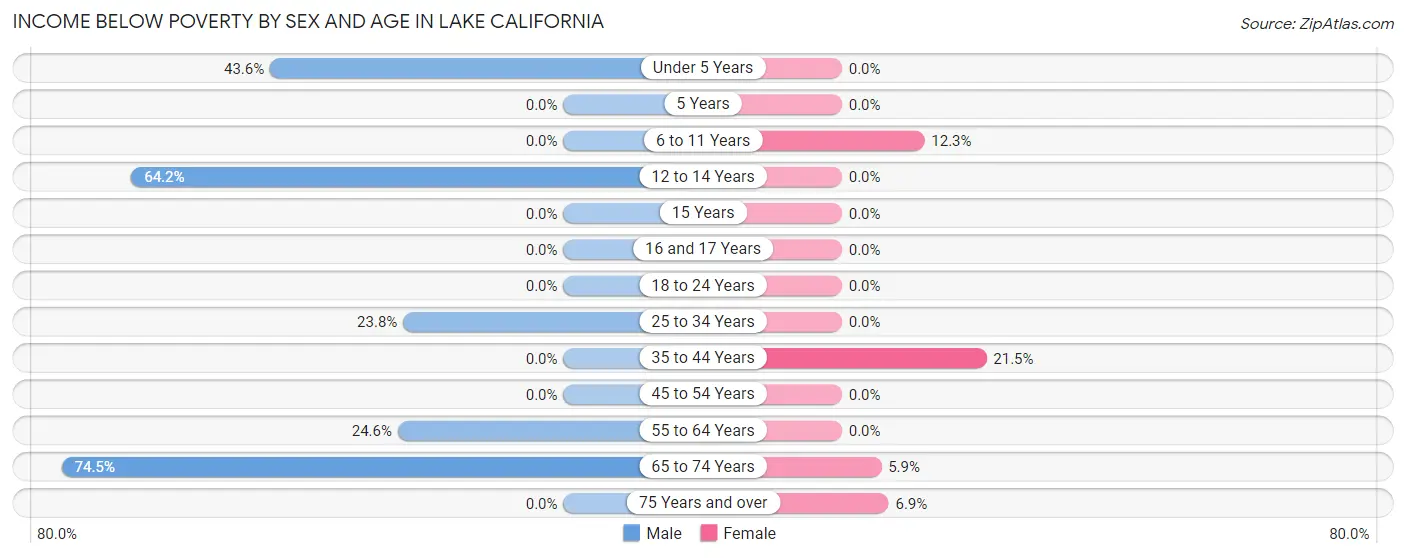
| Age Bracket | Male | Female |
| Under 5 Years | 27 (43.5%) | 0 (0.0%) |
| 5 Years | 0 (0.0%) | 0 (0.0%) |
| 6 to 11 Years | 0 (0.0%) | 38 (12.3%) |
| 12 to 14 Years | 68 (64.1%) | 0 (0.0%) |
| 15 Years | 0 (0.0%) | 0 (0.0%) |
| 16 and 17 Years | 0 (0.0%) | 0 (0.0%) |
| 18 to 24 Years | 0 (0.0%) | 0 (0.0%) |
| 25 to 34 Years | 69 (23.8%) | 0 (0.0%) |
| 35 to 44 Years | 0 (0.0%) | 35 (21.5%) |
| 45 to 54 Years | 0 (0.0%) | 0 (0.0%) |
| 55 to 64 Years | 58 (24.6%) | 0 (0.0%) |
| 65 to 74 Years | 187 (74.5%) | 11 (5.9%) |
| 75 Years and over | 0 (0.0%) | 10 (6.9%) |
| Total | 409 (22.0%) | 94 (5.3%) |
Income Above Poverty by Sex and Age in Lake California
According to the poverty statistics in Lake California, males aged 5 years and females aged under 5 years are the age groups that are most secure financially, with 100.0% of males and 100.0% of females in these age groups living above the poverty line.
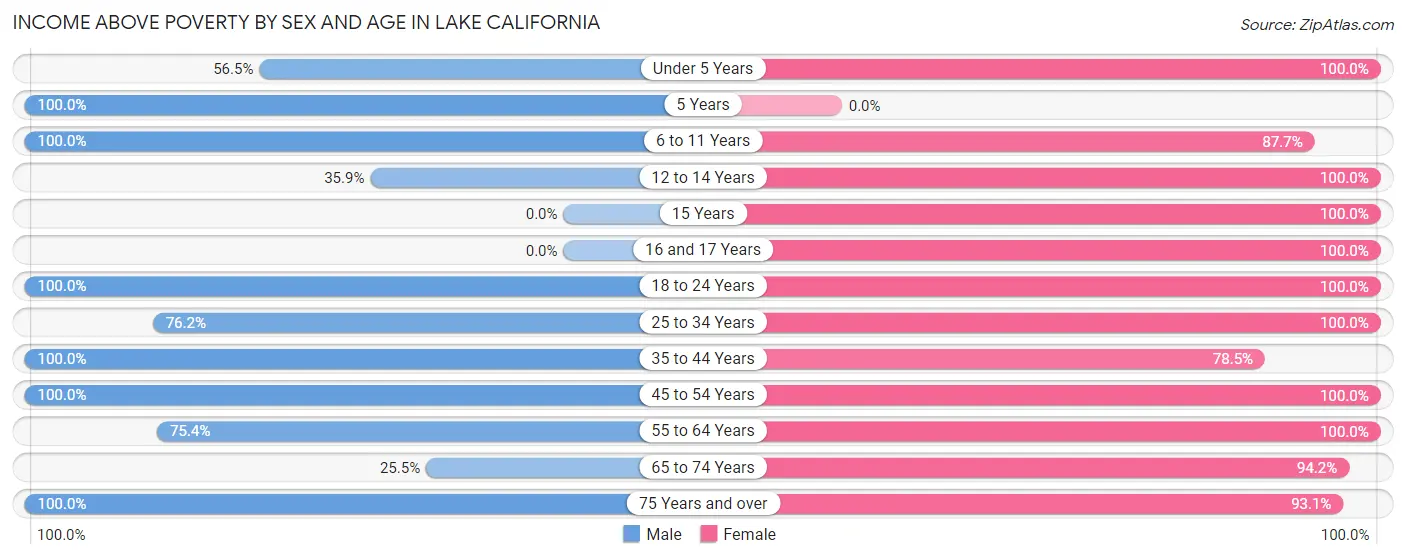
| Age Bracket | Male | Female |
| Under 5 Years | 35 (56.5%) | 11 (100.0%) |
| 5 Years | 65 (100.0%) | 0 (0.0%) |
| 6 to 11 Years | 74 (100.0%) | 272 (87.7%) |
| 12 to 14 Years | 38 (35.8%) | 111 (100.0%) |
| 15 Years | 0 (0.0%) | 18 (100.0%) |
| 16 and 17 Years | 0 (0.0%) | 45 (100.0%) |
| 18 to 24 Years | 169 (100.0%) | 84 (100.0%) |
| 25 to 34 Years | 221 (76.2%) | 257 (100.0%) |
| 35 to 44 Years | 279 (100.0%) | 128 (78.5%) |
| 45 to 54 Years | 202 (100.0%) | 155 (100.0%) |
| 55 to 64 Years | 178 (75.4%) | 292 (100.0%) |
| 65 to 74 Years | 64 (25.5%) | 177 (94.2%) |
| 75 Years and over | 127 (100.0%) | 134 (93.1%) |
| Total | 1,452 (78.0%) | 1,684 (94.7%) |
Income Below Poverty Among Married-Couple Families in Lake California
The poverty statistics for married-couple families in Lake California show that 2.0% or 17 of the total 834 families live below the poverty line. Families with no children have the highest poverty rate of 3.2%, comprising of 17 families. On the other hand, families with 1 or 2 children have the lowest poverty rate of 0.0%, which includes 0 families.
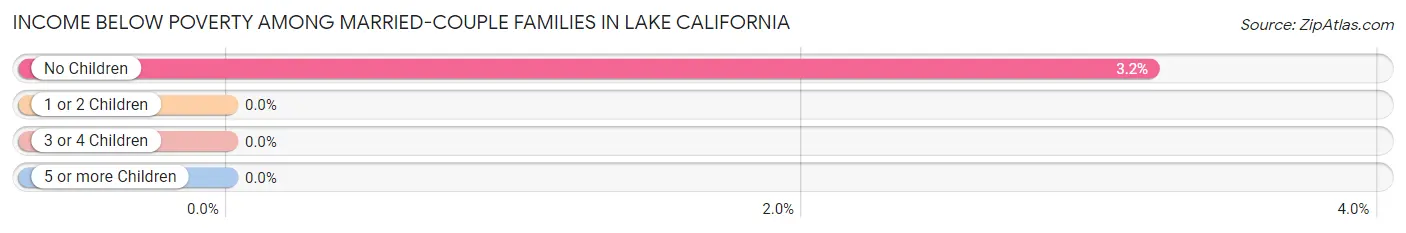
| Children | Above Poverty | Below Poverty |
| No Children | 512 (96.8%) | 17 (3.2%) |
| 1 or 2 Children | 305 (100.0%) | 0 (0.0%) |
| 3 or 4 Children | 0 (0.0%) | 0 (0.0%) |
| 5 or more Children | 0 (0.0%) | 0 (0.0%) |
| Total | 817 (98.0%) | 17 (2.0%) |
Income Below Poverty Among Single-Parent Households in Lake California
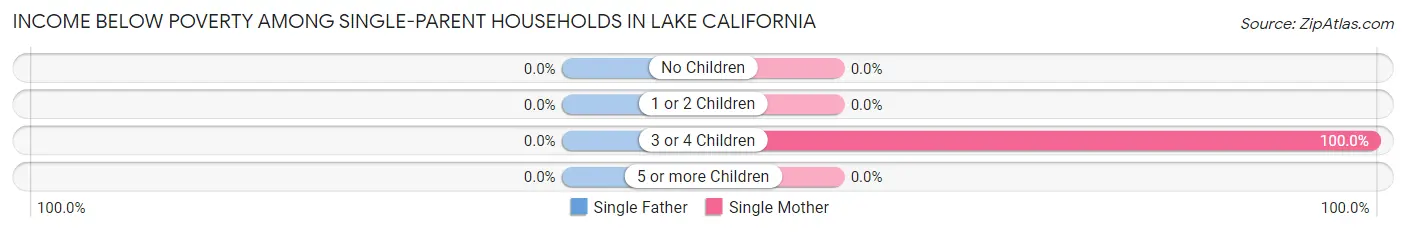
| Children | Single Father | Single Mother |
| No Children | 0 (0.0%) | 0 (0.0%) |
| 1 or 2 Children | 0 (0.0%) | 0 (0.0%) |
| 3 or 4 Children | 0 (0.0%) | 35 (100.0%) |
| 5 or more Children | 0 (0.0%) | 0 (0.0%) |
| Total | 0 (0.0%) | 35 (61.4%) |
Income Below Poverty Among Married-Couple vs Single-Parent Households in Lake California
The poverty data for Lake California shows that 17 of the married-couple family households (2.0%) and 35 of the single-parent households (31.5%) are living below the poverty level. Within the married-couple family households, those with no children have the highest poverty rate, with 17 households (3.2%) falling below the poverty line. Among the single-parent households, those with 3 or 4 children have the highest poverty rate, with 35 household (74.5%) living below poverty.
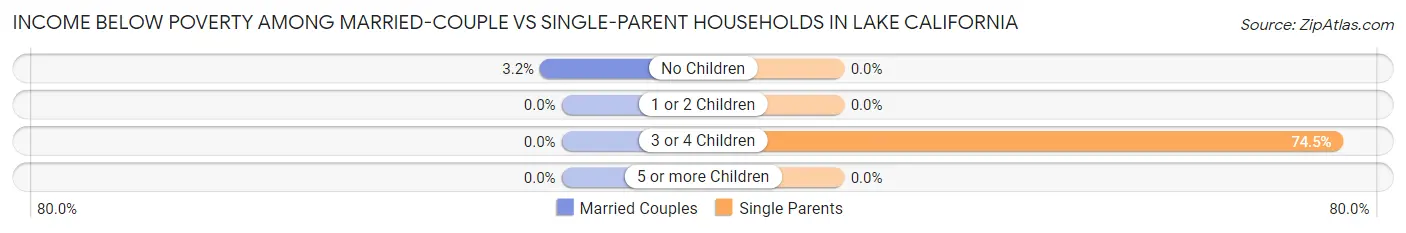
| Children | Married-Couple Families | Single-Parent Households |
| No Children | 17 (3.2%) | 0 (0.0%) |
| 1 or 2 Children | 0 (0.0%) | 0 (0.0%) |
| 3 or 4 Children | 0 (0.0%) | 35 (74.5%) |
| 5 or more Children | 0 (0.0%) | 0 (0.0%) |
| Total | 17 (2.0%) | 35 (31.5%) |
Race in Lake California
The most populous races in Lake California are White / Caucasian (3,258 | 89.5%), Two or more Races (333 | 9.1%), and Hispanic or Latino (301 | 8.3%).
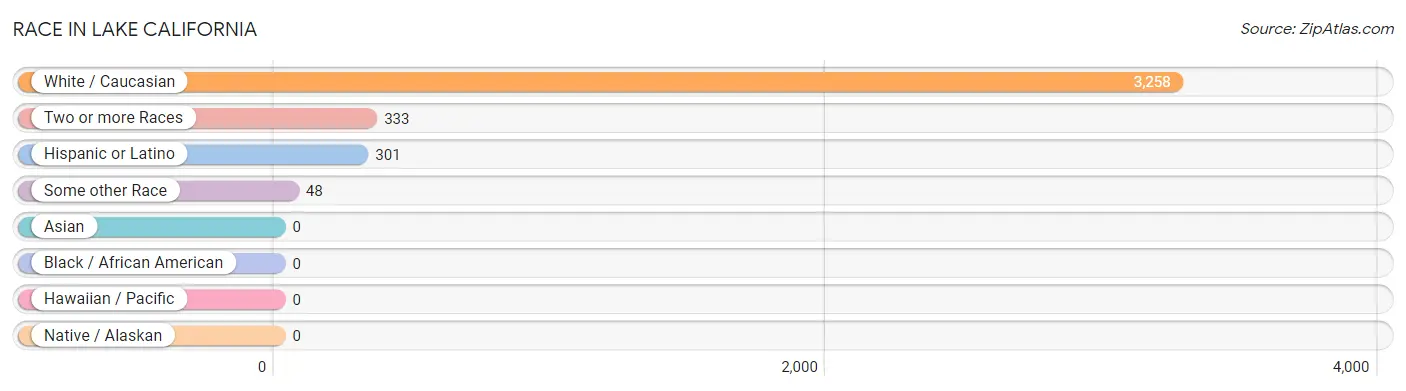
| Race | # Population | % Population |
| Asian | 0 | 0.0% |
| Black / African American | 0 | 0.0% |
| Hawaiian / Pacific | 0 | 0.0% |
| Hispanic or Latino | 301 | 8.3% |
| Native / Alaskan | 0 | 0.0% |
| White / Caucasian | 3,258 | 89.5% |
| Two or more Races | 333 | 9.1% |
| Some other Race | 48 | 1.3% |
| Total | 3,639 | 100.0% |
Ancestry in Lake California
The most populous ancestries reported in Lake California are English (861 | 23.7%), Irish (634 | 17.4%), German (573 | 15.8%), Mexican (191 | 5.2%), and Italian (152 | 4.2%), together accounting for 66.3% of all Lake California residents.
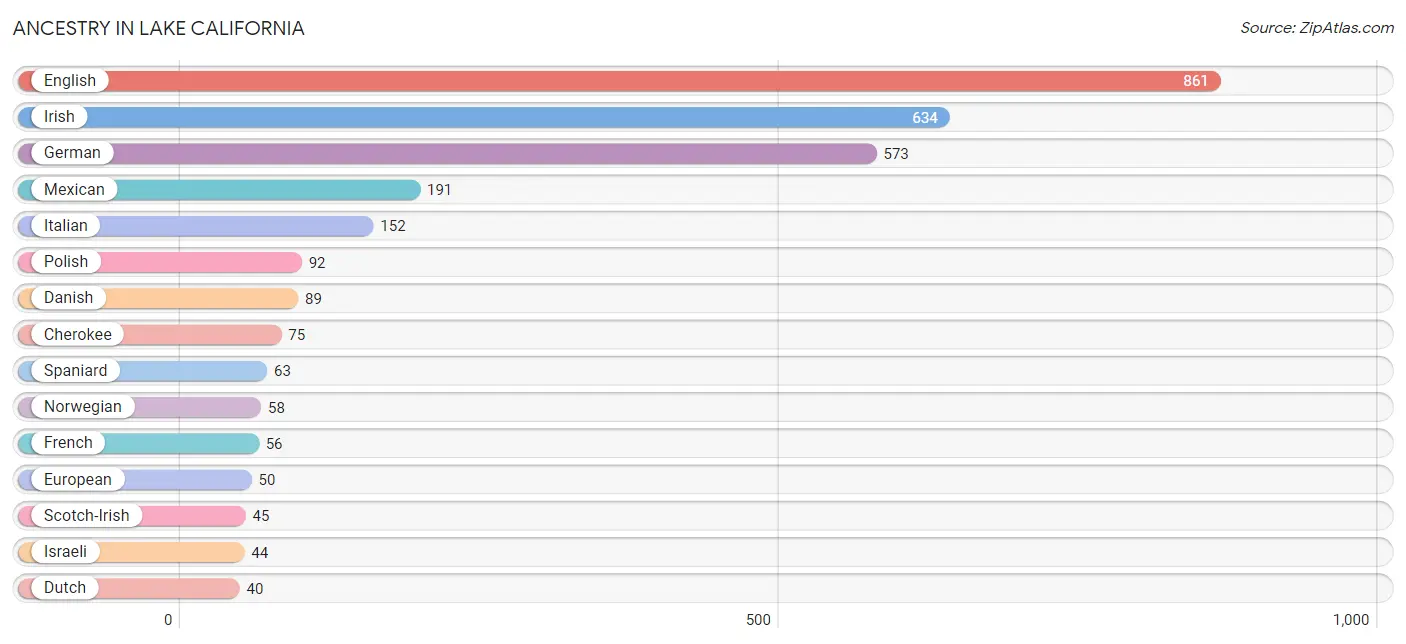
| Ancestry | # Population | % Population |
| Arab | 24 | 0.7% |
| Central American | 13 | 0.4% |
| Cherokee | 75 | 2.1% |
| Danish | 89 | 2.5% |
| Dutch | 40 | 1.1% |
| English | 861 | 23.7% |
| European | 50 | 1.4% |
| French | 56 | 1.5% |
| German | 573 | 15.8% |
| Hungarian | 28 | 0.8% |
| Irish | 634 | 17.4% |
| Israeli | 44 | 1.2% |
| Italian | 152 | 4.2% |
| Mexican | 191 | 5.2% |
| Nicaraguan | 13 | 0.4% |
| Norwegian | 58 | 1.6% |
| Paraguayan | 14 | 0.4% |
| Polish | 92 | 2.5% |
| Portuguese | 10 | 0.3% |
| Puerto Rican | 17 | 0.5% |
| Russian | 21 | 0.6% |
| Scotch-Irish | 45 | 1.2% |
| Scottish | 40 | 1.1% |
| Slavic | 40 | 1.1% |
| South American | 14 | 0.4% |
| Spaniard | 63 | 1.7% |
| Swiss | 23 | 0.6% |
| Welsh | 11 | 0.3% |
| Yugoslavian | 23 | 0.6% | View All 29 Rows |
Immigrants in Lake California
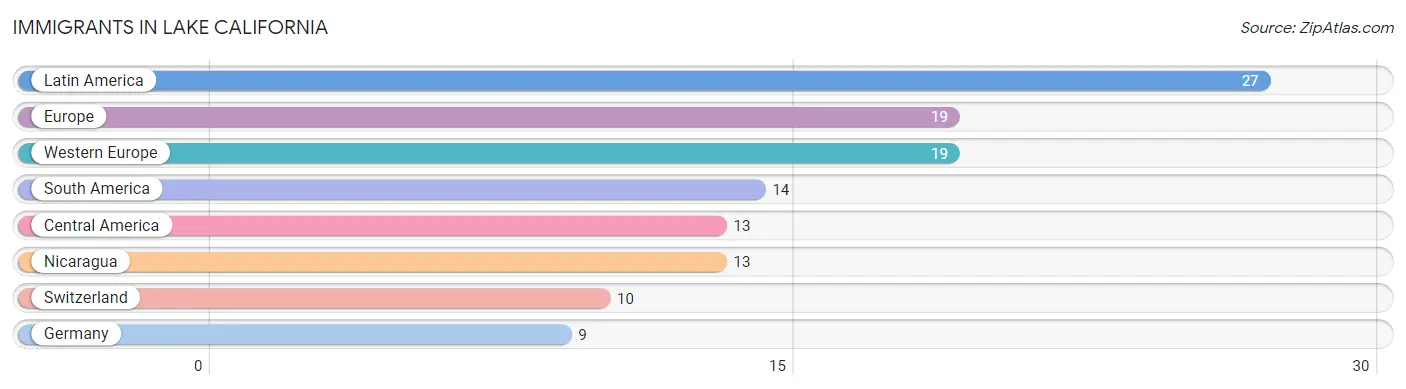
The most numerous immigrant groups reported in Lake California came from Latin America (27 | 0.7%), Europe (19 | 0.5%), Western Europe (19 | 0.5%), South America (14 | 0.4%), and Central America (13 | 0.4%), together accounting for 2.5% of all Lake California residents.
| Immigration Origin | # Population | % Population |
| Central America | 13 | 0.4% |
| Europe | 19 | 0.5% |
| Germany | 9 | 0.3% |
| Latin America | 27 | 0.7% |
| Nicaragua | 13 | 0.4% |
| South America | 14 | 0.4% |
| Switzerland | 10 | 0.3% |
| Western Europe | 19 | 0.5% | View All 8 Rows |
Sex and Age in Lake California
Sex and Age in Lake California
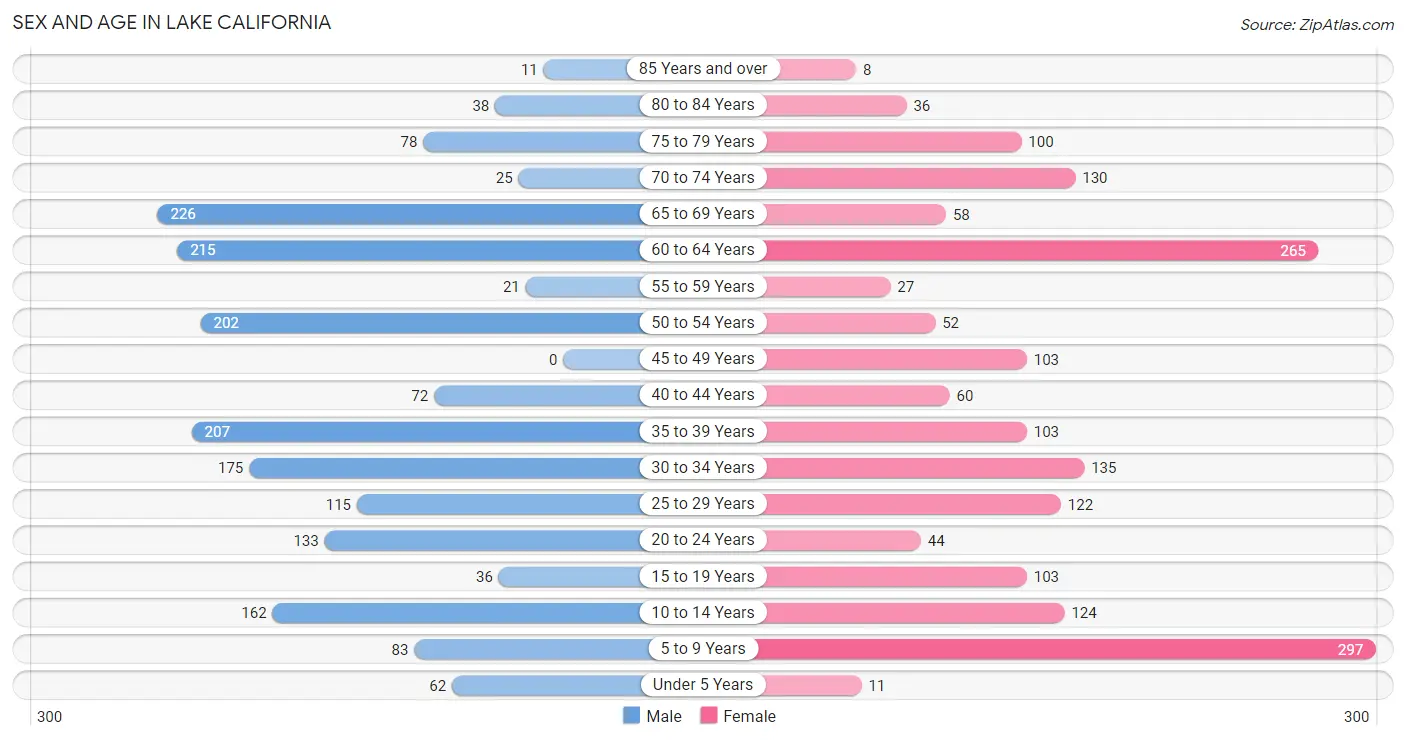
The most populous age groups in Lake California are 65 to 69 Years (226 | 12.1%) for men and 5 to 9 Years (297 | 16.7%) for women.
| Age Bracket | Male | Female |
| Under 5 Years | 62 (3.3%) | 11 (0.6%) |
| 5 to 9 Years | 83 (4.5%) | 297 (16.7%) |
| 10 to 14 Years | 162 (8.7%) | 124 (7.0%) |
| 15 to 19 Years | 36 (1.9%) | 103 (5.8%) |
| 20 to 24 Years | 133 (7.1%) | 44 (2.5%) |
| 25 to 29 Years | 115 (6.2%) | 122 (6.9%) |
| 30 to 34 Years | 175 (9.4%) | 135 (7.6%) |
| 35 to 39 Years | 207 (11.1%) | 103 (5.8%) |
| 40 to 44 Years | 72 (3.9%) | 60 (3.4%) |
| 45 to 49 Years | 0 (0.0%) | 103 (5.8%) |
| 50 to 54 Years | 202 (10.8%) | 52 (2.9%) |
| 55 to 59 Years | 21 (1.1%) | 27 (1.5%) |
| 60 to 64 Years | 215 (11.6%) | 265 (14.9%) |
| 65 to 69 Years | 226 (12.1%) | 58 (3.3%) |
| 70 to 74 Years | 25 (1.3%) | 130 (7.3%) |
| 75 to 79 Years | 78 (4.2%) | 100 (5.6%) |
| 80 to 84 Years | 38 (2.0%) | 36 (2.0%) |
| 85 Years and over | 11 (0.6%) | 8 (0.4%) |
| Total | 1,861 (100.0%) | 1,778 (100.0%) |
Families and Households in Lake California
Median Family Size in Lake California
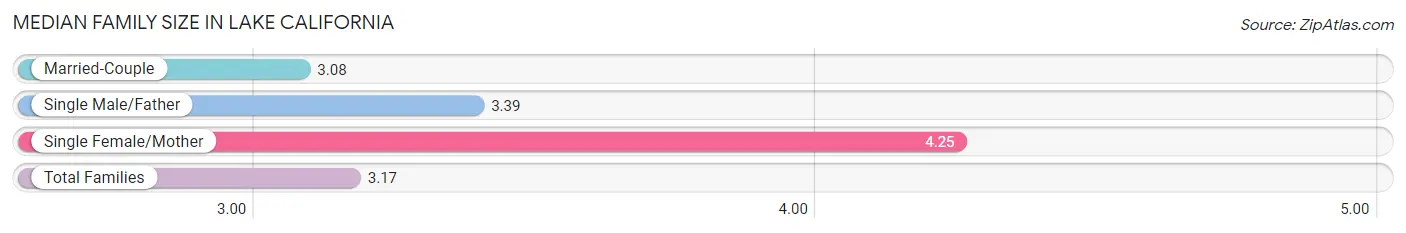
The median family size in Lake California is 3.17 persons per family, with single female/mother families (57 | 6.0%) accounting for the largest median family size of 4.25 persons per family. On the other hand, married-couple families (834 | 88.2%) represent the smallest median family size with 3.08 persons per family.
| Family Type | # Families | Family Size |
| Married-Couple | 834 (88.2%) | 3.08 |
| Single Male/Father | 54 (5.7%) | 3.39 |
| Single Female/Mother | 57 (6.0%) | 4.25 |
| Total Families | 945 (100.0%) | 3.17 |
Median Household Size in Lake California
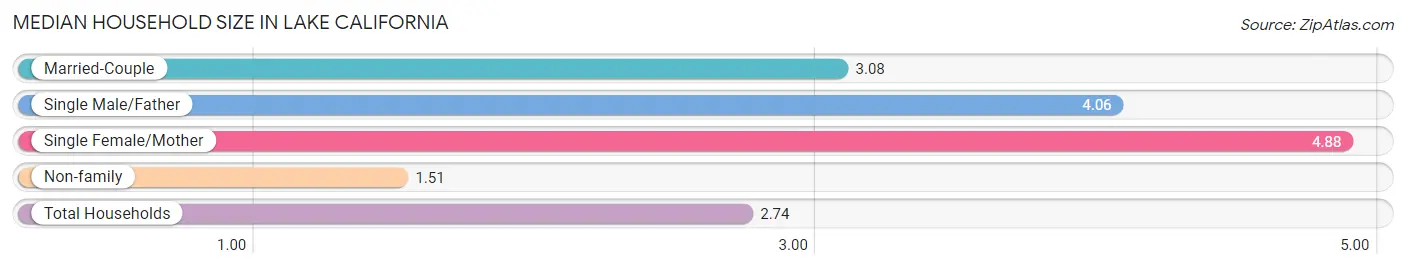
The median household size in Lake California is 2.74 persons per household, with single female/mother households (57 | 4.3%) accounting for the largest median household size of 4.88 persons per household. non-family households (380 | 28.7%) represent the smallest median household size with 1.51 persons per household.
| Household Type | # Households | Household Size |
| Married-Couple | 834 (62.9%) | 3.08 |
| Single Male/Father | 54 (4.1%) | 4.06 |
| Single Female/Mother | 57 (4.3%) | 4.88 |
| Non-family | 380 (28.7%) | 1.51 |
| Total Households | 1,325 (100.0%) | 2.74 |
Household Size by Marriage Status in Lake California
Out of a total of 1,325 households in Lake California, 945 (71.3%) are family households, while 380 (28.7%) are nonfamily households. The most numerous type of family households are 2-person households, comprising 404, and the most common type of nonfamily households are 1-person households, comprising 302.
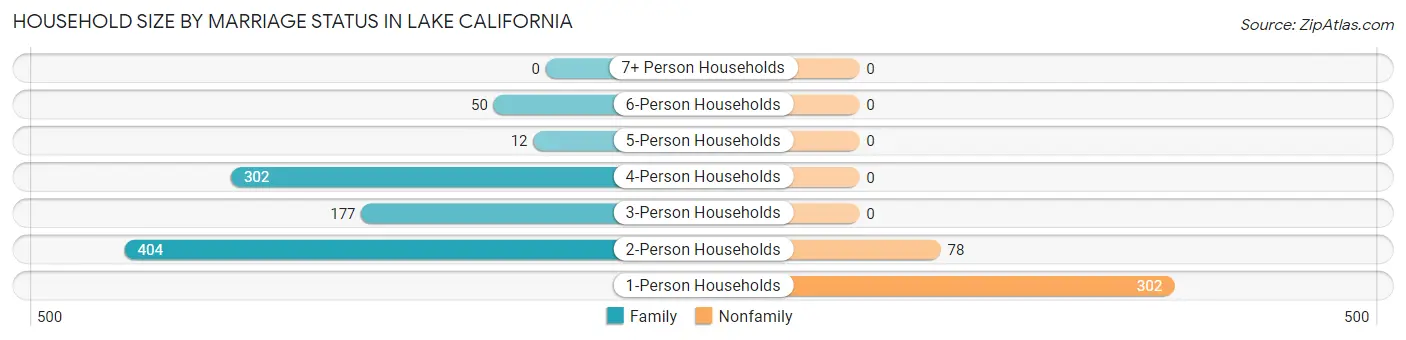
| Household Size | Family Households | Nonfamily Households |
| 1-Person Households | - | 302 (22.8%) |
| 2-Person Households | 404 (30.5%) | 78 (5.9%) |
| 3-Person Households | 177 (13.4%) | 0 (0.0%) |
| 4-Person Households | 302 (22.8%) | 0 (0.0%) |
| 5-Person Households | 12 (0.9%) | 0 (0.0%) |
| 6-Person Households | 50 (3.8%) | 0 (0.0%) |
| 7+ Person Households | 0 (0.0%) | 0 (0.0%) |
| Total | 945 (71.3%) | 380 (28.7%) |
Female Fertility in Lake California
Fertility by Age in Lake California
Average fertility rate in Lake California is 101.0 births per 1,000 women. Women in the age bracket of 20 to 34 years have the highest fertility rate with 233.0 births per 1,000 women. Women in the age bracket of 20 to 34 years acount for 100.0% of all women with births.
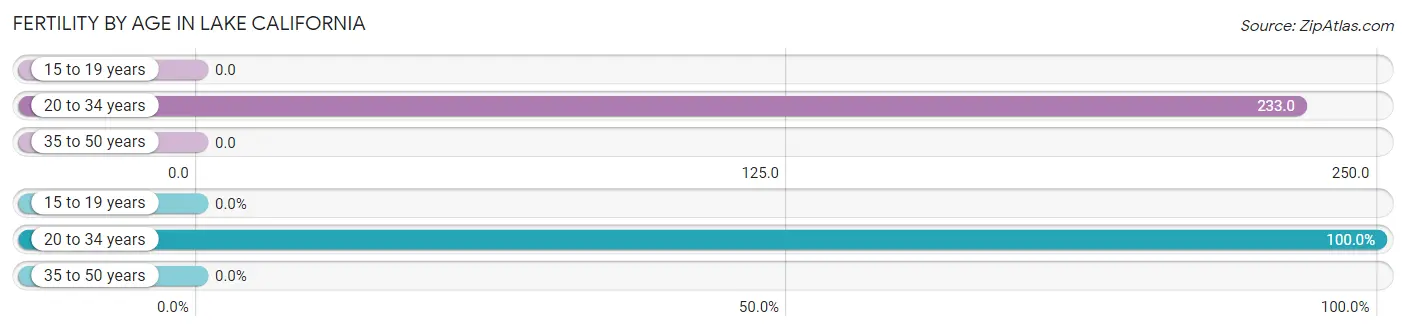
| Age Bracket | Women with Births | Births / 1,000 Women |
| 15 to 19 years | 0 (0.0%) | 0.0 |
| 20 to 34 years | 70 (100.0%) | 233.0 |
| 35 to 50 years | 0 (0.0%) | 0.0 |
| Total | 70 (100.0%) | 101.0 |
Fertility by Age by Marriage Status in Lake California
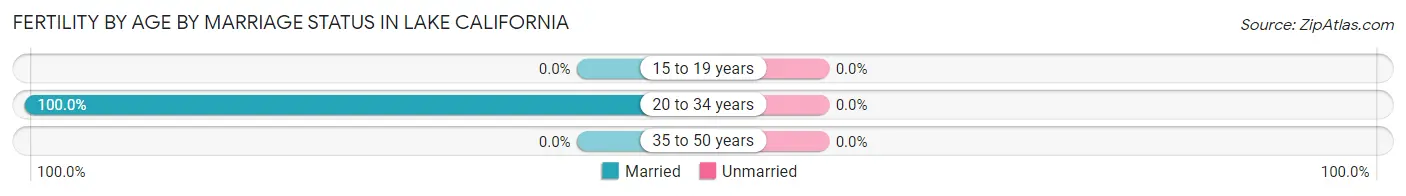
| Age Bracket | Married | Unmarried |
| 15 to 19 years | 0 (0.0%) | 0 (0.0%) |
| 20 to 34 years | 70 (100.0%) | 0 (0.0%) |
| 35 to 50 years | 0 (0.0%) | 0 (0.0%) |
| Total | 70 (100.0%) | 0 (0.0%) |
Fertility by Education in Lake California
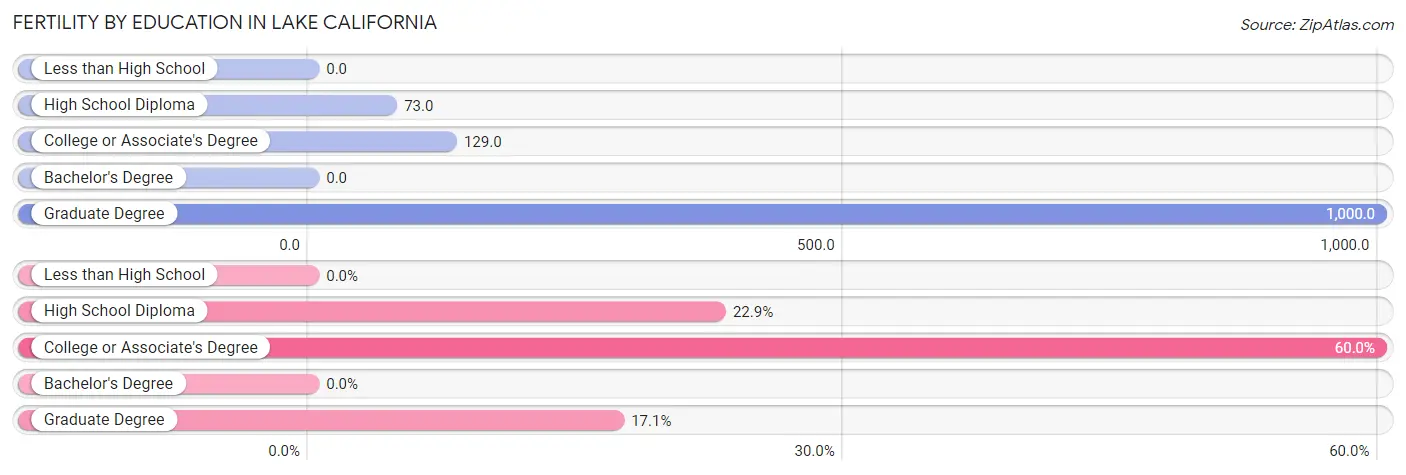
| Educational Attainment | Women with Births | Births / 1,000 Women |
| Less than High School | 0 (0.0%) | 0.0 |
| High School Diploma | 16 (22.9%) | 73.0 |
| College or Associate's Degree | 42 (60.0%) | 129.0 |
| Bachelor's Degree | 0 (0.0%) | 0.0 |
| Graduate Degree | 12 (17.1%) | 1,000.0 |
| Total | 70 (100.0%) | 101.0 |
Fertility by Education by Marriage Status in Lake California
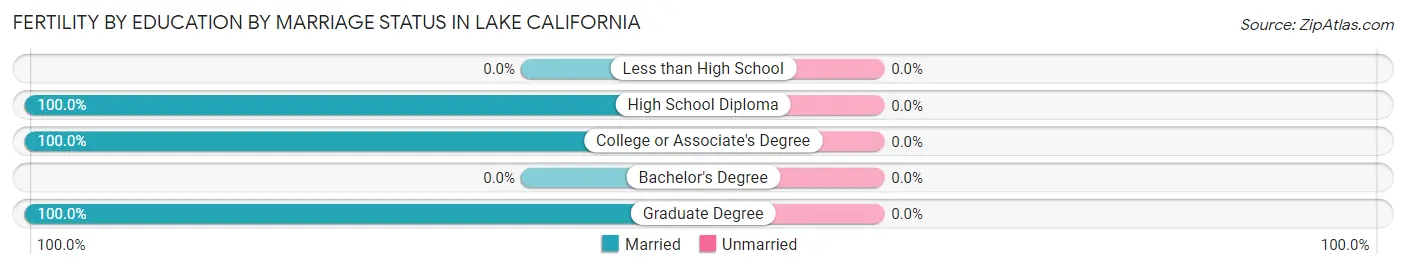
| Educational Attainment | Married | Unmarried |
| Less than High School | 0 (0.0%) | 0 (0.0%) |
| High School Diploma | 16 (100.0%) | 0 (0.0%) |
| College or Associate's Degree | 42 (100.0%) | 0 (0.0%) |
| Bachelor's Degree | 0 (0.0%) | 0 (0.0%) |
| Graduate Degree | 12 (100.0%) | 0 (0.0%) |
| Total | 70 (100.0%) | 0 (0.0%) |
Employment Characteristics in Lake California
Employment by Class of Employer in Lake California
Among the 1,500 employed individuals in Lake California, private company employees (831 | 55.4%), local government employees (419 | 27.9%), and state government employees (139 | 9.3%) make up the most common classes of employment.
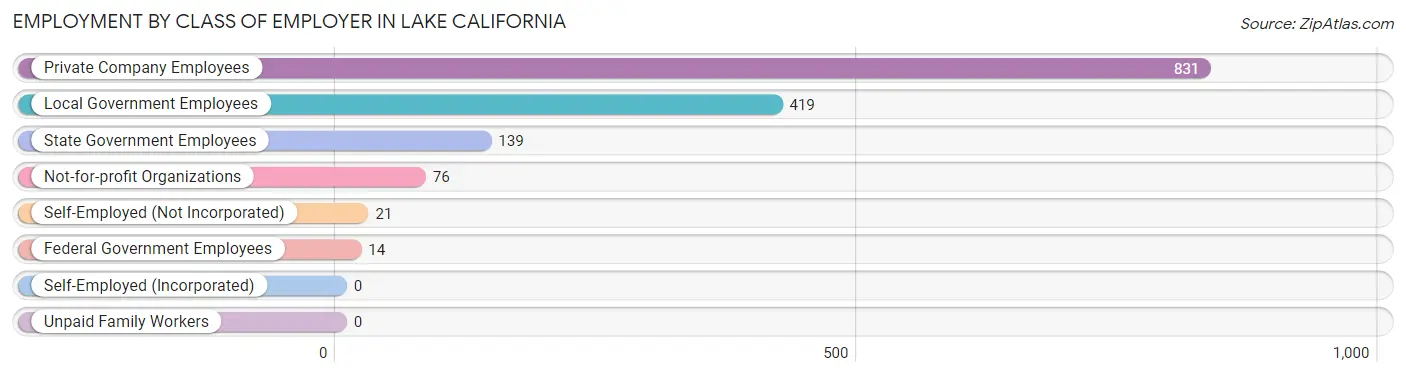
| Employer Class | # Employees | % Employees |
| Private Company Employees | 831 | 55.4% |
| Self-Employed (Incorporated) | 0 | 0.0% |
| Self-Employed (Not Incorporated) | 21 | 1.4% |
| Not-for-profit Organizations | 76 | 5.1% |
| Local Government Employees | 419 | 27.9% |
| State Government Employees | 139 | 9.3% |
| Federal Government Employees | 14 | 0.9% |
| Unpaid Family Workers | 0 | 0.0% |
| Total | 1,500 | 100.0% |
Employment Status by Age in Lake California
According to the labor force statistics for Lake California, out of the total population over 16 years of age (2,882), 56.7% or 1,634 individuals are in the labor force, with 6.6% or 108 of them unemployed. The age group with the highest labor force participation rate is 20 to 24 years, with 100.0% or 177 individuals in the labor force. Within the labor force, the 65 to 74 years age range has the highest percentage of unemployed individuals, with 20.7% or 12 of them being unemployed.
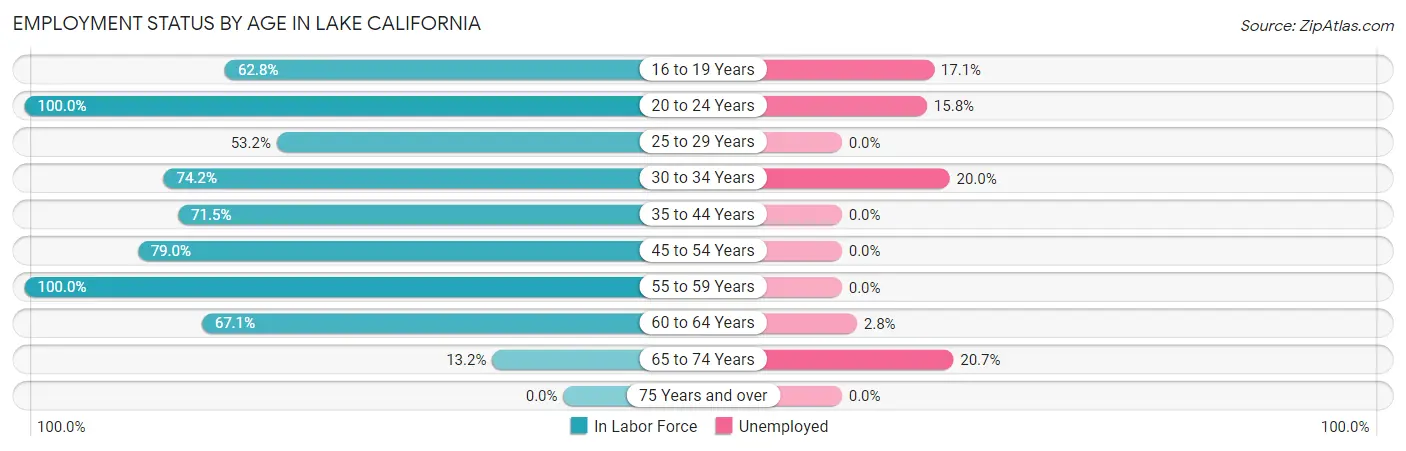
| Age Bracket | In Labor Force | Unemployed |
| 16 to 19 Years | 76 (62.8%) | 13 (17.1%) |
| 20 to 24 Years | 177 (100.0%) | 28 (15.8%) |
| 25 to 29 Years | 126 (53.2%) | 0 (0.0%) |
| 30 to 34 Years | 230 (74.2%) | 46 (20.0%) |
| 35 to 44 Years | 316 (71.5%) | 0 (0.0%) |
| 45 to 54 Years | 282 (79.0%) | 0 (0.0%) |
| 55 to 59 Years | 48 (100.0%) | 0 (0.0%) |
| 60 to 64 Years | 322 (67.1%) | 9 (2.8%) |
| 65 to 74 Years | 58 (13.2%) | 12 (20.7%) |
| 75 Years and over | 0 (0.0%) | 0 (0.0%) |
| Total | 1,634 (56.7%) | 108 (6.6%) |
Employment Status by Educational Attainment in Lake California
According to labor force statistics for Lake California, 70.7% of individuals (1,325) out of the total population between 25 and 64 years of age (1,874) are in the labor force, with 4.2% or 56 of them being unemployed. The group with the highest labor force participation rate are those with the educational attainment of bachelor's degree or higher, with 89.2% or 370 individuals in the labor force. Within the labor force, individuals with college / associate degree education have the highest percentage of unemployment, with 11.0% or 55 of them being unemployed.
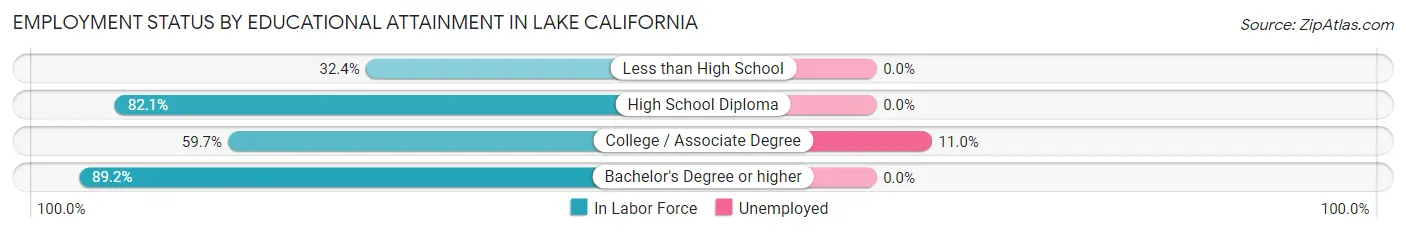
| Educational Attainment | In Labor Force | Unemployed |
| Less than High School | 36 (32.4%) | 0 (0.0%) |
| High School Diploma | 416 (82.1%) | 0 (0.0%) |
| College / Associate Degree | 502 (59.7%) | 93 (11.0%) |
| Bachelor's Degree or higher | 370 (89.2%) | 0 (0.0%) |
| Total | 1,325 (70.7%) | 79 (4.2%) |
Employment Occupations by Sex in Lake California
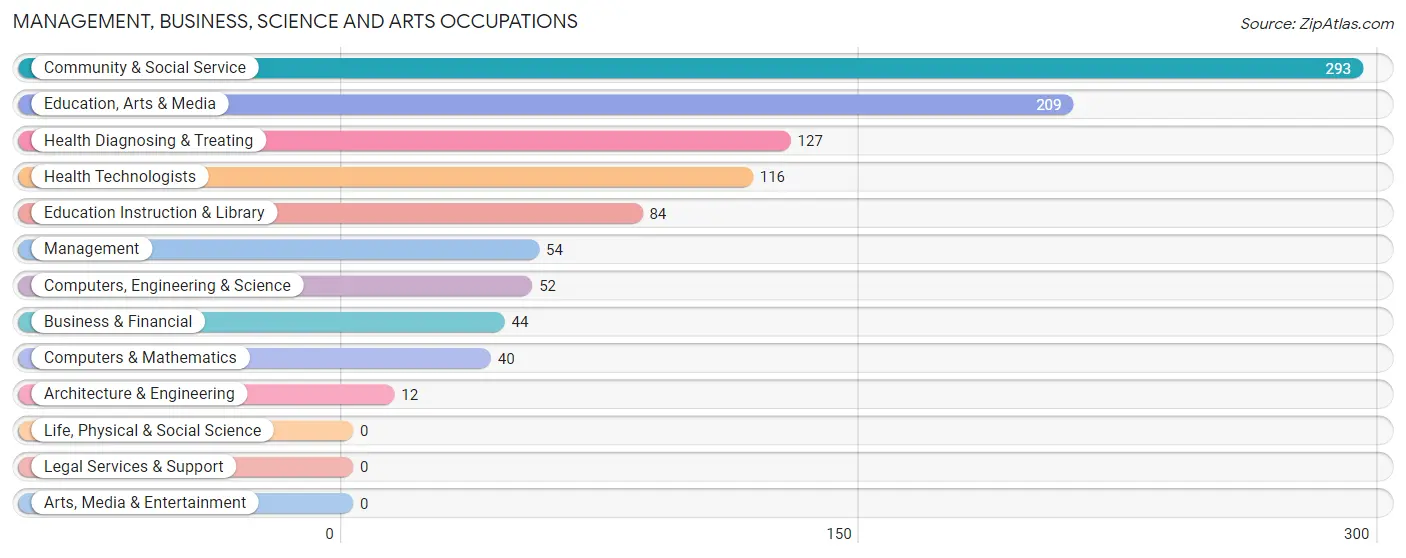
Management, Business, Science and Arts Occupations
The most common Management, Business, Science and Arts occupations in Lake California are Community & Social Service (293 | 19.2%), Education, Arts & Media (209 | 13.7%), Health Diagnosing & Treating (127 | 8.3%), Health Technologists (116 | 7.6%), and Education Instruction & Library (84 | 5.5%).
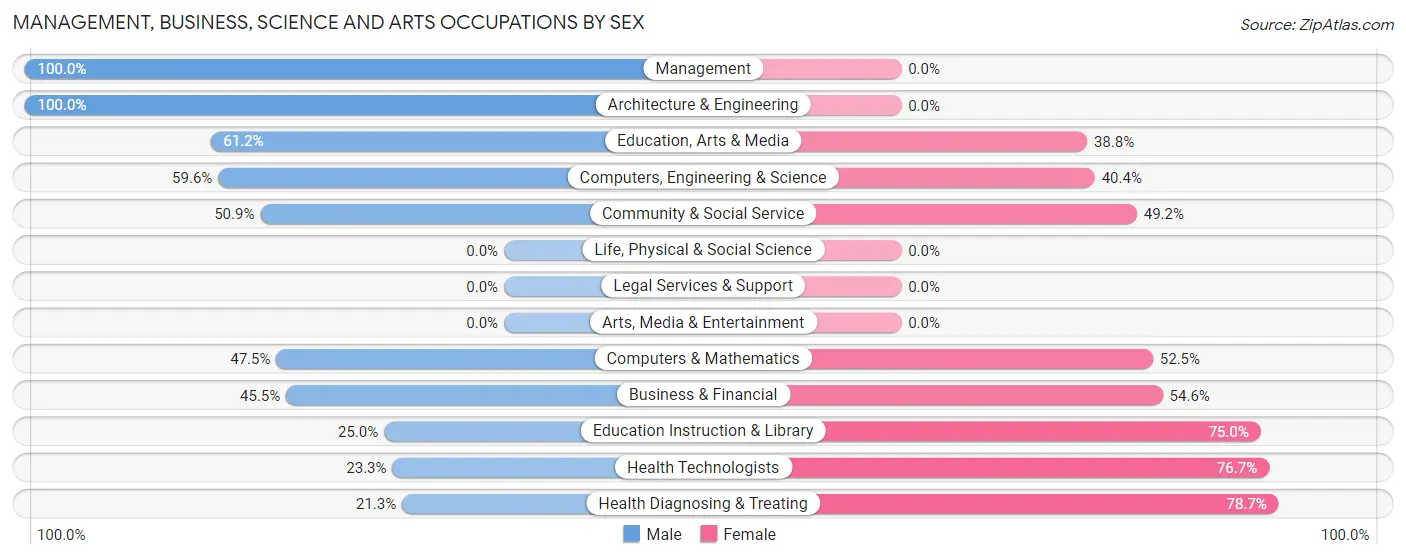
Management, Business, Science and Arts Occupations by Sex
Within the Management, Business, Science and Arts occupations in Lake California, the most male-oriented occupations are Management (100.0%), Architecture & Engineering (100.0%), and Education, Arts & Media (61.2%), while the most female-oriented occupations are Health Diagnosing & Treating (78.7%), Health Technologists (76.7%), and Education Instruction & Library (75.0%).
| Occupation | Male | Female |
| Management | 54 (100.0%) | 0 (0.0%) |
| Business & Financial | 20 (45.5%) | 24 (54.5%) |
| Computers, Engineering & Science | 31 (59.6%) | 21 (40.4%) |
| Computers & Mathematics | 19 (47.5%) | 21 (52.5%) |
| Architecture & Engineering | 12 (100.0%) | 0 (0.0%) |
| Life, Physical & Social Science | 0 (0.0%) | 0 (0.0%) |
| Community & Social Service | 149 (50.8%) | 144 (49.1%) |
| Education, Arts & Media | 128 (61.2%) | 81 (38.8%) |
| Legal Services & Support | 0 (0.0%) | 0 (0.0%) |
| Education Instruction & Library | 21 (25.0%) | 63 (75.0%) |
| Arts, Media & Entertainment | 0 (0.0%) | 0 (0.0%) |
| Health Diagnosing & Treating | 27 (21.3%) | 100 (78.7%) |
| Health Technologists | 27 (23.3%) | 89 (76.7%) |
| Total (Category) | 281 (49.3%) | 289 (50.7%) |
| Total (Overall) | 939 (61.5%) | 588 (38.5%) |
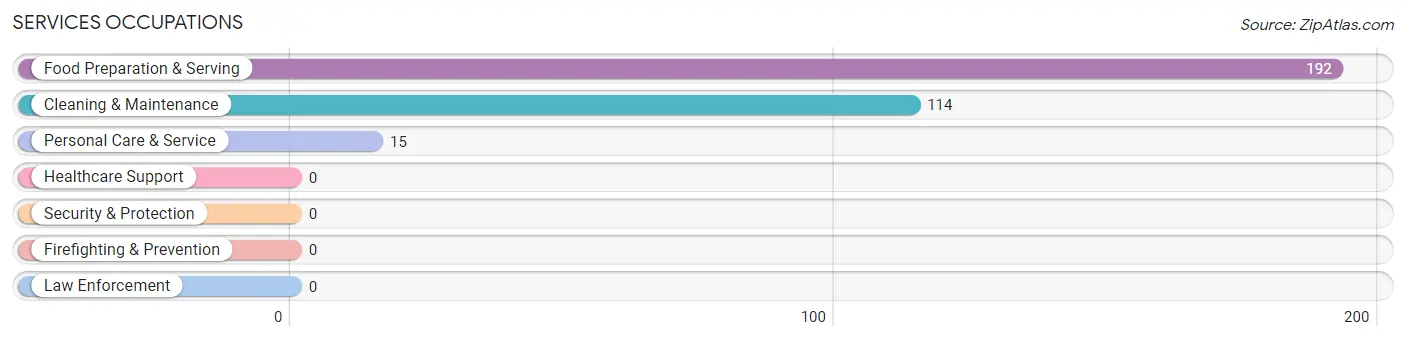
Services Occupations
The most common Services occupations in Lake California are Food Preparation & Serving (192 | 12.6%), Cleaning & Maintenance (114 | 7.5%), and Personal Care & Service (15 | 1.0%).
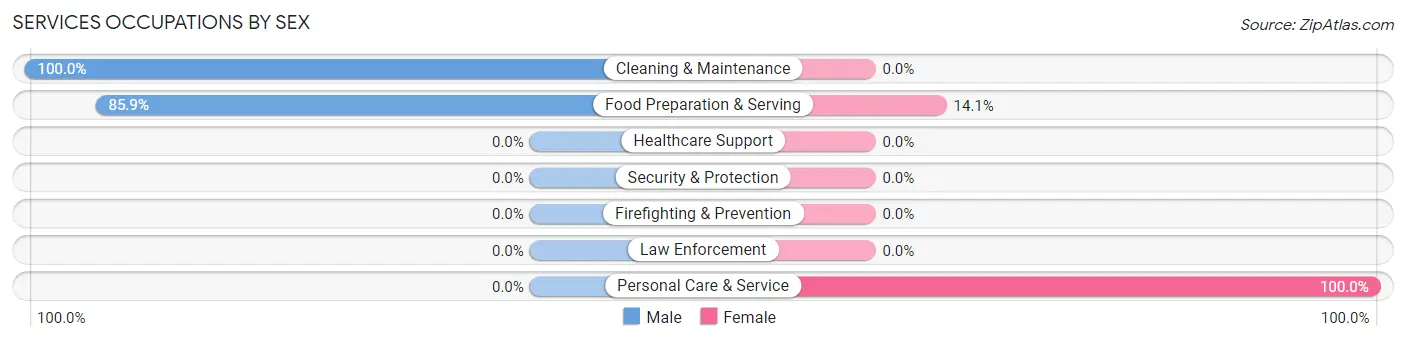
Services Occupations by Sex
Within the Services occupations in Lake California, the most male-oriented occupations are Cleaning & Maintenance (100.0%), and Food Preparation & Serving (85.9%), while the most female-oriented occupations are Personal Care & Service (100.0%), and Food Preparation & Serving (14.1%).
| Occupation | Male | Female |
| Healthcare Support | 0 (0.0%) | 0 (0.0%) |
| Security & Protection | 0 (0.0%) | 0 (0.0%) |
| Firefighting & Prevention | 0 (0.0%) | 0 (0.0%) |
| Law Enforcement | 0 (0.0%) | 0 (0.0%) |
| Food Preparation & Serving | 165 (85.9%) | 27 (14.1%) |
| Cleaning & Maintenance | 114 (100.0%) | 0 (0.0%) |
| Personal Care & Service | 0 (0.0%) | 15 (100.0%) |
| Total (Category) | 279 (86.9%) | 42 (13.1%) |
| Total (Overall) | 939 (61.5%) | 588 (38.5%) |
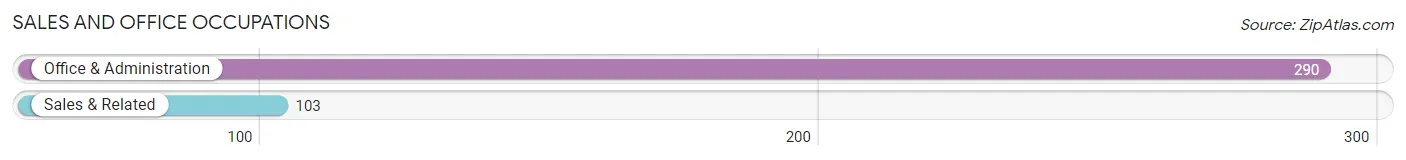
Sales and Office Occupations
The most common Sales and Office occupations in Lake California are Office & Administration (290 | 19.0%), and Sales & Related (103 | 6.8%).
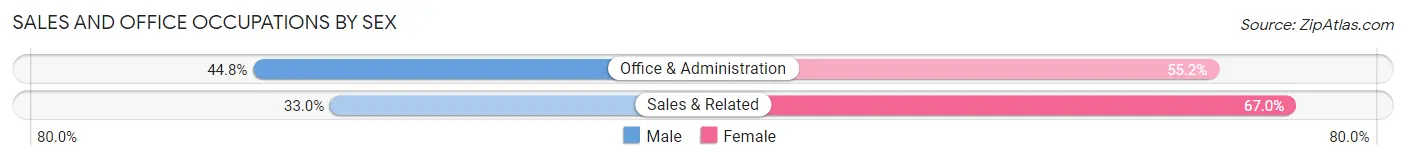
Sales and Office Occupations by Sex
| Occupation | Male | Female |
| Sales & Related | 34 (33.0%) | 69 (67.0%) |
| Office & Administration | 130 (44.8%) | 160 (55.2%) |
| Total (Category) | 164 (41.7%) | 229 (58.3%) |
| Total (Overall) | 939 (61.5%) | 588 (38.5%) |
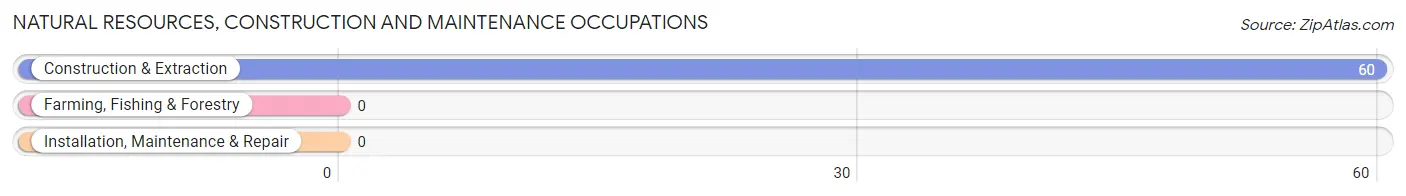
Natural Resources, Construction and Maintenance Occupations
The most common Natural Resources, Construction and Maintenance occupations in Lake California are , and Construction & Extraction (60 | 3.9%).
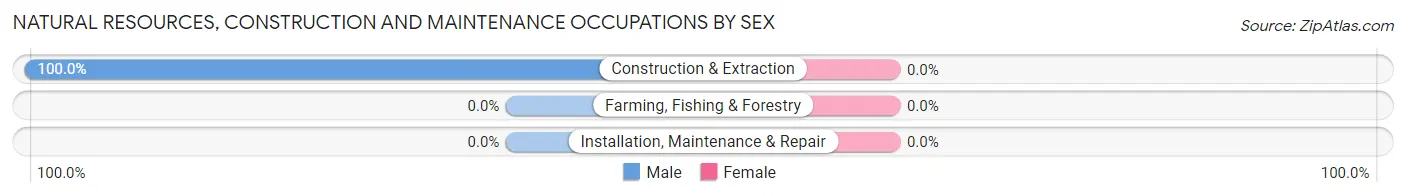
Natural Resources, Construction and Maintenance Occupations by Sex
| Occupation | Male | Female |
| Farming, Fishing & Forestry | 0 (0.0%) | 0 (0.0%) |
| Construction & Extraction | 60 (100.0%) | 0 (0.0%) |
| Installation, Maintenance & Repair | 0 (0.0%) | 0 (0.0%) |
| Total (Category) | 60 (100.0%) | 0 (0.0%) |
| Total (Overall) | 939 (61.5%) | 588 (38.5%) |
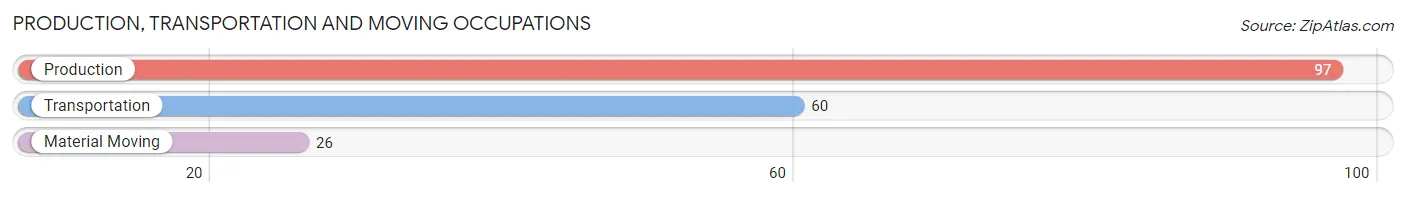
Production, Transportation and Moving Occupations
The most common Production, Transportation and Moving occupations in Lake California are Production (97 | 6.4%), Transportation (60 | 3.9%), and Material Moving (26 | 1.7%).
Production, Transportation and Moving Occupations by Sex
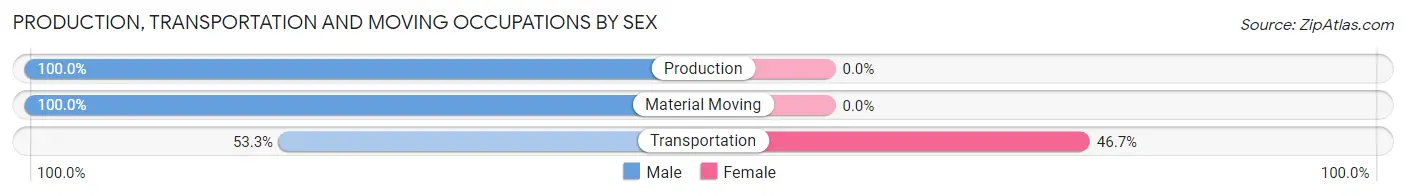
| Occupation | Male | Female |
| Production | 97 (100.0%) | 0 (0.0%) |
| Transportation | 32 (53.3%) | 28 (46.7%) |
| Material Moving | 26 (100.0%) | 0 (0.0%) |
| Total (Category) | 155 (84.7%) | 28 (15.3%) |
| Total (Overall) | 939 (61.5%) | 588 (38.5%) |
Employment Industries by Sex in Lake California
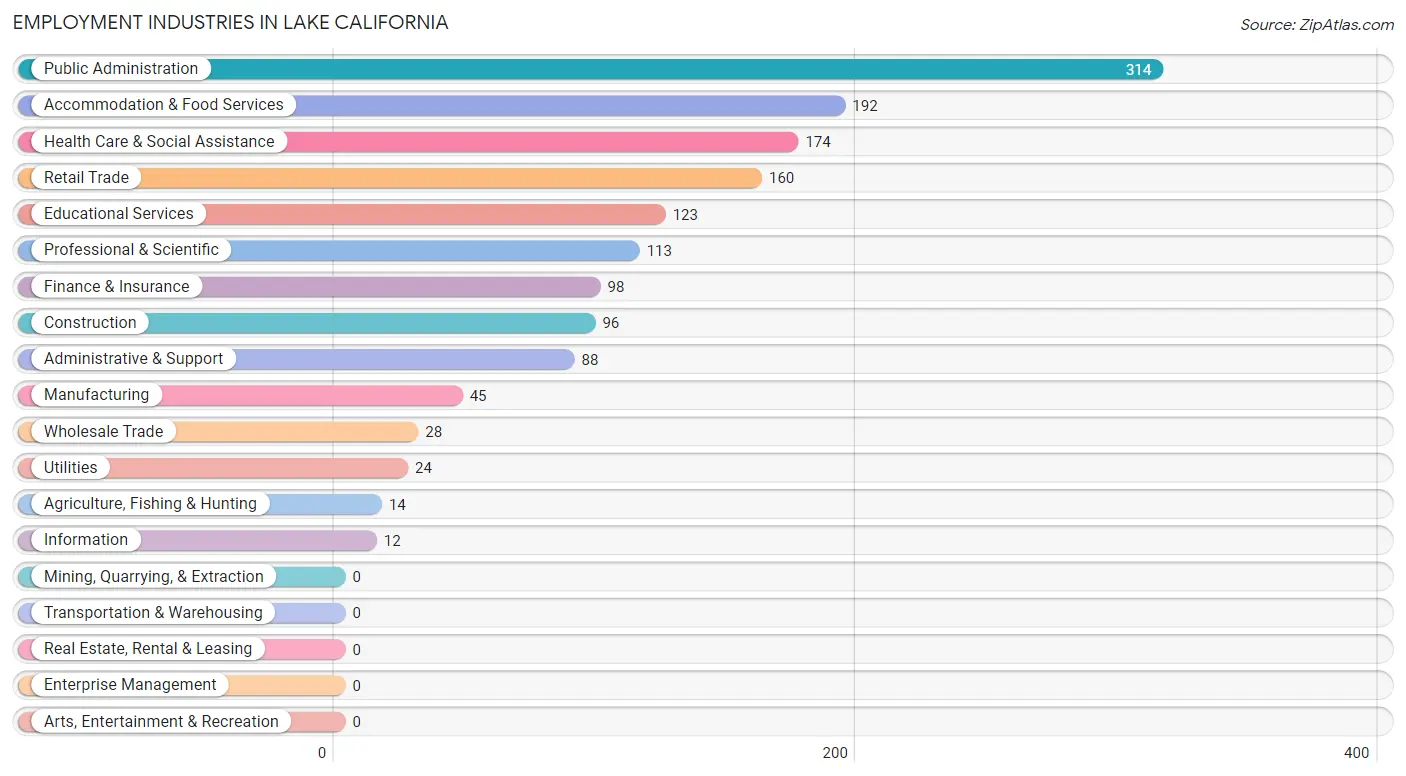
Employment Industries in Lake California
The major employment industries in Lake California include Public Administration (314 | 20.6%), Accommodation & Food Services (192 | 12.6%), Health Care & Social Assistance (174 | 11.4%), Retail Trade (160 | 10.5%), and Educational Services (123 | 8.1%).
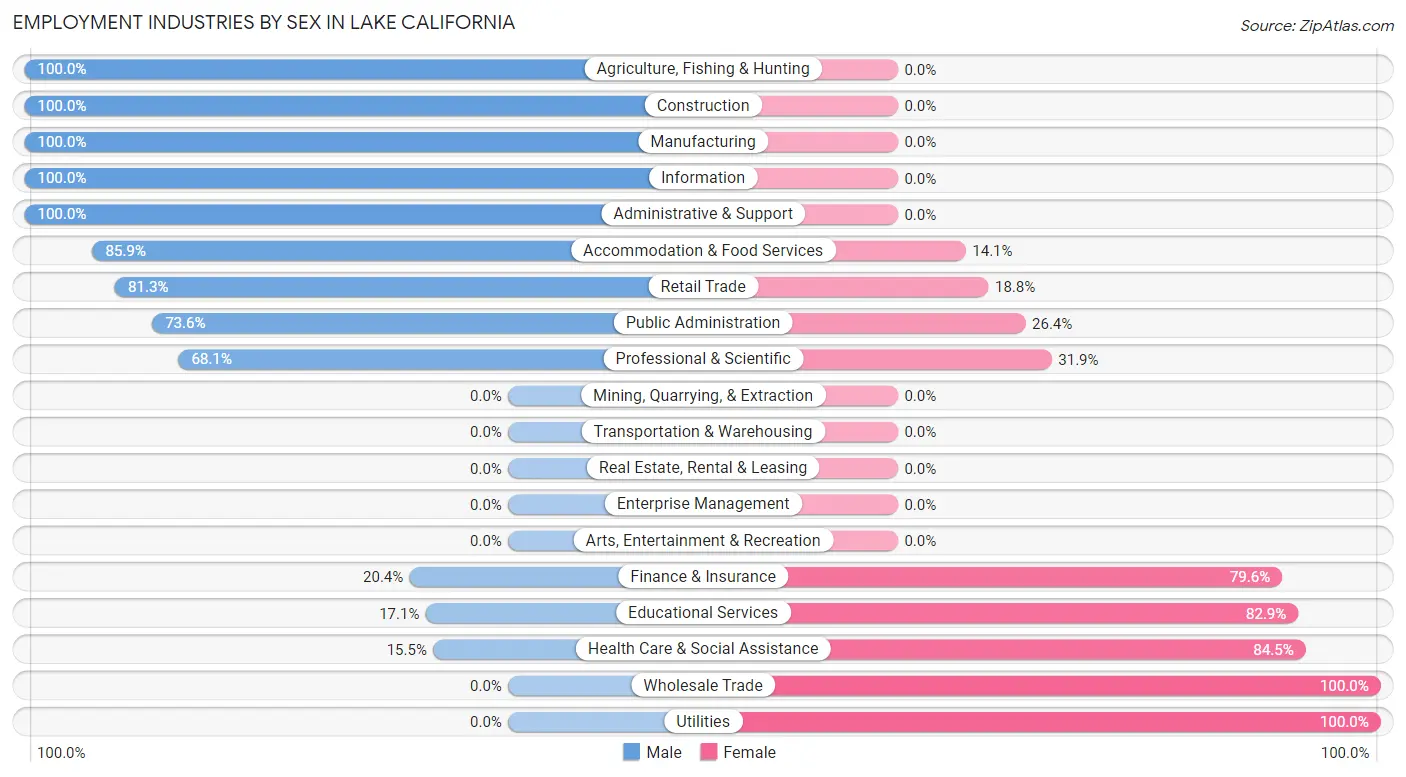
Employment Industries by Sex in Lake California
The Lake California industries that see more men than women are Agriculture, Fishing & Hunting (100.0%), Construction (100.0%), and Manufacturing (100.0%), whereas the industries that tend to have a higher number of women are Wholesale Trade (100.0%), Utilities (100.0%), and Health Care & Social Assistance (84.5%).
| Industry | Male | Female |
| Agriculture, Fishing & Hunting | 14 (100.0%) | 0 (0.0%) |
| Mining, Quarrying, & Extraction | 0 (0.0%) | 0 (0.0%) |
| Construction | 96 (100.0%) | 0 (0.0%) |
| Manufacturing | 45 (100.0%) | 0 (0.0%) |
| Wholesale Trade | 0 (0.0%) | 28 (100.0%) |
| Retail Trade | 130 (81.2%) | 30 (18.8%) |
| Transportation & Warehousing | 0 (0.0%) | 0 (0.0%) |
| Utilities | 0 (0.0%) | 24 (100.0%) |
| Information | 12 (100.0%) | 0 (0.0%) |
| Finance & Insurance | 20 (20.4%) | 78 (79.6%) |
| Real Estate, Rental & Leasing | 0 (0.0%) | 0 (0.0%) |
| Professional & Scientific | 77 (68.1%) | 36 (31.9%) |
| Enterprise Management | 0 (0.0%) | 0 (0.0%) |
| Administrative & Support | 88 (100.0%) | 0 (0.0%) |
| Educational Services | 21 (17.1%) | 102 (82.9%) |
| Health Care & Social Assistance | 27 (15.5%) | 147 (84.5%) |
| Arts, Entertainment & Recreation | 0 (0.0%) | 0 (0.0%) |
| Accommodation & Food Services | 165 (85.9%) | 27 (14.1%) |
| Public Administration | 231 (73.6%) | 83 (26.4%) |
| Total | 939 (61.5%) | 588 (38.5%) |
Education in Lake California
School Enrollment in Lake California
The most common levels of schooling among the 1,036 students in Lake California are elementary school (315 | 30.4%), college / undergraduate (307 | 29.6%), and high school (179 | 17.3%).
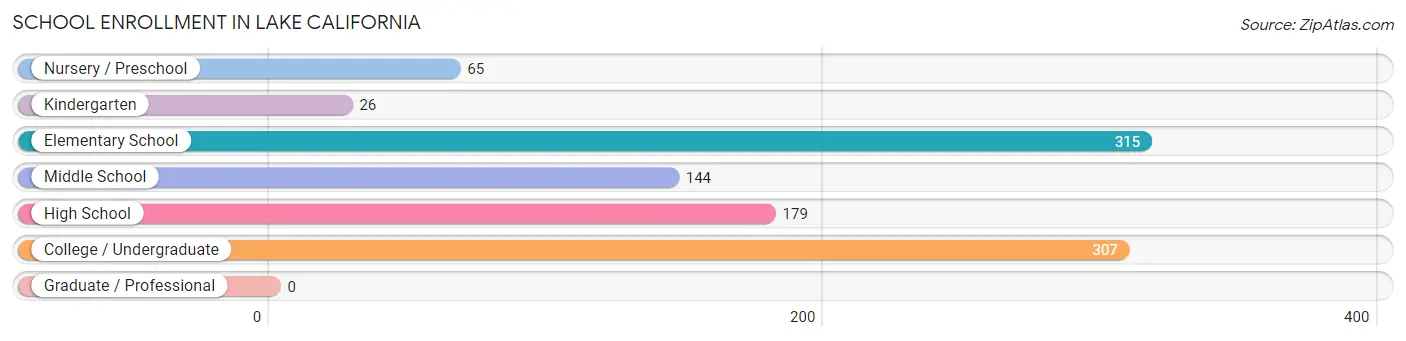
| School Level | # Students | % Students |
| Nursery / Preschool | 65 | 6.3% |
| Kindergarten | 26 | 2.5% |
| Elementary School | 315 | 30.4% |
| Middle School | 144 | 13.9% |
| High School | 179 | 17.3% |
| College / Undergraduate | 307 | 29.6% |
| Graduate / Professional | 0 | 0.0% |
| Total | 1,036 | 100.0% |
School Enrollment by Age by Funding Source in Lake California
Out of a total of 1,036 students who are enrolled in schools in Lake California, 198 (19.1%) attend a private institution, while the remaining 838 (80.9%) are enrolled in public schools. The age group of 20 to 24 year olds has the highest likelihood of being enrolled in private schools, with 115 (100.0% in the age bracket) enrolled. Conversely, the age group of 10 to 14 year olds has the lowest likelihood of being enrolled in a private school, with 286 (100.0% in the age bracket) attending a public institution.
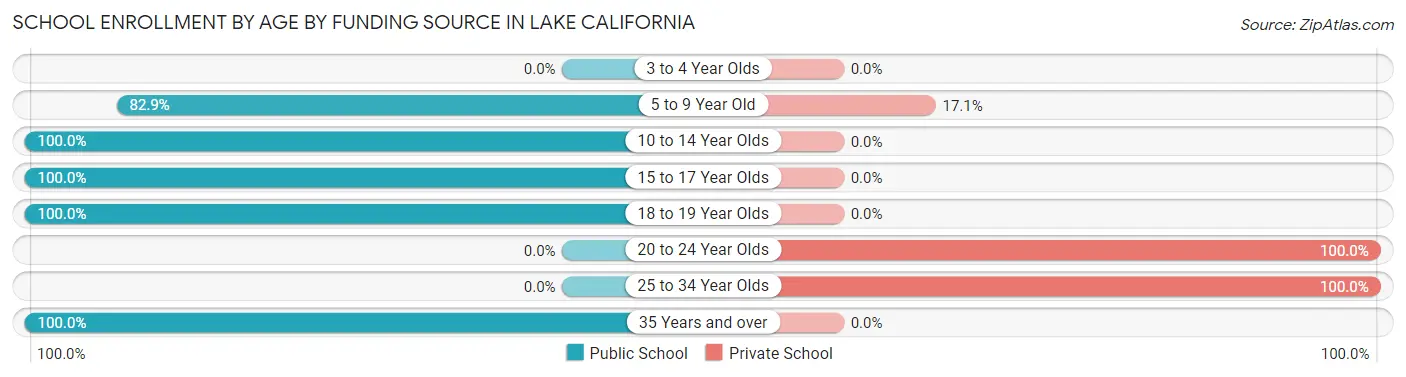
| Age Bracket | Public School | Private School |
| 3 to 4 Year Olds | 0 (0.0%) | 0 (0.0%) |
| 5 to 9 Year Old | 315 (82.9%) | 65 (17.1%) |
| 10 to 14 Year Olds | 286 (100.0%) | 0 (0.0%) |
| 15 to 17 Year Olds | 63 (100.0%) | 0 (0.0%) |
| 18 to 19 Year Olds | 76 (100.0%) | 0 (0.0%) |
| 20 to 24 Year Olds | 0 (0.0%) | 115 (100.0%) |
| 25 to 34 Year Olds | 0 (0.0%) | 18 (100.0%) |
| 35 Years and over | 98 (100.0%) | 0 (0.0%) |
| Total | 838 (80.9%) | 198 (19.1%) |
Educational Attainment by Field of Study in Lake California
Literature & languages (197 | 28.1%), liberal arts & history (156 | 22.3%), business (94 | 13.4%), psychology (69 | 9.8%), and science & technology (59 | 8.4%) are the most common fields of study among 701 individuals in Lake California who have obtained a bachelor's degree or higher.
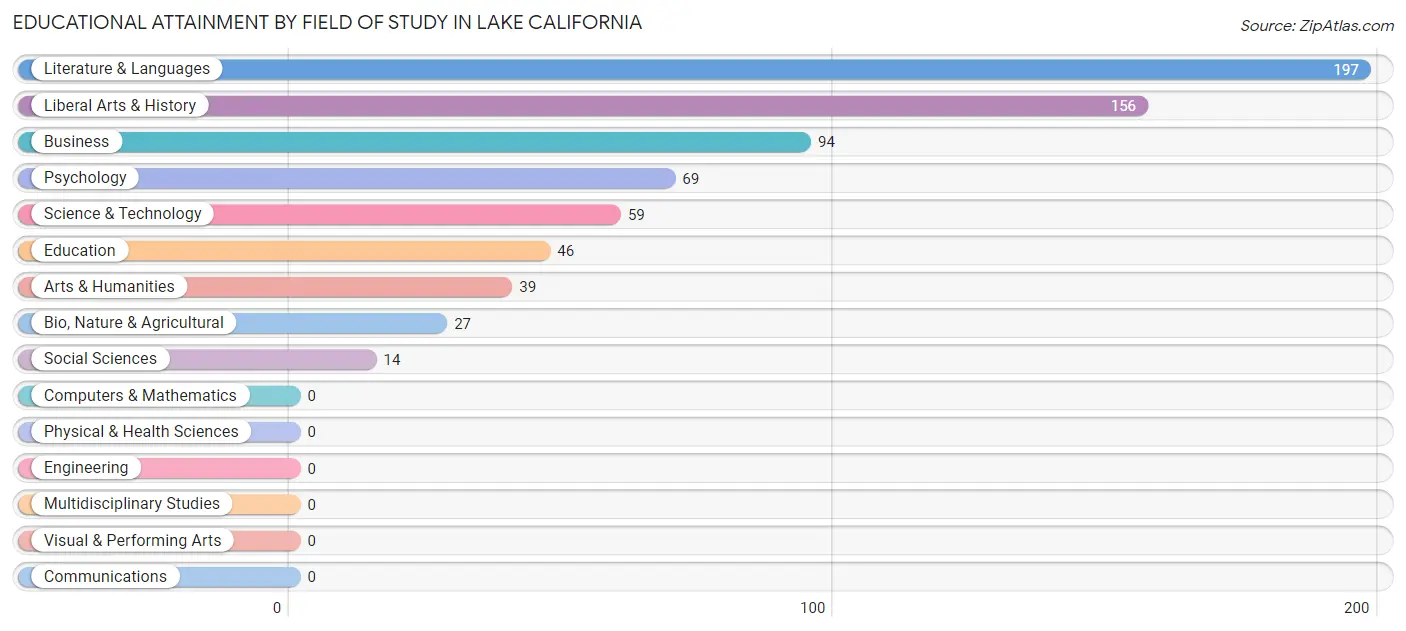
| Field of Study | # Graduates | % Graduates |
| Computers & Mathematics | 0 | 0.0% |
| Bio, Nature & Agricultural | 27 | 3.8% |
| Physical & Health Sciences | 0 | 0.0% |
| Psychology | 69 | 9.8% |
| Social Sciences | 14 | 2.0% |
| Engineering | 0 | 0.0% |
| Multidisciplinary Studies | 0 | 0.0% |
| Science & Technology | 59 | 8.4% |
| Business | 94 | 13.4% |
| Education | 46 | 6.6% |
| Literature & Languages | 197 | 28.1% |
| Liberal Arts & History | 156 | 22.3% |
| Visual & Performing Arts | 0 | 0.0% |
| Communications | 0 | 0.0% |
| Arts & Humanities | 39 | 5.6% |
| Total | 701 | 100.0% |
Transportation & Commute in Lake California
Vehicle Availability by Sex in Lake California
The most prevalent vehicle ownership categories in Lake California are males with 3 vehicles (424, accounting for 46.5%) and females with 3 vehicles (177, making up 72.1%).
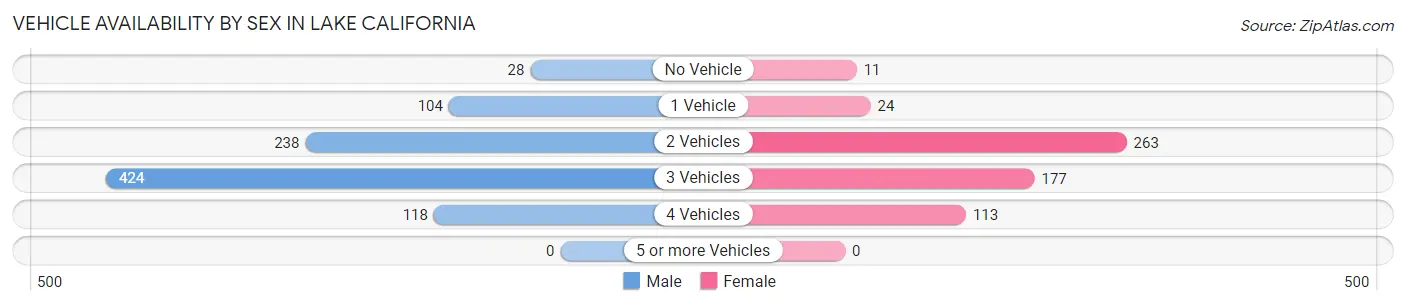
| Vehicles Available | Male | Female |
| No Vehicle | 28 (3.1%) | 11 (1.9%) |
| 1 Vehicle | 104 (11.4%) | 24 (4.1%) |
| 2 Vehicles | 238 (26.1%) | 263 (44.7%) |
| 3 Vehicles | 424 (46.5%) | 177 (30.1%) |
| 4 Vehicles | 118 (12.9%) | 113 (19.2%) |
| 5 or more Vehicles | 0 (0.0%) | 0 (0.0%) |
| Total | 912 (100.0%) | 588 (100.0%) |
Commute Time in Lake California
The most frequently occuring commute durations in Lake California are 30 to 34 minutes (510 commuters, 36.1%), 20 to 24 minutes (350 commuters, 24.8%), and 90 or more minutes (167 commuters, 11.8%).
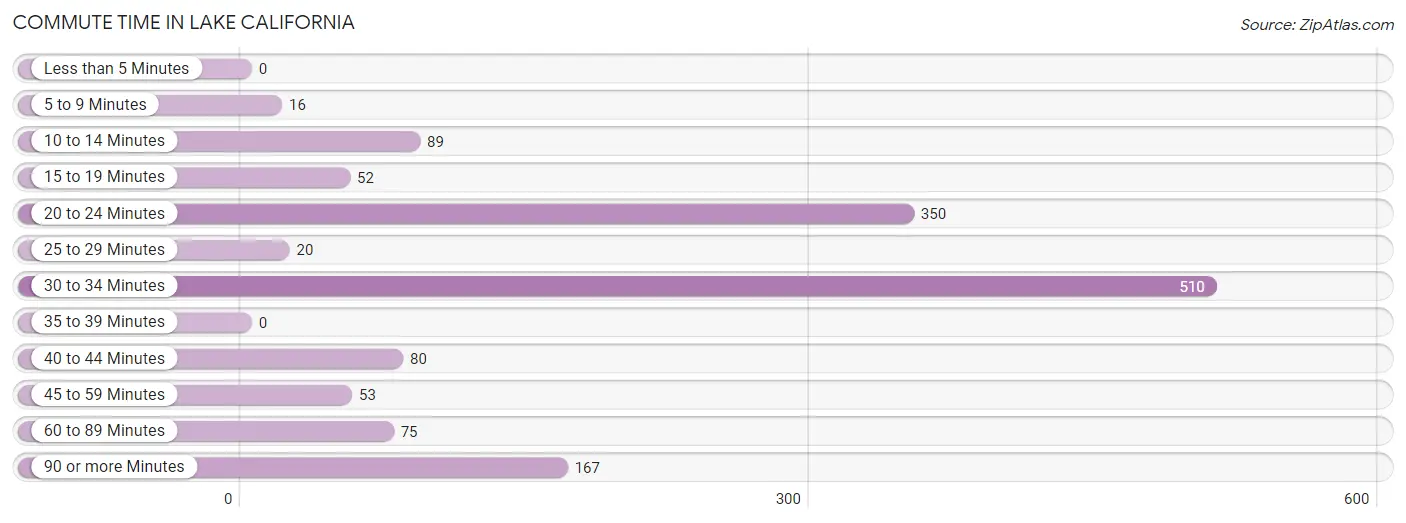
| Commute Time | # Commuters | % Commuters |
| Less than 5 Minutes | 0 | 0.0% |
| 5 to 9 Minutes | 16 | 1.1% |
| 10 to 14 Minutes | 89 | 6.3% |
| 15 to 19 Minutes | 52 | 3.7% |
| 20 to 24 Minutes | 350 | 24.8% |
| 25 to 29 Minutes | 20 | 1.4% |
| 30 to 34 Minutes | 510 | 36.1% |
| 35 to 39 Minutes | 0 | 0.0% |
| 40 to 44 Minutes | 80 | 5.7% |
| 45 to 59 Minutes | 53 | 3.7% |
| 60 to 89 Minutes | 75 | 5.3% |
| 90 or more Minutes | 167 | 11.8% |
Commute Time by Sex in Lake California
The most common commute times in Lake California are 30 to 34 minutes (267 commuters, 30.5%) for males and 30 to 34 minutes (243 commuters, 45.3%) for females.
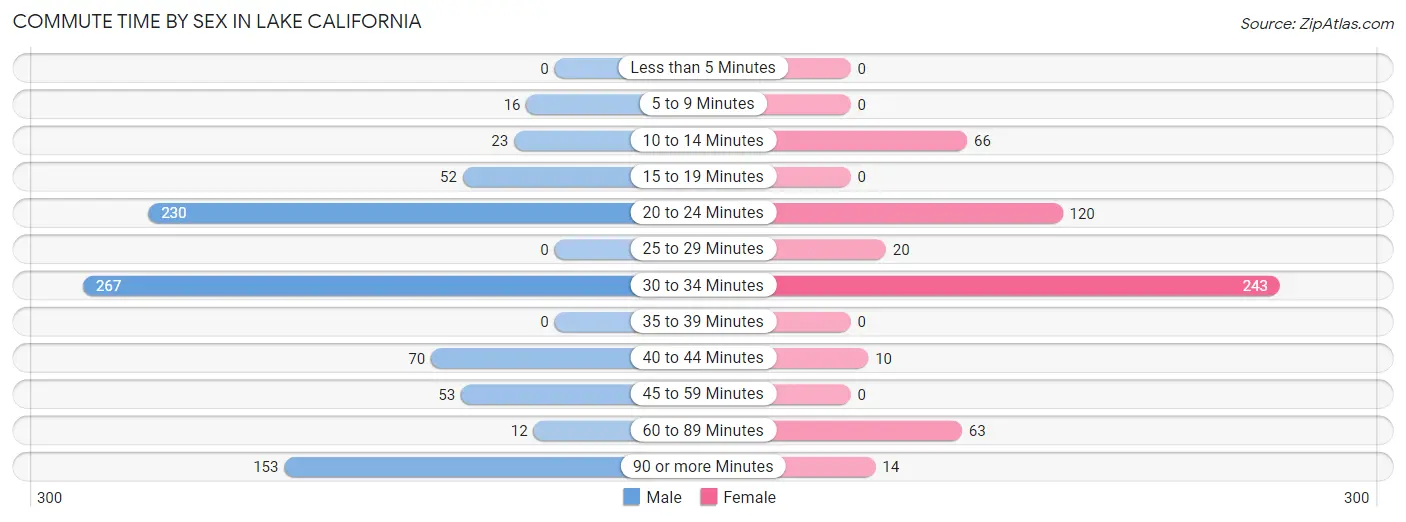
| Commute Time | Male | Female |
| Less than 5 Minutes | 0 (0.0%) | 0 (0.0%) |
| 5 to 9 Minutes | 16 (1.8%) | 0 (0.0%) |
| 10 to 14 Minutes | 23 (2.6%) | 66 (12.3%) |
| 15 to 19 Minutes | 52 (5.9%) | 0 (0.0%) |
| 20 to 24 Minutes | 230 (26.3%) | 120 (22.4%) |
| 25 to 29 Minutes | 0 (0.0%) | 20 (3.7%) |
| 30 to 34 Minutes | 267 (30.5%) | 243 (45.3%) |
| 35 to 39 Minutes | 0 (0.0%) | 0 (0.0%) |
| 40 to 44 Minutes | 70 (8.0%) | 10 (1.9%) |
| 45 to 59 Minutes | 53 (6.0%) | 0 (0.0%) |
| 60 to 89 Minutes | 12 (1.4%) | 63 (11.7%) |
| 90 or more Minutes | 153 (17.5%) | 14 (2.6%) |
Time of Departure to Work by Sex in Lake California
The most frequent times of departure to work in Lake California are 5:00 AM to 5:29 AM (217, 24.8%) for males and 7:30 AM to 7:59 AM (175, 32.7%) for females.
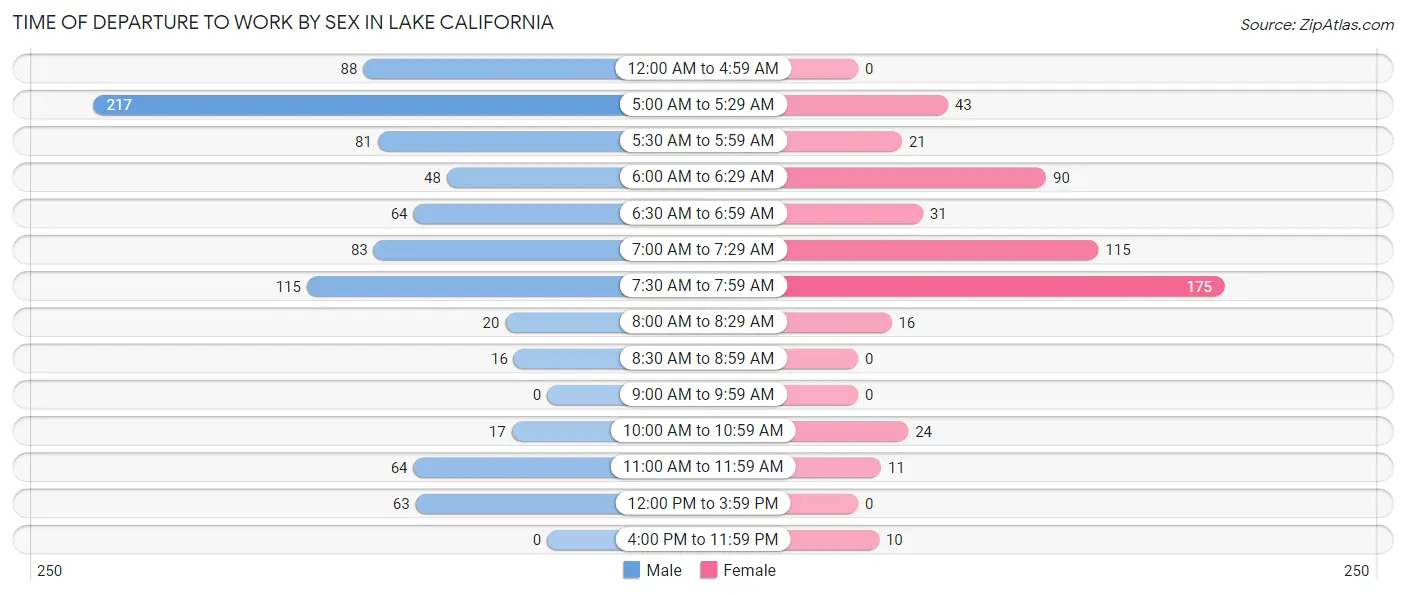
| Time of Departure | Male | Female |
| 12:00 AM to 4:59 AM | 88 (10.1%) | 0 (0.0%) |
| 5:00 AM to 5:29 AM | 217 (24.8%) | 43 (8.0%) |
| 5:30 AM to 5:59 AM | 81 (9.2%) | 21 (3.9%) |
| 6:00 AM to 6:29 AM | 48 (5.5%) | 90 (16.8%) |
| 6:30 AM to 6:59 AM | 64 (7.3%) | 31 (5.8%) |
| 7:00 AM to 7:29 AM | 83 (9.5%) | 115 (21.5%) |
| 7:30 AM to 7:59 AM | 115 (13.1%) | 175 (32.7%) |
| 8:00 AM to 8:29 AM | 20 (2.3%) | 16 (3.0%) |
| 8:30 AM to 8:59 AM | 16 (1.8%) | 0 (0.0%) |
| 9:00 AM to 9:59 AM | 0 (0.0%) | 0 (0.0%) |
| 10:00 AM to 10:59 AM | 17 (1.9%) | 24 (4.5%) |
| 11:00 AM to 11:59 AM | 64 (7.3%) | 11 (2.1%) |
| 12:00 PM to 3:59 PM | 63 (7.2%) | 0 (0.0%) |
| 4:00 PM to 11:59 PM | 0 (0.0%) | 10 (1.9%) |
| Total | 876 (100.0%) | 536 (100.0%) |
Housing Occupancy in Lake California
Occupancy by Ownership in Lake California
Of the total 1,325 dwellings in Lake California, owner-occupied units account for 1,099 (82.9%), while renter-occupied units make up 226 (17.1%).
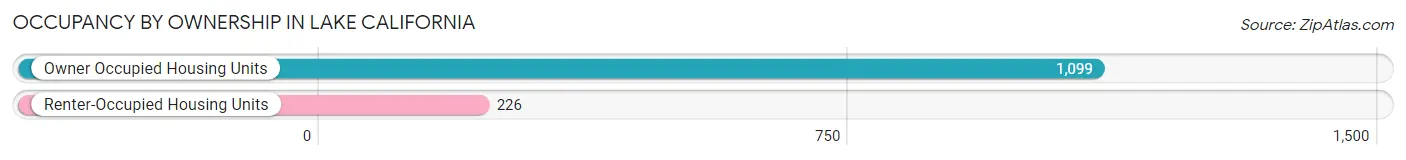
| Occupancy | # Housing Units | % Housing Units |
| Owner Occupied Housing Units | 1,099 | 82.9% |
| Renter-Occupied Housing Units | 226 | 17.1% |
| Total Occupied Housing Units | 1,325 | 100.0% |
Occupancy by Household Size in Lake California
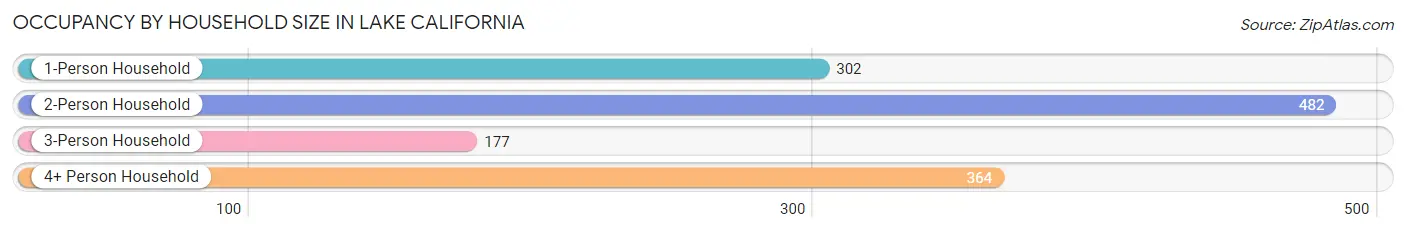
| Household Size | # Housing Units | % Housing Units |
| 1-Person Household | 302 | 22.8% |
| 2-Person Household | 482 | 36.4% |
| 3-Person Household | 177 | 13.4% |
| 4+ Person Household | 364 | 27.5% |
| Total Housing Units | 1,325 | 100.0% |
Occupancy by Ownership by Household Size in Lake California
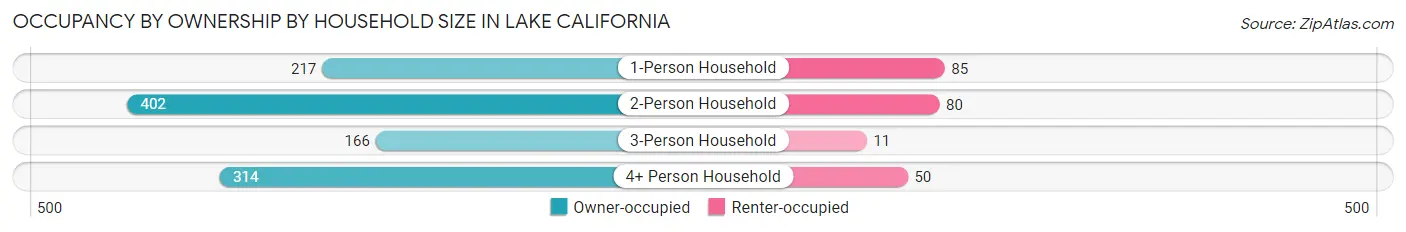
| Household Size | Owner-occupied | Renter-occupied |
| 1-Person Household | 217 (71.9%) | 85 (28.1%) |
| 2-Person Household | 402 (83.4%) | 80 (16.6%) |
| 3-Person Household | 166 (93.8%) | 11 (6.2%) |
| 4+ Person Household | 314 (86.3%) | 50 (13.7%) |
| Total Housing Units | 1,099 (82.9%) | 226 (17.1%) |
Occupancy by Educational Attainment in Lake California
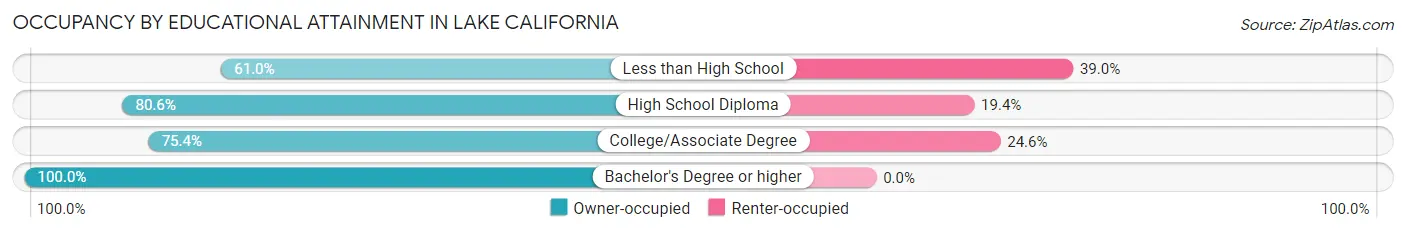
| Household Size | Owner-occupied | Renter-occupied |
| Less than High School | 25 (61.0%) | 16 (39.0%) |
| High School Diploma | 282 (80.6%) | 68 (19.4%) |
| College/Associate Degree | 435 (75.4%) | 142 (24.6%) |
| Bachelor's Degree or higher | 357 (100.0%) | 0 (0.0%) |
Occupancy by Age of Householder in Lake California
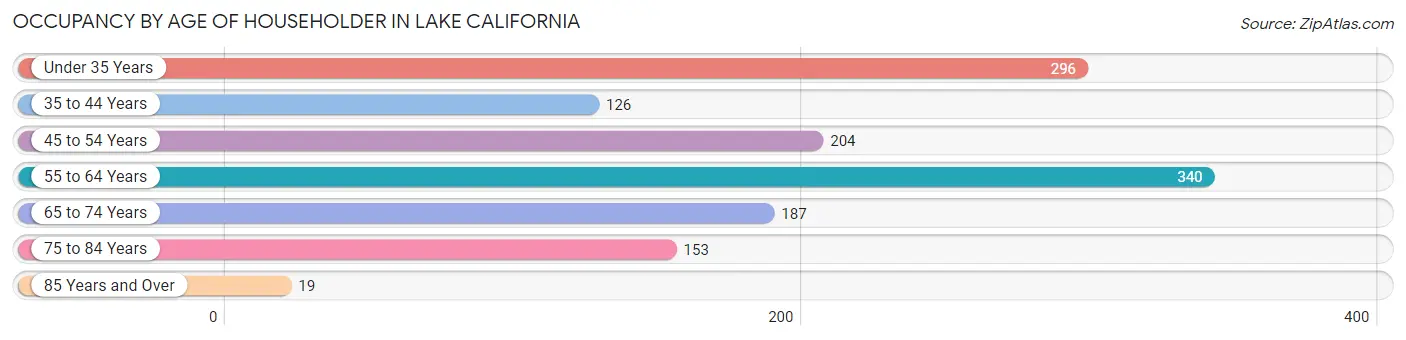
| Age Bracket | # Households | % Households |
| Under 35 Years | 296 | 22.3% |
| 35 to 44 Years | 126 | 9.5% |
| 45 to 54 Years | 204 | 15.4% |
| 55 to 64 Years | 340 | 25.7% |
| 65 to 74 Years | 187 | 14.1% |
| 75 to 84 Years | 153 | 11.6% |
| 85 Years and Over | 19 | 1.4% |
| Total | 1,325 | 100.0% |
Housing Finances in Lake California
Median Income by Occupancy in Lake California
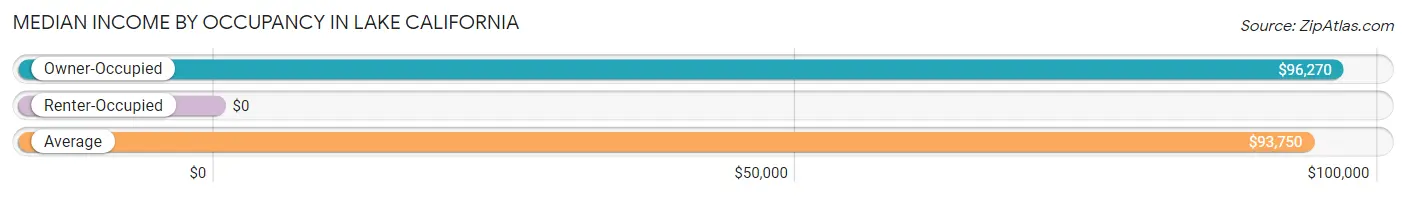
| Occupancy Type | # Households | Median Income |
| Owner-Occupied | 1,099 (82.9%) | $96,270 |
| Renter-Occupied | 226 (17.1%) | $0 |
| Average | 1,325 (100.0%) | $93,750 |
Occupancy by Householder Income Bracket in Lake California
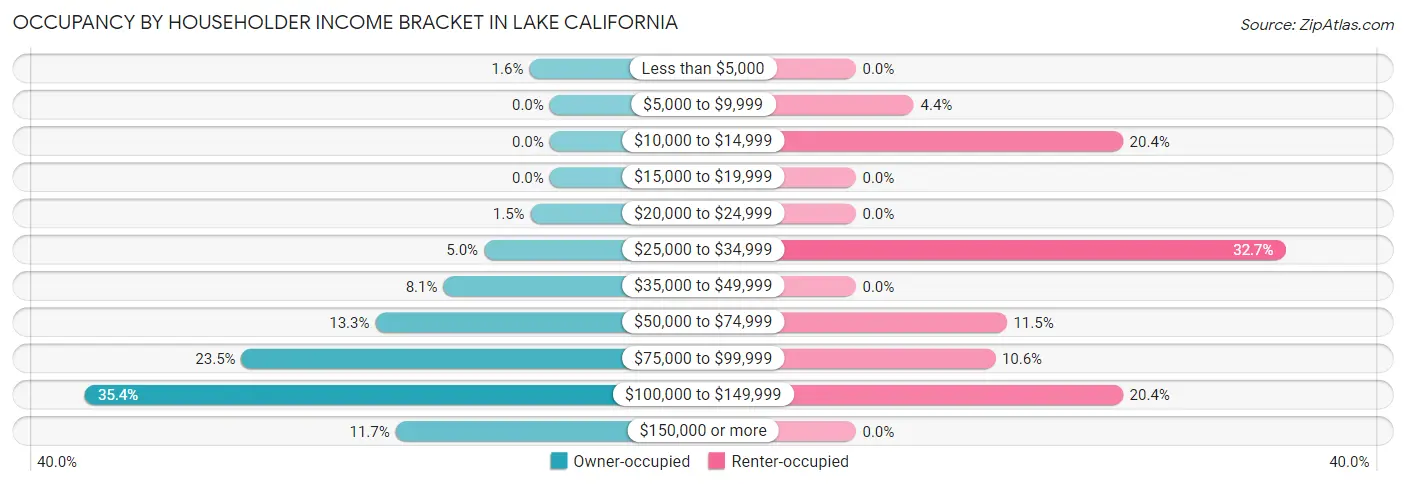
| Income Bracket | Owner-occupied | Renter-occupied |
| Less than $5,000 | 17 (1.5%) | 0 (0.0%) |
| $5,000 to $9,999 | 0 (0.0%) | 10 (4.4%) |
| $10,000 to $14,999 | 0 (0.0%) | 46 (20.3%) |
| $15,000 to $19,999 | 0 (0.0%) | 0 (0.0%) |
| $20,000 to $24,999 | 16 (1.5%) | 0 (0.0%) |
| $25,000 to $34,999 | 55 (5.0%) | 74 (32.7%) |
| $35,000 to $49,999 | 89 (8.1%) | 0 (0.0%) |
| $50,000 to $74,999 | 146 (13.3%) | 26 (11.5%) |
| $75,000 to $99,999 | 258 (23.5%) | 24 (10.6%) |
| $100,000 to $149,999 | 389 (35.4%) | 46 (20.3%) |
| $150,000 or more | 129 (11.7%) | 0 (0.0%) |
| Total | 1,099 (100.0%) | 226 (100.0%) |
Monthly Housing Cost Tiers in Lake California
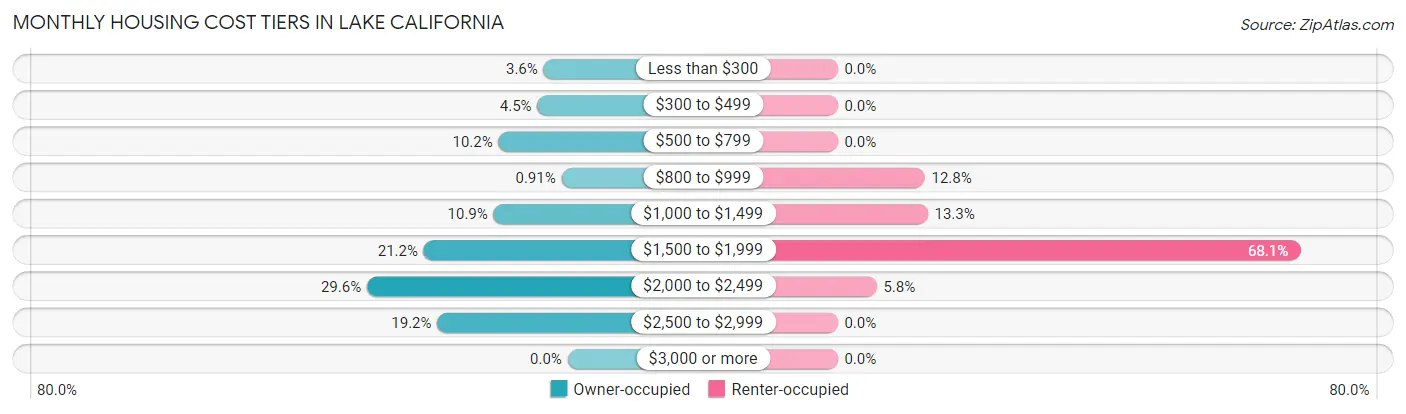
| Monthly Cost | Owner-occupied | Renter-occupied |
| Less than $300 | 39 (3.5%) | 0 (0.0%) |
| $300 to $499 | 49 (4.5%) | 0 (0.0%) |
| $500 to $799 | 112 (10.2%) | 0 (0.0%) |
| $800 to $999 | 10 (0.9%) | 29 (12.8%) |
| $1,000 to $1,499 | 120 (10.9%) | 30 (13.3%) |
| $1,500 to $1,999 | 233 (21.2%) | 154 (68.1%) |
| $2,000 to $2,499 | 325 (29.6%) | 13 (5.8%) |
| $2,500 to $2,999 | 211 (19.2%) | 0 (0.0%) |
| $3,000 or more | 0 (0.0%) | 0 (0.0%) |
| Total | 1,099 (100.0%) | 226 (100.0%) |
Physical Housing Characteristics in Lake California
Housing Structures in Lake California
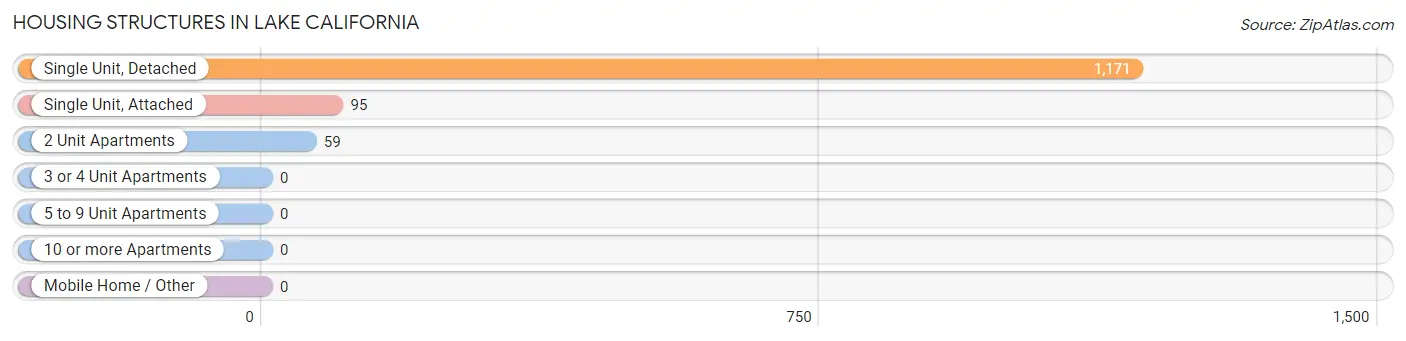
| Structure Type | # Housing Units | % Housing Units |
| Single Unit, Detached | 1,171 | 88.4% |
| Single Unit, Attached | 95 | 7.2% |
| 2 Unit Apartments | 59 | 4.4% |
| 3 or 4 Unit Apartments | 0 | 0.0% |
| 5 to 9 Unit Apartments | 0 | 0.0% |
| 10 or more Apartments | 0 | 0.0% |
| Mobile Home / Other | 0 | 0.0% |
| Total | 1,325 | 100.0% |
Housing Structures by Occupancy in Lake California
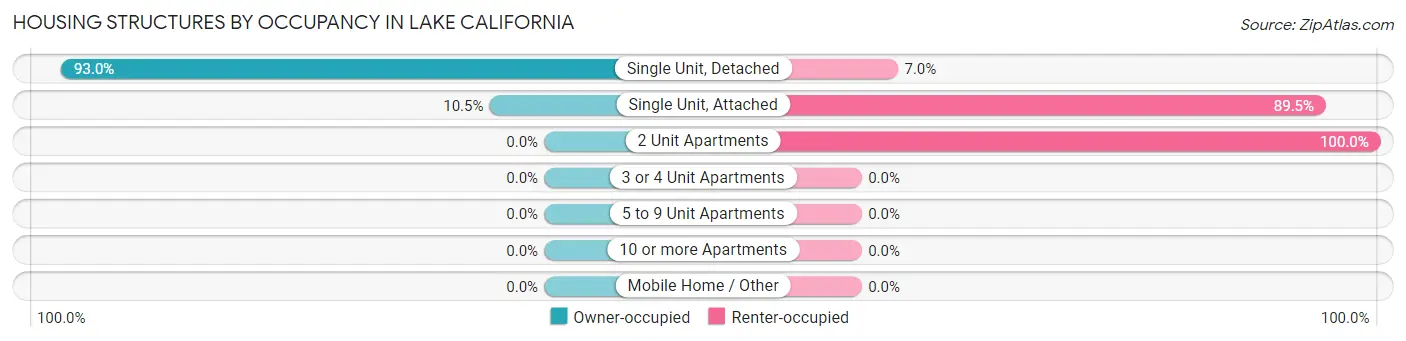
| Structure Type | Owner-occupied | Renter-occupied |
| Single Unit, Detached | 1,089 (93.0%) | 82 (7.0%) |
| Single Unit, Attached | 10 (10.5%) | 85 (89.5%) |
| 2 Unit Apartments | 0 (0.0%) | 59 (100.0%) |
| 3 or 4 Unit Apartments | 0 (0.0%) | 0 (0.0%) |
| 5 to 9 Unit Apartments | 0 (0.0%) | 0 (0.0%) |
| 10 or more Apartments | 0 (0.0%) | 0 (0.0%) |
| Mobile Home / Other | 0 (0.0%) | 0 (0.0%) |
| Total | 1,099 (82.9%) | 226 (17.1%) |
Housing Structures by Number of Rooms in Lake California
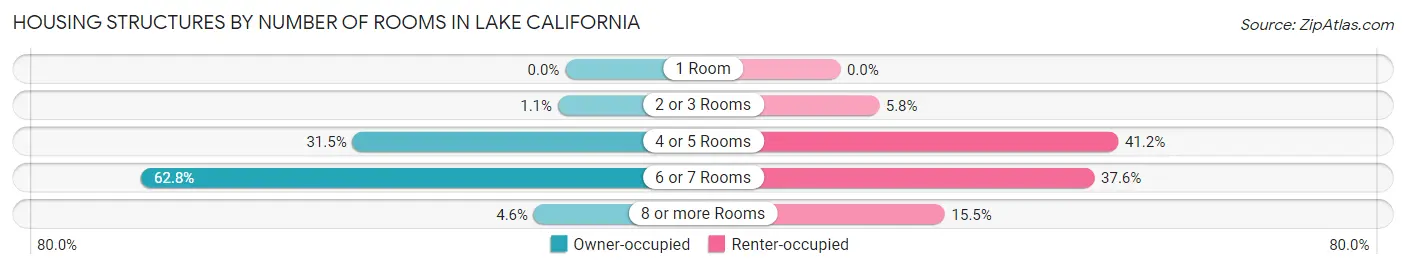
| Number of Rooms | Owner-occupied | Renter-occupied |
| 1 Room | 0 (0.0%) | 0 (0.0%) |
| 2 or 3 Rooms | 12 (1.1%) | 13 (5.8%) |
| 4 or 5 Rooms | 346 (31.5%) | 93 (41.1%) |
| 6 or 7 Rooms | 690 (62.8%) | 85 (37.6%) |
| 8 or more Rooms | 51 (4.6%) | 35 (15.5%) |
| Total | 1,099 (100.0%) | 226 (100.0%) |
Housing Structure by Heating Type in Lake California
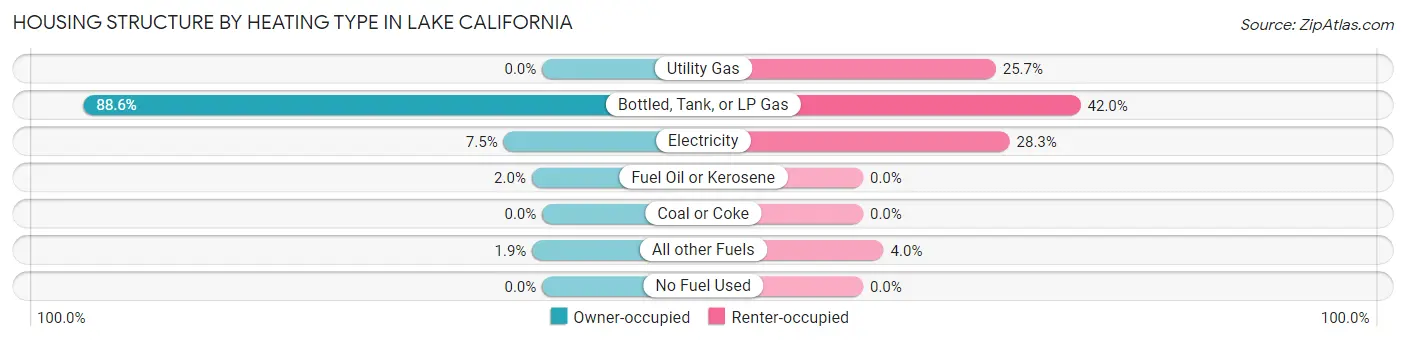
| Heating Type | Owner-occupied | Renter-occupied |
| Utility Gas | 0 (0.0%) | 58 (25.7%) |
| Bottled, Tank, or LP Gas | 974 (88.6%) | 95 (42.0%) |
| Electricity | 82 (7.5%) | 64 (28.3%) |
| Fuel Oil or Kerosene | 22 (2.0%) | 0 (0.0%) |
| Coal or Coke | 0 (0.0%) | 0 (0.0%) |
| All other Fuels | 21 (1.9%) | 9 (4.0%) |
| No Fuel Used | 0 (0.0%) | 0 (0.0%) |
| Total | 1,099 (100.0%) | 226 (100.0%) |
Household Vehicle Usage in Lake California
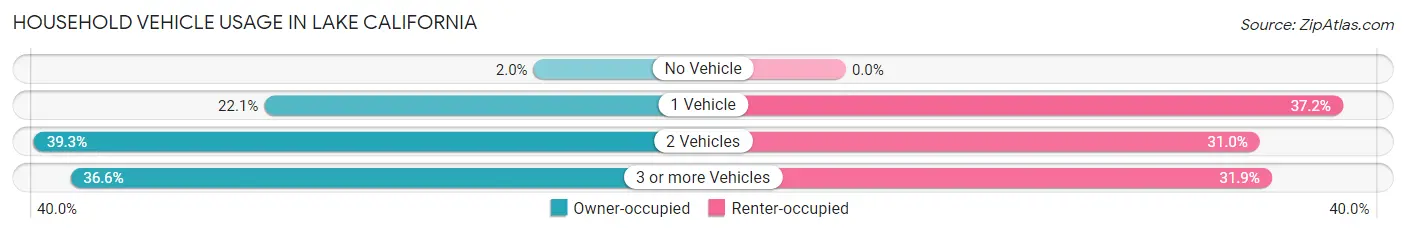
| Vehicles per Household | Owner-occupied | Renter-occupied |
| No Vehicle | 22 (2.0%) | 0 (0.0%) |
| 1 Vehicle | 243 (22.1%) | 84 (37.2%) |
| 2 Vehicles | 432 (39.3%) | 70 (31.0%) |
| 3 or more Vehicles | 402 (36.6%) | 72 (31.9%) |
| Total | 1,099 (100.0%) | 226 (100.0%) |
Real Estate & Mortgages in Lake California
Real Estate and Mortgage Overview in Lake California
| Characteristic | Without Mortgage | With Mortgage |
| Housing Units | 222 | 877 |
| Median Property Value | $253,300 | $317,100 |
| Median Household Income | $42,372 | $122 |
| Monthly Housing Costs | $696 | $0 |
| Real Estate Taxes | $2,081 | $0 |
Property Value by Mortgage Status in Lake California
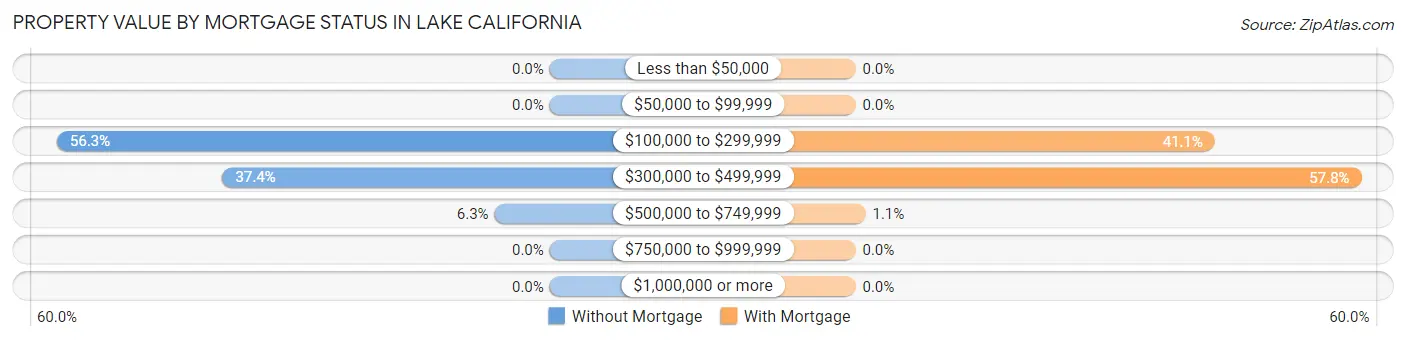
| Property Value | Without Mortgage | With Mortgage |
| Less than $50,000 | 0 (0.0%) | 0 (0.0%) |
| $50,000 to $99,999 | 0 (0.0%) | 0 (0.0%) |
| $100,000 to $299,999 | 125 (56.3%) | 360 (41.0%) |
| $300,000 to $499,999 | 83 (37.4%) | 507 (57.8%) |
| $500,000 to $749,999 | 14 (6.3%) | 10 (1.1%) |
| $750,000 to $999,999 | 0 (0.0%) | 0 (0.0%) |
| $1,000,000 or more | 0 (0.0%) | 0 (0.0%) |
| Total | 222 (100.0%) | 877 (100.0%) |
Household Income by Mortgage Status in Lake California
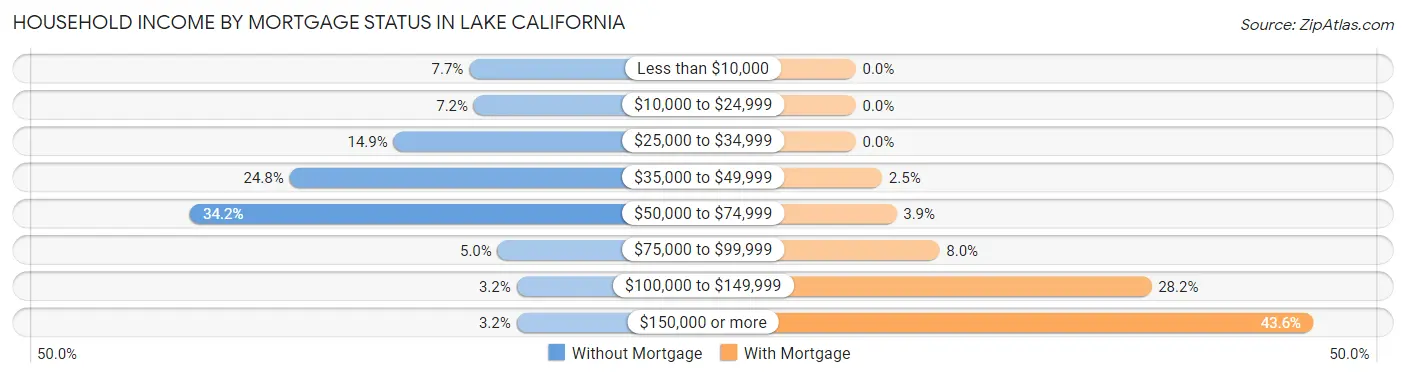
| Household Income | Without Mortgage | With Mortgage |
| Less than $10,000 | 17 (7.7%) | 0 (0.0%) |
| $10,000 to $24,999 | 16 (7.2%) | 0 (0.0%) |
| $25,000 to $34,999 | 33 (14.9%) | 0 (0.0%) |
| $35,000 to $49,999 | 55 (24.8%) | 22 (2.5%) |
| $50,000 to $74,999 | 76 (34.2%) | 34 (3.9%) |
| $75,000 to $99,999 | 11 (5.0%) | 70 (8.0%) |
| $100,000 to $149,999 | 7 (3.2%) | 247 (28.2%) |
| $150,000 or more | 7 (3.2%) | 382 (43.6%) |
| Total | 222 (100.0%) | 877 (100.0%) |
Property Value to Household Income Ratio in Lake California
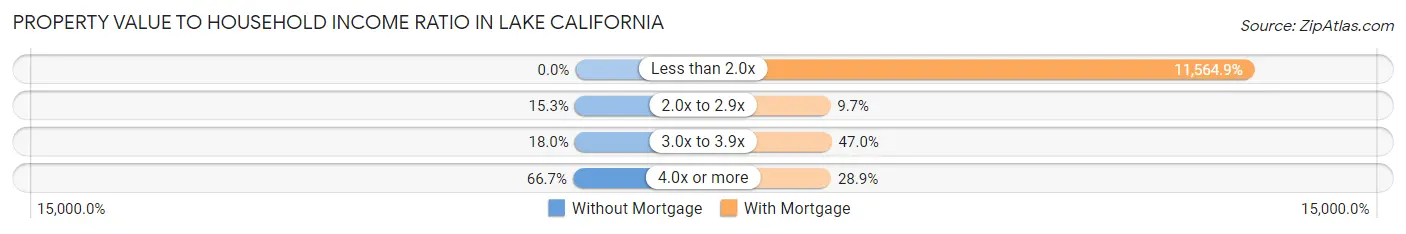
| Value-to-Income Ratio | Without Mortgage | With Mortgage |
| Less than 2.0x | 0 (0.0%) | 101,424 (11,564.9%) |
| 2.0x to 2.9x | 34 (15.3%) | 85 (9.7%) |
| 3.0x to 3.9x | 40 (18.0%) | 412 (47.0%) |
| 4.0x or more | 148 (66.7%) | 253 (28.8%) |
| Total | 222 (100.0%) | 877 (100.0%) |
Real Estate Taxes by Mortgage Status in Lake California
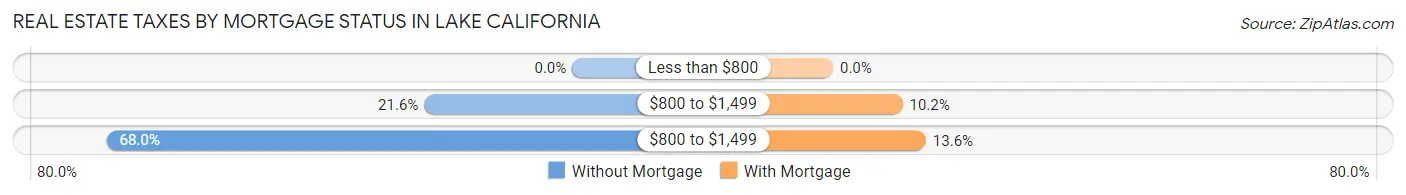
| Property Taxes | Without Mortgage | With Mortgage |
| Less than $800 | 0 (0.0%) | 0 (0.0%) |
| $800 to $1,499 | 48 (21.6%) | 89 (10.2%) |
| $800 to $1,499 | 151 (68.0%) | 119 (13.6%) |
| Total | 222 (100.0%) | 877 (100.0%) |
Health & Disability in Lake California
Health Insurance Coverage by Age in Lake California
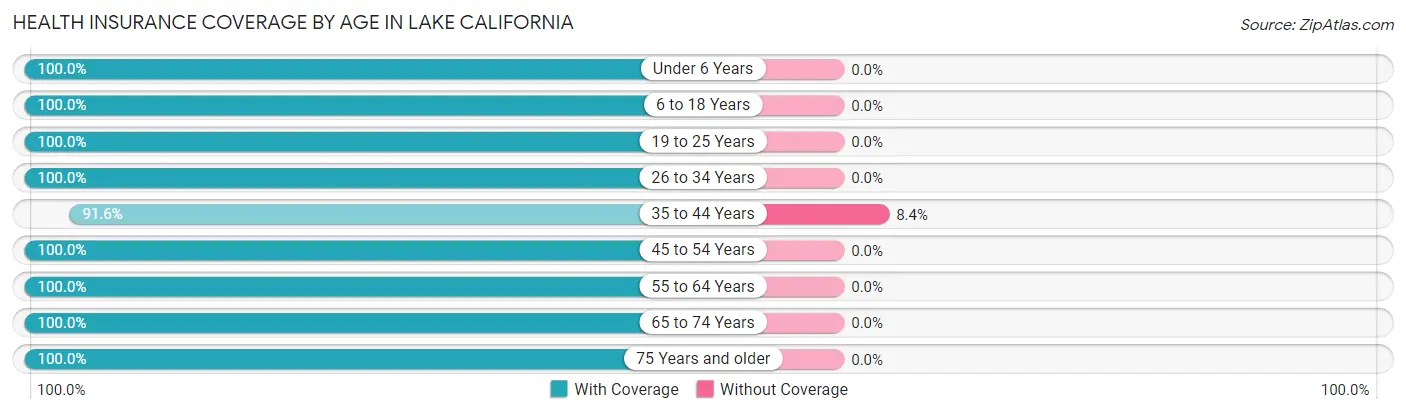
| Age Bracket | With Coverage | Without Coverage |
| Under 6 Years | 138 (100.0%) | 0 (0.0%) |
| 6 to 18 Years | 713 (100.0%) | 0 (0.0%) |
| 19 to 25 Years | 222 (100.0%) | 0 (0.0%) |
| 26 to 34 Years | 529 (100.0%) | 0 (0.0%) |
| 35 to 44 Years | 405 (91.6%) | 37 (8.4%) |
| 45 to 54 Years | 357 (100.0%) | 0 (0.0%) |
| 55 to 64 Years | 528 (100.0%) | 0 (0.0%) |
| 65 to 74 Years | 439 (100.0%) | 0 (0.0%) |
| 75 Years and older | 271 (100.0%) | 0 (0.0%) |
| Total | 3,602 (99.0%) | 37 (1.0%) |
Health Insurance Coverage by Citizenship Status in Lake California
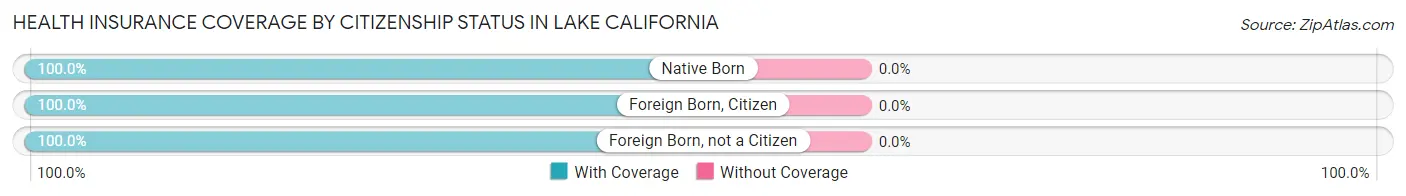
| Citizenship Status | With Coverage | Without Coverage |
| Native Born | 138 (100.0%) | 0 (0.0%) |
| Foreign Born, Citizen | 713 (100.0%) | 0 (0.0%) |
| Foreign Born, not a Citizen | 222 (100.0%) | 0 (0.0%) |
Health Insurance Coverage by Household Income in Lake California
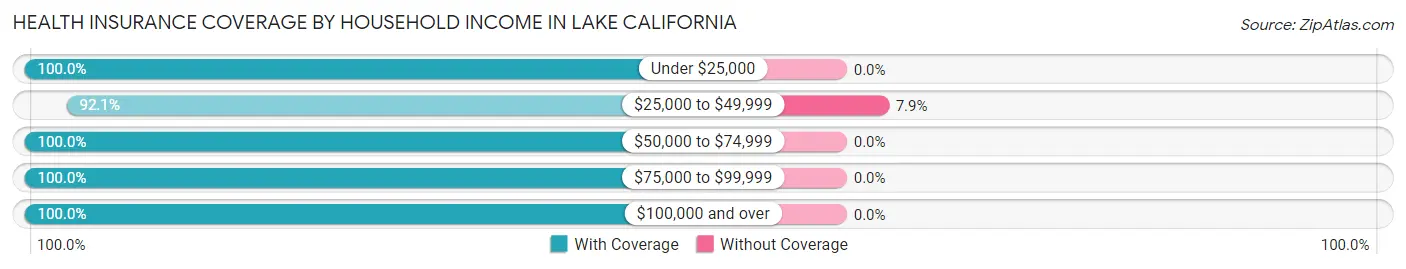
| Household Income | With Coverage | Without Coverage |
| Under $25,000 | 107 (100.0%) | 0 (0.0%) |
| $25,000 to $49,999 | 434 (92.1%) | 37 (7.9%) |
| $50,000 to $74,999 | 405 (100.0%) | 0 (0.0%) |
| $75,000 to $99,999 | 978 (100.0%) | 0 (0.0%) |
| $100,000 and over | 1,675 (100.0%) | 0 (0.0%) |
Public vs Private Health Insurance Coverage by Age in Lake California
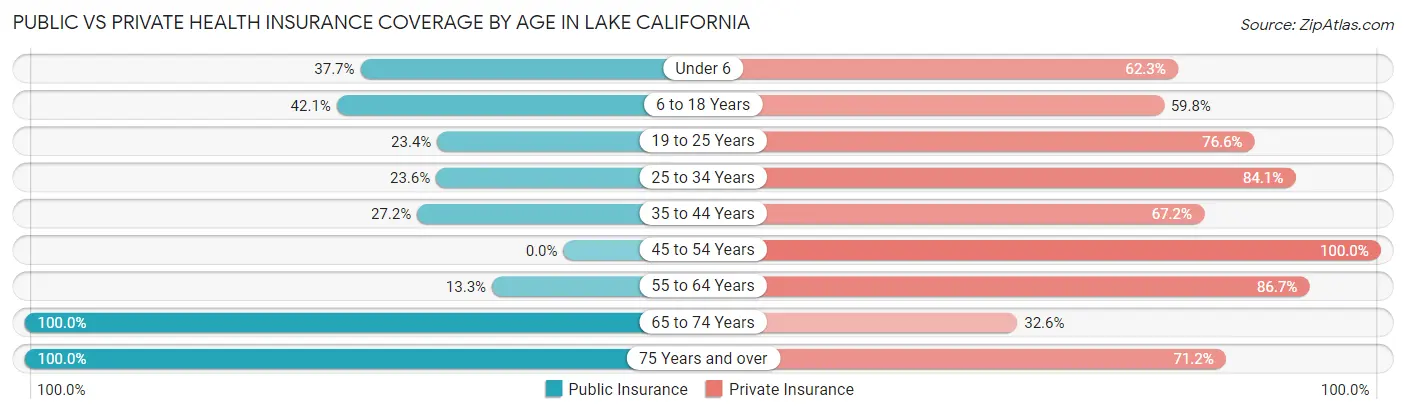
| Age Bracket | Public Insurance | Private Insurance |
| Under 6 | 52 (37.7%) | 86 (62.3%) |
| 6 to 18 Years | 300 (42.1%) | 426 (59.8%) |
| 19 to 25 Years | 52 (23.4%) | 170 (76.6%) |
| 25 to 34 Years | 125 (23.6%) | 445 (84.1%) |
| 35 to 44 Years | 120 (27.2%) | 297 (67.2%) |
| 45 to 54 Years | 0 (0.0%) | 357 (100.0%) |
| 55 to 64 Years | 70 (13.3%) | 458 (86.7%) |
| 65 to 74 Years | 439 (100.0%) | 143 (32.6%) |
| 75 Years and over | 271 (100.0%) | 193 (71.2%) |
| Total | 1,429 (39.3%) | 2,575 (70.8%) |
Disability Status by Sex by Age in Lake California
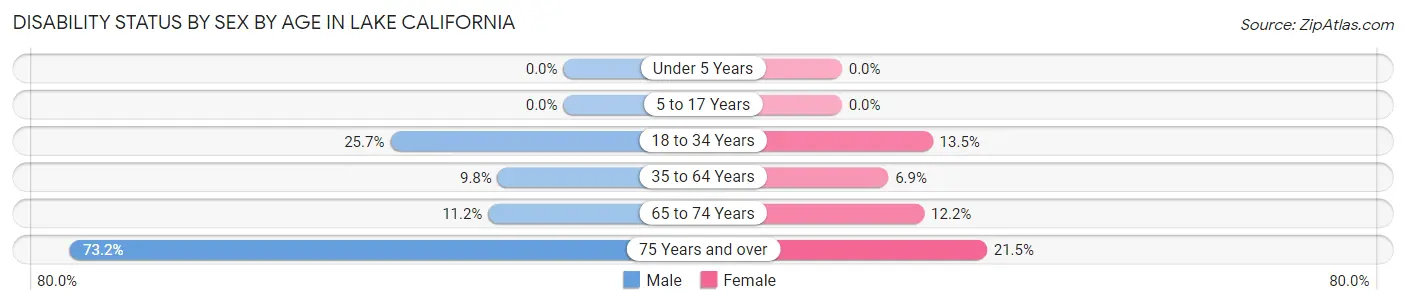
| Age Bracket | Male | Female |
| Under 5 Years | 0 (0.0%) | 0 (0.0%) |
| 5 to 17 Years | 0 (0.0%) | 0 (0.0%) |
| 18 to 34 Years | 118 (25.7%) | 46 (13.5%) |
| 35 to 64 Years | 70 (9.8%) | 42 (6.9%) |
| 65 to 74 Years | 28 (11.2%) | 23 (12.2%) |
| 75 Years and over | 93 (73.2%) | 31 (21.5%) |
Disability Class by Sex by Age in Lake California
Disability Class: Hearing Difficulty
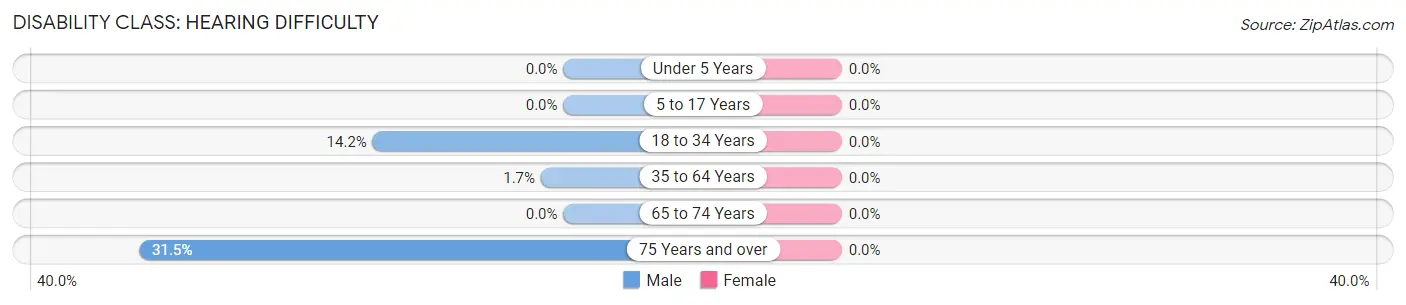
| Age Bracket | Male | Female |
| Under 5 Years | 0 (0.0%) | 0 (0.0%) |
| 5 to 17 Years | 0 (0.0%) | 0 (0.0%) |
| 18 to 34 Years | 65 (14.2%) | 0 (0.0%) |
| 35 to 64 Years | 12 (1.7%) | 0 (0.0%) |
| 65 to 74 Years | 0 (0.0%) | 0 (0.0%) |
| 75 Years and over | 40 (31.5%) | 0 (0.0%) |
Disability Class: Vision Difficulty
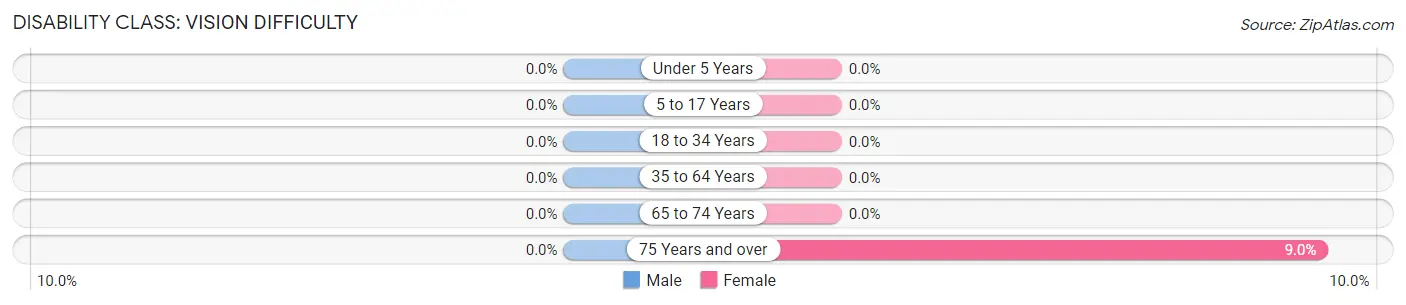
| Age Bracket | Male | Female |
| Under 5 Years | 0 (0.0%) | 0 (0.0%) |
| 5 to 17 Years | 0 (0.0%) | 0 (0.0%) |
| 18 to 34 Years | 0 (0.0%) | 0 (0.0%) |
| 35 to 64 Years | 0 (0.0%) | 0 (0.0%) |
| 65 to 74 Years | 0 (0.0%) | 0 (0.0%) |
| 75 Years and over | 0 (0.0%) | 13 (9.0%) |
Disability Class: Cognitive Difficulty
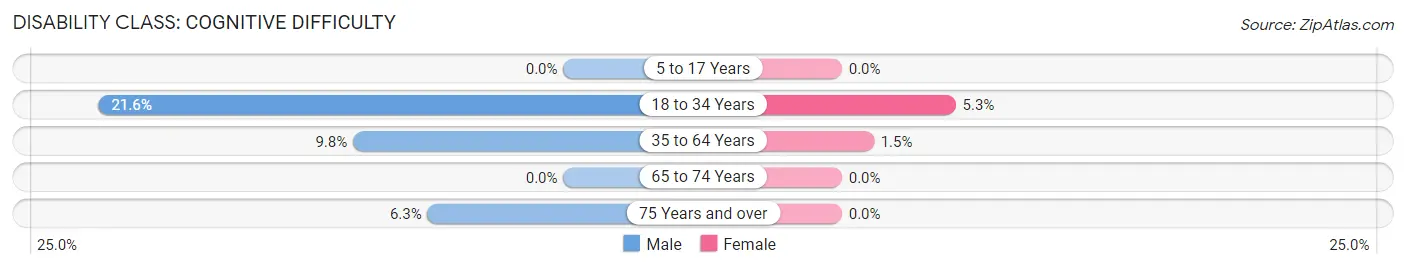
| Age Bracket | Male | Female |
| 5 to 17 Years | 0 (0.0%) | 0 (0.0%) |
| 18 to 34 Years | 99 (21.6%) | 18 (5.3%) |
| 35 to 64 Years | 70 (9.8%) | 9 (1.5%) |
| 65 to 74 Years | 0 (0.0%) | 0 (0.0%) |
| 75 Years and over | 8 (6.3%) | 0 (0.0%) |
Disability Class: Ambulatory Difficulty
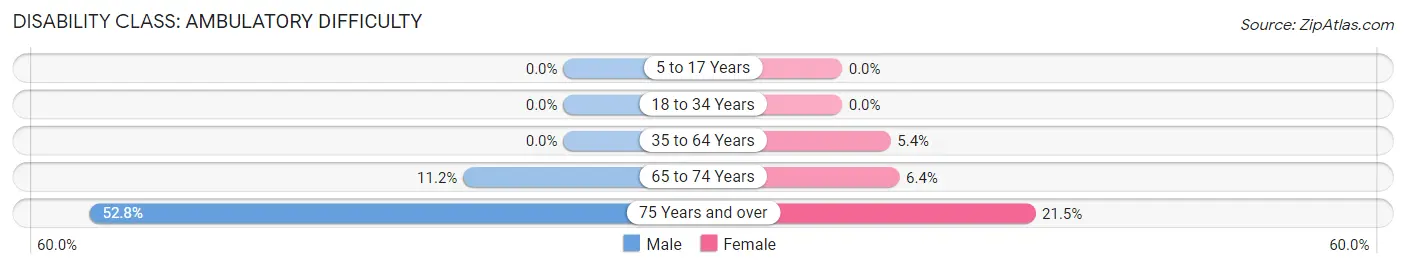
| Age Bracket | Male | Female |
| 5 to 17 Years | 0 (0.0%) | 0 (0.0%) |
| 18 to 34 Years | 0 (0.0%) | 0 (0.0%) |
| 35 to 64 Years | 0 (0.0%) | 33 (5.4%) |
| 65 to 74 Years | 28 (11.2%) | 12 (6.4%) |
| 75 Years and over | 67 (52.8%) | 31 (21.5%) |
Disability Class: Self-Care Difficulty
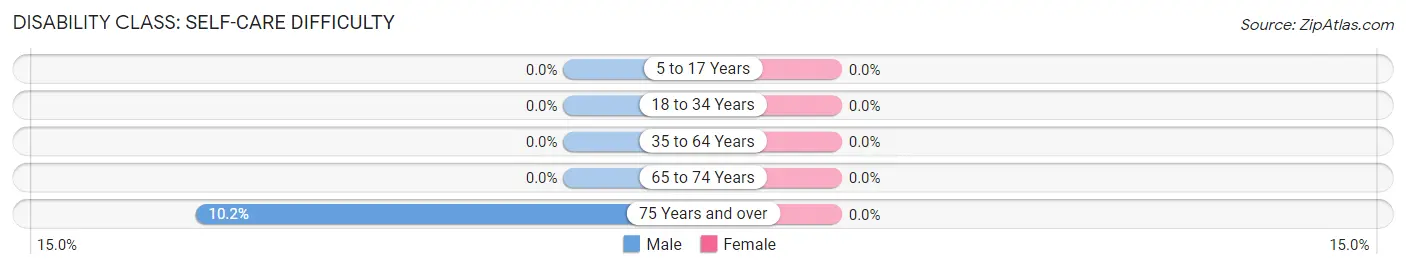
| Age Bracket | Male | Female |
| 5 to 17 Years | 0 (0.0%) | 0 (0.0%) |
| 18 to 34 Years | 0 (0.0%) | 0 (0.0%) |
| 35 to 64 Years | 0 (0.0%) | 0 (0.0%) |
| 65 to 74 Years | 0 (0.0%) | 0 (0.0%) |
| 75 Years and over | 13 (10.2%) | 0 (0.0%) |
Technology Access in Lake California
Computing Device Access in Lake California
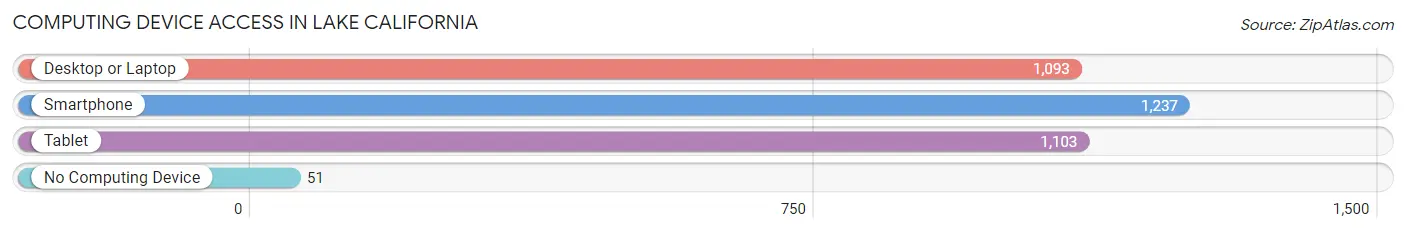
| Device Type | # Households | % Households |
| Desktop or Laptop | 1,093 | 82.5% |
| Smartphone | 1,237 | 93.4% |
| Tablet | 1,103 | 83.3% |
| No Computing Device | 51 | 3.8% |
| Total | 1,325 | 100.0% |
Internet Access in Lake California
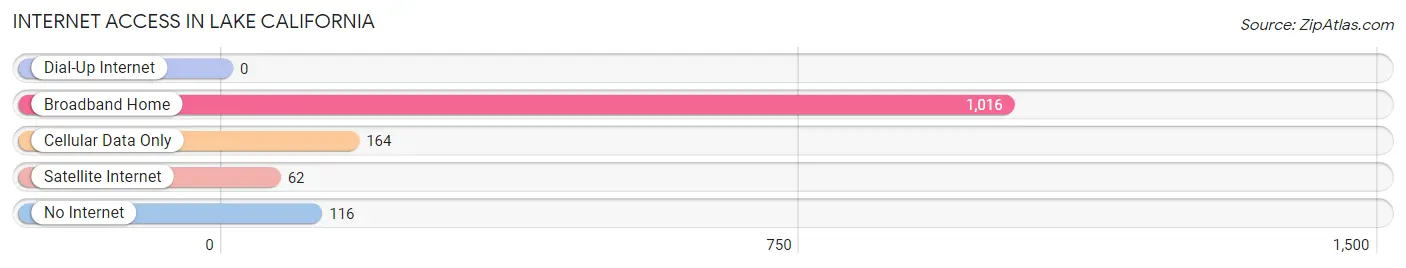
| Internet Type | # Households | % Households |
| Dial-Up Internet | 0 | 0.0% |
| Broadband Home | 1,016 | 76.7% |
| Cellular Data Only | 164 | 12.4% |
| Satellite Internet | 62 | 4.7% |
| No Internet | 116 | 8.7% |
| Total | 1,325 | 100.0% |
Lake California Summary
California is a state located on the western coast of the United States. It is the most populous state in the country, with a population of over 39 million people. California is known for its diverse geography, ranging from the Pacific Coast to the Sierra Nevada Mountains, and its vibrant economy, which is the largest in the United States. California is also home to some of the most iconic cities in the world, such as Los Angeles, San Francisco, and San Diego.
Geography
California is the third largest state in the United States, covering an area of 163,696 square miles. It is bordered by Oregon to the north, Nevada and Arizona to the east, and the Pacific Ocean to the west. California is divided into four distinct geographic regions: the Coastal Region, the Central Valley, the Sierra Nevada Mountains, and the Desert Region.
The Coastal Region is home to some of the most iconic cities in the world, such as Los Angeles, San Francisco, and San Diego. This region is characterized by its mild climate, beautiful beaches, and vibrant culture. The Central Valley is the agricultural heart of California, and is home to some of the most productive farmland in the world. The Sierra Nevada Mountains are home to some of the highest peaks in the United States, and are a popular destination for hikers and skiers. The Desert Region is home to the Mojave and Sonoran Deserts, and is characterized by its dry climate and unique wildlife.
Economy
California has the largest economy in the United States, with a gross domestic product (GDP) of over $2.7 trillion in 2019. The state is home to some of the world’s largest companies, such as Apple, Google, and Facebook. California is also a major producer of agricultural products, such as fruits, vegetables, and nuts. The state is also a major producer of oil and natural gas, and is home to some of the largest oil fields in the world.
California is also a major tourist destination, with over 250 million visitors each year. Tourism is a major contributor to the state’s economy, and is responsible for over $126 billion in economic activity each year.
Demographics
California is the most populous state in the United States, with a population of over 39 million people. The state is home to a diverse population, with over 200 languages spoken. The largest ethnic groups in the state are Hispanic or Latino (38.8%), White (37.2%), and Asian (14.9%).
The median household income in California is $71,805, which is higher than the national average. The poverty rate in the state is 13.3%, which is slightly higher than the national average.
History
California has a long and rich history, dating back to the arrival of Spanish explorers in the 16th century. The area was colonized by the Spanish, and later became part of Mexico after the Mexican War of Independence in 1821. California became part of the United States in 1848, after the Mexican-American War.
California was admitted to the Union as the 31st state in 1850. The state quickly grew in population and economic activity, and by the early 20th century, it had become one of the most populous and prosperous states in the country. California has continued to be a leader in the United States, and is home to some of the most iconic cities in the world.
Common Questions
What is Per Capita Income in Lake California?
Per Capita income in Lake California is $35,799.
What is the Median Family Income in Lake California?
Median Family Income in Lake California is $96,465.
What is the Median Household income in Lake California?
Median Household Income in Lake California is $93,750.
What is Income or Wage Gap in Lake California?
Income or Wage Gap in Lake California is 13.3%.
Women in Lake California earn 86.7 cents for every dollar earned by a man.
What is Inequality or Gini Index in Lake California?
Inequality or Gini Index in Lake California is 0.31.
What is the Total Population of Lake California?
Total Population of Lake California is 3,639.
What is the Total Male Population of Lake California?
Total Male Population of Lake California is 1,861.
What is the Total Female Population of Lake California?
Total Female Population of Lake California is 1,778.
What is the Ratio of Males per 100 Females in Lake California?
There are 104.67 Males per 100 Females in Lake California.
What is the Ratio of Females per 100 Males in Lake California?
There are 95.54 Females per 100 Males in Lake California.
What is the Median Population Age in Lake California?
Median Population Age in Lake California is 38.8 Years.
What is the Average Family Size in Lake California
Average Family Size in Lake California is 3.2 People.
What is the Average Household Size in Lake California
Average Household Size in Lake California is 2.7 People.
How Large is the Labor Force in Lake California?
There are 1,634 People in the Labor Forcein in Lake California.
What is the Percentage of People in the Labor Force in Lake California?
56.7% of People are in the Labor Force in Lake California.
What is the Unemployment Rate in Lake California?
Unemployment Rate in Lake California is 6.6%.