Calwa, CA Map & Demographics
Calwa Map
Calwa Overview
$11,464
PER CAPITA INCOME
$49,676
AVG FAMILY INCOME
$48,495
AVG HOUSEHOLD INCOME
36.8%
WAGE / INCOME GAP [ % ]
63.2¢/ $1
WAGE / INCOME GAP [ $ ]
0.36
INEQUALITY / GINI INDEX
2,486
TOTAL POPULATION
1,062
MALE POPULATION
1,424
FEMALE POPULATION
74.58
MALES / 100 FEMALES
134.09
FEMALES / 100 MALES
23.5
MEDIAN AGE
4.6
AVG FAMILY SIZE
4.5
AVG HOUSEHOLD SIZE
930
LABOR FORCE [ PEOPLE ]
60.5%
PERCENT IN LABOR FORCE
23.2%
UNEMPLOYMENT RATE
Income in Calwa
Income Overview in Calwa
Per Capita Income in Calwa is $11,464, while median incomes of families and households are $49,676 and $48,495 respectively.
| Characteristic | Number | Measure |
| Per Capita Income | 2,486 | $11,464 |
| Median Family Income | 494 | $49,676 |
| Mean Family Income | 494 | $51,655 |
| Median Household Income | 545 | $48,495 |
| Mean Household Income | 545 | $49,944 |
| Income Deficit | 494 | $0 |
| Wage / Income Gap (%) | 2,486 | 36.78% |
| Wage / Income Gap ($) | 2,486 | 63.22¢ per $1 |
| Gini / Inequality Index | 2,486 | 0.36 |
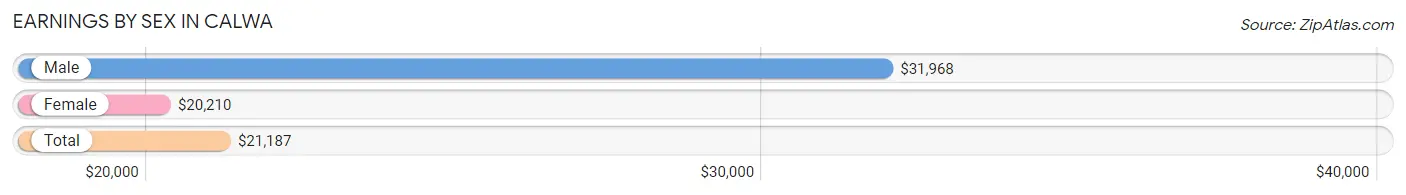
Earnings by Sex in Calwa
Average Earnings in Calwa are $21,187, $31,968 for men and $20,210 for women, a difference of 36.8%.
| Sex | Number | Average Earnings |
| Male | 403 (43.7%) | $31,968 |
| Female | 520 (56.3%) | $20,210 |
| Total | 923 (100.0%) | $21,187 |
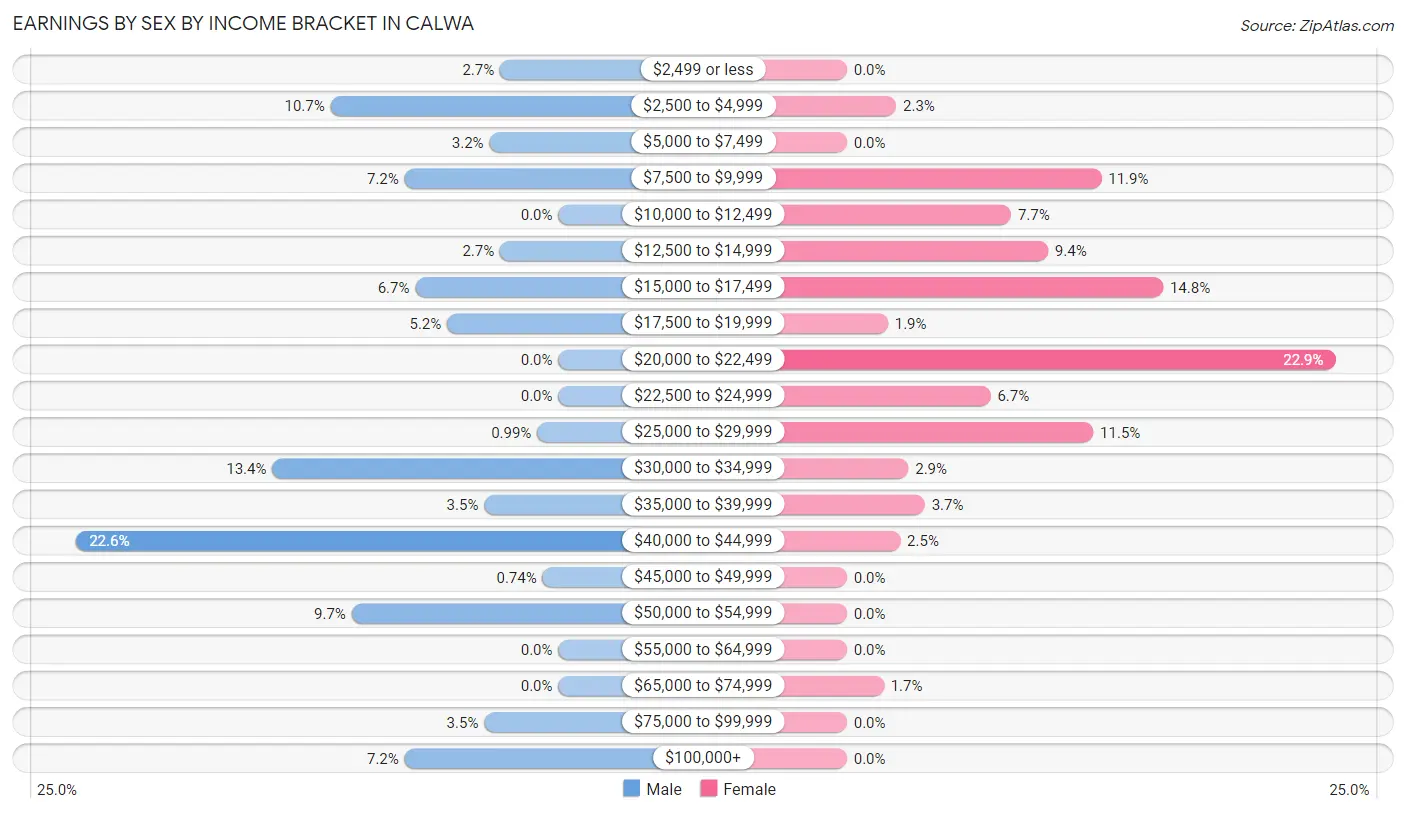
Earnings by Sex by Income Bracket in Calwa
The most common earnings brackets in Calwa are $40,000 to $44,999 for men (91 | 22.6%) and $20,000 to $22,499 for women (119 | 22.9%).
| Income | Male | Female |
| $2,499 or less | 11 (2.7%) | 0 (0.0%) |
| $2,500 to $4,999 | 43 (10.7%) | 12 (2.3%) |
| $5,000 to $7,499 | 13 (3.2%) | 0 (0.0%) |
| $7,500 to $9,999 | 29 (7.2%) | 62 (11.9%) |
| $10,000 to $12,499 | 0 (0.0%) | 40 (7.7%) |
| $12,500 to $14,999 | 11 (2.7%) | 49 (9.4%) |
| $15,000 to $17,499 | 27 (6.7%) | 77 (14.8%) |
| $17,500 to $19,999 | 21 (5.2%) | 10 (1.9%) |
| $20,000 to $22,499 | 0 (0.0%) | 119 (22.9%) |
| $22,500 to $24,999 | 0 (0.0%) | 35 (6.7%) |
| $25,000 to $29,999 | 4 (1.0%) | 60 (11.5%) |
| $30,000 to $34,999 | 54 (13.4%) | 15 (2.9%) |
| $35,000 to $39,999 | 14 (3.5%) | 19 (3.6%) |
| $40,000 to $44,999 | 91 (22.6%) | 13 (2.5%) |
| $45,000 to $49,999 | 3 (0.7%) | 0 (0.0%) |
| $50,000 to $54,999 | 39 (9.7%) | 0 (0.0%) |
| $55,000 to $64,999 | 0 (0.0%) | 0 (0.0%) |
| $65,000 to $74,999 | 0 (0.0%) | 9 (1.7%) |
| $75,000 to $99,999 | 14 (3.5%) | 0 (0.0%) |
| $100,000+ | 29 (7.2%) | 0 (0.0%) |
| Total | 403 (100.0%) | 520 (100.0%) |
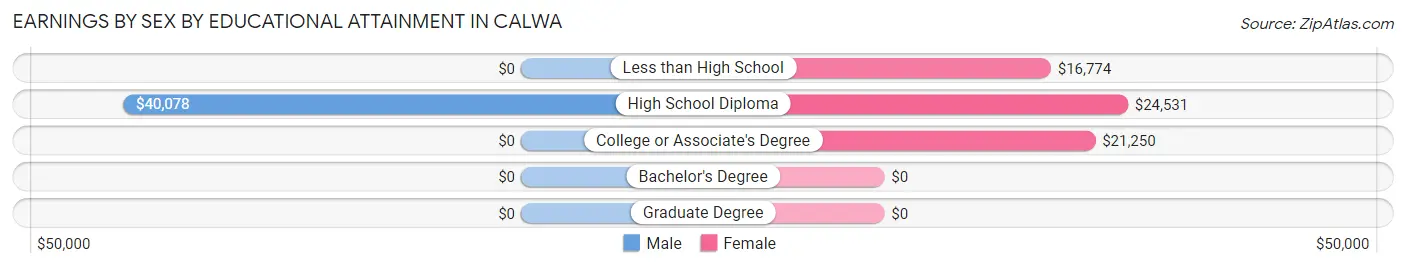
Earnings by Sex by Educational Attainment in Calwa
Average earnings in Calwa are $32,454 for men and $20,670 for women, a difference of 36.3%. Men with an educational attainment of high school diploma enjoy the highest average annual earnings of $40,078, while those with high school diploma education earn the least with $40,078. Women with an educational attainment of high school diploma earn the most with the average annual earnings of $24,531, while those with less than high school education have the smallest earnings of $16,774.
| Educational Attainment | Male Income | Female Income |
| Less than High School | - | - |
| High School Diploma | $40,078 | $24,531 |
| College or Associate's Degree | - | - |
| Bachelor's Degree | - | - |
| Graduate Degree | - | - |
| Total | $32,454 | $20,670 |
Family Income in Calwa
Family Income Brackets in Calwa
According to the Calwa family income data, there are 126 families falling into the $50,000 to $74,999 income range, which is the most common income bracket and makes up 25.5% of all families.
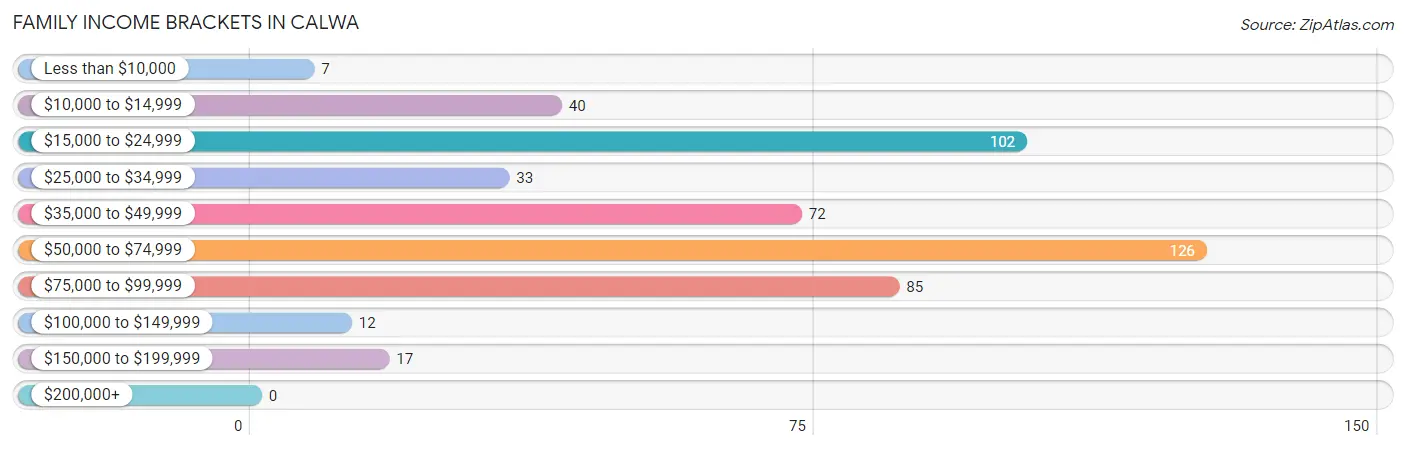
| Income Bracket | # Families | % Families |
| Less than $10,000 | 7 | 1.4% |
| $10,000 to $14,999 | 40 | 8.1% |
| $15,000 to $24,999 | 102 | 20.6% |
| $25,000 to $34,999 | 33 | 6.7% |
| $35,000 to $49,999 | 72 | 14.6% |
| $50,000 to $74,999 | 126 | 25.5% |
| $75,000 to $99,999 | 85 | 17.2% |
| $100,000 to $149,999 | 12 | 2.4% |
| $150,000 to $199,999 | 17 | 3.4% |
| $200,000+ | 0 | 0.0% |
Family Income by Famaliy Size in Calwa
6-person families (122 | 24.7%) account for the highest median family income in Calwa with $61,250 per family, while 4-person families (113 | 22.9%) have the highest median income of $12,251 per family member.
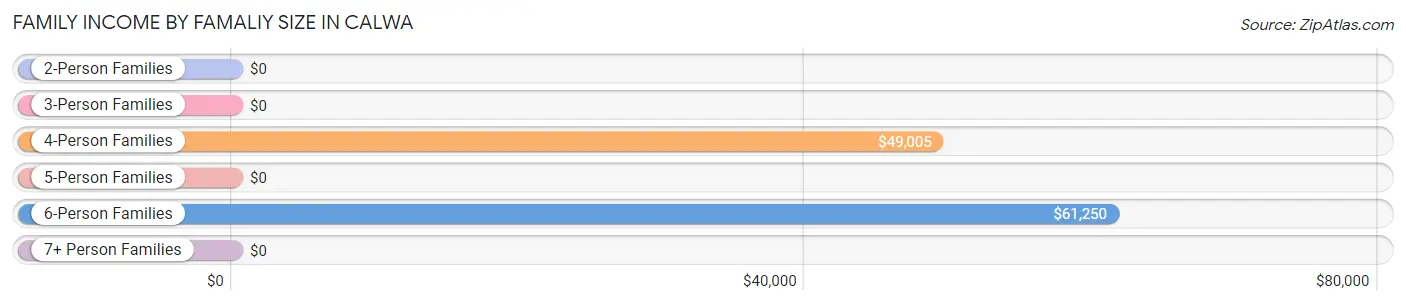
| Income Bracket | # Families | Median Income |
| 2-Person Families | 64 (13.0%) | $0 |
| 3-Person Families | 114 (23.1%) | $0 |
| 4-Person Families | 113 (22.9%) | $49,005 |
| 5-Person Families | 33 (6.7%) | $0 |
| 6-Person Families | 122 (24.7%) | $61,250 |
| 7+ Person Families | 48 (9.7%) | $0 |
| Total | 494 (100.0%) | $49,676 |
Family Income by Number of Earners in Calwa
The median family income in Calwa is $49,676, with families comprising 3+ earners (44) having the highest median family income of $90,887, while families with no earners (56) have the lowest median family income of $17,188, accounting for 8.9% and 11.3% of families, respectively.
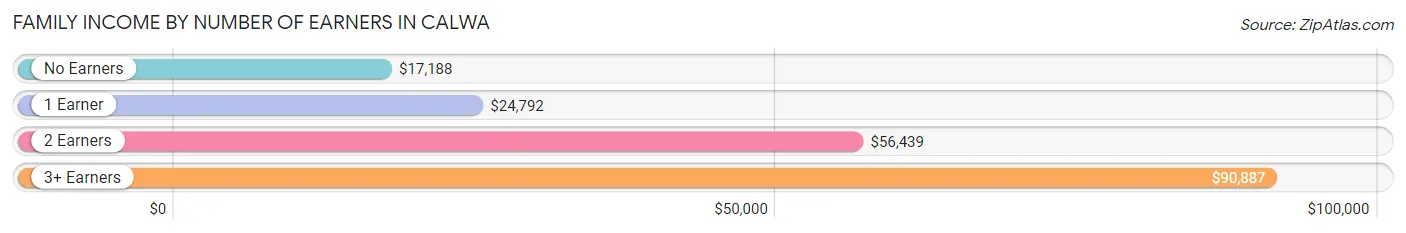
| Number of Earners | # Families | Median Income |
| No Earners | 56 (11.3%) | $17,188 |
| 1 Earner | 124 (25.1%) | $24,792 |
| 2 Earners | 270 (54.7%) | $56,439 |
| 3+ Earners | 44 (8.9%) | $90,887 |
| Total | 494 (100.0%) | $49,676 |
Household Income in Calwa
Household Income Brackets in Calwa
With 126 households falling in the category, the $50,000 to $74,999 income range is the most frequent in Calwa, accounting for 23.1% of all households.
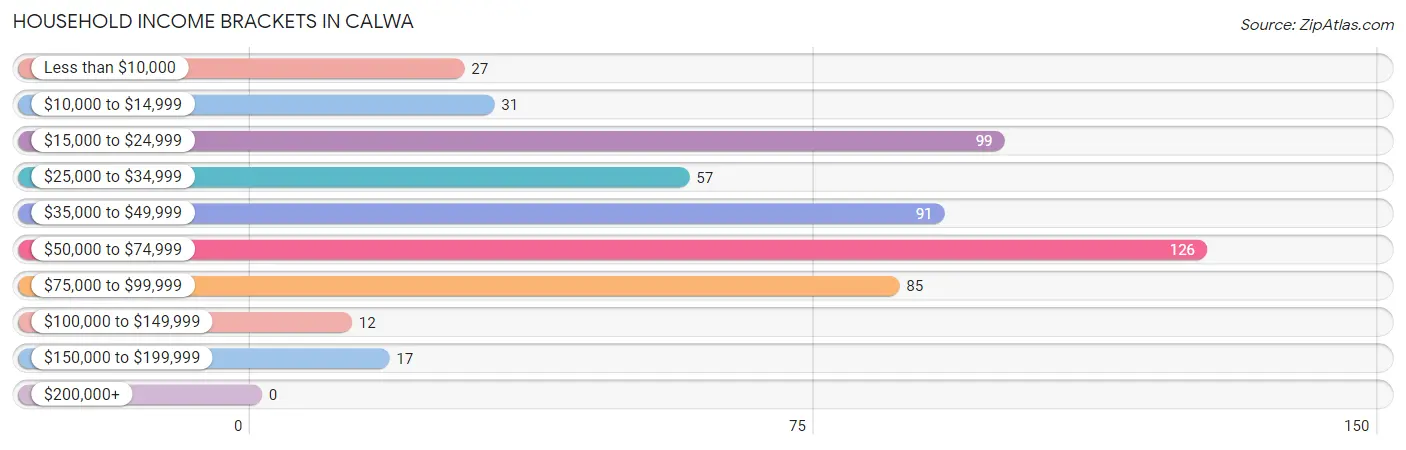
| Income Bracket | # Households | % Households |
| Less than $10,000 | 27 | 5.0% |
| $10,000 to $14,999 | 31 | 5.7% |
| $15,000 to $24,999 | 99 | 18.2% |
| $25,000 to $34,999 | 57 | 10.5% |
| $35,000 to $49,999 | 91 | 16.7% |
| $50,000 to $74,999 | 126 | 23.1% |
| $75,000 to $99,999 | 85 | 15.6% |
| $100,000 to $149,999 | 12 | 2.2% |
| $150,000 to $199,999 | 17 | 3.1% |
| $200,000+ | 0 | 0.0% |
Household Income by Householder Age in Calwa
The median household income in Calwa is $48,495, with the highest median household income of $73,889 found in the 45 to 64 years age bracket for the primary householder. A total of 178 households (32.7%) fall into this category.
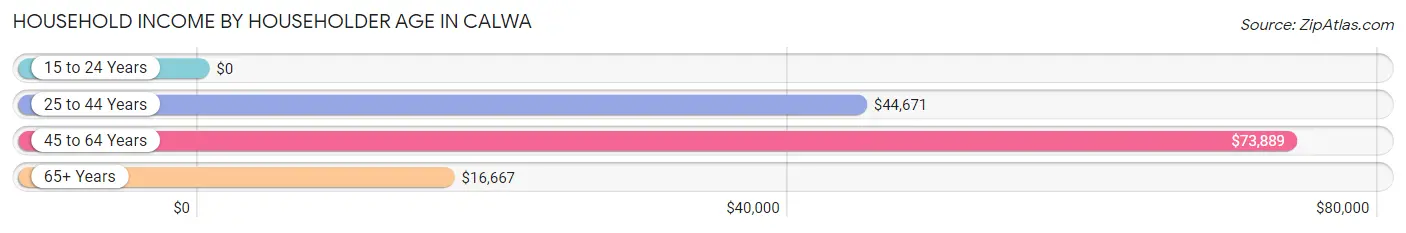
| Income Bracket | # Households | Median Income |
| 15 to 24 Years | 0 (0.0%) | $0 |
| 25 to 44 Years | 299 (54.9%) | $44,671 |
| 45 to 64 Years | 178 (32.7%) | $73,889 |
| 65+ Years | 68 (12.5%) | $16,667 |
| Total | 545 (100.0%) | $48,495 |
Poverty in Calwa
Income Below Poverty by Sex and Age in Calwa
With 38.3% poverty level for males and 41.6% for females among the residents of Calwa, under 5 year old males and 5 year old females are the most vulnerable to poverty, with 80 males (100.0%) and 20 females (100.0%) in their respective age groups living below the poverty level.
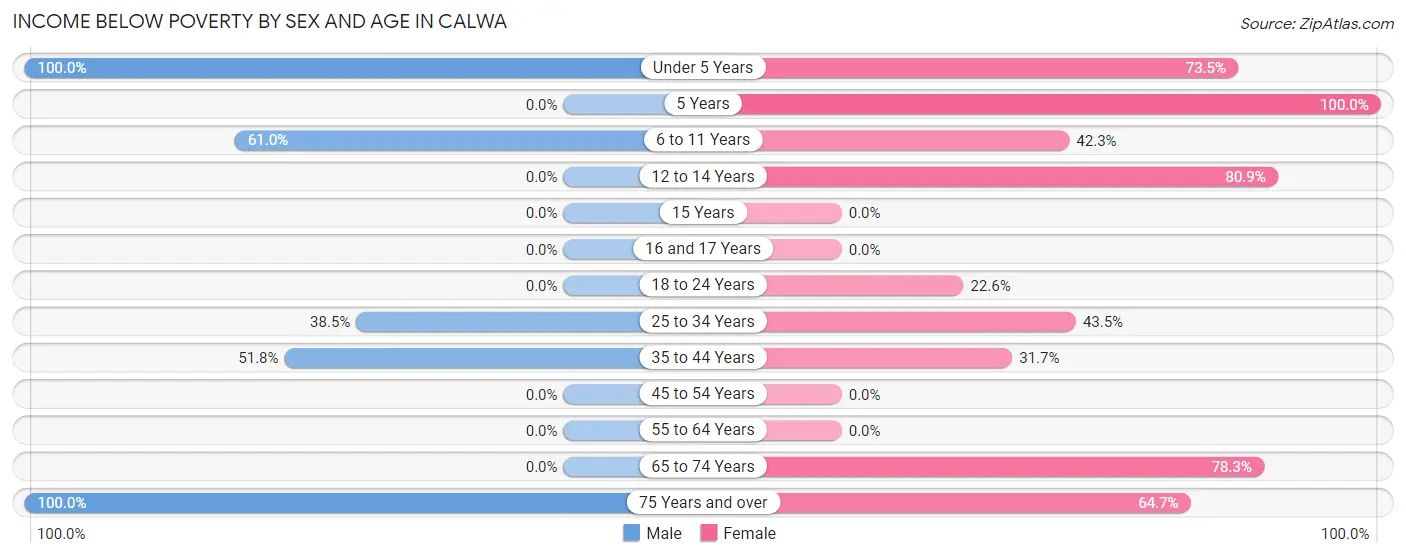
| Age Bracket | Male | Female |
| Under 5 Years | 80 (100.0%) | 172 (73.5%) |
| 5 Years | 0 (0.0%) | 20 (100.0%) |
| 6 to 11 Years | 139 (61.0%) | 60 (42.2%) |
| 12 to 14 Years | 0 (0.0%) | 55 (80.9%) |
| 15 Years | 0 (0.0%) | 0 (0.0%) |
| 16 and 17 Years | 0 (0.0%) | 0 (0.0%) |
| 18 to 24 Years | 0 (0.0%) | 61 (22.6%) |
| 25 to 34 Years | 105 (38.5%) | 123 (43.5%) |
| 35 to 44 Years | 29 (51.8%) | 25 (31.7%) |
| 45 to 54 Years | 0 (0.0%) | 0 (0.0%) |
| 55 to 64 Years | 0 (0.0%) | 0 (0.0%) |
| 65 to 74 Years | 0 (0.0%) | 65 (78.3%) |
| 75 Years and over | 54 (100.0%) | 11 (64.7%) |
| Total | 407 (38.3%) | 592 (41.6%) |
Income Above Poverty by Sex and Age in Calwa
According to the poverty statistics in Calwa, males aged 5 years and females aged 15 years are the age groups that are most secure financially, with 100.0% of males and 100.0% of females in these age groups living above the poverty line.
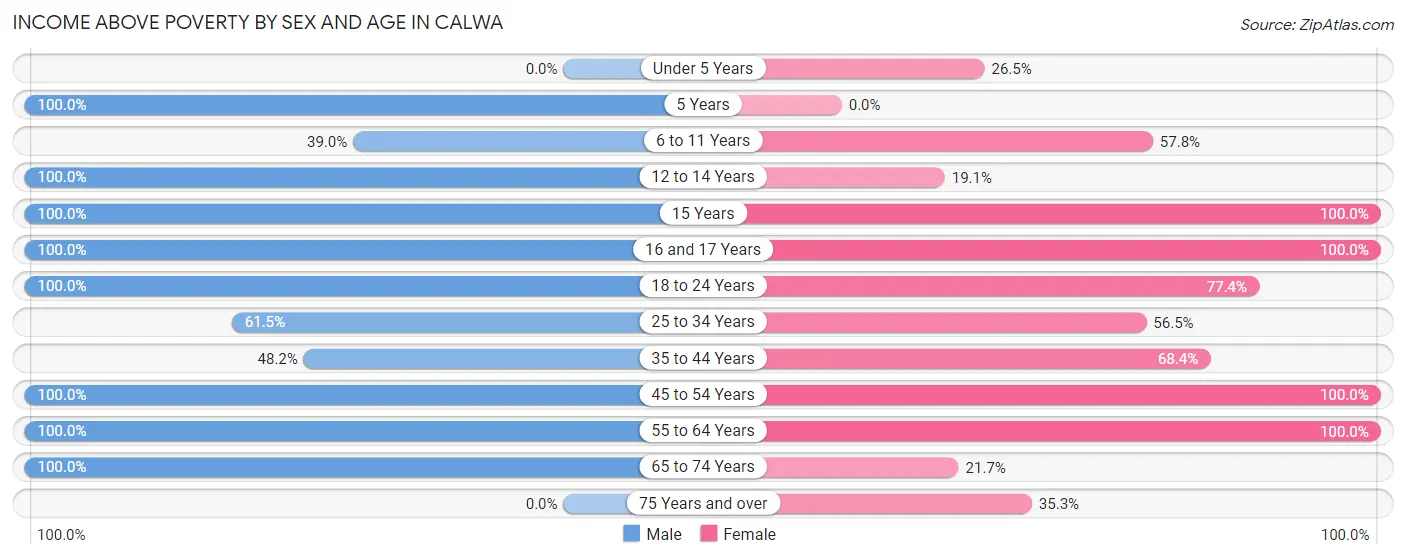
| Age Bracket | Male | Female |
| Under 5 Years | 0 (0.0%) | 62 (26.5%) |
| 5 Years | 37 (100.0%) | 0 (0.0%) |
| 6 to 11 Years | 89 (39.0%) | 82 (57.8%) |
| 12 to 14 Years | 83 (100.0%) | 13 (19.1%) |
| 15 Years | 43 (100.0%) | 14 (100.0%) |
| 16 and 17 Years | 13 (100.0%) | 40 (100.0%) |
| 18 to 24 Years | 43 (100.0%) | 209 (77.4%) |
| 25 to 34 Years | 168 (61.5%) | 160 (56.5%) |
| 35 to 44 Years | 27 (48.2%) | 54 (68.3%) |
| 45 to 54 Years | 124 (100.0%) | 121 (100.0%) |
| 55 to 64 Years | 8 (100.0%) | 53 (100.0%) |
| 65 to 74 Years | 20 (100.0%) | 18 (21.7%) |
| 75 Years and over | 0 (0.0%) | 6 (35.3%) |
| Total | 655 (61.7%) | 832 (58.4%) |
Income Below Poverty Among Married-Couple Families in Calwa
The poverty statistics for married-couple families in Calwa show that 10.9% or 31 of the total 284 families live below the poverty line. Families with no children have the highest poverty rate of 51.7%, comprising of 31 families. On the other hand, families with 1 or 2 children have the lowest poverty rate of 0.0%, which includes 0 families.
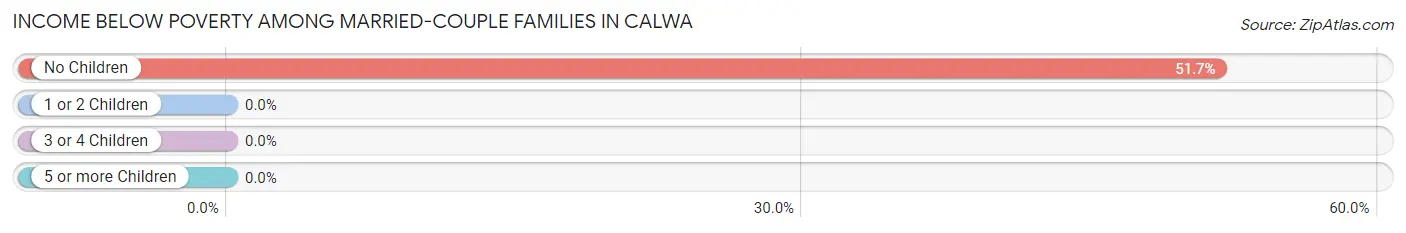
| Children | Above Poverty | Below Poverty |
| No Children | 29 (48.3%) | 31 (51.7%) |
| 1 or 2 Children | 177 (100.0%) | 0 (0.0%) |
| 3 or 4 Children | 47 (100.0%) | 0 (0.0%) |
| 5 or more Children | 0 (0.0%) | 0 (0.0%) |
| Total | 253 (89.1%) | 31 (10.9%) |
Income Below Poverty Among Single-Parent Households in Calwa
According to the poverty data in Calwa, 60.4% or 29 single-father households and 51.2% or 83 single-mother households are living below the poverty line. Among single-father households, those with 5 or more children have the highest poverty rate, with 29 households (100.0%) experiencing poverty. Likewise, among single-mother households, those with 3 or 4 children have the highest poverty rate, with 24 households (100.0%) falling below the poverty line.
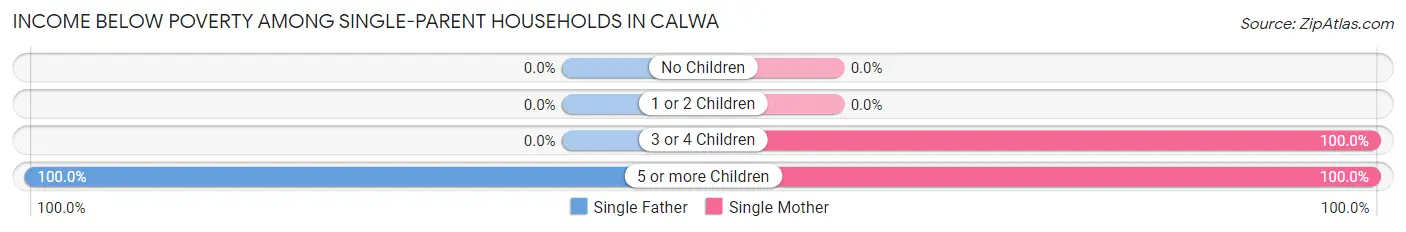
| Children | Single Father | Single Mother |
| No Children | 0 (0.0%) | 0 (0.0%) |
| 1 or 2 Children | 0 (0.0%) | 0 (0.0%) |
| 3 or 4 Children | 0 (0.0%) | 24 (100.0%) |
| 5 or more Children | 29 (100.0%) | 59 (100.0%) |
| Total | 29 (60.4%) | 83 (51.2%) |
Income Below Poverty Among Married-Couple vs Single-Parent Households in Calwa
The poverty data for Calwa shows that 31 of the married-couple family households (10.9%) and 112 of the single-parent households (53.3%) are living below the poverty level. Within the married-couple family households, those with no children have the highest poverty rate, with 31 households (51.7%) falling below the poverty line. Among the single-parent households, those with 3 or 4 children have the highest poverty rate, with 24 household (100.0%) living below poverty.
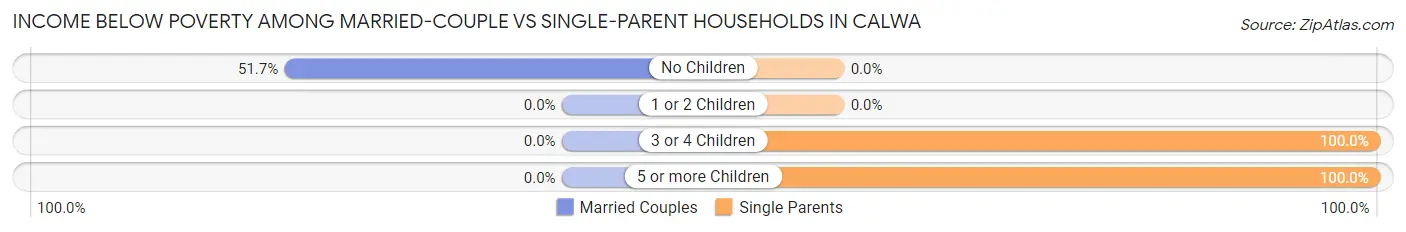
| Children | Married-Couple Families | Single-Parent Households |
| No Children | 31 (51.7%) | 0 (0.0%) |
| 1 or 2 Children | 0 (0.0%) | 0 (0.0%) |
| 3 or 4 Children | 0 (0.0%) | 24 (100.0%) |
| 5 or more Children | 0 (0.0%) | 88 (100.0%) |
| Total | 31 (10.9%) | 112 (53.3%) |
Race in Calwa
The most populous races in Calwa are Hispanic or Latino (2,202 | 88.6%), Some other Race (1,201 | 48.3%), and White / Caucasian (872 | 35.1%).
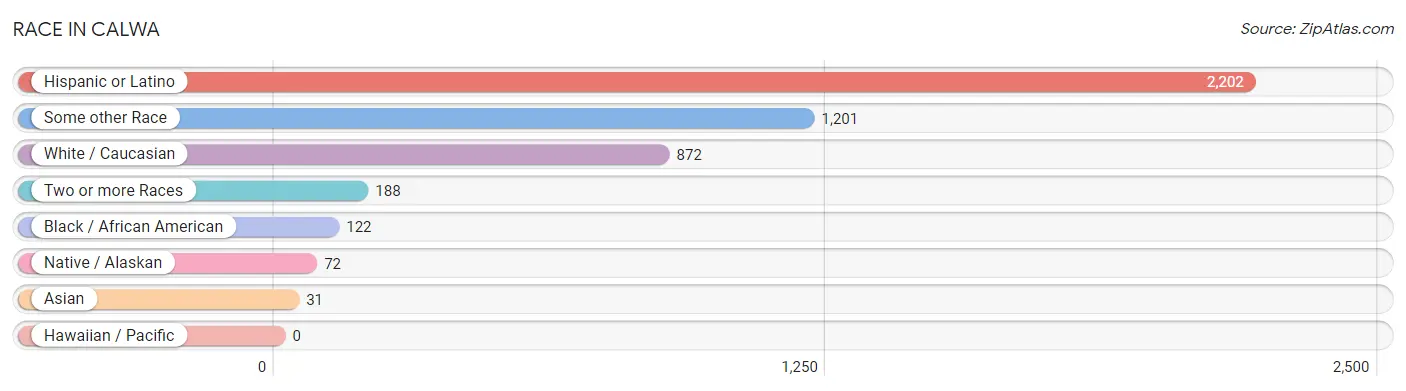
| Race | # Population | % Population |
| Asian | 31 | 1.3% |
| Black / African American | 122 | 4.9% |
| Hawaiian / Pacific | 0 | 0.0% |
| Hispanic or Latino | 2,202 | 88.6% |
| Native / Alaskan | 72 | 2.9% |
| White / Caucasian | 872 | 35.1% |
| Two or more Races | 188 | 7.6% |
| Some other Race | 1,201 | 48.3% |
| Total | 2,486 | 100.0% |
Ancestry in Calwa
The most populous ancestries reported in Calwa are Mexican (2,132 | 85.8%), Irish (210 | 8.5%), Mexican American Indian (72 | 2.9%), Central American (50 | 2.0%), and Guatemalan (50 | 2.0%), together accounting for 101.1% of all Calwa residents.
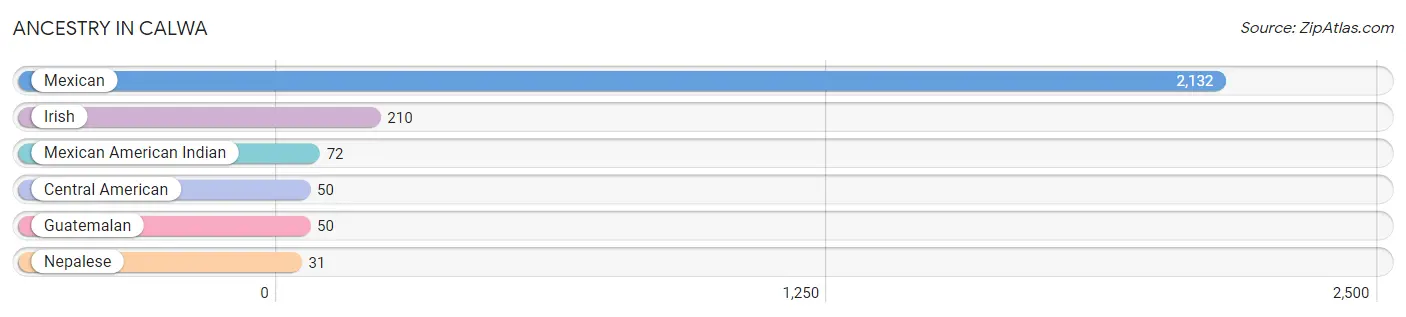
| Ancestry | # Population | % Population |
| Central American | 50 | 2.0% |
| Guatemalan | 50 | 2.0% |
| Irish | 210 | 8.5% |
| Mexican | 2,132 | 85.8% |
| Mexican American Indian | 72 | 2.9% |
| Nepalese | 31 | 1.3% | View All 6 Rows |
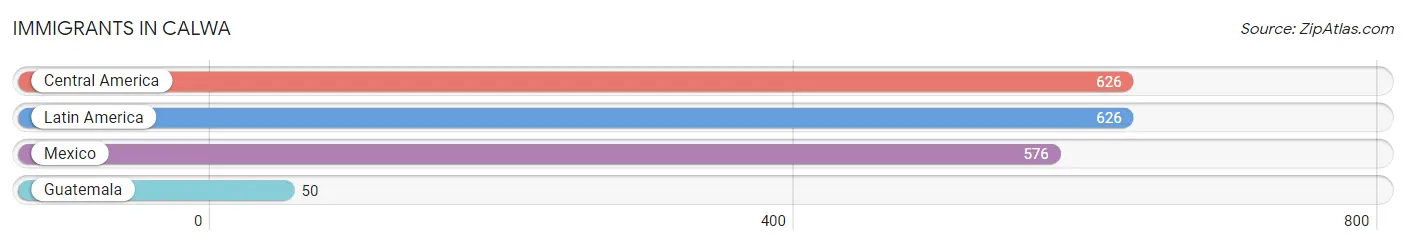
Immigrants in Calwa
The most numerous immigrant groups reported in Calwa came from Central America (626 | 25.2%), Latin America (626 | 25.2%), Mexico (576 | 23.2%), and Guatemala (50 | 2.0%), together accounting for 75.5% of all Calwa residents.
| Immigration Origin | # Population | % Population |
| Central America | 626 | 25.2% |
| Guatemala | 50 | 2.0% |
| Latin America | 626 | 25.2% |
| Mexico | 576 | 23.2% | View All 4 Rows |
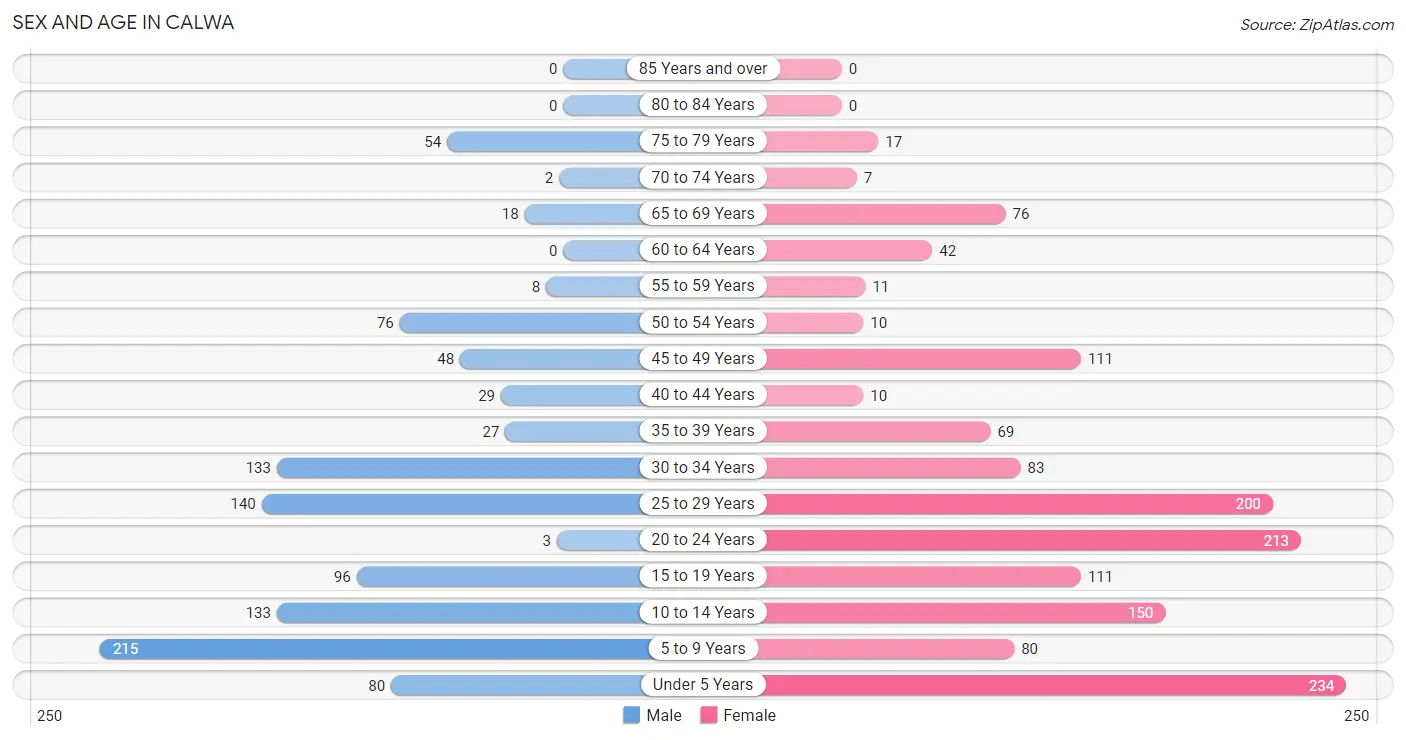
Sex and Age in Calwa
Sex and Age in Calwa
The most populous age groups in Calwa are 5 to 9 Years (215 | 20.2%) for men and Under 5 Years (234 | 16.4%) for women.
| Age Bracket | Male | Female |
| Under 5 Years | 80 (7.5%) | 234 (16.4%) |
| 5 to 9 Years | 215 (20.2%) | 80 (5.6%) |
| 10 to 14 Years | 133 (12.5%) | 150 (10.5%) |
| 15 to 19 Years | 96 (9.0%) | 111 (7.8%) |
| 20 to 24 Years | 3 (0.3%) | 213 (15.0%) |
| 25 to 29 Years | 140 (13.2%) | 200 (14.0%) |
| 30 to 34 Years | 133 (12.5%) | 83 (5.8%) |
| 35 to 39 Years | 27 (2.5%) | 69 (4.9%) |
| 40 to 44 Years | 29 (2.7%) | 10 (0.7%) |
| 45 to 49 Years | 48 (4.5%) | 111 (7.8%) |
| 50 to 54 Years | 76 (7.2%) | 10 (0.7%) |
| 55 to 59 Years | 8 (0.7%) | 11 (0.8%) |
| 60 to 64 Years | 0 (0.0%) | 42 (2.9%) |
| 65 to 69 Years | 18 (1.7%) | 76 (5.3%) |
| 70 to 74 Years | 2 (0.2%) | 7 (0.5%) |
| 75 to 79 Years | 54 (5.1%) | 17 (1.2%) |
| 80 to 84 Years | 0 (0.0%) | 0 (0.0%) |
| 85 Years and over | 0 (0.0%) | 0 (0.0%) |
| Total | 1,062 (100.0%) | 1,424 (100.0%) |
Families and Households in Calwa
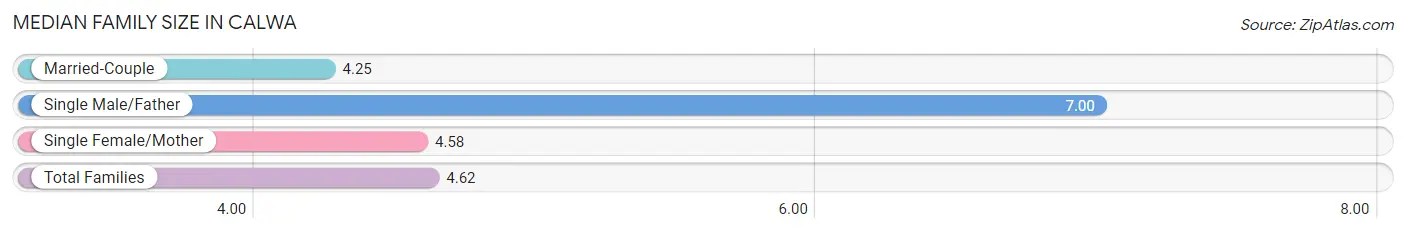
Median Family Size in Calwa
The median family size in Calwa is 4.62 persons per family, with single male/father families (48 | 9.7%) accounting for the largest median family size of 7 persons per family. On the other hand, married-couple families (284 | 57.5%) represent the smallest median family size with 4.25 persons per family.
| Family Type | # Families | Family Size |
| Married-Couple | 284 (57.5%) | 4.25 |
| Single Male/Father | 48 (9.7%) | 7.00 |
| Single Female/Mother | 162 (32.8%) | 4.58 |
| Total Families | 494 (100.0%) | 4.62 |
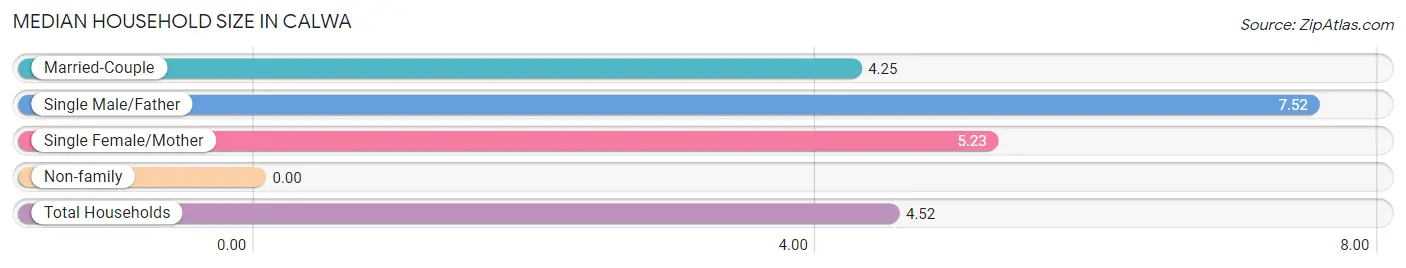
Median Household Size in Calwa
| Household Type | # Households | Household Size |
| Married-Couple | 284 (52.1%) | 4.25 |
| Single Male/Father | 48 (8.8%) | 7.52 |
| Single Female/Mother | 162 (29.7%) | 5.23 |
| Non-family | 51 (9.4%) | - |
| Total Households | 545 (100.0%) | 4.52 |
Household Size by Marriage Status in Calwa
Out of a total of 545 households in Calwa, 494 (90.6%) are family households, while 51 (9.4%) are nonfamily households. The most numerous type of family households are 3-person households, comprising 114, and the most common type of nonfamily households are 1-person households, comprising 51.
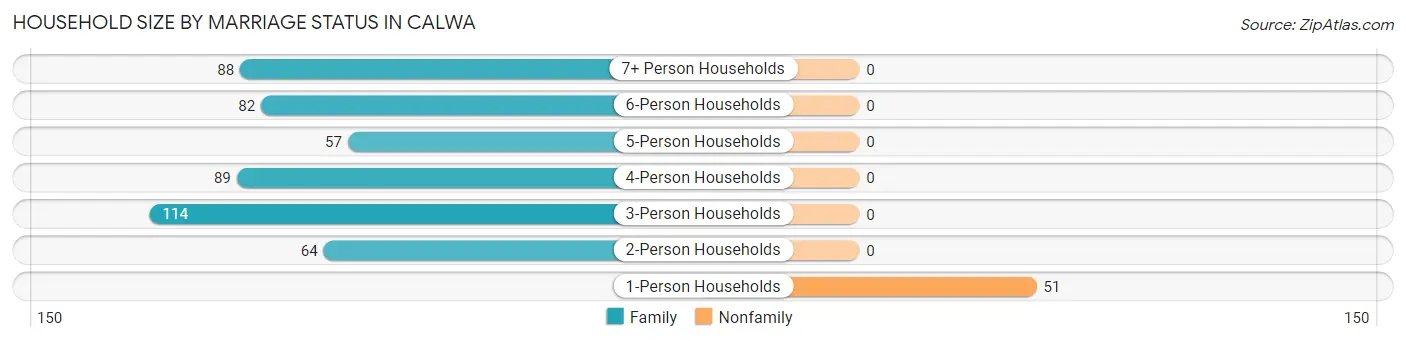
| Household Size | Family Households | Nonfamily Households |
| 1-Person Households | - | 51 (9.4%) |
| 2-Person Households | 64 (11.7%) | 0 (0.0%) |
| 3-Person Households | 114 (20.9%) | 0 (0.0%) |
| 4-Person Households | 89 (16.3%) | 0 (0.0%) |
| 5-Person Households | 57 (10.5%) | 0 (0.0%) |
| 6-Person Households | 82 (15.0%) | 0 (0.0%) |
| 7+ Person Households | 88 (16.2%) | 0 (0.0%) |
| Total | 494 (90.6%) | 51 (9.4%) |
Female Fertility in Calwa
Fertility by Age in Calwa
Average fertility rate in Calwa is 118.0 births per 1,000 women. Women in the age bracket of 20 to 34 years have the highest fertility rate with 167.0 births per 1,000 women. Women in the age bracket of 20 to 34 years acount for 88.3% of all women with births.
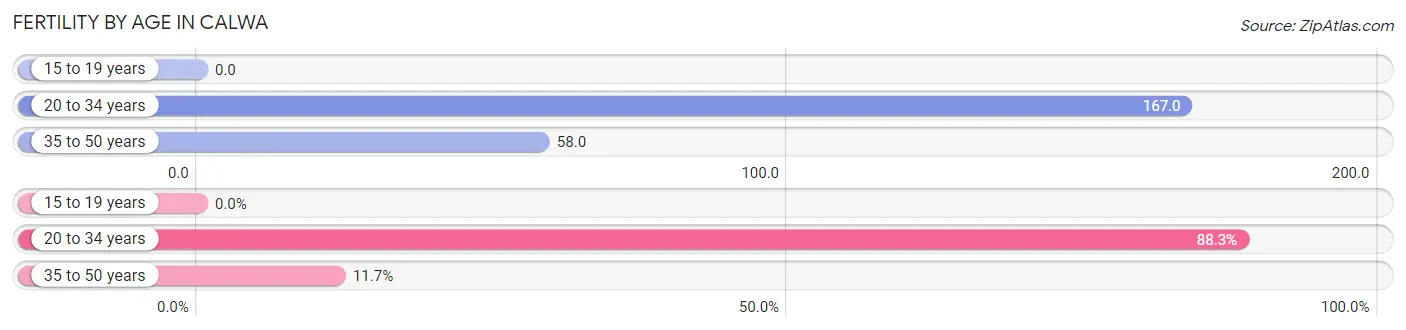
| Age Bracket | Women with Births | Births / 1,000 Women |
| 15 to 19 years | 0 (0.0%) | 0.0 |
| 20 to 34 years | 83 (88.3%) | 167.0 |
| 35 to 50 years | 11 (11.7%) | 58.0 |
| Total | 94 (100.0%) | 118.0 |
Fertility by Age by Marriage Status in Calwa
11.7% of women with births (94) in Calwa are married. The highest percentage of unmarried women with births falls into 20 to 34 years age bracket with 100.0% of them unmarried at the time of birth, while the lowest percentage of unmarried women with births belong to 35 to 50 years age bracket with 0.0% of them unmarried.
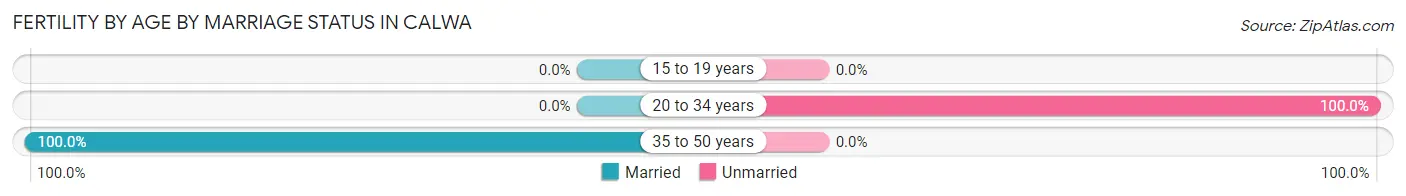
| Age Bracket | Married | Unmarried |
| 15 to 19 years | 0 (0.0%) | 0 (0.0%) |
| 20 to 34 years | 0 (0.0%) | 83 (100.0%) |
| 35 to 50 years | 11 (100.0%) | 0 (0.0%) |
| Total | 11 (11.7%) | 83 (88.3%) |
Fertility by Education in Calwa
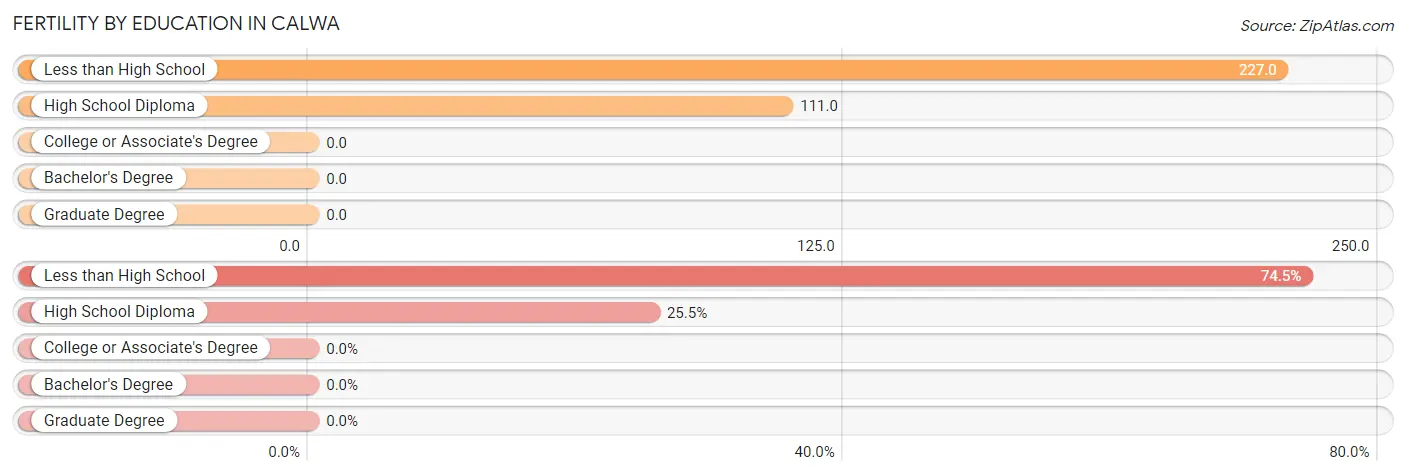
| Educational Attainment | Women with Births | Births / 1,000 Women |
| Less than High School | 70 (74.5%) | 227.0 |
| High School Diploma | 24 (25.5%) | 111.0 |
| College or Associate's Degree | 0 (0.0%) | 0.0 |
| Bachelor's Degree | 0 (0.0%) | 0.0 |
| Graduate Degree | 0 (0.0%) | 0.0 |
| Total | 94 (100.0%) | 118.0 |
Fertility by Education by Marriage Status in Calwa
88.3% of women with births in Calwa are unmarried. Women with the educational attainment of less than high school are most likely to be married with 15.7% of them married at childbirth, while women with the educational attainment of high school diploma are least likely to be married with 100.0% of them unmarried at childbirth.
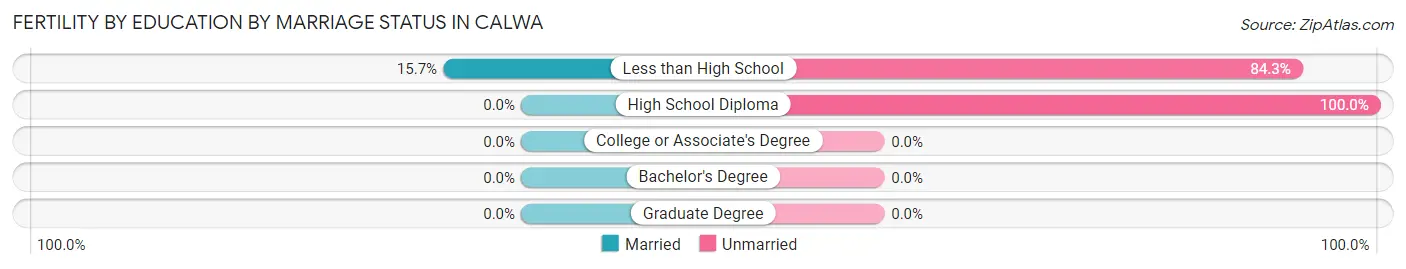
| Educational Attainment | Married | Unmarried |
| Less than High School | 11 (15.7%) | 59 (84.3%) |
| High School Diploma | 0 (0.0%) | 24 (100.0%) |
| College or Associate's Degree | 0 (0.0%) | 0 (0.0%) |
| Bachelor's Degree | 0 (0.0%) | 0 (0.0%) |
| Graduate Degree | 0 (0.0%) | 0 (0.0%) |
| Total | 11 (11.7%) | 83 (88.3%) |
Employment Characteristics in Calwa
Employment by Class of Employer in Calwa
Among the 643 employed individuals in Calwa, private company employees (569 | 88.5%), self-employed (not incorporated) (29 | 4.5%), and local government employees (18 | 2.8%) make up the most common classes of employment.
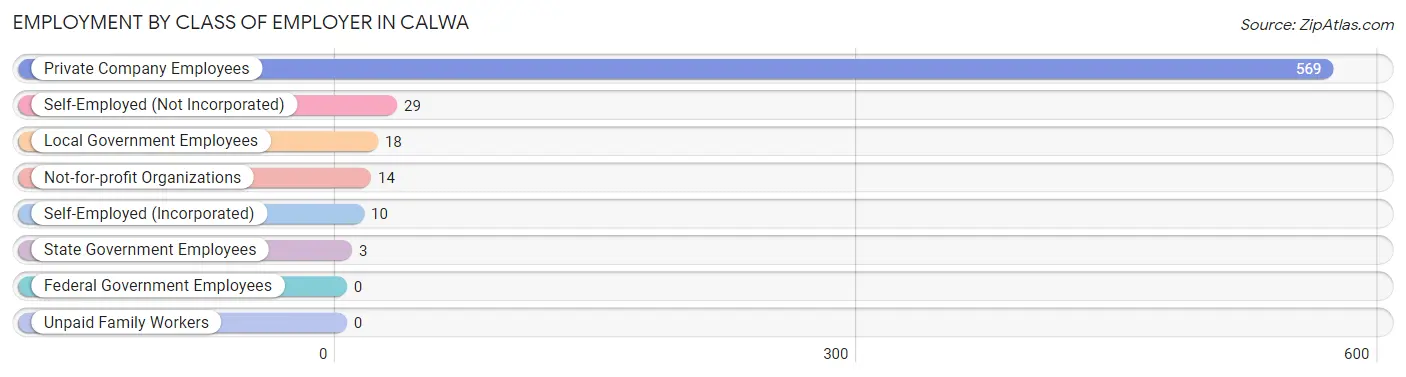
| Employer Class | # Employees | % Employees |
| Private Company Employees | 569 | 88.5% |
| Self-Employed (Incorporated) | 10 | 1.6% |
| Self-Employed (Not Incorporated) | 29 | 4.5% |
| Not-for-profit Organizations | 14 | 2.2% |
| Local Government Employees | 18 | 2.8% |
| State Government Employees | 3 | 0.5% |
| Federal Government Employees | 0 | 0.0% |
| Unpaid Family Workers | 0 | 0.0% |
| Total | 643 | 100.0% |
Employment Status by Age in Calwa
According to the labor force statistics for Calwa, out of the total population over 16 years of age (1,537), 60.5% or 930 individuals are in the labor force, with 23.2% or 216 of them unemployed. The age group with the highest labor force participation rate is 30 to 34 years, with 100.0% or 216 individuals in the labor force. Within the labor force, the 30 to 34 years age range has the highest percentage of unemployed individuals, with 32.9% or 71 of them being unemployed.
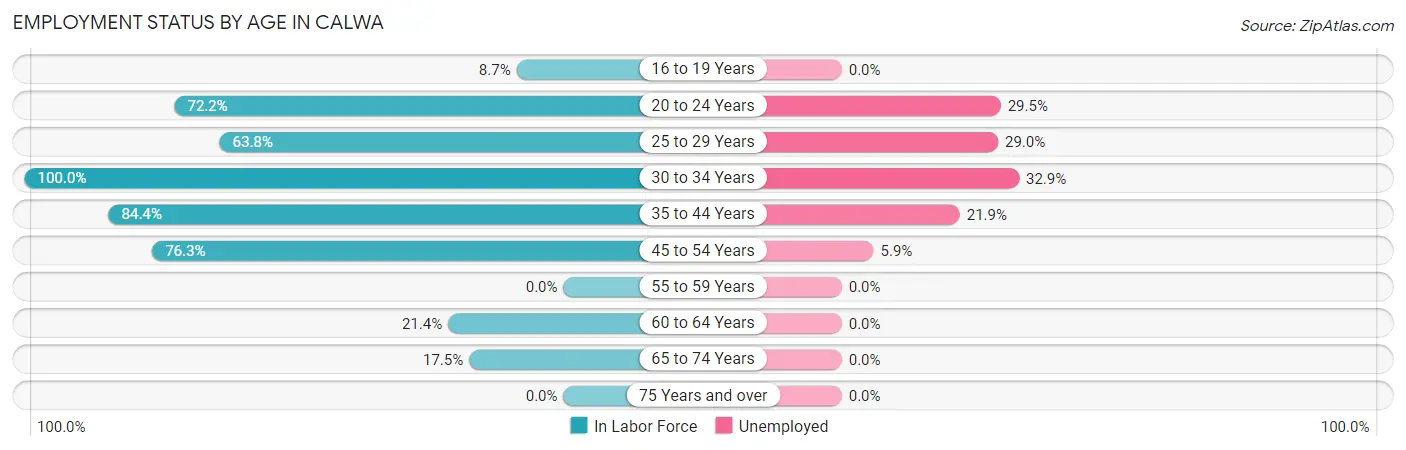
| Age Bracket | In Labor Force | Unemployed |
| 16 to 19 Years | 13 (8.7%) | 0 (0.0%) |
| 20 to 24 Years | 156 (72.2%) | 46 (29.5%) |
| 25 to 29 Years | 217 (63.8%) | 63 (29.0%) |
| 30 to 34 Years | 216 (100.0%) | 71 (32.9%) |
| 35 to 44 Years | 114 (84.4%) | 25 (21.9%) |
| 45 to 54 Years | 187 (76.3%) | 11 (5.9%) |
| 55 to 59 Years | 0 (0.0%) | 0 (0.0%) |
| 60 to 64 Years | 9 (21.4%) | 0 (0.0%) |
| 65 to 74 Years | 18 (17.5%) | 0 (0.0%) |
| 75 Years and over | 0 (0.0%) | 0 (0.0%) |
| Total | 930 (60.5%) | 216 (23.2%) |
Employment Status by Educational Attainment in Calwa
According to labor force statistics for Calwa, 74.5% of individuals (743) out of the total population between 25 and 64 years of age (997) are in the labor force, with 22.9% or 170 of them being unemployed. The group with the highest labor force participation rate are those with the educational attainment of college / associate degree, with 80.3% or 191 individuals in the labor force. Within the labor force, individuals with high school diploma education have the highest percentage of unemployment, with 27.9% or 62 of them being unemployed.
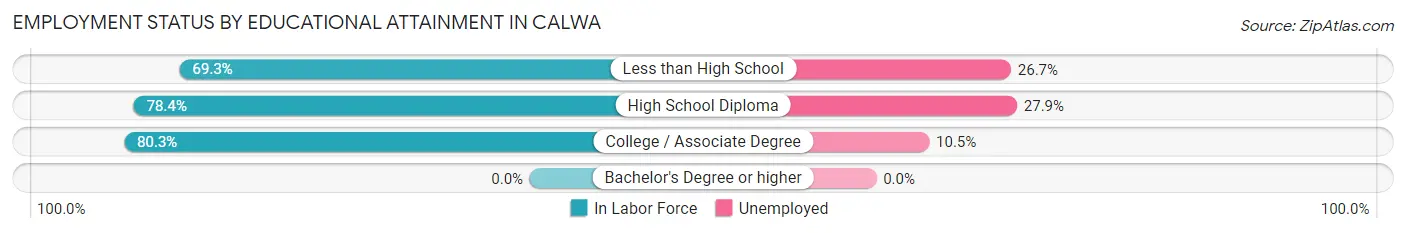
| Educational Attainment | In Labor Force | Unemployed |
| Less than High School | 330 (69.3%) | 127 (26.7%) |
| High School Diploma | 222 (78.4%) | 79 (27.9%) |
| College / Associate Degree | 191 (80.3%) | 25 (10.5%) |
| Bachelor's Degree or higher | 0 (0.0%) | 0 (0.0%) |
| Total | 743 (74.5%) | 228 (22.9%) |
Employment Occupations by Sex in Calwa
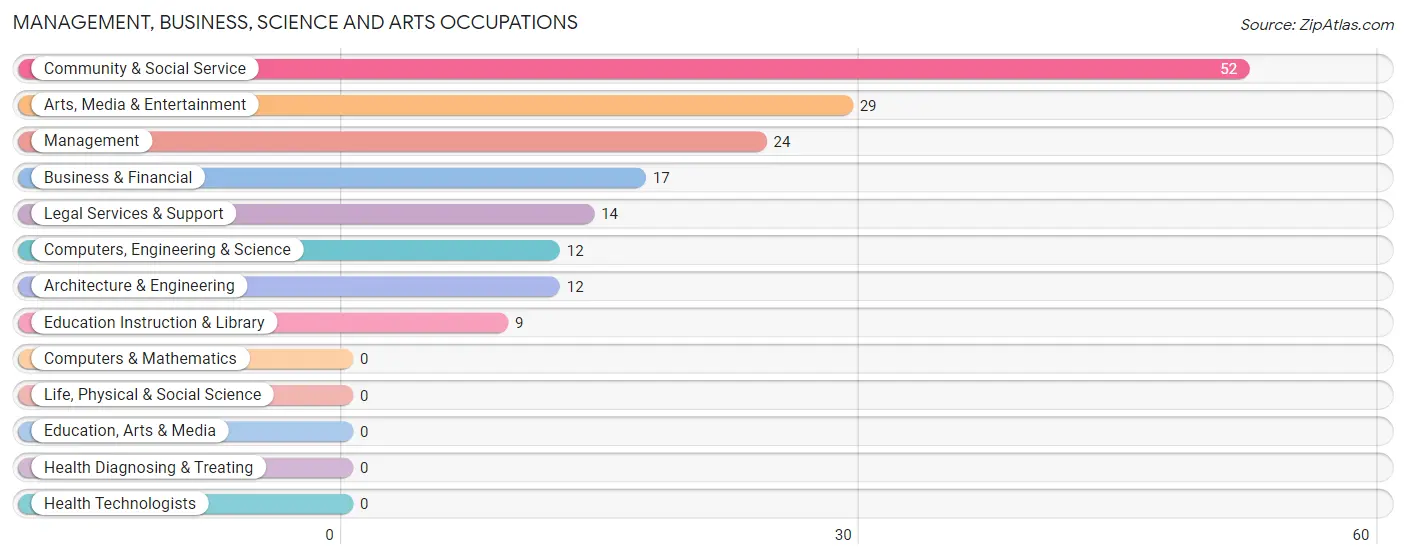
Management, Business, Science and Arts Occupations
The most common Management, Business, Science and Arts occupations in Calwa are Community & Social Service (52 | 7.3%), Arts, Media & Entertainment (29 | 4.1%), Management (24 | 3.4%), Business & Financial (17 | 2.4%), and Legal Services & Support (14 | 2.0%).
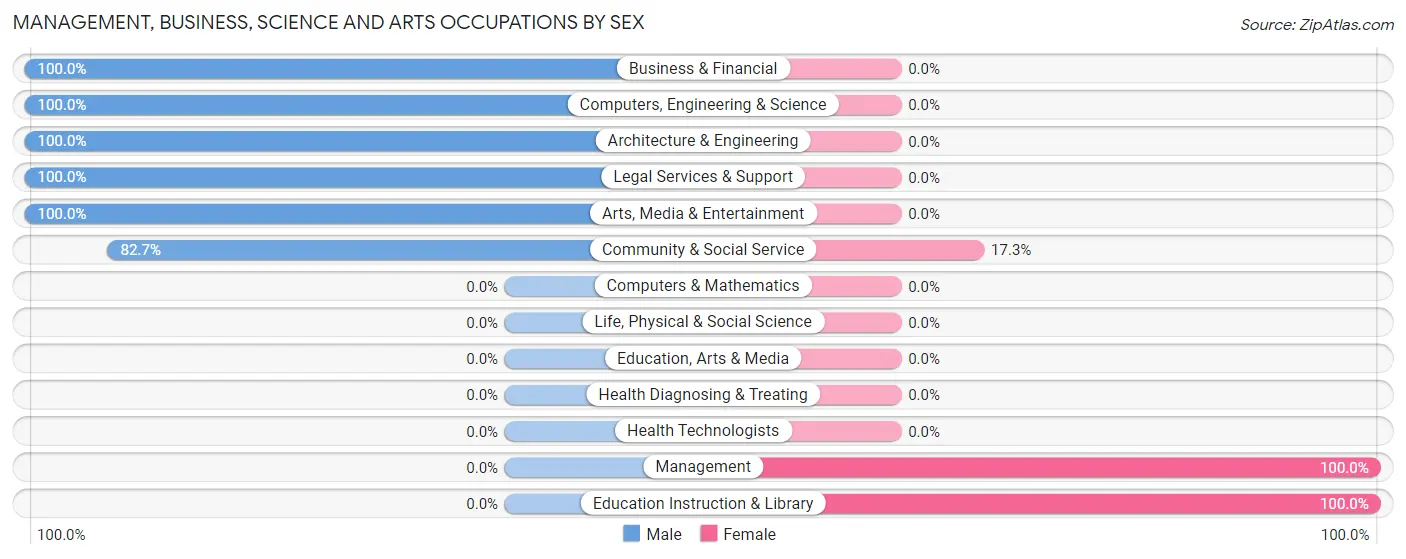
Management, Business, Science and Arts Occupations by Sex
Within the Management, Business, Science and Arts occupations in Calwa, the most male-oriented occupations are Business & Financial (100.0%), Computers, Engineering & Science (100.0%), and Architecture & Engineering (100.0%), while the most female-oriented occupations are Management (100.0%), Education Instruction & Library (100.0%), and Community & Social Service (17.3%).
| Occupation | Male | Female |
| Management | 0 (0.0%) | 24 (100.0%) |
| Business & Financial | 17 (100.0%) | 0 (0.0%) |
| Computers, Engineering & Science | 12 (100.0%) | 0 (0.0%) |
| Computers & Mathematics | 0 (0.0%) | 0 (0.0%) |
| Architecture & Engineering | 12 (100.0%) | 0 (0.0%) |
| Life, Physical & Social Science | 0 (0.0%) | 0 (0.0%) |
| Community & Social Service | 43 (82.7%) | 9 (17.3%) |
| Education, Arts & Media | 0 (0.0%) | 0 (0.0%) |
| Legal Services & Support | 14 (100.0%) | 0 (0.0%) |
| Education Instruction & Library | 0 (0.0%) | 9 (100.0%) |
| Arts, Media & Entertainment | 29 (100.0%) | 0 (0.0%) |
| Health Diagnosing & Treating | 0 (0.0%) | 0 (0.0%) |
| Health Technologists | 0 (0.0%) | 0 (0.0%) |
| Total (Category) | 72 (68.6%) | 33 (31.4%) |
| Total (Overall) | 317 (44.4%) | 397 (55.6%) |
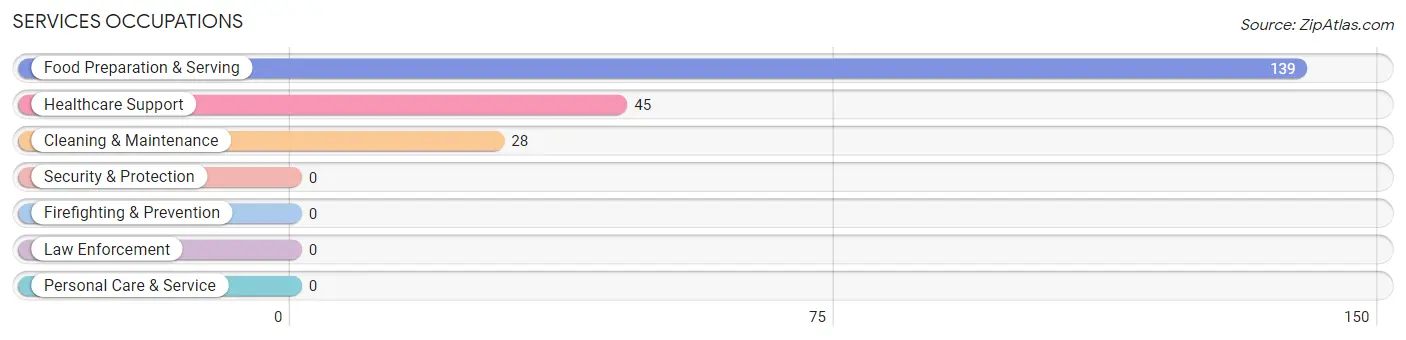
Services Occupations
The most common Services occupations in Calwa are Food Preparation & Serving (139 | 19.5%), Healthcare Support (45 | 6.3%), and Cleaning & Maintenance (28 | 3.9%).
Services Occupations by Sex
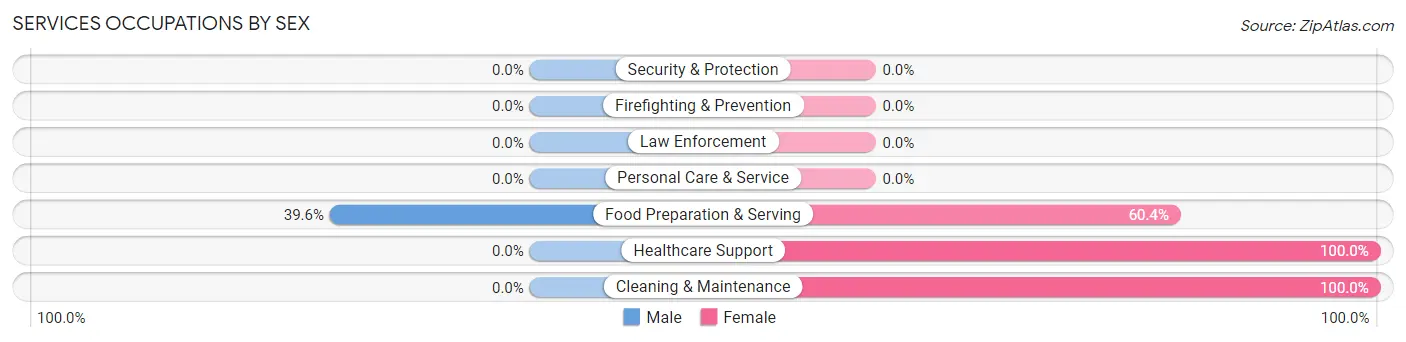
| Occupation | Male | Female |
| Healthcare Support | 0 (0.0%) | 45 (100.0%) |
| Security & Protection | 0 (0.0%) | 0 (0.0%) |
| Firefighting & Prevention | 0 (0.0%) | 0 (0.0%) |
| Law Enforcement | 0 (0.0%) | 0 (0.0%) |
| Food Preparation & Serving | 55 (39.6%) | 84 (60.4%) |
| Cleaning & Maintenance | 0 (0.0%) | 28 (100.0%) |
| Personal Care & Service | 0 (0.0%) | 0 (0.0%) |
| Total (Category) | 55 (25.9%) | 157 (74.1%) |
| Total (Overall) | 317 (44.4%) | 397 (55.6%) |
Sales and Office Occupations
The most common Sales and Office occupations in Calwa are Sales & Related (59 | 8.3%), and Office & Administration (32 | 4.5%).
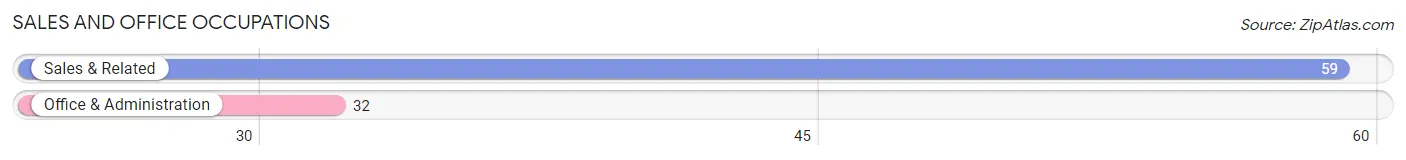
Sales and Office Occupations by Sex
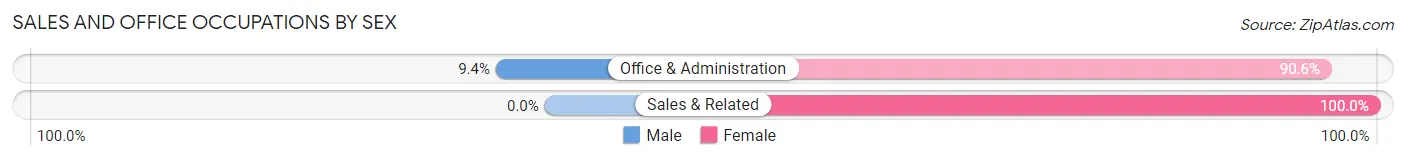
| Occupation | Male | Female |
| Sales & Related | 0 (0.0%) | 59 (100.0%) |
| Office & Administration | 3 (9.4%) | 29 (90.6%) |
| Total (Category) | 3 (3.3%) | 88 (96.7%) |
| Total (Overall) | 317 (44.4%) | 397 (55.6%) |
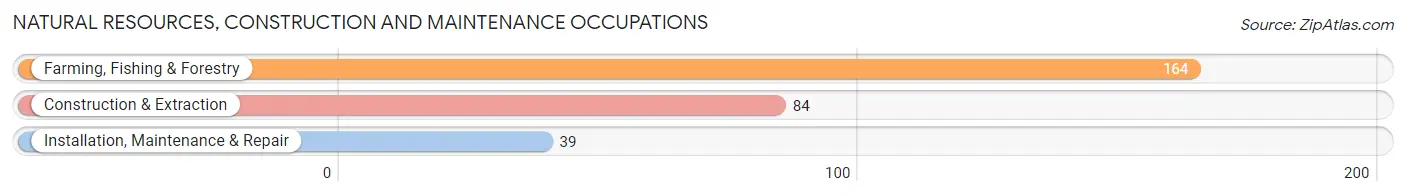
Natural Resources, Construction and Maintenance Occupations
The most common Natural Resources, Construction and Maintenance occupations in Calwa are Farming, Fishing & Forestry (164 | 23.0%), Construction & Extraction (84 | 11.8%), and Installation, Maintenance & Repair (39 | 5.5%).
Natural Resources, Construction and Maintenance Occupations by Sex
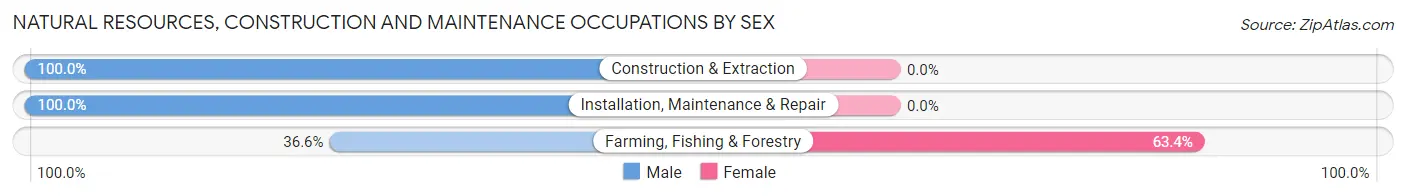
| Occupation | Male | Female |
| Farming, Fishing & Forestry | 60 (36.6%) | 104 (63.4%) |
| Construction & Extraction | 84 (100.0%) | 0 (0.0%) |
| Installation, Maintenance & Repair | 39 (100.0%) | 0 (0.0%) |
| Total (Category) | 183 (63.8%) | 104 (36.2%) |
| Total (Overall) | 317 (44.4%) | 397 (55.6%) |
Production, Transportation and Moving Occupations
The most common Production, Transportation and Moving occupations in Calwa are Transportation (15 | 2.1%), and Material Moving (4 | 0.6%).
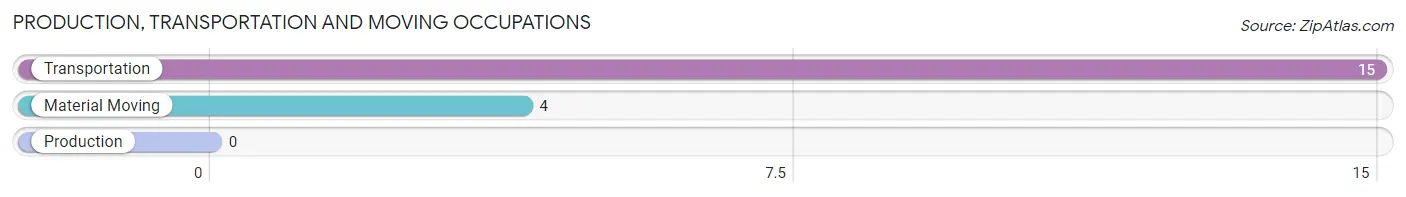
Production, Transportation and Moving Occupations by Sex
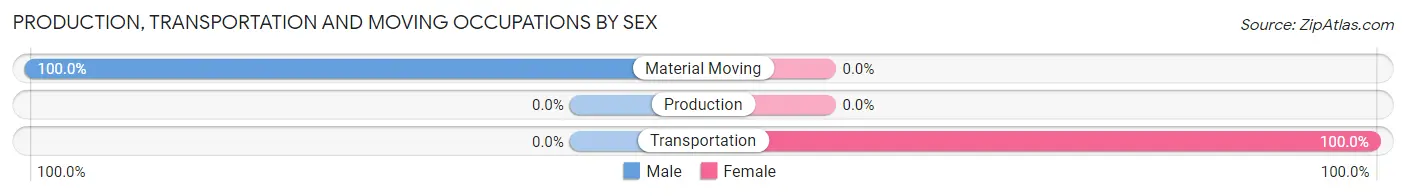
| Occupation | Male | Female |
| Production | 0 (0.0%) | 0 (0.0%) |
| Transportation | 0 (0.0%) | 15 (100.0%) |
| Material Moving | 4 (100.0%) | 0 (0.0%) |
| Total (Category) | 4 (21.0%) | 15 (78.9%) |
| Total (Overall) | 317 (44.4%) | 397 (55.6%) |
Employment Industries by Sex in Calwa
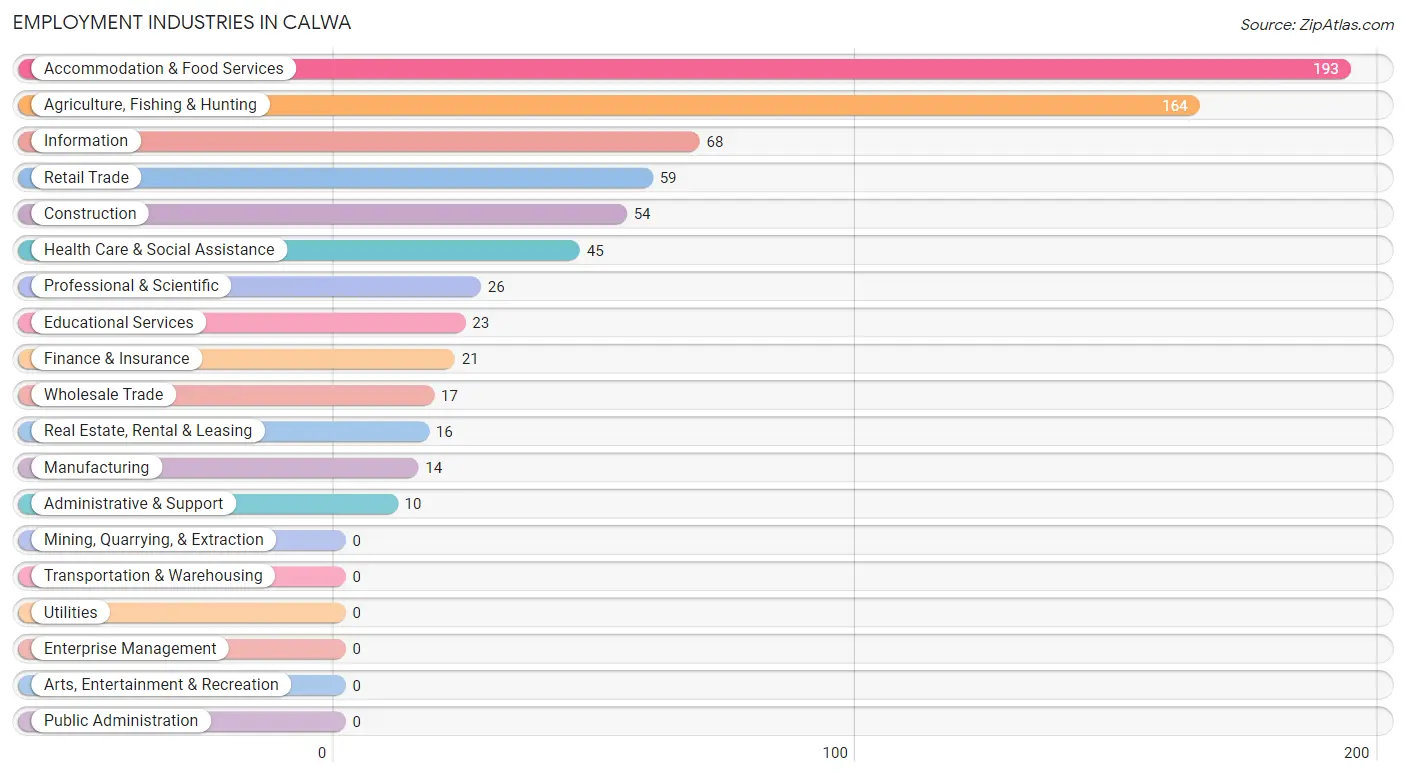
Employment Industries in Calwa
The major employment industries in Calwa include Accommodation & Food Services (193 | 27.0%), Agriculture, Fishing & Hunting (164 | 23.0%), Information (68 | 9.5%), Retail Trade (59 | 8.3%), and Construction (54 | 7.6%).
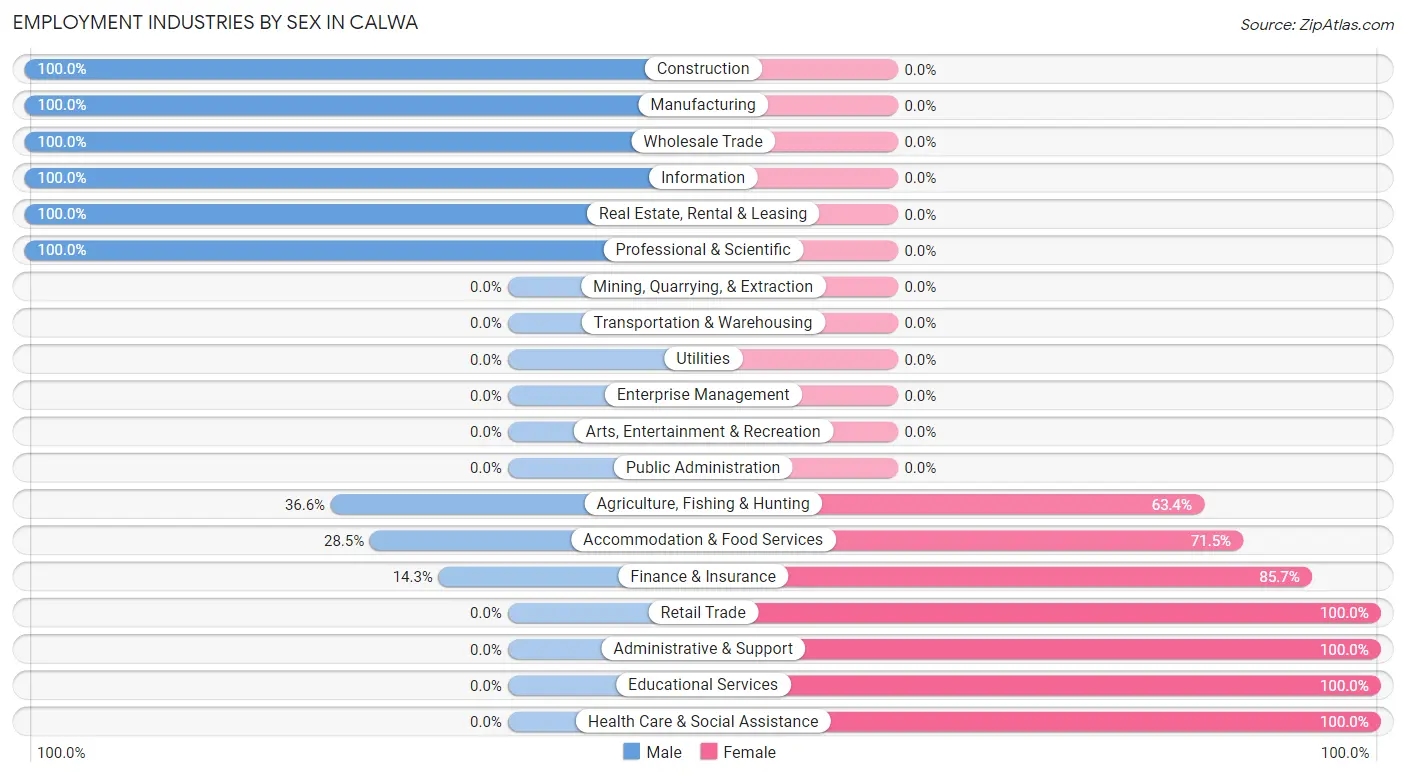
Employment Industries by Sex in Calwa
The Calwa industries that see more men than women are Construction (100.0%), Manufacturing (100.0%), and Wholesale Trade (100.0%), whereas the industries that tend to have a higher number of women are Retail Trade (100.0%), Administrative & Support (100.0%), and Educational Services (100.0%).
| Industry | Male | Female |
| Agriculture, Fishing & Hunting | 60 (36.6%) | 104 (63.4%) |
| Mining, Quarrying, & Extraction | 0 (0.0%) | 0 (0.0%) |
| Construction | 54 (100.0%) | 0 (0.0%) |
| Manufacturing | 14 (100.0%) | 0 (0.0%) |
| Wholesale Trade | 17 (100.0%) | 0 (0.0%) |
| Retail Trade | 0 (0.0%) | 59 (100.0%) |
| Transportation & Warehousing | 0 (0.0%) | 0 (0.0%) |
| Utilities | 0 (0.0%) | 0 (0.0%) |
| Information | 68 (100.0%) | 0 (0.0%) |
| Finance & Insurance | 3 (14.3%) | 18 (85.7%) |
| Real Estate, Rental & Leasing | 16 (100.0%) | 0 (0.0%) |
| Professional & Scientific | 26 (100.0%) | 0 (0.0%) |
| Enterprise Management | 0 (0.0%) | 0 (0.0%) |
| Administrative & Support | 0 (0.0%) | 10 (100.0%) |
| Educational Services | 0 (0.0%) | 23 (100.0%) |
| Health Care & Social Assistance | 0 (0.0%) | 45 (100.0%) |
| Arts, Entertainment & Recreation | 0 (0.0%) | 0 (0.0%) |
| Accommodation & Food Services | 55 (28.5%) | 138 (71.5%) |
| Public Administration | 0 (0.0%) | 0 (0.0%) |
| Total | 317 (44.4%) | 397 (55.6%) |
Education in Calwa
School Enrollment in Calwa
The most common levels of schooling among the 937 students in Calwa are high school (247 | 26.4%), middle school (228 | 24.3%), and elementary school (158 | 16.9%).
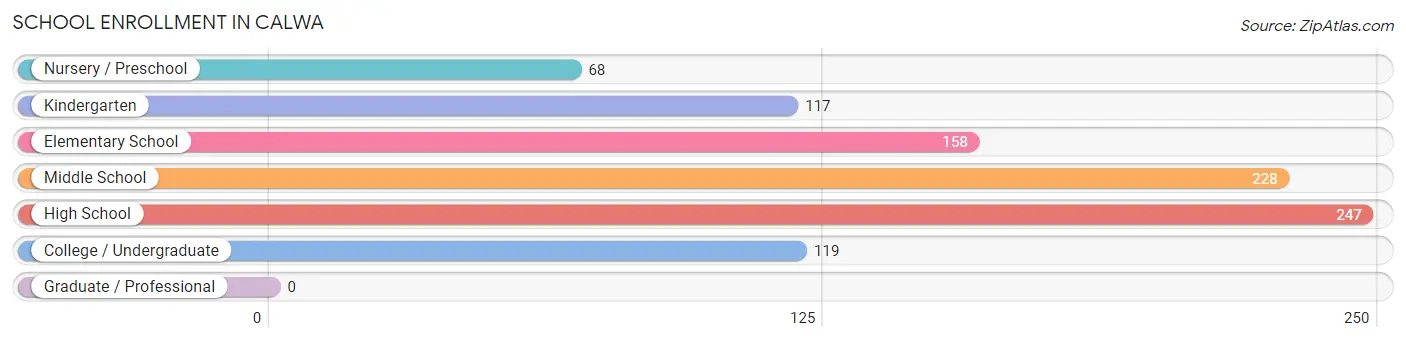
| School Level | # Students | % Students |
| Nursery / Preschool | 68 | 7.3% |
| Kindergarten | 117 | 12.5% |
| Elementary School | 158 | 16.9% |
| Middle School | 228 | 24.3% |
| High School | 247 | 26.4% |
| College / Undergraduate | 119 | 12.7% |
| Graduate / Professional | 0 | 0.0% |
| Total | 937 | 100.0% |
School Enrollment by Age by Funding Source in Calwa
Out of a total of 937 students who are enrolled in schools in Calwa, 63 (6.7%) attend a private institution, while the remaining 874 (93.3%) are enrolled in public schools. The age group of 20 to 24 year olds has the highest likelihood of being enrolled in private schools, with 11 (78.6% in the age bracket) enrolled. Conversely, the age group of 3 to 4 year olds has the lowest likelihood of being enrolled in a private school, with 48 (100.0% in the age bracket) attending a public institution.
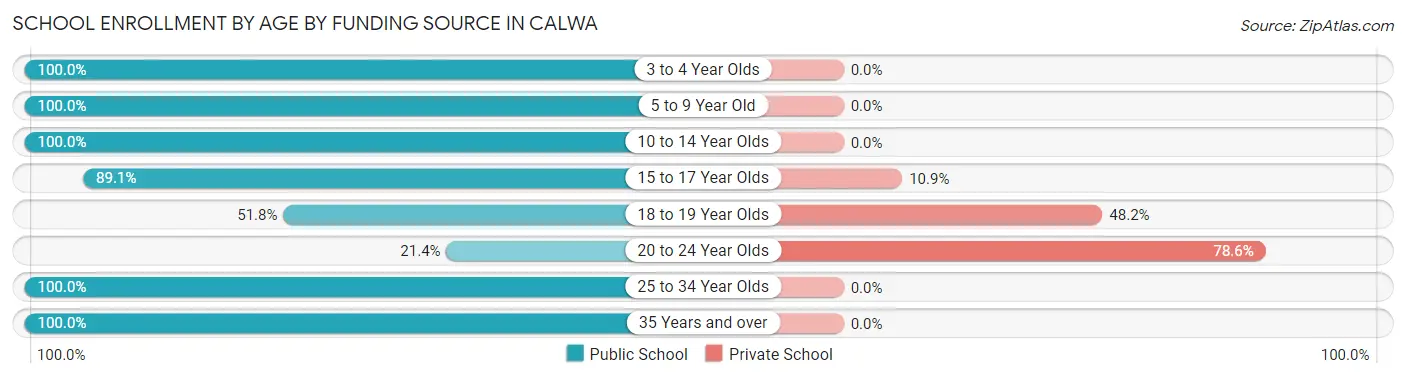
| Age Bracket | Public School | Private School |
| 3 to 4 Year Olds | 48 (100.0%) | 0 (0.0%) |
| 5 to 9 Year Old | 295 (100.0%) | 0 (0.0%) |
| 10 to 14 Year Olds | 283 (100.0%) | 0 (0.0%) |
| 15 to 17 Year Olds | 98 (89.1%) | 12 (10.9%) |
| 18 to 19 Year Olds | 43 (51.8%) | 40 (48.2%) |
| 20 to 24 Year Olds | 3 (21.4%) | 11 (78.6%) |
| 25 to 34 Year Olds | 93 (100.0%) | 0 (0.0%) |
| 35 Years and over | 11 (100.0%) | 0 (0.0%) |
| Total | 874 (93.3%) | 63 (6.7%) |
Educational Attainment by Field of Study in Calwa
| Field of Study | # Graduates | % Graduates |
| Computers & Mathematics | 0 | 0.0% |
| Bio, Nature & Agricultural | 0 | 0.0% |
| Physical & Health Sciences | 0 | 0.0% |
| Psychology | 0 | 0.0% |
| Social Sciences | 0 | 0.0% |
| Engineering | 0 | 0.0% |
| Multidisciplinary Studies | 0 | 0.0% |
| Science & Technology | 0 | 0.0% |
| Business | 0 | 0.0% |
| Education | 0 | 0.0% |
| Literature & Languages | 0 | 0.0% |
| Liberal Arts & History | 0 | 0.0% |
| Visual & Performing Arts | 0 | 0.0% |
| Communications | 0 | 0.0% |
| Arts & Humanities | 0 | 0.0% |
| Total | 0 | 0.0% |
Transportation & Commute in Calwa
Vehicle Availability by Sex in Calwa
The most prevalent vehicle ownership categories in Calwa are males with 3 vehicles (124, accounting for 42.8%) and females with 3 vehicles (173, making up 35.1%).
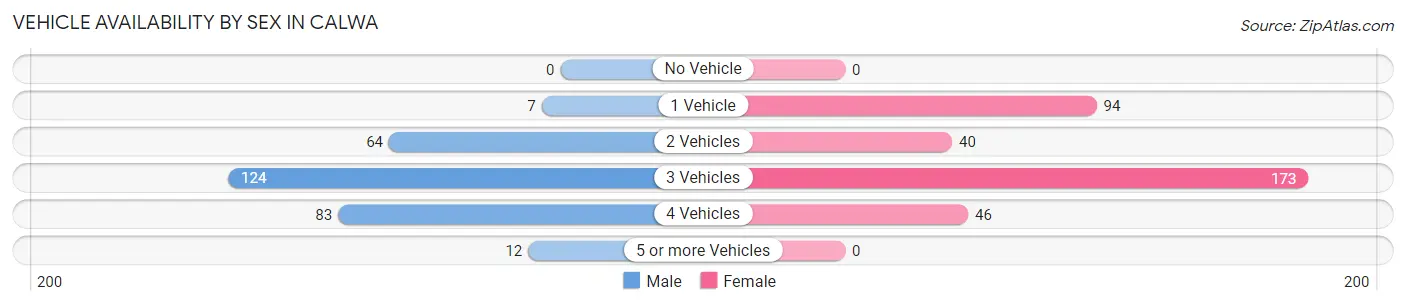
| Vehicles Available | Male | Female |
| No Vehicle | 0 (0.0%) | 0 (0.0%) |
| 1 Vehicle | 7 (2.4%) | 94 (26.6%) |
| 2 Vehicles | 64 (22.1%) | 40 (11.3%) |
| 3 Vehicles | 124 (42.8%) | 173 (49.0%) |
| 4 Vehicles | 83 (28.6%) | 46 (13.0%) |
| 5 or more Vehicles | 12 (4.1%) | 0 (0.0%) |
| Total | 290 (100.0%) | 353 (100.0%) |
Commute Time in Calwa
The most frequently occuring commute durations in Calwa are 30 to 34 minutes (154 commuters, 24.8%), 15 to 19 minutes (102 commuters, 16.4%), and 10 to 14 minutes (96 commuters, 15.5%).
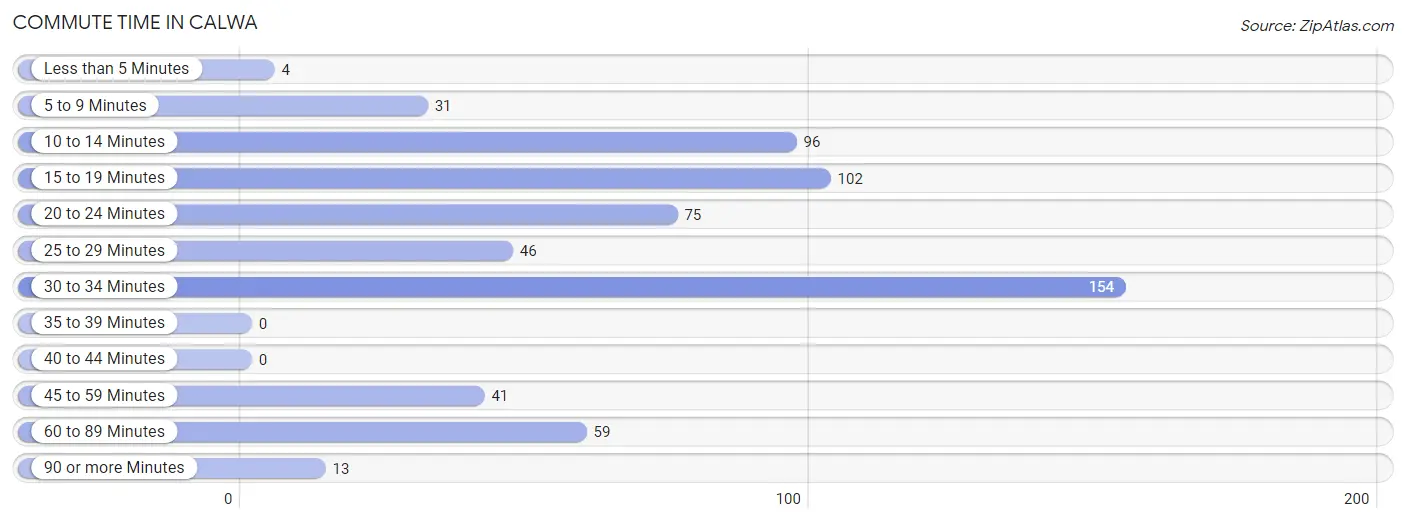
| Commute Time | # Commuters | % Commuters |
| Less than 5 Minutes | 4 | 0.6% |
| 5 to 9 Minutes | 31 | 5.0% |
| 10 to 14 Minutes | 96 | 15.5% |
| 15 to 19 Minutes | 102 | 16.4% |
| 20 to 24 Minutes | 75 | 12.1% |
| 25 to 29 Minutes | 46 | 7.4% |
| 30 to 34 Minutes | 154 | 24.8% |
| 35 to 39 Minutes | 0 | 0.0% |
| 40 to 44 Minutes | 0 | 0.0% |
| 45 to 59 Minutes | 41 | 6.6% |
| 60 to 89 Minutes | 59 | 9.5% |
| 90 or more Minutes | 13 | 2.1% |
Commute Time by Sex in Calwa
The most common commute times in Calwa are 30 to 34 minutes (87 commuters, 31.4%) for males and 10 to 14 minutes (96 commuters, 27.9%) for females.
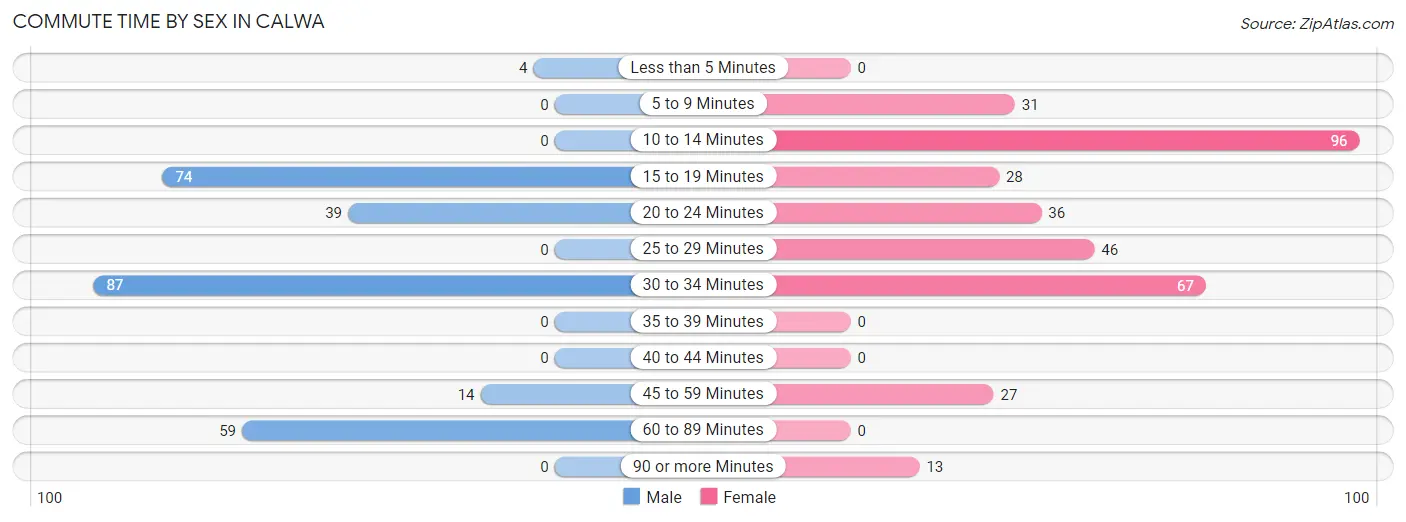
| Commute Time | Male | Female |
| Less than 5 Minutes | 4 (1.4%) | 0 (0.0%) |
| 5 to 9 Minutes | 0 (0.0%) | 31 (9.0%) |
| 10 to 14 Minutes | 0 (0.0%) | 96 (27.9%) |
| 15 to 19 Minutes | 74 (26.7%) | 28 (8.1%) |
| 20 to 24 Minutes | 39 (14.1%) | 36 (10.5%) |
| 25 to 29 Minutes | 0 (0.0%) | 46 (13.4%) |
| 30 to 34 Minutes | 87 (31.4%) | 67 (19.5%) |
| 35 to 39 Minutes | 0 (0.0%) | 0 (0.0%) |
| 40 to 44 Minutes | 0 (0.0%) | 0 (0.0%) |
| 45 to 59 Minutes | 14 (5.1%) | 27 (7.9%) |
| 60 to 89 Minutes | 59 (21.3%) | 0 (0.0%) |
| 90 or more Minutes | 0 (0.0%) | 13 (3.8%) |
Time of Departure to Work by Sex in Calwa
The most frequent times of departure to work in Calwa are 5:30 AM to 5:59 AM (81, 29.2%) for males and 7:00 AM to 7:29 AM (101, 29.4%) for females.
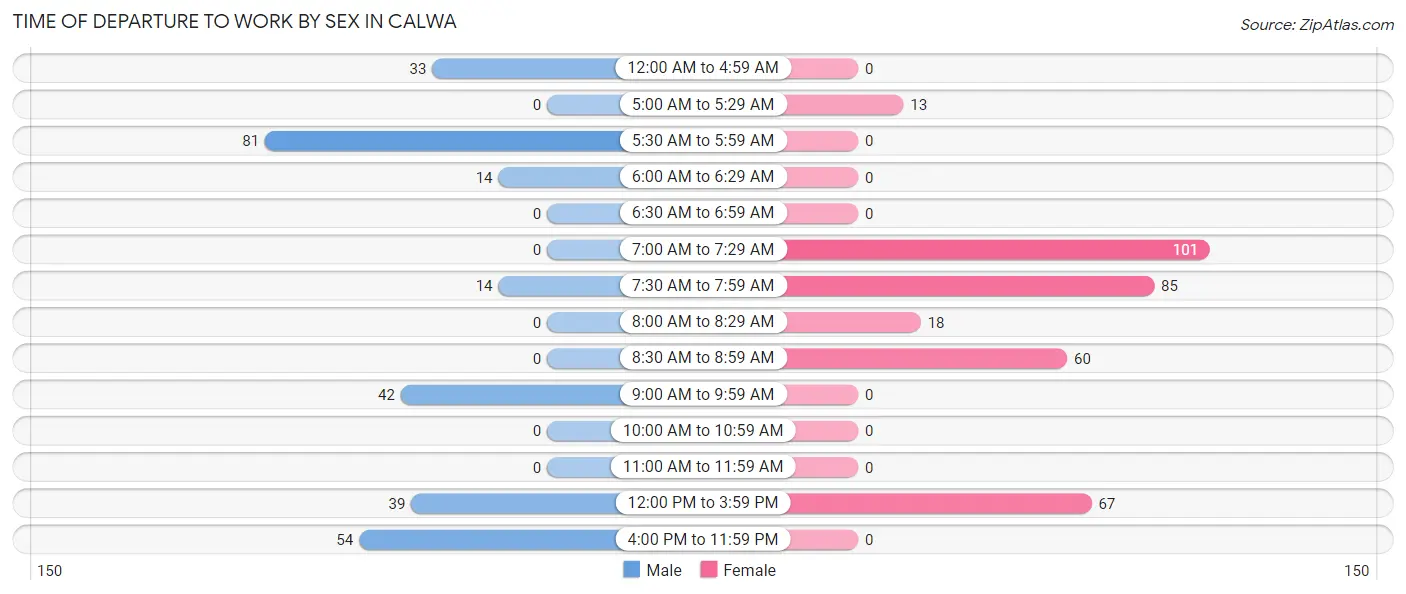
| Time of Departure | Male | Female |
| 12:00 AM to 4:59 AM | 33 (11.9%) | 0 (0.0%) |
| 5:00 AM to 5:29 AM | 0 (0.0%) | 13 (3.8%) |
| 5:30 AM to 5:59 AM | 81 (29.2%) | 0 (0.0%) |
| 6:00 AM to 6:29 AM | 14 (5.1%) | 0 (0.0%) |
| 6:30 AM to 6:59 AM | 0 (0.0%) | 0 (0.0%) |
| 7:00 AM to 7:29 AM | 0 (0.0%) | 101 (29.4%) |
| 7:30 AM to 7:59 AM | 14 (5.1%) | 85 (24.7%) |
| 8:00 AM to 8:29 AM | 0 (0.0%) | 18 (5.2%) |
| 8:30 AM to 8:59 AM | 0 (0.0%) | 60 (17.4%) |
| 9:00 AM to 9:59 AM | 42 (15.2%) | 0 (0.0%) |
| 10:00 AM to 10:59 AM | 0 (0.0%) | 0 (0.0%) |
| 11:00 AM to 11:59 AM | 0 (0.0%) | 0 (0.0%) |
| 12:00 PM to 3:59 PM | 39 (14.1%) | 67 (19.5%) |
| 4:00 PM to 11:59 PM | 54 (19.5%) | 0 (0.0%) |
| Total | 277 (100.0%) | 344 (100.0%) |
Housing Occupancy in Calwa
Occupancy by Ownership in Calwa
Of the total 545 dwellings in Calwa, owner-occupied units account for 230 (42.2%), while renter-occupied units make up 315 (57.8%).
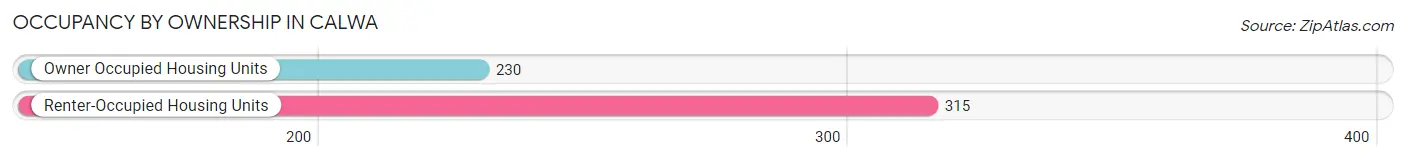
| Occupancy | # Housing Units | % Housing Units |
| Owner Occupied Housing Units | 230 | 42.2% |
| Renter-Occupied Housing Units | 315 | 57.8% |
| Total Occupied Housing Units | 545 | 100.0% |
Occupancy by Household Size in Calwa
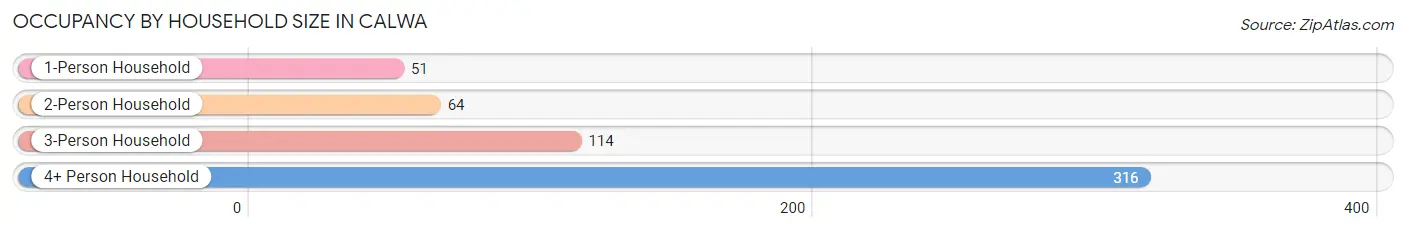
| Household Size | # Housing Units | % Housing Units |
| 1-Person Household | 51 | 9.4% |
| 2-Person Household | 64 | 11.7% |
| 3-Person Household | 114 | 20.9% |
| 4+ Person Household | 316 | 58.0% |
| Total Housing Units | 545 | 100.0% |
Occupancy by Ownership by Household Size in Calwa
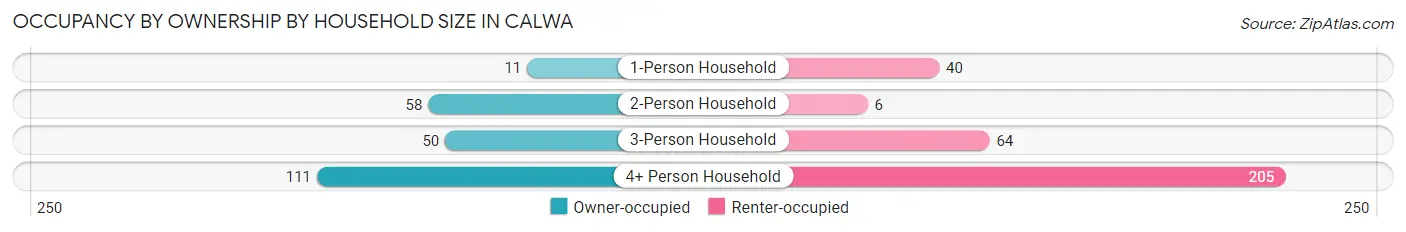
| Household Size | Owner-occupied | Renter-occupied |
| 1-Person Household | 11 (21.6%) | 40 (78.4%) |
| 2-Person Household | 58 (90.6%) | 6 (9.4%) |
| 3-Person Household | 50 (43.9%) | 64 (56.1%) |
| 4+ Person Household | 111 (35.1%) | 205 (64.9%) |
| Total Housing Units | 230 (42.2%) | 315 (57.8%) |
Occupancy by Educational Attainment in Calwa
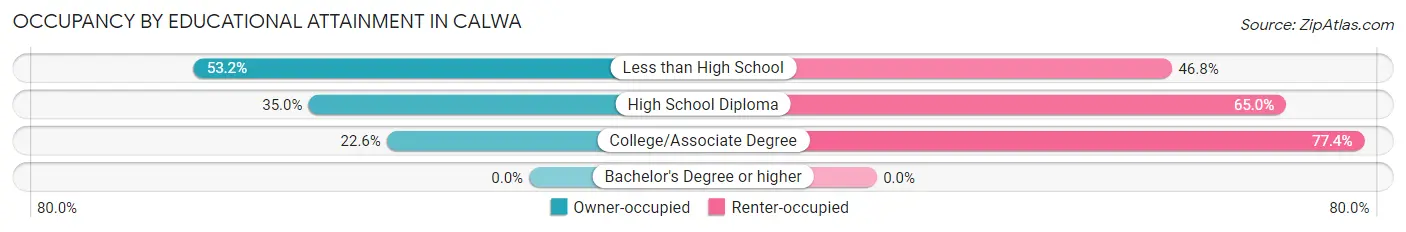
| Household Size | Owner-occupied | Renter-occupied |
| Less than High School | 160 (53.2%) | 141 (46.8%) |
| High School Diploma | 42 (35.0%) | 78 (65.0%) |
| College/Associate Degree | 28 (22.6%) | 96 (77.4%) |
| Bachelor's Degree or higher | 0 (0.0%) | 0 (0.0%) |
Occupancy by Age of Householder in Calwa
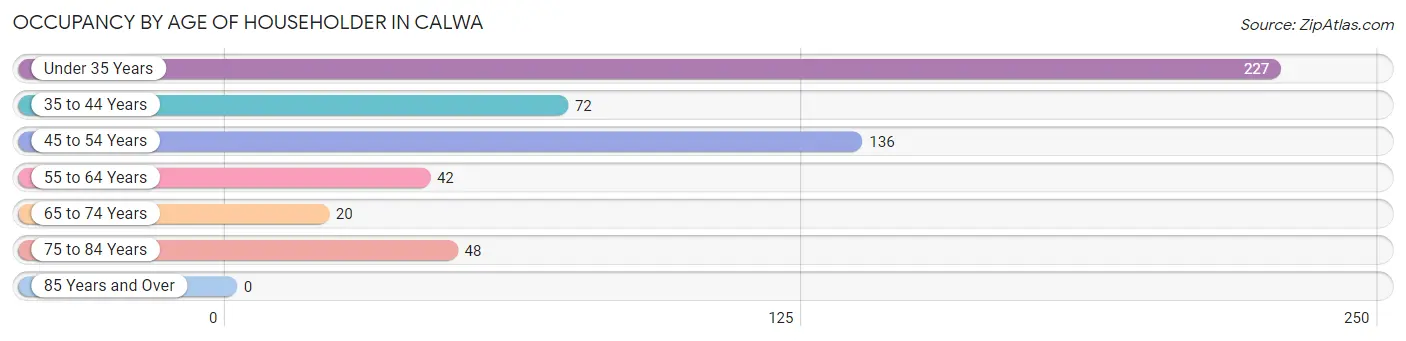
| Age Bracket | # Households | % Households |
| Under 35 Years | 227 | 41.6% |
| 35 to 44 Years | 72 | 13.2% |
| 45 to 54 Years | 136 | 24.9% |
| 55 to 64 Years | 42 | 7.7% |
| 65 to 74 Years | 20 | 3.7% |
| 75 to 84 Years | 48 | 8.8% |
| 85 Years and Over | 0 | 0.0% |
| Total | 545 | 100.0% |
Housing Finances in Calwa
Median Income by Occupancy in Calwa
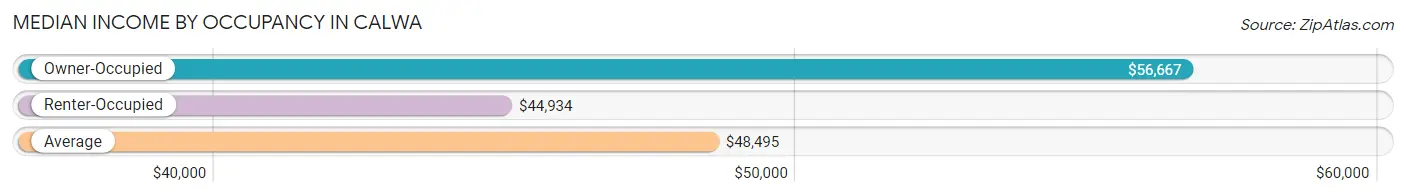
| Occupancy Type | # Households | Median Income |
| Owner-Occupied | 230 (42.2%) | $56,667 |
| Renter-Occupied | 315 (57.8%) | $44,934 |
| Average | 545 (100.0%) | $48,495 |
Occupancy by Householder Income Bracket in Calwa
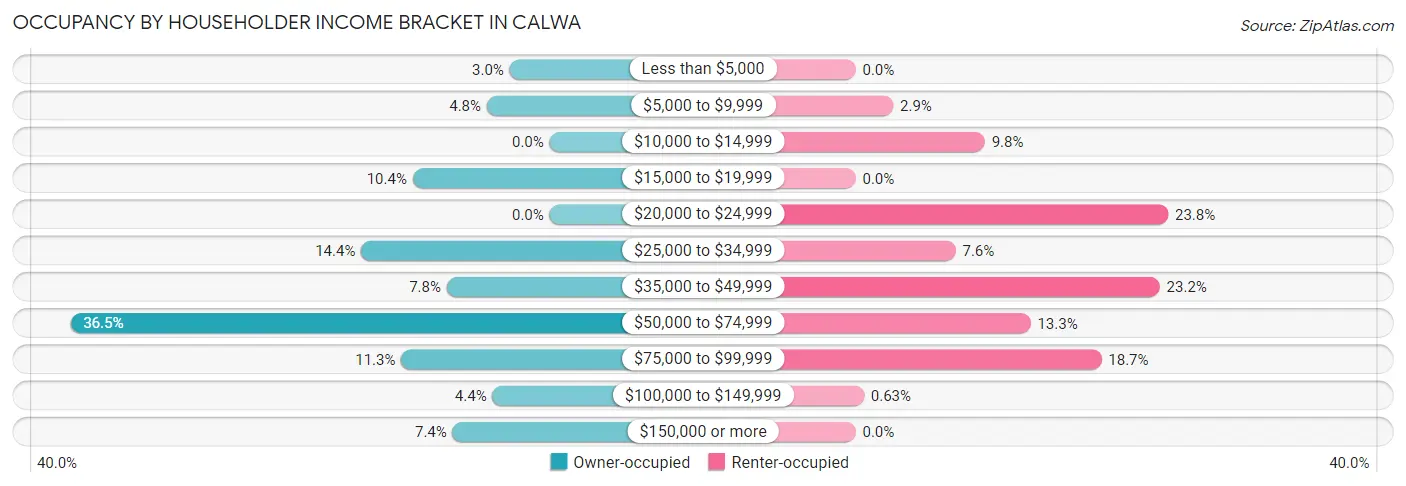
| Income Bracket | Owner-occupied | Renter-occupied |
| Less than $5,000 | 7 (3.0%) | 0 (0.0%) |
| $5,000 to $9,999 | 11 (4.8%) | 9 (2.9%) |
| $10,000 to $14,999 | 0 (0.0%) | 31 (9.8%) |
| $15,000 to $19,999 | 24 (10.4%) | 0 (0.0%) |
| $20,000 to $24,999 | 0 (0.0%) | 75 (23.8%) |
| $25,000 to $34,999 | 33 (14.3%) | 24 (7.6%) |
| $35,000 to $49,999 | 18 (7.8%) | 73 (23.2%) |
| $50,000 to $74,999 | 84 (36.5%) | 42 (13.3%) |
| $75,000 to $99,999 | 26 (11.3%) | 59 (18.7%) |
| $100,000 to $149,999 | 10 (4.3%) | 2 (0.6%) |
| $150,000 or more | 17 (7.4%) | 0 (0.0%) |
| Total | 230 (100.0%) | 315 (100.0%) |
Monthly Housing Cost Tiers in Calwa
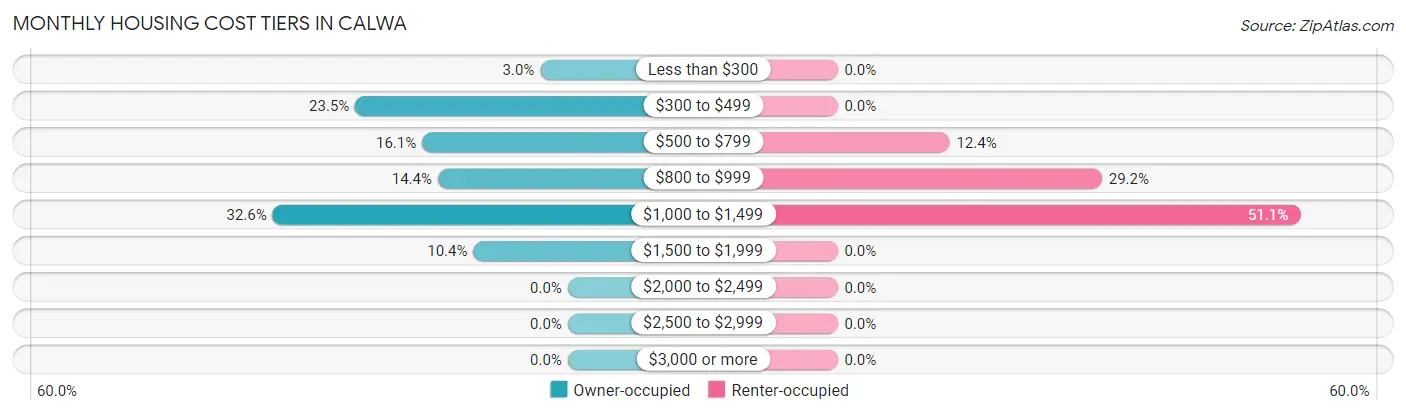
| Monthly Cost | Owner-occupied | Renter-occupied |
| Less than $300 | 7 (3.0%) | 0 (0.0%) |
| $300 to $499 | 54 (23.5%) | 0 (0.0%) |
| $500 to $799 | 37 (16.1%) | 39 (12.4%) |
| $800 to $999 | 33 (14.3%) | 92 (29.2%) |
| $1,000 to $1,499 | 75 (32.6%) | 161 (51.1%) |
| $1,500 to $1,999 | 24 (10.4%) | 0 (0.0%) |
| $2,000 to $2,499 | 0 (0.0%) | 0 (0.0%) |
| $2,500 to $2,999 | 0 (0.0%) | 0 (0.0%) |
| $3,000 or more | 0 (0.0%) | 0 (0.0%) |
| Total | 230 (100.0%) | 315 (100.0%) |
Physical Housing Characteristics in Calwa
Housing Structures in Calwa
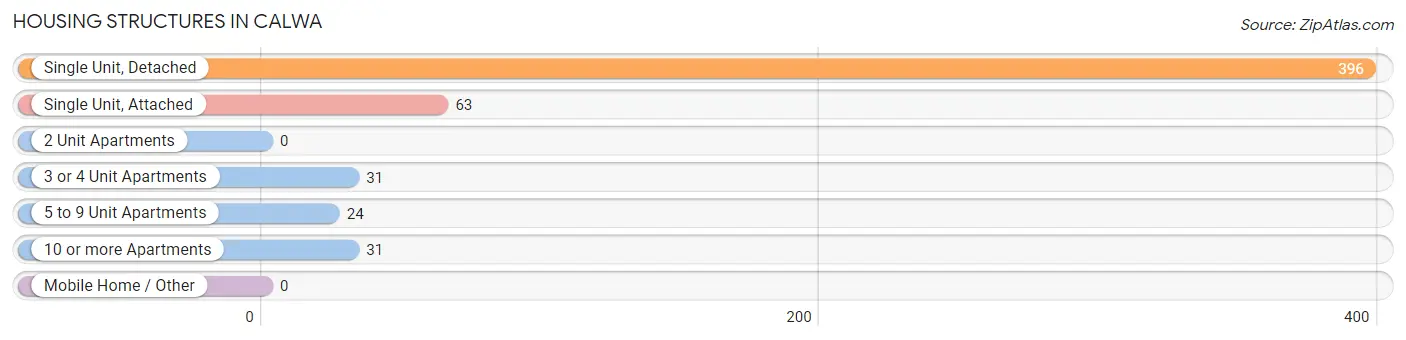
| Structure Type | # Housing Units | % Housing Units |
| Single Unit, Detached | 396 | 72.7% |
| Single Unit, Attached | 63 | 11.6% |
| 2 Unit Apartments | 0 | 0.0% |
| 3 or 4 Unit Apartments | 31 | 5.7% |
| 5 to 9 Unit Apartments | 24 | 4.4% |
| 10 or more Apartments | 31 | 5.7% |
| Mobile Home / Other | 0 | 0.0% |
| Total | 545 | 100.0% |
Housing Structures by Occupancy in Calwa
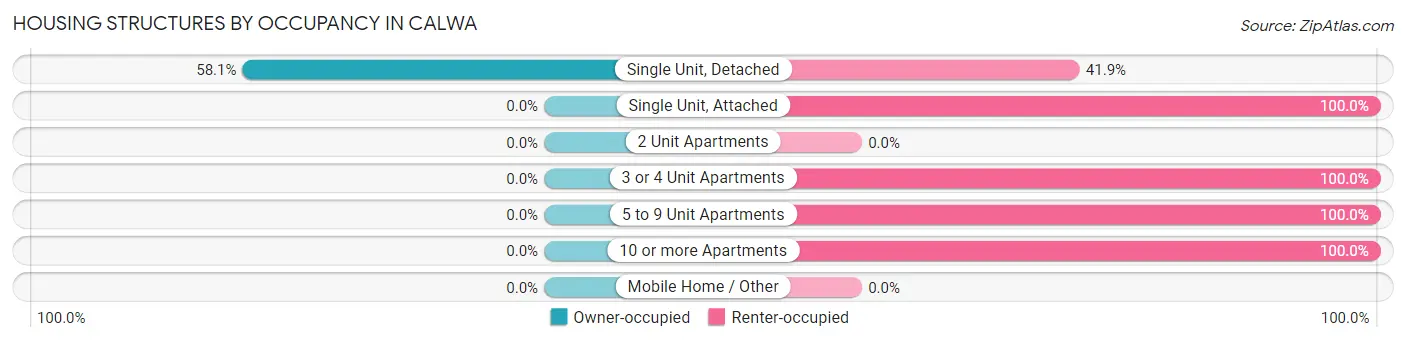
| Structure Type | Owner-occupied | Renter-occupied |
| Single Unit, Detached | 230 (58.1%) | 166 (41.9%) |
| Single Unit, Attached | 0 (0.0%) | 63 (100.0%) |
| 2 Unit Apartments | 0 (0.0%) | 0 (0.0%) |
| 3 or 4 Unit Apartments | 0 (0.0%) | 31 (100.0%) |
| 5 to 9 Unit Apartments | 0 (0.0%) | 24 (100.0%) |
| 10 or more Apartments | 0 (0.0%) | 31 (100.0%) |
| Mobile Home / Other | 0 (0.0%) | 0 (0.0%) |
| Total | 230 (42.2%) | 315 (57.8%) |
Housing Structures by Number of Rooms in Calwa
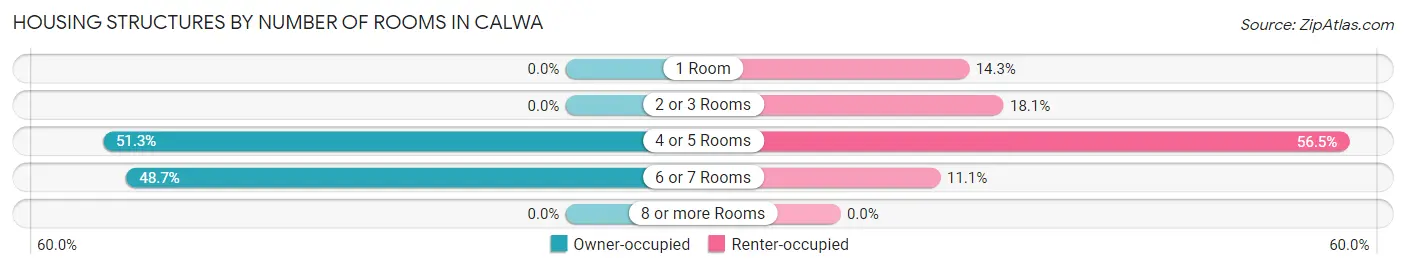
| Number of Rooms | Owner-occupied | Renter-occupied |
| 1 Room | 0 (0.0%) | 45 (14.3%) |
| 2 or 3 Rooms | 0 (0.0%) | 57 (18.1%) |
| 4 or 5 Rooms | 118 (51.3%) | 178 (56.5%) |
| 6 or 7 Rooms | 112 (48.7%) | 35 (11.1%) |
| 8 or more Rooms | 0 (0.0%) | 0 (0.0%) |
| Total | 230 (100.0%) | 315 (100.0%) |
Housing Structure by Heating Type in Calwa
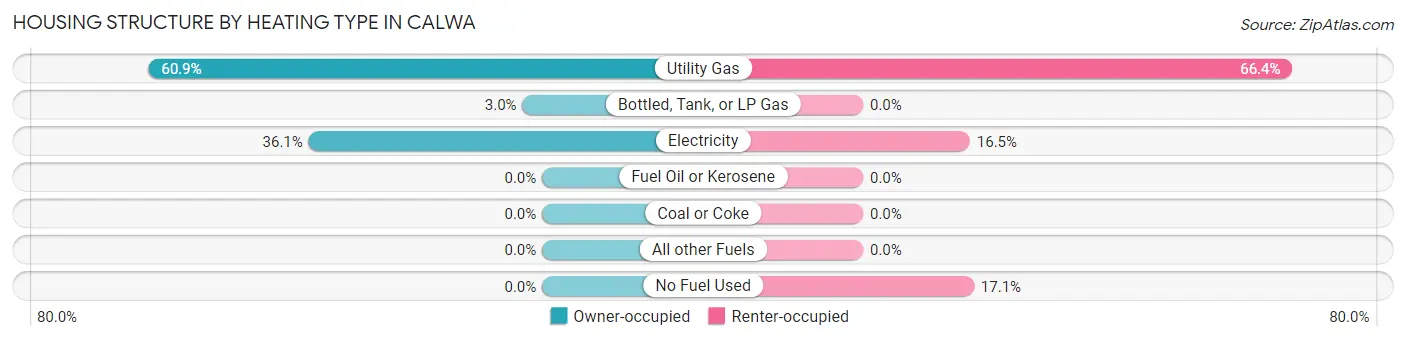
| Heating Type | Owner-occupied | Renter-occupied |
| Utility Gas | 140 (60.9%) | 209 (66.3%) |
| Bottled, Tank, or LP Gas | 7 (3.0%) | 0 (0.0%) |
| Electricity | 83 (36.1%) | 52 (16.5%) |
| Fuel Oil or Kerosene | 0 (0.0%) | 0 (0.0%) |
| Coal or Coke | 0 (0.0%) | 0 (0.0%) |
| All other Fuels | 0 (0.0%) | 0 (0.0%) |
| No Fuel Used | 0 (0.0%) | 54 (17.1%) |
| Total | 230 (100.0%) | 315 (100.0%) |
Household Vehicle Usage in Calwa
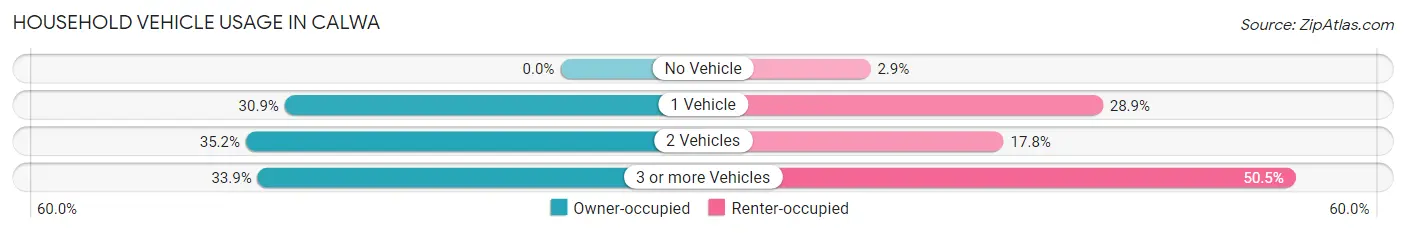
| Vehicles per Household | Owner-occupied | Renter-occupied |
| No Vehicle | 0 (0.0%) | 9 (2.9%) |
| 1 Vehicle | 71 (30.9%) | 91 (28.9%) |
| 2 Vehicles | 81 (35.2%) | 56 (17.8%) |
| 3 or more Vehicles | 78 (33.9%) | 159 (50.5%) |
| Total | 230 (100.0%) | 315 (100.0%) |
Real Estate & Mortgages in Calwa
Real Estate and Mortgage Overview in Calwa
| Characteristic | Without Mortgage | With Mortgage |
| Housing Units | 81 | 149 |
| Median Property Value | $239,900 | $191,400 |
| Median Household Income | - | - |
| Monthly Housing Costs | $351 | $0 |
| Real Estate Taxes | $879 | $18 |
Property Value by Mortgage Status in Calwa
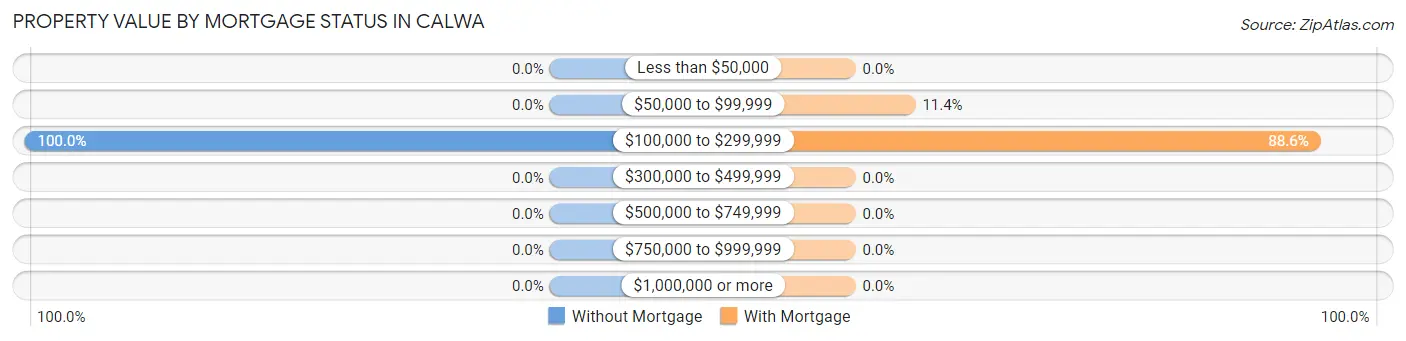
| Property Value | Without Mortgage | With Mortgage |
| Less than $50,000 | 0 (0.0%) | 0 (0.0%) |
| $50,000 to $99,999 | 0 (0.0%) | 17 (11.4%) |
| $100,000 to $299,999 | 81 (100.0%) | 132 (88.6%) |
| $300,000 to $499,999 | 0 (0.0%) | 0 (0.0%) |
| $500,000 to $749,999 | 0 (0.0%) | 0 (0.0%) |
| $750,000 to $999,999 | 0 (0.0%) | 0 (0.0%) |
| $1,000,000 or more | 0 (0.0%) | 0 (0.0%) |
| Total | 81 (100.0%) | 149 (100.0%) |
Household Income by Mortgage Status in Calwa
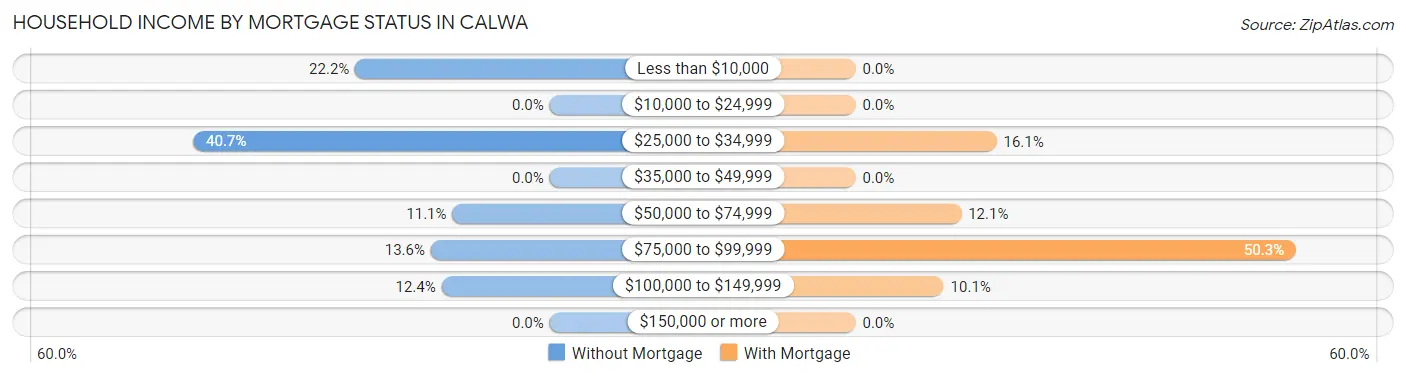
| Household Income | Without Mortgage | With Mortgage |
| Less than $10,000 | 18 (22.2%) | 0 (0.0%) |
| $10,000 to $24,999 | 0 (0.0%) | 0 (0.0%) |
| $25,000 to $34,999 | 33 (40.7%) | 24 (16.1%) |
| $35,000 to $49,999 | 0 (0.0%) | 0 (0.0%) |
| $50,000 to $74,999 | 9 (11.1%) | 18 (12.1%) |
| $75,000 to $99,999 | 11 (13.6%) | 75 (50.3%) |
| $100,000 to $149,999 | 10 (12.3%) | 15 (10.1%) |
| $150,000 or more | 0 (0.0%) | 0 (0.0%) |
| Total | 81 (100.0%) | 149 (100.0%) |
Property Value to Household Income Ratio in Calwa
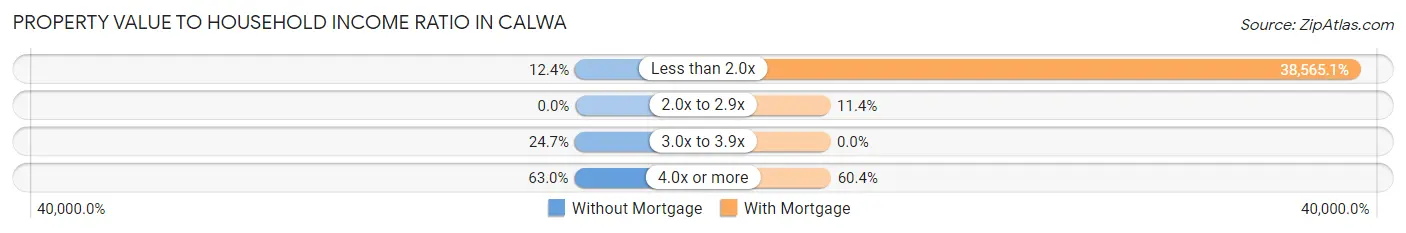
| Value-to-Income Ratio | Without Mortgage | With Mortgage |
| Less than 2.0x | 10 (12.3%) | 57,462 (38,565.1%) |
| 2.0x to 2.9x | 0 (0.0%) | 17 (11.4%) |
| 3.0x to 3.9x | 20 (24.7%) | 0 (0.0%) |
| 4.0x or more | 51 (63.0%) | 90 (60.4%) |
| Total | 81 (100.0%) | 149 (100.0%) |
Real Estate Taxes by Mortgage Status in Calwa
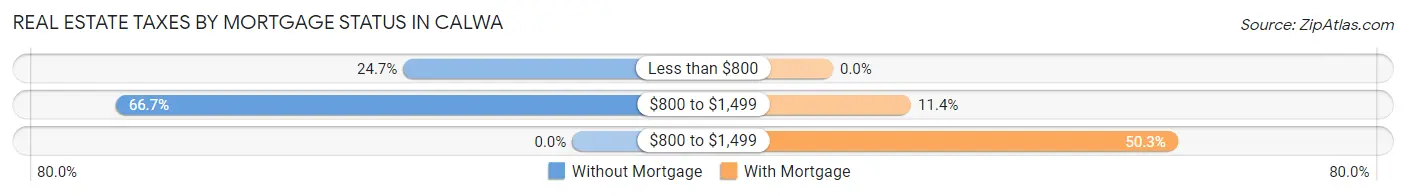
| Property Taxes | Without Mortgage | With Mortgage |
| Less than $800 | 20 (24.7%) | 0 (0.0%) |
| $800 to $1,499 | 54 (66.7%) | 17 (11.4%) |
| $800 to $1,499 | 0 (0.0%) | 75 (50.3%) |
| Total | 81 (100.0%) | 149 (100.0%) |
Health & Disability in Calwa
Health Insurance Coverage by Age in Calwa
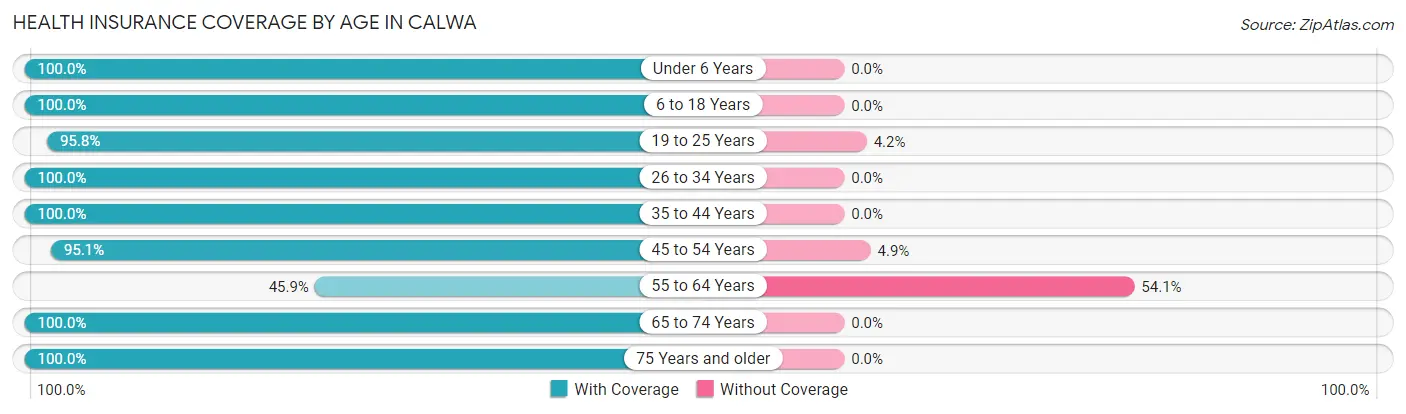
| Age Bracket | With Coverage | Without Coverage |
| Under 6 Years | 371 (100.0%) | 0 (0.0%) |
| 6 to 18 Years | 728 (100.0%) | 0 (0.0%) |
| 19 to 25 Years | 390 (95.8%) | 17 (4.2%) |
| 26 to 34 Years | 365 (100.0%) | 0 (0.0%) |
| 35 to 44 Years | 135 (100.0%) | 0 (0.0%) |
| 45 to 54 Years | 233 (95.1%) | 12 (4.9%) |
| 55 to 64 Years | 28 (45.9%) | 33 (54.1%) |
| 65 to 74 Years | 103 (100.0%) | 0 (0.0%) |
| 75 Years and older | 71 (100.0%) | 0 (0.0%) |
| Total | 2,424 (97.5%) | 62 (2.5%) |
Health Insurance Coverage by Citizenship Status in Calwa
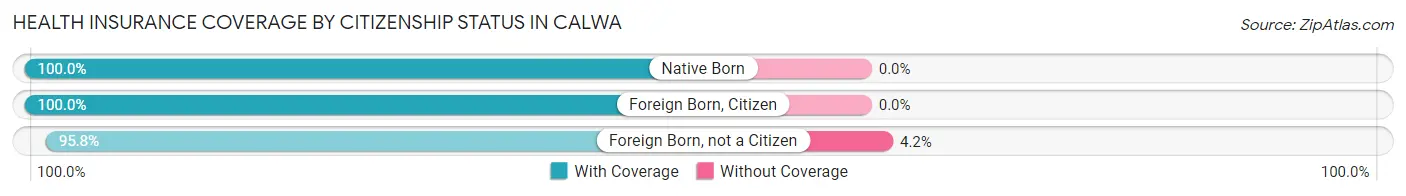
| Citizenship Status | With Coverage | Without Coverage |
| Native Born | 371 (100.0%) | 0 (0.0%) |
| Foreign Born, Citizen | 728 (100.0%) | 0 (0.0%) |
| Foreign Born, not a Citizen | 390 (95.8%) | 17 (4.2%) |
Health Insurance Coverage by Household Income in Calwa
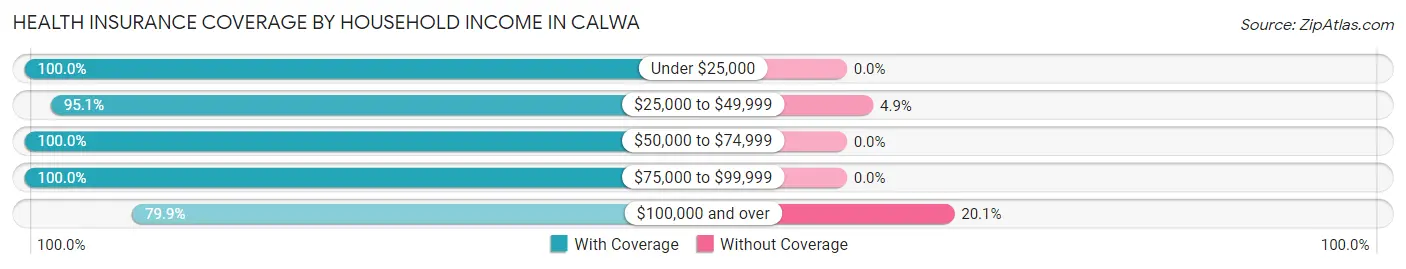
| Household Income | With Coverage | Without Coverage |
| Under $25,000 | 702 (100.0%) | 0 (0.0%) |
| $25,000 to $49,999 | 637 (95.1%) | 33 (4.9%) |
| $50,000 to $74,999 | 580 (100.0%) | 0 (0.0%) |
| $75,000 to $99,999 | 370 (100.0%) | 0 (0.0%) |
| $100,000 and over | 115 (79.9%) | 29 (20.1%) |
Public vs Private Health Insurance Coverage by Age in Calwa
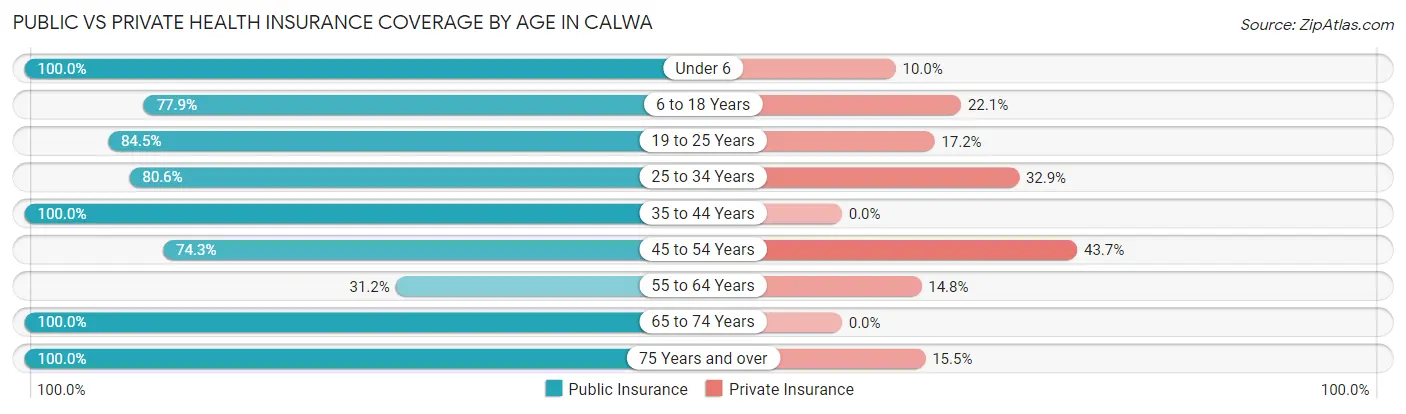
| Age Bracket | Public Insurance | Private Insurance |
| Under 6 | 371 (100.0%) | 37 (10.0%) |
| 6 to 18 Years | 567 (77.9%) | 161 (22.1%) |
| 19 to 25 Years | 344 (84.5%) | 70 (17.2%) |
| 25 to 34 Years | 294 (80.5%) | 120 (32.9%) |
| 35 to 44 Years | 135 (100.0%) | 0 (0.0%) |
| 45 to 54 Years | 182 (74.3%) | 107 (43.7%) |
| 55 to 64 Years | 19 (31.1%) | 9 (14.7%) |
| 65 to 74 Years | 103 (100.0%) | 0 (0.0%) |
| 75 Years and over | 71 (100.0%) | 11 (15.5%) |
| Total | 2,086 (83.9%) | 515 (20.7%) |
Disability Status by Sex by Age in Calwa
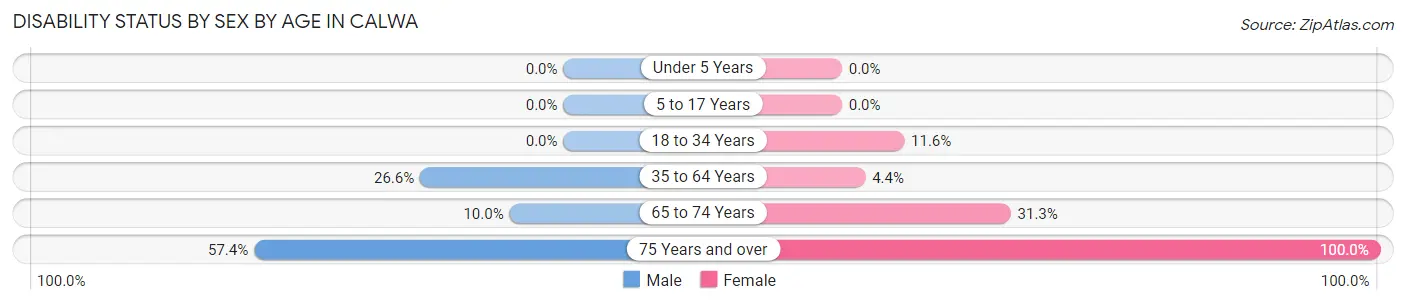
| Age Bracket | Male | Female |
| Under 5 Years | 0 (0.0%) | 0 (0.0%) |
| 5 to 17 Years | 0 (0.0%) | 0 (0.0%) |
| 18 to 34 Years | 0 (0.0%) | 64 (11.6%) |
| 35 to 64 Years | 50 (26.6%) | 11 (4.3%) |
| 65 to 74 Years | 2 (10.0%) | 26 (31.3%) |
| 75 Years and over | 31 (57.4%) | 17 (100.0%) |
Disability Class by Sex by Age in Calwa
Disability Class: Hearing Difficulty
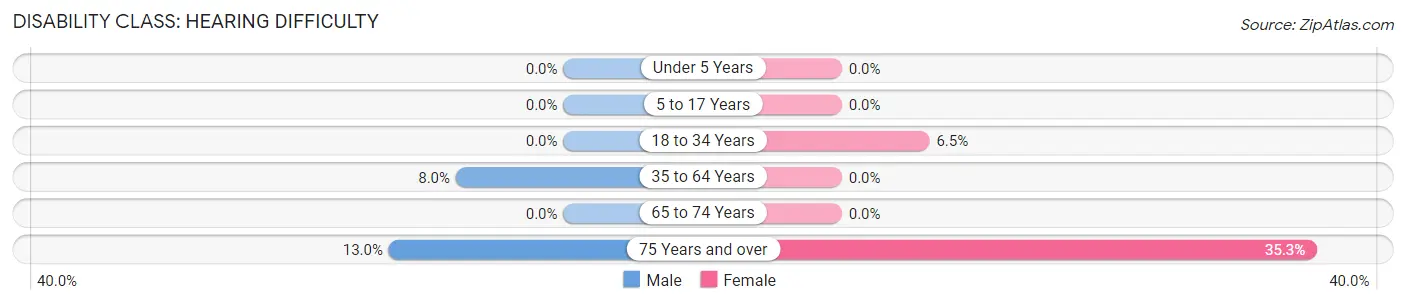
| Age Bracket | Male | Female |
| Under 5 Years | 0 (0.0%) | 0 (0.0%) |
| 5 to 17 Years | 0 (0.0%) | 0 (0.0%) |
| 18 to 34 Years | 0 (0.0%) | 36 (6.5%) |
| 35 to 64 Years | 15 (8.0%) | 0 (0.0%) |
| 65 to 74 Years | 0 (0.0%) | 0 (0.0%) |
| 75 Years and over | 7 (13.0%) | 6 (35.3%) |
Disability Class: Vision Difficulty
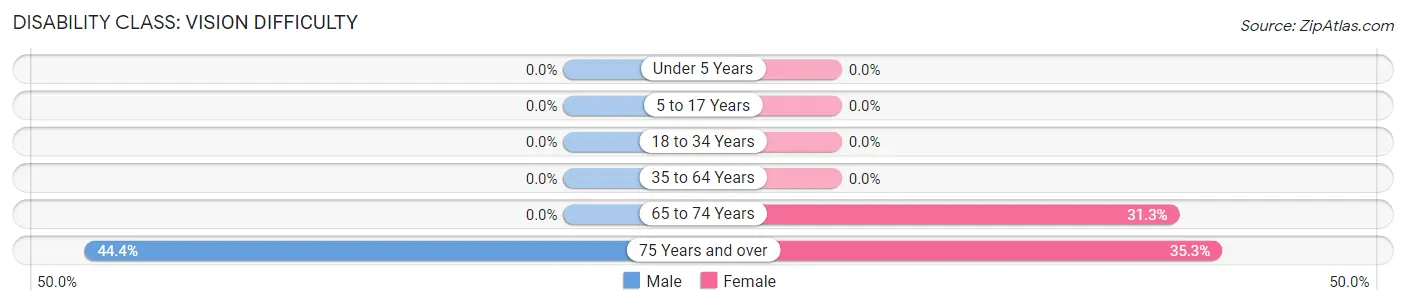
| Age Bracket | Male | Female |
| Under 5 Years | 0 (0.0%) | 0 (0.0%) |
| 5 to 17 Years | 0 (0.0%) | 0 (0.0%) |
| 18 to 34 Years | 0 (0.0%) | 0 (0.0%) |
| 35 to 64 Years | 0 (0.0%) | 0 (0.0%) |
| 65 to 74 Years | 0 (0.0%) | 26 (31.3%) |
| 75 Years and over | 24 (44.4%) | 6 (35.3%) |
Disability Class: Cognitive Difficulty
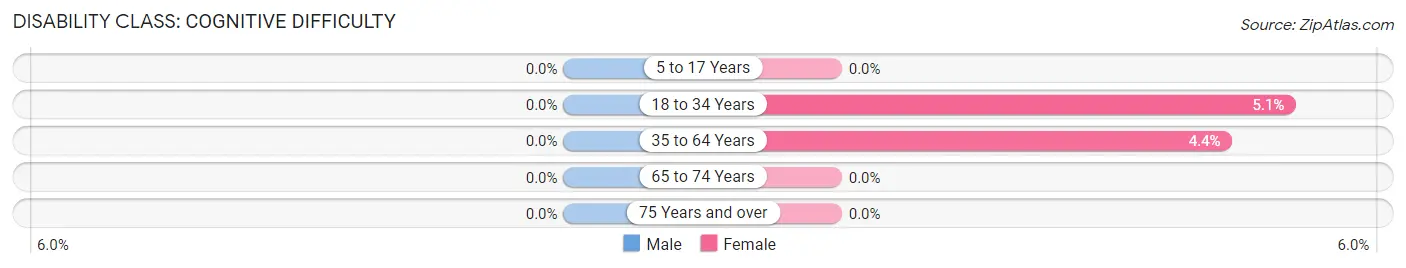
| Age Bracket | Male | Female |
| 5 to 17 Years | 0 (0.0%) | 0 (0.0%) |
| 18 to 34 Years | 0 (0.0%) | 28 (5.1%) |
| 35 to 64 Years | 0 (0.0%) | 11 (4.3%) |
| 65 to 74 Years | 0 (0.0%) | 0 (0.0%) |
| 75 Years and over | 0 (0.0%) | 0 (0.0%) |
Disability Class: Ambulatory Difficulty
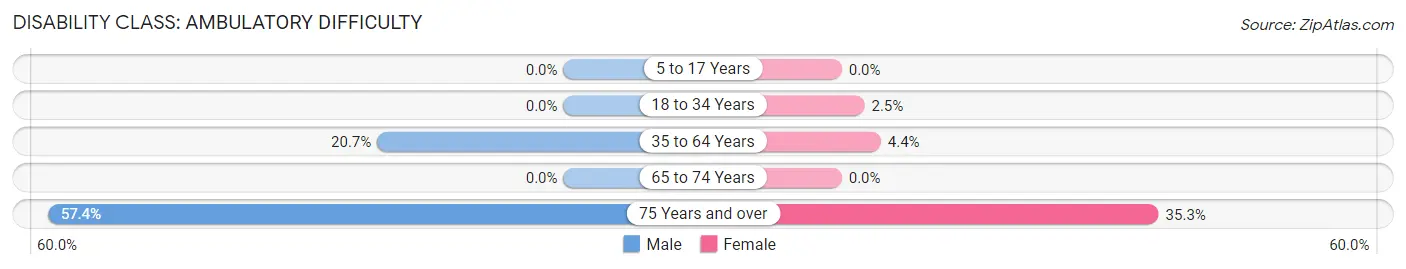
| Age Bracket | Male | Female |
| 5 to 17 Years | 0 (0.0%) | 0 (0.0%) |
| 18 to 34 Years | 0 (0.0%) | 14 (2.5%) |
| 35 to 64 Years | 39 (20.7%) | 11 (4.3%) |
| 65 to 74 Years | 0 (0.0%) | 0 (0.0%) |
| 75 Years and over | 31 (57.4%) | 6 (35.3%) |
Disability Class: Self-Care Difficulty
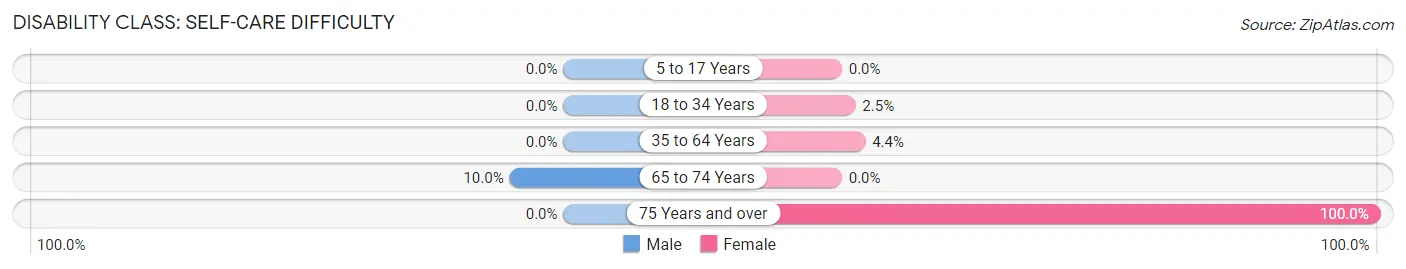
| Age Bracket | Male | Female |
| 5 to 17 Years | 0 (0.0%) | 0 (0.0%) |
| 18 to 34 Years | 0 (0.0%) | 14 (2.5%) |
| 35 to 64 Years | 0 (0.0%) | 11 (4.3%) |
| 65 to 74 Years | 2 (10.0%) | 0 (0.0%) |
| 75 Years and over | 0 (0.0%) | 17 (100.0%) |
Technology Access in Calwa
Computing Device Access in Calwa
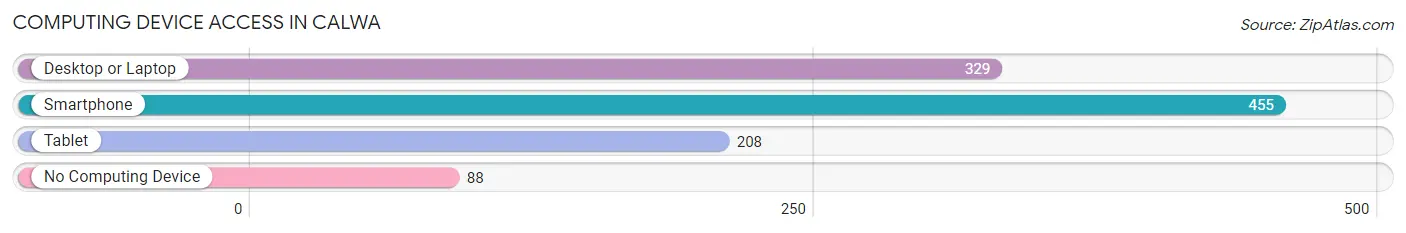
| Device Type | # Households | % Households |
| Desktop or Laptop | 329 | 60.4% |
| Smartphone | 455 | 83.5% |
| Tablet | 208 | 38.2% |
| No Computing Device | 88 | 16.2% |
| Total | 545 | 100.0% |
Internet Access in Calwa
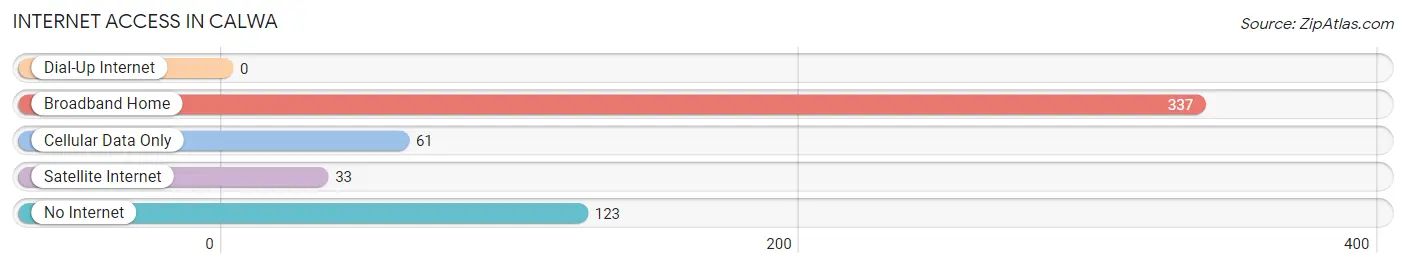
| Internet Type | # Households | % Households |
| Dial-Up Internet | 0 | 0.0% |
| Broadband Home | 337 | 61.8% |
| Cellular Data Only | 61 | 11.2% |
| Satellite Internet | 33 | 6.1% |
| No Internet | 123 | 22.6% |
| Total | 545 | 100.0% |
Calwa Summary
Calwa is a census-designated place located in Fresno County, California. It is located in the San Joaquin Valley, about 8 miles southeast of downtown Fresno. The population was 8,845 at the 2010 census, up from 8,717 at the 2000 census.
History
Calwa was founded in the late 1800s by a group of settlers from the Midwest. The settlers were attracted to the area by the fertile soil and the abundance of water from the nearby Kings River. The town was originally called "Calwa Station" after the nearby railroad station. The name was later shortened to "Calwa".
In the early 1900s, Calwa was a thriving agricultural community. The town was home to a variety of crops, including grapes, peaches, and almonds. The town also had a number of small businesses, including a general store, a blacksmith shop, and a saloon.
In the 1920s, Calwa began to experience a population boom. This was due to the influx of Mexican immigrants who were attracted to the area by the promise of work in the agricultural industry. By the 1930s, Calwa had become a predominantly Mexican-American community.
Geography
Calwa is located at 36°41'17" North, 119°45'17" West (36.688056, -119.754722). It is situated in the San Joaquin Valley, about 8 miles southeast of downtown Fresno. The town is bordered by the cities of Fresno and Clovis to the north, and the towns of Parlier and Reedley to the south.
The terrain of Calwa is mostly flat, with some rolling hills in the surrounding area. The town is located in a semi-arid climate, with hot summers and mild winters. The average annual precipitation is about 10 inches.
Economy
Calwa's economy is largely based on agriculture. The town is home to a variety of crops, including grapes, peaches, almonds, and other fruits and vegetables. The town also has a number of small businesses, including restaurants, grocery stores, and auto repair shops.
The town is also home to a number of manufacturing and industrial businesses. These include a concrete plant, a metal fabrication shop, and a plastics factory.
Demographics
As of the 2010 census, Calwa had a population of 8,845. The racial makeup of the town was 63.3% Hispanic or Latino, 33.2% White, 1.2% African American, 0.7% Native American, 0.3% Asian, and 0.5% from other races.
The median household income in Calwa was $35,945 in 2010. The per capita income was $14,945. About 24.3% of the population was below the poverty line.
Conclusion
Calwa is a small town located in Fresno County, California. It is situated in the San Joaquin Valley, about 8 miles southeast of downtown Fresno. The town has a population of 8,845 and is largely Hispanic or Latino. The economy of Calwa is based on agriculture and small businesses. The town is also home to a number of manufacturing and industrial businesses.
Common Questions
What is Per Capita Income in Calwa?
Per Capita income in Calwa is $11,464.
What is the Median Family Income in Calwa?
Median Family Income in Calwa is $49,676.
What is the Median Household income in Calwa?
Median Household Income in Calwa is $48,495.
What is Income or Wage Gap in Calwa?
Income or Wage Gap in Calwa is 36.8%.
Women in Calwa earn 63.2 cents for every dollar earned by a man.
What is Inequality or Gini Index in Calwa?
Inequality or Gini Index in Calwa is 0.36.
What is the Total Population of Calwa?
Total Population of Calwa is 2,486.
What is the Total Male Population of Calwa?
Total Male Population of Calwa is 1,062.
What is the Total Female Population of Calwa?
Total Female Population of Calwa is 1,424.
What is the Ratio of Males per 100 Females in Calwa?
There are 74.58 Males per 100 Females in Calwa.
What is the Ratio of Females per 100 Males in Calwa?
There are 134.09 Females per 100 Males in Calwa.
What is the Median Population Age in Calwa?
Median Population Age in Calwa is 23.5 Years.
What is the Average Family Size in Calwa
Average Family Size in Calwa is 4.6 People.
What is the Average Household Size in Calwa
Average Household Size in Calwa is 4.5 People.
How Large is the Labor Force in Calwa?
There are 930 People in the Labor Forcein in Calwa.
What is the Percentage of People in the Labor Force in Calwa?
60.5% of People are in the Labor Force in Calwa.
What is the Unemployment Rate in Calwa?
Unemployment Rate in Calwa is 23.2%.