Cities with the Highest Percentage of Population Employed in Food Preparation & Serving in the United States
RELATED REPORTS & OPTIONS
Food Preparation & Serving
United States
Compare Cities
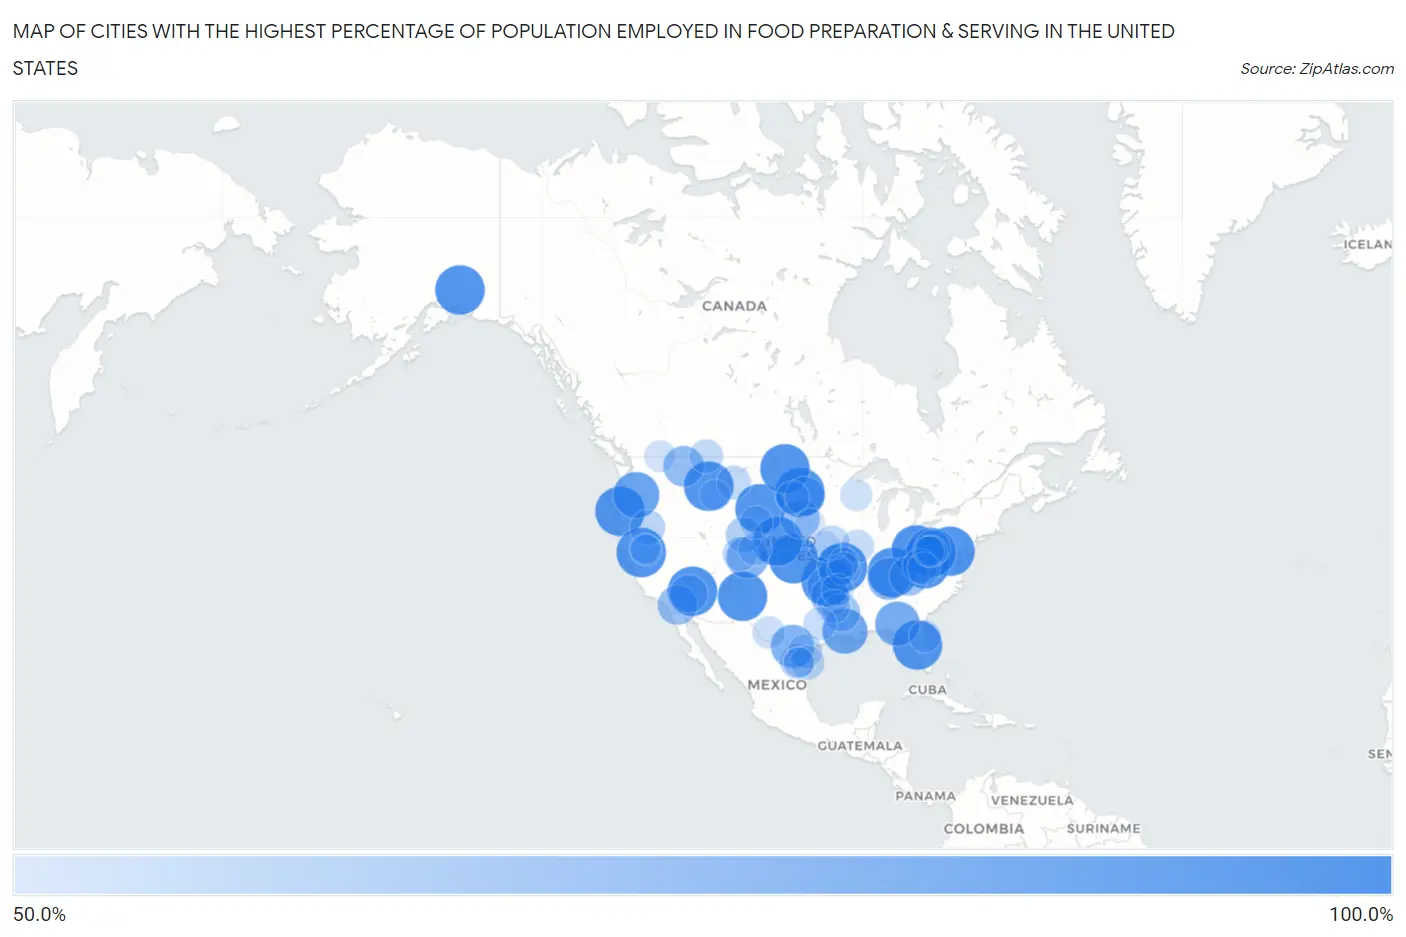
Map of Cities with the Highest Percentage of Population Employed in Food Preparation & Serving in the United States
0.0%
100.0%
Cities with the Highest Percentage of Population Employed in Food Preparation & Serving in the United States
| City | % Employed | vs State | vs National | |
| 1. | Nobleton | 100.0% | 6.1%(+93.9)#1 | 5.3%(+94.7)#1 |
| 2. | Winchester Bay | 100.0% | 5.9%(+94.1)#1 | 5.3%(+94.7)#2 |
| 3. | Breathedsville | 100.0% | 4.4%(+95.6)#1 | 5.3%(+94.7)#3 |
| 4. | Deep Water | 100.0% | 5.7%(+94.3)#1 | 5.3%(+94.7)#4 |
| 5. | Abeytas | 100.0% | 5.8%(+94.2)#1 | 5.3%(+94.7)#5 |
| 6. | El Monte Mobile | 100.0% | 5.4%(+94.6)#1 | 5.3%(+94.7)#6 |
| 7. | Hiseville | 100.0% | 5.1%(+94.9)#1 | 5.3%(+94.7)#8 |
| 8. | North San Juan | 100.0% | 5.4%(+94.6)#2 | 5.3%(+94.7)#9 |
| 9. | Bennett Springs | 100.0% | 5.2%(+94.8)#1 | 5.3%(+94.7)#10 |
| 10. | Birch Creek Colony | 100.0% | 6.7%(+93.3)#1 | 5.3%(+94.7)#11 |
| 11. | Mendeltna | 100.0% | 5.1%(+94.9)#1 | 5.3%(+94.7)#12 |
| 12. | Pine Lake | 100.0% | 5.7%(+94.3)#1 | 5.3%(+94.7)#13 |
| 13. | Radersburg | 100.0% | 6.7%(+93.3)#2 | 5.3%(+94.7)#14 |
| 14. | Rockbridge | 100.0% | 5.6%(+94.4)#1 | 5.3%(+94.7)#15 |
| 15. | Hemlock | 100.0% | 5.3%(+94.7)#1 | 5.3%(+94.7)#16 |
| 16. | Gypsy | 100.0% | 5.7%(+94.3)#2 | 5.3%(+94.7)#17 |
| 17. | Iron Post | 100.0% | 5.6%(+94.4)#1 | 5.3%(+94.7)#18 |
| 18. | La Moca Ranch | 100.0% | 5.4%(+94.6)#1 | 5.3%(+94.7)#19 |
| 19. | Osage | 100.0% | 5.9%(+94.1)#1 | 5.3%(+94.7)#20 |
| 20. | Midway Colony | 100.0% | 6.7%(+93.3)#3 | 5.3%(+94.7)#21 |
| 21. | Moccasin | 100.0% | 6.7%(+93.3)#4 | 5.3%(+94.7)#22 |
| 22. | Landusky | 100.0% | 6.7%(+93.3)#5 | 5.3%(+94.7)#23 |
| 23. | Cascade Colony | 100.0% | 6.7%(+93.3)#6 | 5.3%(+94.7)#24 |
| 24. | Sage Creek Colony | 100.0% | 6.7%(+93.3)#7 | 5.3%(+94.7)#25 |
| 25. | Martinsdale Colony | 100.0% | 6.7%(+93.3)#8 | 5.3%(+94.7)#26 |
| 26. | Haugan | 100.0% | 6.7%(+93.3)#9 | 5.3%(+94.7)#27 |
| 27. | Knob Lick | 100.0% | 5.2%(+94.8)#2 | 5.3%(+94.7)#28 |
| 28. | Brownell | 100.0% | 5.2%(+94.8)#1 | 5.3%(+94.7)#29 |
| 29. | Loring Colony | 100.0% | 6.7%(+93.3)#10 | 5.3%(+94.7)#30 |
| 30. | Wetonka | 100.0% | 5.7%(+94.3)#1 | 5.3%(+94.7)#31 |
| 31. | Lamar | 100.0% | 5.1%(+94.9)#1 | 5.3%(+94.7)#32 |
| 32. | Racetrack | 100.0% | 6.7%(+93.3)#11 | 5.3%(+94.7)#33 |
| 33. | Ruso | 100.0% | 5.2%(+94.8)#1 | 5.3%(+94.7)#34 |
| 34. | Government Camp | 91.5% | 5.9%(+85.6)#2 | 5.3%(+86.2)#35 |
| 35. | Egan | 89.2% | 6.0%(+83.2)#1 | 5.3%(+83.9)#36 |
| 36. | Fort Hunter Liggett | 89.2% | 5.4%(+83.8)#3 | 5.3%(+83.9)#37 |
| 37. | Cedar Springs | 87.5% | 5.1%(+82.4)#1 | 5.3%(+82.2)#38 |
| 38. | Eagle Bend | 84.2% | 5.6%(+78.6)#1 | 5.3%(+78.9)#39 |
| 39. | Carrizo Hill | 84.0% | 5.4%(+78.7)#2 | 5.3%(+78.8)#40 |
| 40. | Johnson Village | 81.6% | 5.2%(+76.4)#1 | 5.3%(+76.3)#41 |
| 41. | Bransford | 81.4% | 5.4%(+76.0)#1 | 5.3%(+76.1)#42 |
| 42. | Horse Creek | 78.6% | 5.7%(+72.9)#2 | 5.3%(+73.3)#43 |
| 43. | Happys Inn | 78.2% | 6.7%(+71.5)#12 | 5.3%(+72.9)#44 |
| 44. | Box | 77.8% | 5.6%(+72.2)#2 | 5.3%(+72.5)#45 |
| 45. | Gerster | 77.8% | 5.2%(+72.5)#3 | 5.3%(+72.5)#46 |
| 46. | Turner Colony | 76.7% | 6.7%(+69.9)#13 | 5.3%(+71.4)#47 |
| 47. | Salton Sea Beach | 75.5% | 5.4%(+70.1)#4 | 5.3%(+70.2)#48 |
| 48. | Pleasant Valley Colony | 75.0% | 6.7%(+68.3)#14 | 5.3%(+69.7)#49 |
| 49. | Anoka | 75.0% | 5.1%(+69.9)#2 | 5.3%(+69.7)#50 |
| 50. | Verdon | 75.0% | 5.7%(+69.3)#3 | 5.3%(+69.7)#51 |
| 51. | Pathfork | 73.9% | 5.1%(+68.8)#2 | 5.3%(+68.6)#52 |
| 52. | Smithville | 73.1% | 5.6%(+67.5)#3 | 5.3%(+67.8)#53 |
| 53. | Big Stone Colony | 72.2% | 6.7%(+65.5)#15 | 5.3%(+66.9)#54 |
| 54. | Golden Shores | 71.3% | 5.7%(+65.6)#2 | 5.3%(+66.0)#55 |
| 55. | Mount Lebanon | 71.1% | 6.0%(+65.0)#2 | 5.3%(+65.8)#56 |
| 56. | Greenwich | 68.3% | 5.2%(+63.1)#2 | 5.3%(+63.0)#57 |
| 57. | Salyer | 67.5% | 5.4%(+62.1)#5 | 5.3%(+62.2)#58 |
| 58. | Riverside | 66.7% | 5.9%(+60.8)#2 | 5.3%(+61.4)#59 |
| 59. | La Loma De Falcon | 65.4% | 5.4%(+60.0)#3 | 5.3%(+60.1)#60 |
| 60. | New Pine Creek | 64.7% | 5.4%(+59.3)#6 | 5.3%(+59.4)#61 |
| 61. | West Waynesburg | 64.5% | 5.0%(+59.5)#1 | 5.3%(+59.2)#62 |
| 62. | Mcconnell | 63.9% | 5.7%(+58.2)#3 | 5.3%(+58.6)#63 |
| 63. | Aaronsburg Cdp Washington County | 63.6% | 5.0%(+58.6)#2 | 5.3%(+58.4)#64 |
| 64. | Redstone | 63.1% | 5.2%(+57.9)#2 | 5.3%(+57.8)#65 |
| 65. | Halltown | 62.5% | 5.2%(+57.3)#4 | 5.3%(+57.2)#66 |
| 66. | Amargosa | 62.0% | 5.4%(+56.6)#4 | 5.3%(+56.7)#67 |
| 67. | Ranchette Estates | 61.7% | 5.4%(+56.4)#5 | 5.3%(+56.4)#68 |
| 68. | Sweet Grass | 61.5% | 6.7%(+54.8)#16 | 5.3%(+56.3)#69 |
| 69. | Allendale | 61.5% | 5.2%(+56.3)#5 | 5.3%(+56.3)#70 |
| 70. | Musselshell | 61.5% | 6.7%(+54.8)#17 | 5.3%(+56.3)#71 |
| 71. | Ripley | 60.0% | 5.0%(+55.0)#1 | 5.3%(+54.7)#72 |
| 72. | Domino | 60.0% | 5.4%(+54.6)#6 | 5.3%(+54.7)#73 |
| 73. | Lakeside | 60.0% | 5.2%(+54.8)#3 | 5.3%(+54.7)#74 |
| 74. | Lebanon | 59.6% | 5.7%(+53.9)#4 | 5.3%(+54.3)#75 |
| 75. | Centerville | 59.5% | 5.4%(+54.2)#7 | 5.3%(+54.2)#76 |
| 76. | Glendo | 59.3% | 5.9%(+53.5)#3 | 5.3%(+54.1)#77 |
| 77. | Evergreen | 59.3% | 5.2%(+54.0)#6 | 5.3%(+54.0)#78 |
| 78. | Corinne | 58.8% | 5.7%(+53.2)#4 | 5.3%(+53.5)#79 |
| 79. | Marathon | 58.4% | 5.4%(+53.1)#8 | 5.3%(+53.2)#80 |
| 80. | Havana | 57.5% | 5.4%(+52.1)#1 | 5.3%(+52.2)#81 |
| 81. | Jump River | 57.1% | 5.0%(+52.2)#1 | 5.3%(+51.9)#82 |
| 82. | Marineland | 57.1% | 6.1%(+51.1)#2 | 5.3%(+51.9)#83 |
| 83. | Danville | 56.5% | 5.1%(+51.4)#1 | 5.3%(+51.2)#84 |
| 84. | Carolina | 56.1% | 5.7%(+50.5)#5 | 5.3%(+50.9)#85 |
| 85. | Middle Grove | 55.6% | 5.2%(+50.3)#7 | 5.3%(+50.3)#86 |
| 86. | Fortescue | 55.6% | 5.2%(+50.3)#8 | 5.3%(+50.3)#87 |
| 87. | Sierraville | 55.0% | 5.4%(+49.6)#7 | 5.3%(+49.7)#88 |
| 88. | Loma Vista | 54.7% | 5.4%(+49.4)#9 | 5.3%(+49.5)#89 |
| 89. | Centropolis | 54.3% | 5.2%(+49.2)#3 | 5.3%(+49.1)#90 |
| 90. | Branchville | 54.3% | 4.7%(+49.7)#1 | 5.3%(+49.1)#91 |
| 91. | Jacksonburg | 54.3% | 5.7%(+48.6)#6 | 5.3%(+49.0)#92 |
| 92. | Mclean | 53.9% | 5.1%(+48.9)#3 | 5.3%(+48.7)#93 |
| 93. | Tiki Gardens | 53.8% | 7.7%(+46.1)#1 | 5.3%(+48.6)#94 |
| 94. | Emigrant | 53.8% | 6.7%(+47.1)#18 | 5.3%(+48.5)#95 |
| 95. | Breaks | 53.1% | 4.8%(+48.3)#1 | 5.3%(+47.8)#96 |
| 96. | Bagnell | 53.1% | 5.2%(+47.9)#9 | 5.3%(+47.8)#97 |
| 97. | West Danby | 53.1% | 4.8%(+48.3)#1 | 5.3%(+47.8)#98 |
| 98. | May | 53.0% | 5.4%(+47.7)#10 | 5.3%(+47.7)#99 |
| 99. | Benjamin Perez | 52.9% | 5.4%(+47.5)#11 | 5.3%(+47.6)#100 |
| 100. | Clio | 52.8% | 5.4%(+47.4)#8 | 5.3%(+47.5)#101 |
Common Questions
What are the Top 10 Cities with the Highest Percentage of Population Employed in Food Preparation & Serving in the United States?
Top 10 Cities with the Highest Percentage of Population Employed in Food Preparation & Serving in the United States are:
#1
100.0%
#2
100.0%
#3
100.0%
#4
100.0%
#5
100.0%
#6
100.0%
#7
100.0%
#8
100.0%
#9
100.0%
#10
100.0%
What city has the Highest Percentage of Population Employed in Food Preparation & Serving in the United States?
Nobleton has the Highest Percentage of Population Employed in Food Preparation & Serving in the United States with 100.0%.
What is the Percentage of Population Employed in Food Preparation & Serving in the United States?
Percentage of Population Employed in Food Preparation & Serving in the United States is 5.3%.