Victor, CA Map & Demographics
Victor Map
Victor Overview
$17,449
PER CAPITA INCOME
$45,446
AVG FAMILY INCOME
$45,446
AVG HOUSEHOLD INCOME
59.5%
WAGE / INCOME GAP [ % ]
40.5¢/ $1
WAGE / INCOME GAP [ $ ]
0.43
INEQUALITY / GINI INDEX
608
TOTAL POPULATION
252
MALE POPULATION
356
FEMALE POPULATION
70.79
MALES / 100 FEMALES
141.27
FEMALES / 100 MALES
20.6
MEDIAN AGE
3.9
AVG FAMILY SIZE
3.9
AVG HOUSEHOLD SIZE
309
LABOR FORCE [ PEOPLE ]
96.6%
PERCENT IN LABOR FORCE
Victor Zip Codes
Victor Area Codes
Income in Victor
Income Overview in Victor
Per Capita Income in Victor is $17,449, while median incomes of families and households are $45,446 and $45,446 respectively.
| Characteristic | Number | Measure |
| Per Capita Income | 608 | $17,449 |
| Median Family Income | 158 | $45,446 |
| Mean Family Income | 158 | $68,232 |
| Median Household Income | 158 | $45,446 |
| Mean Household Income | 158 | $68,232 |
| Income Deficit | 158 | $0 |
| Wage / Income Gap (%) | 608 | 59.48% |
| Wage / Income Gap ($) | 608 | 40.52¢ per $1 |
| Gini / Inequality Index | 608 | 0.43 |
Earnings by Sex in Victor
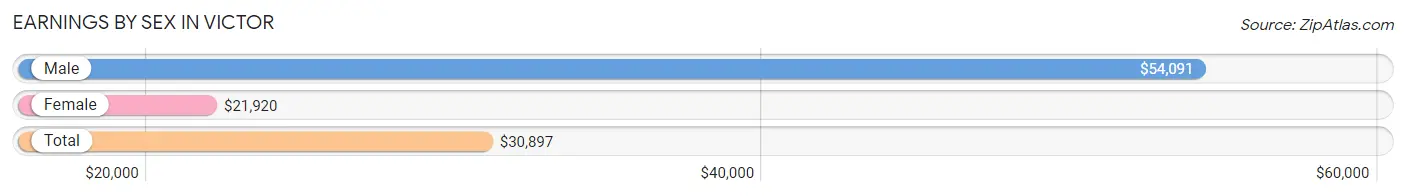
Average Earnings in Victor are $30,897, $54,091 for men and $21,920 for women, a difference of 59.5%.
| Sex | Number | Average Earnings |
| Male | 106 (34.3%) | $54,091 |
| Female | 203 (65.7%) | $21,920 |
| Total | 309 (100.0%) | $30,897 |
Earnings by Sex by Income Bracket in Victor
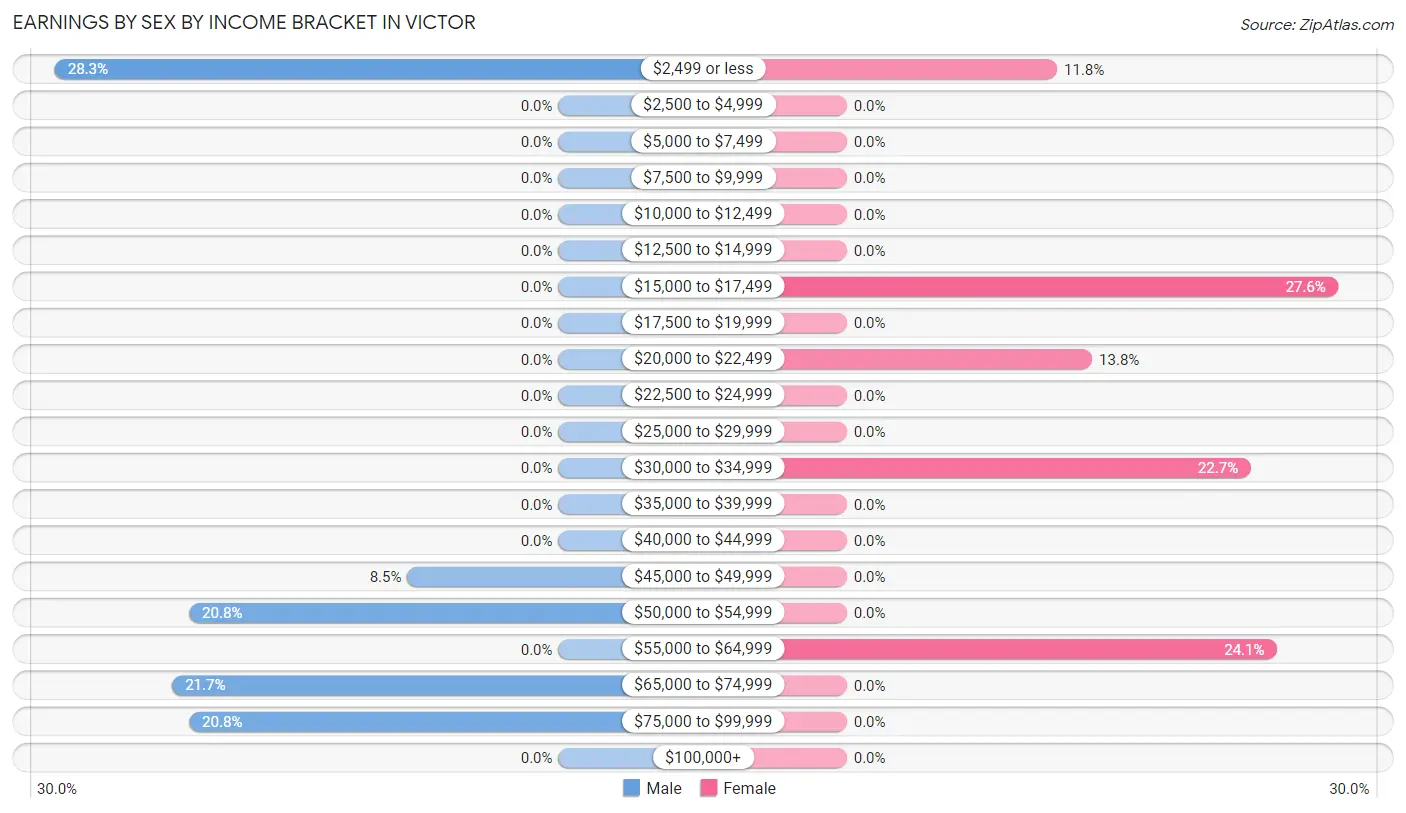
The most common earnings brackets in Victor are $2,499 or less for men (30 | 28.3%) and $15,000 to $17,499 for women (56 | 27.6%).
| Income | Male | Female |
| $2,499 or less | 30 (28.3%) | 24 (11.8%) |
| $2,500 to $4,999 | 0 (0.0%) | 0 (0.0%) |
| $5,000 to $7,499 | 0 (0.0%) | 0 (0.0%) |
| $7,500 to $9,999 | 0 (0.0%) | 0 (0.0%) |
| $10,000 to $12,499 | 0 (0.0%) | 0 (0.0%) |
| $12,500 to $14,999 | 0 (0.0%) | 0 (0.0%) |
| $15,000 to $17,499 | 0 (0.0%) | 56 (27.6%) |
| $17,500 to $19,999 | 0 (0.0%) | 0 (0.0%) |
| $20,000 to $22,499 | 0 (0.0%) | 28 (13.8%) |
| $22,500 to $24,999 | 0 (0.0%) | 0 (0.0%) |
| $25,000 to $29,999 | 0 (0.0%) | 0 (0.0%) |
| $30,000 to $34,999 | 0 (0.0%) | 46 (22.7%) |
| $35,000 to $39,999 | 0 (0.0%) | 0 (0.0%) |
| $40,000 to $44,999 | 0 (0.0%) | 0 (0.0%) |
| $45,000 to $49,999 | 9 (8.5%) | 0 (0.0%) |
| $50,000 to $54,999 | 22 (20.7%) | 0 (0.0%) |
| $55,000 to $64,999 | 0 (0.0%) | 49 (24.1%) |
| $65,000 to $74,999 | 23 (21.7%) | 0 (0.0%) |
| $75,000 to $99,999 | 22 (20.7%) | 0 (0.0%) |
| $100,000+ | 0 (0.0%) | 0 (0.0%) |
| Total | 106 (100.0%) | 203 (100.0%) |
Earnings by Sex by Educational Attainment in Victor
| Educational Attainment | Male Income | Female Income |
| Less than High School | - | - |
| High School Diploma | - | - |
| College or Associate's Degree | - | - |
| Bachelor's Degree | - | - |
| Graduate Degree | - | - |
| Total | - | - |
Family Income in Victor
Family Income Brackets in Victor
According to the Victor family income data, there are 46 families falling into the $25,000 to $34,999 income range, which is the most common income bracket and makes up 29.1% of all families.
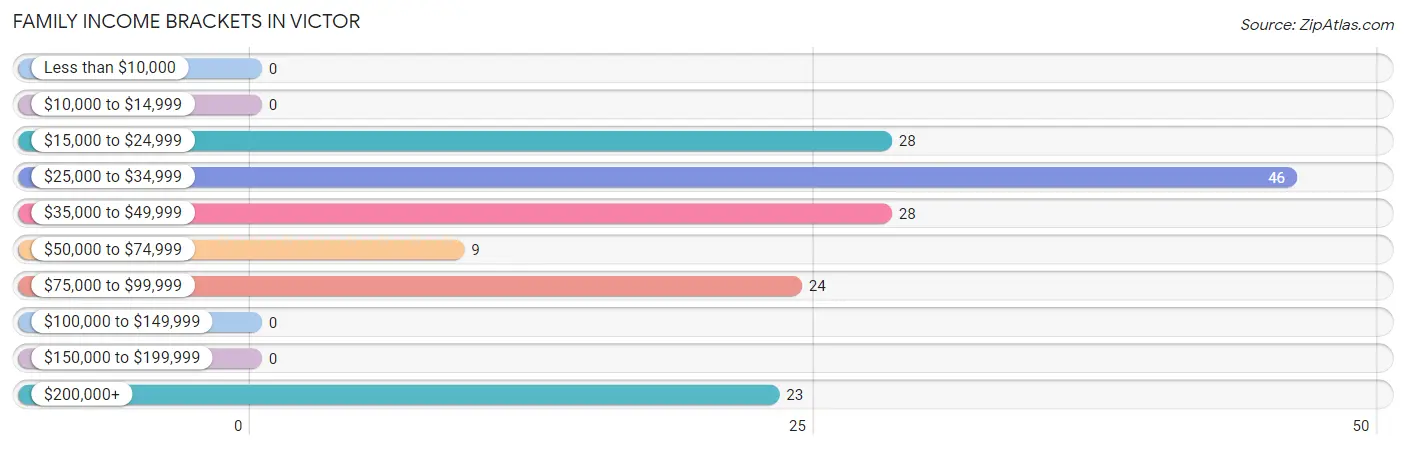
| Income Bracket | # Families | % Families |
| Less than $10,000 | 0 | 0.0% |
| $10,000 to $14,999 | 0 | 0.0% |
| $15,000 to $24,999 | 28 | 17.7% |
| $25,000 to $34,999 | 46 | 29.1% |
| $35,000 to $49,999 | 28 | 17.7% |
| $50,000 to $74,999 | 9 | 5.7% |
| $75,000 to $99,999 | 24 | 15.2% |
| $100,000 to $149,999 | 0 | 0.0% |
| $150,000 to $199,999 | 0 | 0.0% |
| $200,000+ | 23 | 14.6% |
Family Income by Famaliy Size in Victor
4-person families (98 | 62.0%) account for the highest median family income in Victor with $45,268 per family, while 4-person families (98 | 62.0%) have the highest median income of $11,317 per family member.
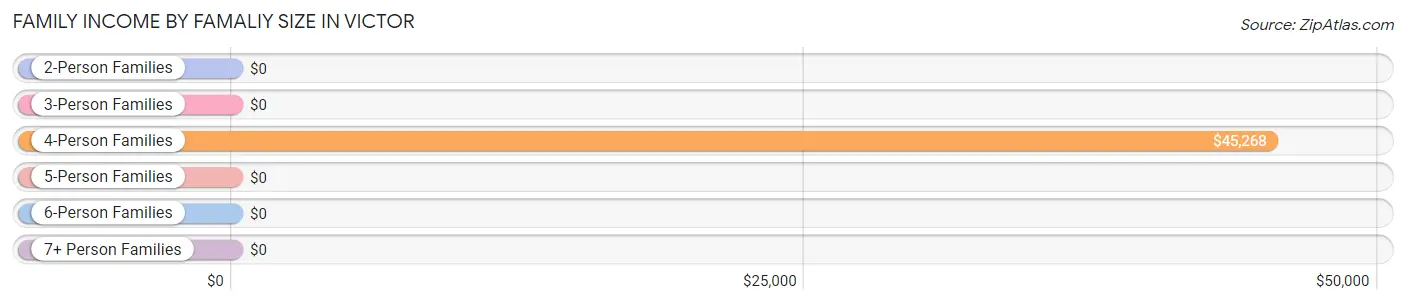
| Income Bracket | # Families | Median Income |
| 2-Person Families | 37 (23.4%) | $0 |
| 3-Person Families | 0 (0.0%) | $0 |
| 4-Person Families | 98 (62.0%) | $45,268 |
| 5-Person Families | 0 (0.0%) | $0 |
| 6-Person Families | 23 (14.6%) | $0 |
| 7+ Person Families | 0 (0.0%) | $0 |
| Total | 158 (100.0%) | $45,446 |
Family Income by Number of Earners in Victor
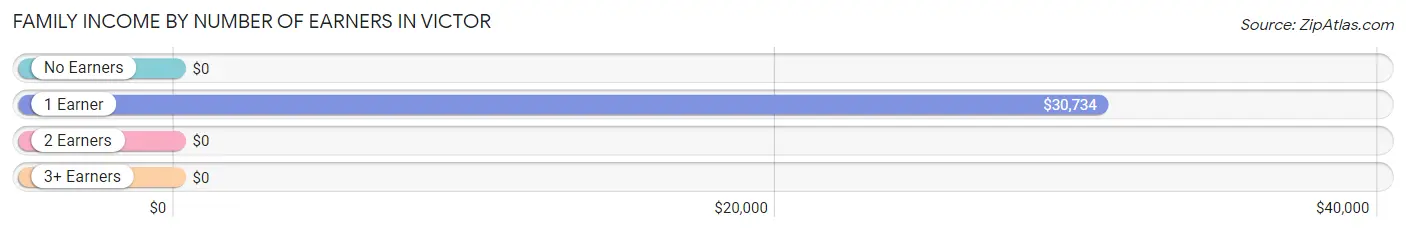
| Number of Earners | # Families | Median Income |
| No Earners | 0 (0.0%) | $0 |
| 1 Earner | 83 (52.5%) | $30,734 |
| 2 Earners | 52 (32.9%) | $0 |
| 3+ Earners | 23 (14.6%) | $0 |
| Total | 158 (100.0%) | $45,446 |
Household Income in Victor
Household Income Brackets in Victor
With 46 households falling in the category, the $25,000 to $34,999 income range is the most frequent in Victor, accounting for 29.1% of all households.
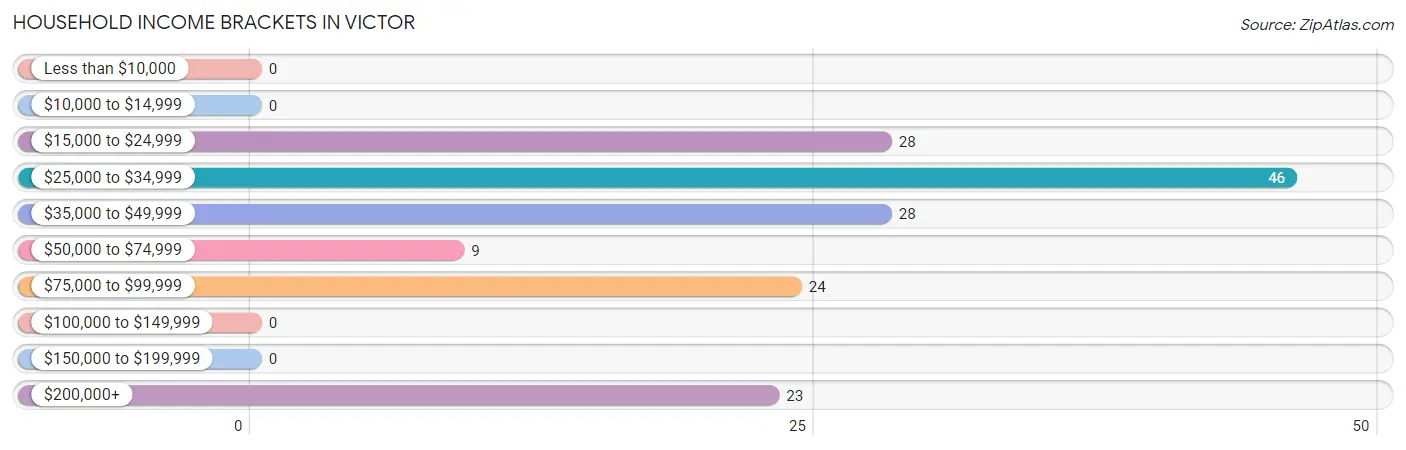
| Income Bracket | # Households | % Households |
| Less than $10,000 | 0 | 0.0% |
| $10,000 to $14,999 | 0 | 0.0% |
| $15,000 to $24,999 | 28 | 17.7% |
| $25,000 to $34,999 | 46 | 29.1% |
| $35,000 to $49,999 | 28 | 17.7% |
| $50,000 to $74,999 | 9 | 5.7% |
| $75,000 to $99,999 | 24 | 15.2% |
| $100,000 to $149,999 | 0 | 0.0% |
| $150,000 to $199,999 | 0 | 0.0% |
| $200,000+ | 23 | 14.6% |
Household Income by Householder Age in Victor
The median household income in Victor is $45,446, with the highest median household income of $31,902 found in the 25 to 44 years age bracket for the primary householder. A total of 126 households (79.7%) fall into this category.

| Income Bracket | # Households | Median Income |
| 15 to 24 Years | 0 (0.0%) | $0 |
| 25 to 44 Years | 126 (79.7%) | $31,902 |
| 45 to 64 Years | 32 (20.3%) | $0 |
| 65+ Years | 0 (0.0%) | $0 |
| Total | 158 (100.0%) | $45,446 |
Poverty in Victor
Income Below Poverty by Sex and Age in Victor
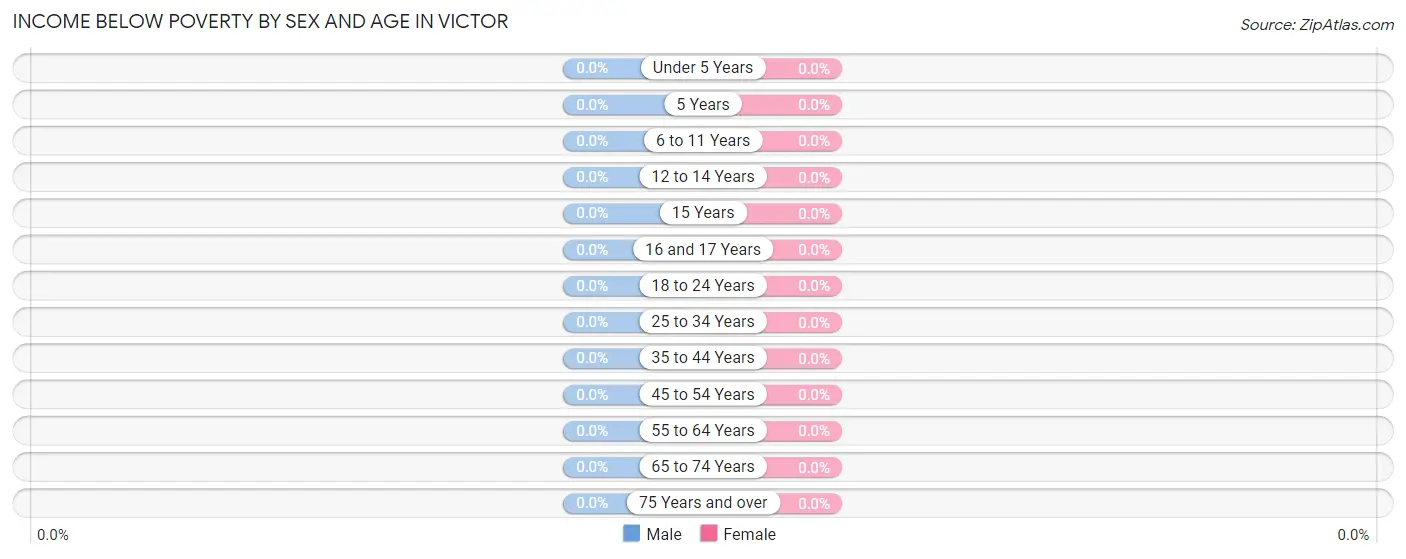
| Age Bracket | Male | Female |
| Under 5 Years | 0 (0.0%) | 0 (0.0%) |
| 5 Years | 0 (0.0%) | 0 (0.0%) |
| 6 to 11 Years | 0 (0.0%) | 0 (0.0%) |
| 12 to 14 Years | 0 (0.0%) | 0 (0.0%) |
| 15 Years | 0 (0.0%) | 0 (0.0%) |
| 16 and 17 Years | 0 (0.0%) | 0 (0.0%) |
| 18 to 24 Years | 0 (0.0%) | 0 (0.0%) |
| 25 to 34 Years | 0 (0.0%) | 0 (0.0%) |
| 35 to 44 Years | 0 (0.0%) | 0 (0.0%) |
| 45 to 54 Years | 0 (0.0%) | 0 (0.0%) |
| 55 to 64 Years | 0 (0.0%) | 0 (0.0%) |
| 65 to 74 Years | 0 (0.0%) | 0 (0.0%) |
| 75 Years and over | 0 (0.0%) | 0 (0.0%) |
| Total | 0 (0.0%) | 0 (0.0%) |
Income Above Poverty by Sex and Age in Victor
According to the poverty statistics in Victor, males aged under 5 years and females aged under 5 years are the age groups that are most secure financially, with 100.0% of males and 100.0% of females in these age groups living above the poverty line.
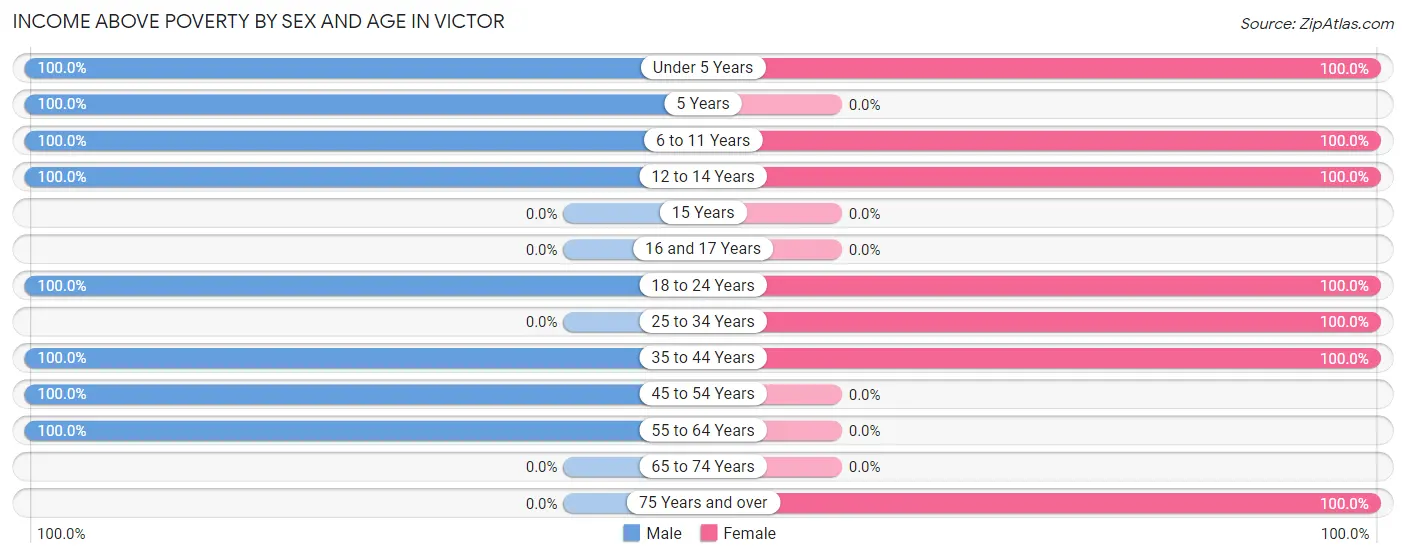
| Age Bracket | Male | Female |
| Under 5 Years | 17 (100.0%) | 12 (100.0%) |
| 5 Years | 53 (100.0%) | 0 (0.0%) |
| 6 to 11 Years | 21 (100.0%) | 80 (100.0%) |
| 12 to 14 Years | 55 (100.0%) | 50 (100.0%) |
| 15 Years | 0 (0.0%) | 0 (0.0%) |
| 16 and 17 Years | 0 (0.0%) | 0 (0.0%) |
| 18 to 24 Years | 22 (100.0%) | 56 (100.0%) |
| 25 to 34 Years | 0 (0.0%) | 70 (100.0%) |
| 35 to 44 Years | 52 (100.0%) | 77 (100.0%) |
| 45 to 54 Years | 23 (100.0%) | 0 (0.0%) |
| 55 to 64 Years | 9 (100.0%) | 0 (0.0%) |
| 65 to 74 Years | 0 (0.0%) | 0 (0.0%) |
| 75 Years and over | 0 (0.0%) | 11 (100.0%) |
| Total | 252 (100.0%) | 356 (100.0%) |
Income Below Poverty Among Married-Couple Families in Victor
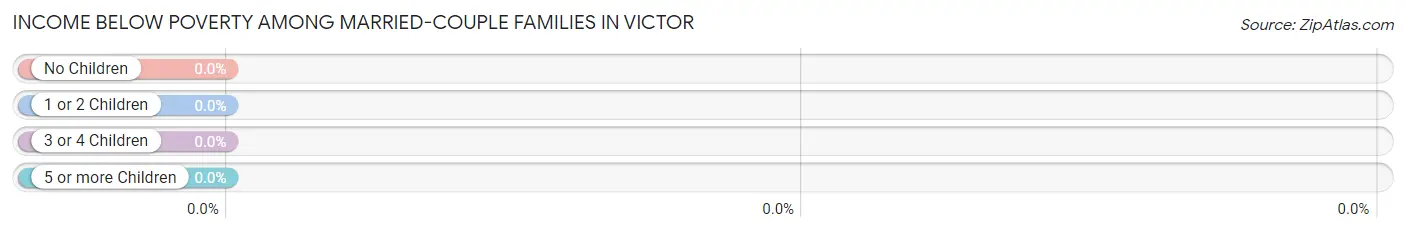
| Children | Above Poverty | Below Poverty |
| No Children | 0 (0.0%) | 0 (0.0%) |
| 1 or 2 Children | 75 (100.0%) | 0 (0.0%) |
| 3 or 4 Children | 0 (0.0%) | 0 (0.0%) |
| 5 or more Children | 0 (0.0%) | 0 (0.0%) |
| Total | 75 (100.0%) | 0 (0.0%) |
Income Below Poverty Among Single-Parent Households in Victor
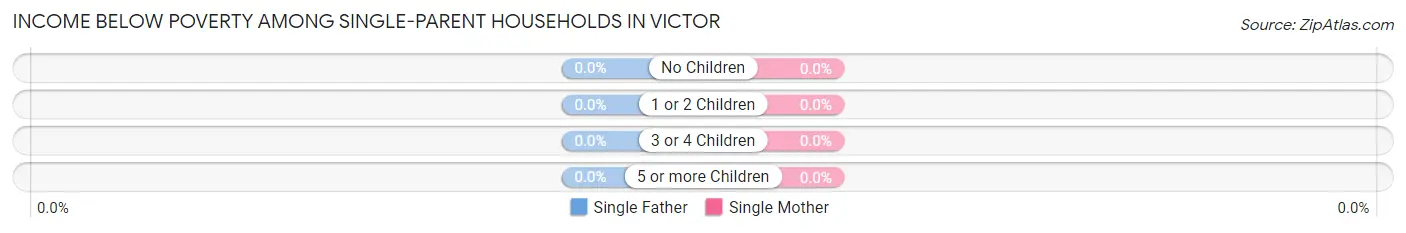
| Children | Single Father | Single Mother |
| No Children | 0 (0.0%) | 0 (0.0%) |
| 1 or 2 Children | 0 (0.0%) | 0 (0.0%) |
| 3 or 4 Children | 0 (0.0%) | 0 (0.0%) |
| 5 or more Children | 0 (0.0%) | 0 (0.0%) |
| Total | 0 (0.0%) | 0 (0.0%) |
Income Below Poverty Among Married-Couple vs Single-Parent Households in Victor
| Children | Married-Couple Families | Single-Parent Households |
| No Children | 0 (0.0%) | 0 (0.0%) |
| 1 or 2 Children | 0 (0.0%) | 0 (0.0%) |
| 3 or 4 Children | 0 (0.0%) | 0 (0.0%) |
| 5 or more Children | 0 (0.0%) | 0 (0.0%) |
| Total | 0 (0.0%) | 0 (0.0%) |
Race in Victor
The most populous races in Victor are Hispanic or Latino (361 | 59.4%), Two or more Races (341 | 56.1%), and White / Caucasian (247 | 40.6%).
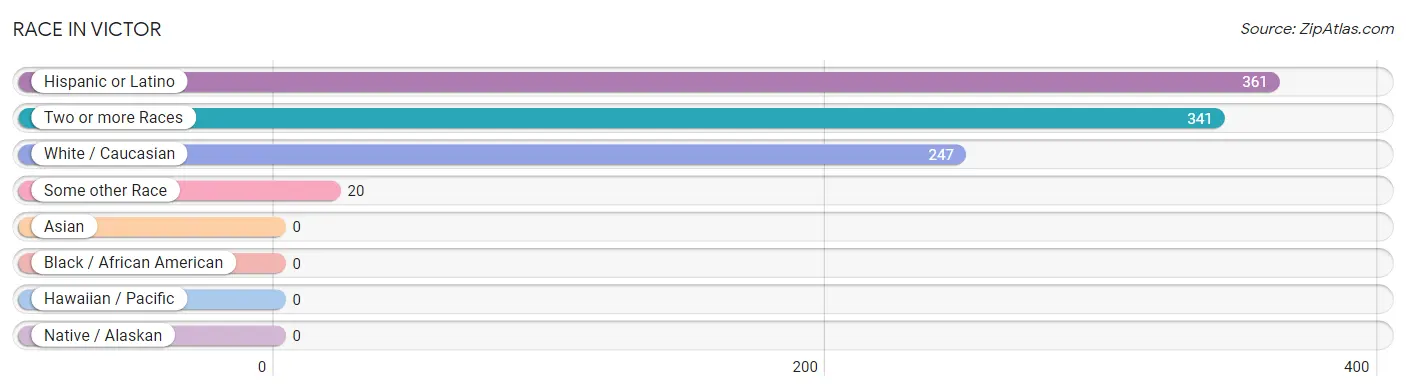
| Race | # Population | % Population |
| Asian | 0 | 0.0% |
| Black / African American | 0 | 0.0% |
| Hawaiian / Pacific | 0 | 0.0% |
| Hispanic or Latino | 361 | 59.4% |
| Native / Alaskan | 0 | 0.0% |
| White / Caucasian | 247 | 40.6% |
| Two or more Races | 341 | 56.1% |
| Some other Race | 20 | 3.3% |
| Total | 608 | 100.0% |
Ancestry in Victor
The most populous ancestries reported in Victor are Mexican (361 | 59.4%), Irish (247 | 40.6%), English (59 | 9.7%), Norwegian (55 | 9.0%), and German (30 | 4.9%), together accounting for 123.7% of all Victor residents.
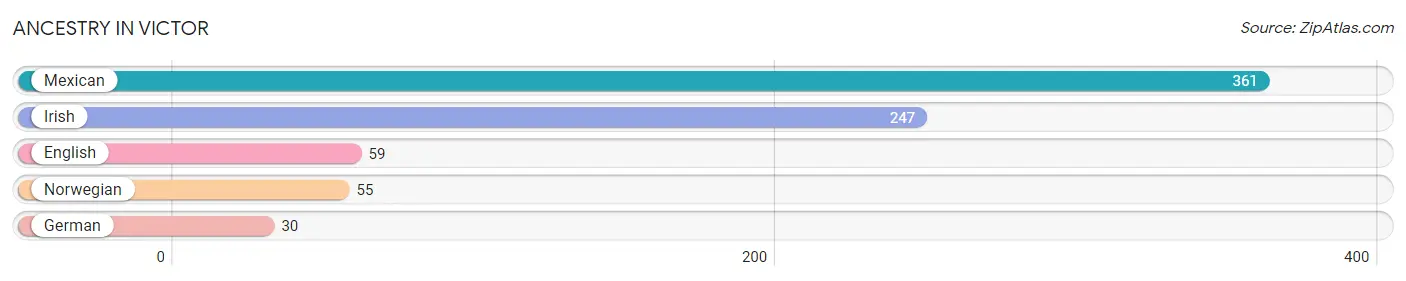
| Ancestry | # Population | % Population |
| English | 59 | 9.7% |
| German | 30 | 4.9% |
| Irish | 247 | 40.6% |
| Mexican | 361 | 59.4% |
| Norwegian | 55 | 9.0% | View All 5 Rows |
Immigrants in Victor
The most numerous immigrant groups reported in Victor came from Central America (251 | 41.3%), Latin America (251 | 41.3%), and Mexico (251 | 41.3%), together accounting for 123.8% of all Victor residents.
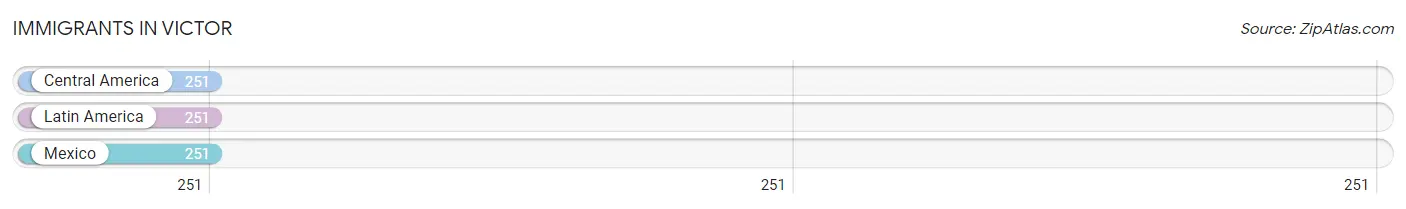
| Immigration Origin | # Population | % Population |
| Central America | 251 | 41.3% |
| Latin America | 251 | 41.3% |
| Mexico | 251 | 41.3% | View All 3 Rows |
Sex and Age in Victor
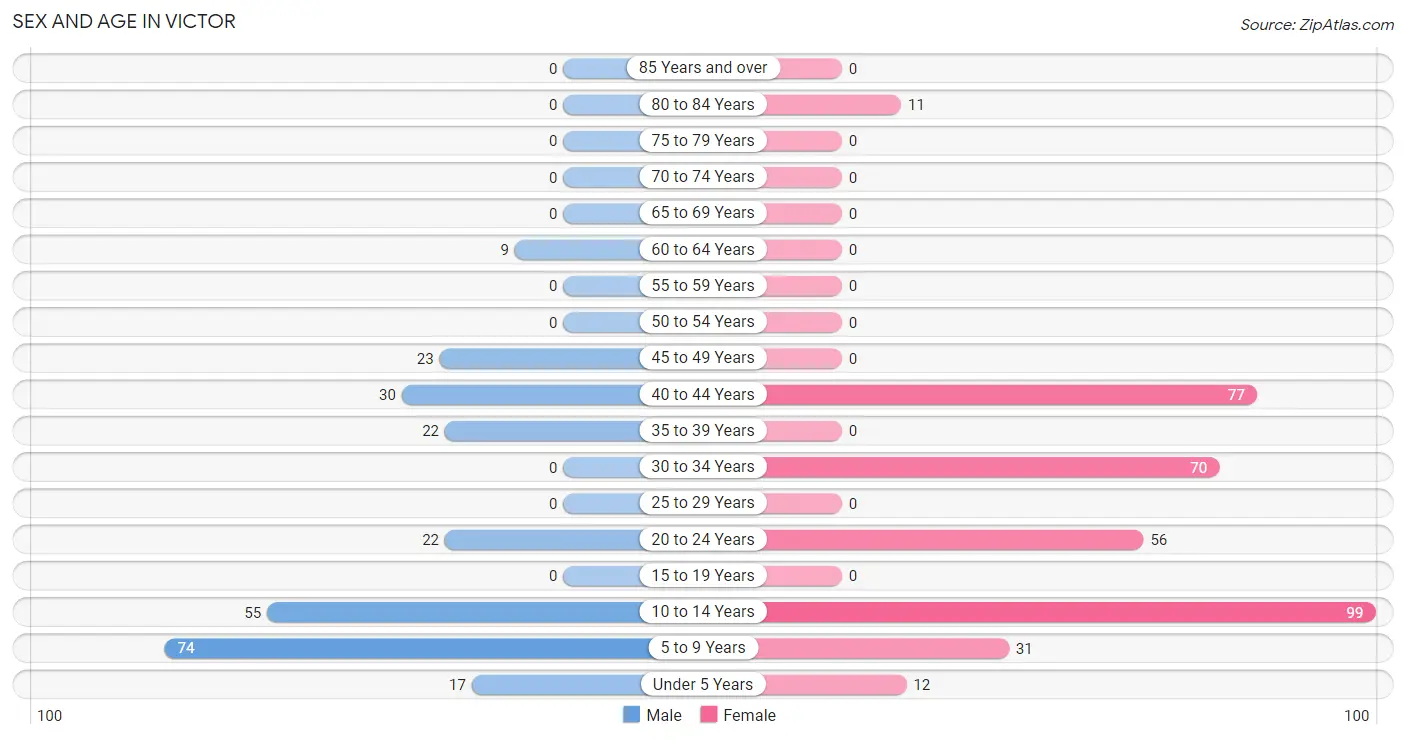
Sex and Age in Victor
The most populous age groups in Victor are 5 to 9 Years (74 | 29.4%) for men and 10 to 14 Years (99 | 27.8%) for women.
| Age Bracket | Male | Female |
| Under 5 Years | 17 (6.8%) | 12 (3.4%) |
| 5 to 9 Years | 74 (29.4%) | 31 (8.7%) |
| 10 to 14 Years | 55 (21.8%) | 99 (27.8%) |
| 15 to 19 Years | 0 (0.0%) | 0 (0.0%) |
| 20 to 24 Years | 22 (8.7%) | 56 (15.7%) |
| 25 to 29 Years | 0 (0.0%) | 0 (0.0%) |
| 30 to 34 Years | 0 (0.0%) | 70 (19.7%) |
| 35 to 39 Years | 22 (8.7%) | 0 (0.0%) |
| 40 to 44 Years | 30 (11.9%) | 77 (21.6%) |
| 45 to 49 Years | 23 (9.1%) | 0 (0.0%) |
| 50 to 54 Years | 0 (0.0%) | 0 (0.0%) |
| 55 to 59 Years | 0 (0.0%) | 0 (0.0%) |
| 60 to 64 Years | 9 (3.6%) | 0 (0.0%) |
| 65 to 69 Years | 0 (0.0%) | 0 (0.0%) |
| 70 to 74 Years | 0 (0.0%) | 0 (0.0%) |
| 75 to 79 Years | 0 (0.0%) | 0 (0.0%) |
| 80 to 84 Years | 0 (0.0%) | 11 (3.1%) |
| 85 Years and over | 0 (0.0%) | 0 (0.0%) |
| Total | 252 (100.0%) | 356 (100.0%) |
Families and Households in Victor
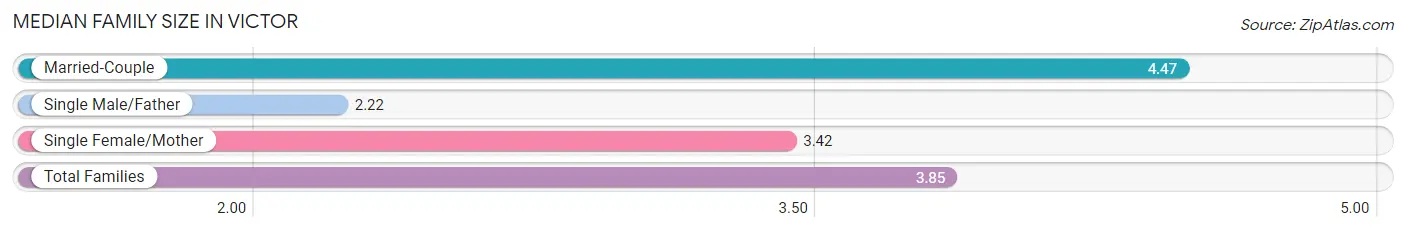
Median Family Size in Victor
The median family size in Victor is 3.85 persons per family, with married-couple families (75 | 47.5%) accounting for the largest median family size of 4.47 persons per family. On the other hand, single male/father families (9 | 5.7%) represent the smallest median family size with 2.22 persons per family.
| Family Type | # Families | Family Size |
| Married-Couple | 75 (47.5%) | 4.47 |
| Single Male/Father | 9 (5.7%) | 2.22 |
| Single Female/Mother | 74 (46.8%) | 3.42 |
| Total Families | 158 (100.0%) | 3.85 |
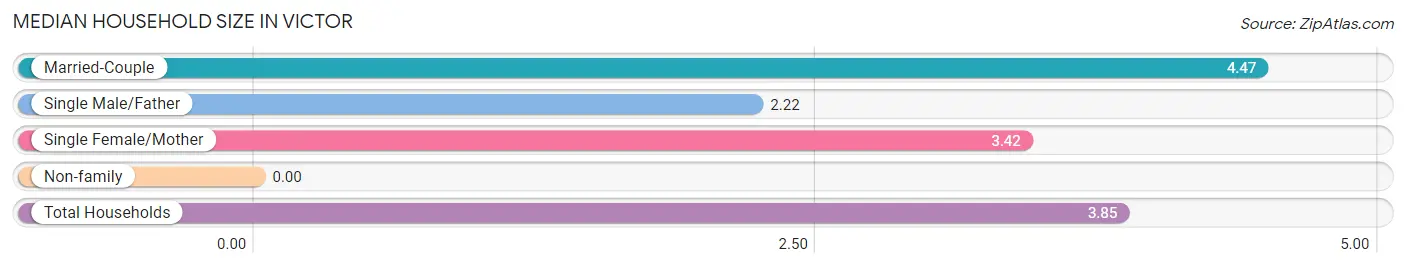
Median Household Size in Victor
| Household Type | # Households | Household Size |
| Married-Couple | 75 (47.5%) | 4.47 |
| Single Male/Father | 9 (5.7%) | 2.22 |
| Single Female/Mother | 74 (46.8%) | 3.42 |
| Non-family | 0 (0.0%) | - |
| Total Households | 158 (100.0%) | 3.85 |
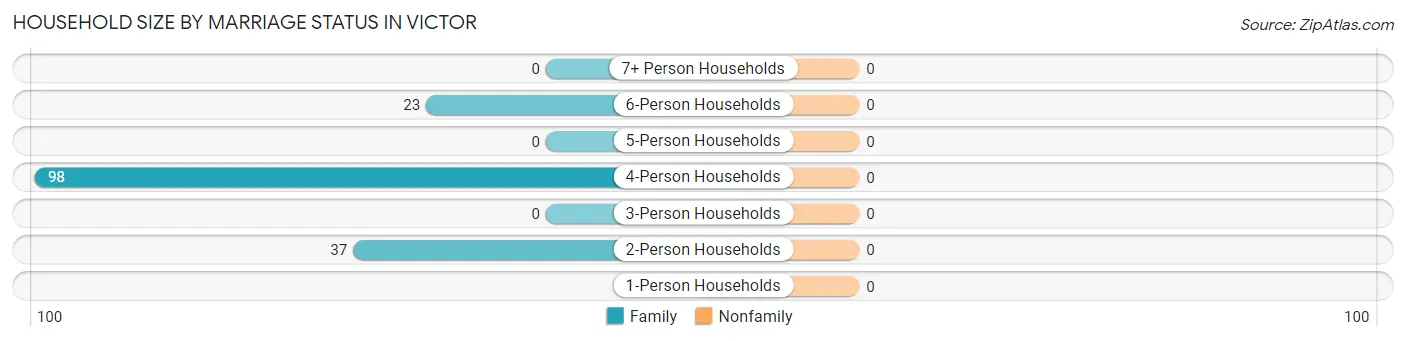
Household Size by Marriage Status in Victor
| Household Size | Family Households | Nonfamily Households |
| 1-Person Households | - | 0 (0.0%) |
| 2-Person Households | 37 (23.4%) | 0 (0.0%) |
| 3-Person Households | 0 (0.0%) | 0 (0.0%) |
| 4-Person Households | 98 (62.0%) | 0 (0.0%) |
| 5-Person Households | 0 (0.0%) | 0 (0.0%) |
| 6-Person Households | 23 (14.6%) | 0 (0.0%) |
| 7+ Person Households | 0 (0.0%) | 0 (0.0%) |
| Total | 158 (100.0%) | 0 (0.0%) |
Female Fertility in Victor
Fertility by Age in Victor
Average fertility rate in Victor is 118.0 births per 1,000 women. Women in the age bracket of 20 to 34 years have the highest fertility rate with 190.0 births per 1,000 women. Women in the age bracket of 20 to 34 years acount for 100.0% of all women with births.
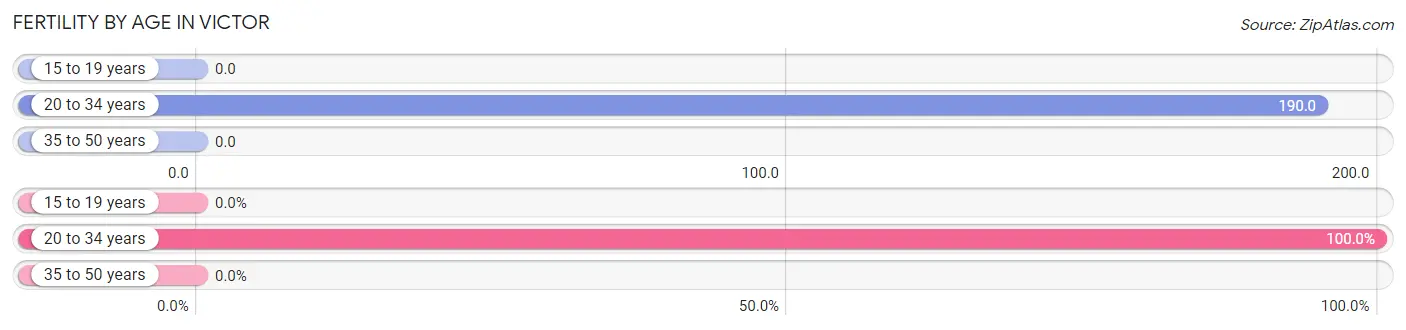
| Age Bracket | Women with Births | Births / 1,000 Women |
| 15 to 19 years | 0 (0.0%) | 0.0 |
| 20 to 34 years | 24 (100.0%) | 190.0 |
| 35 to 50 years | 0 (0.0%) | 0.0 |
| Total | 24 (100.0%) | 118.0 |
Fertility by Age by Marriage Status in Victor
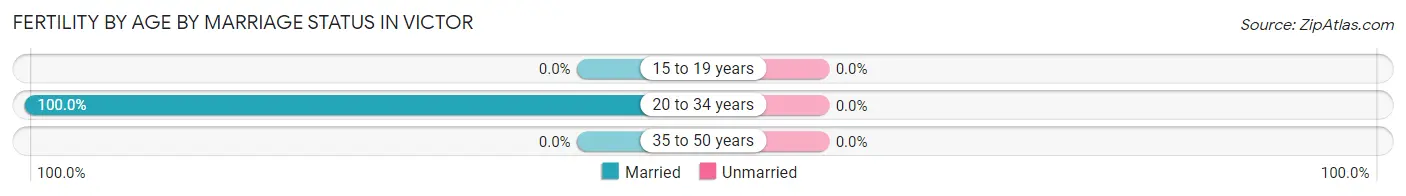
| Age Bracket | Married | Unmarried |
| 15 to 19 years | 0 (0.0%) | 0 (0.0%) |
| 20 to 34 years | 24 (100.0%) | 0 (0.0%) |
| 35 to 50 years | 0 (0.0%) | 0 (0.0%) |
| Total | 24 (100.0%) | 0 (0.0%) |
Fertility by Education in Victor
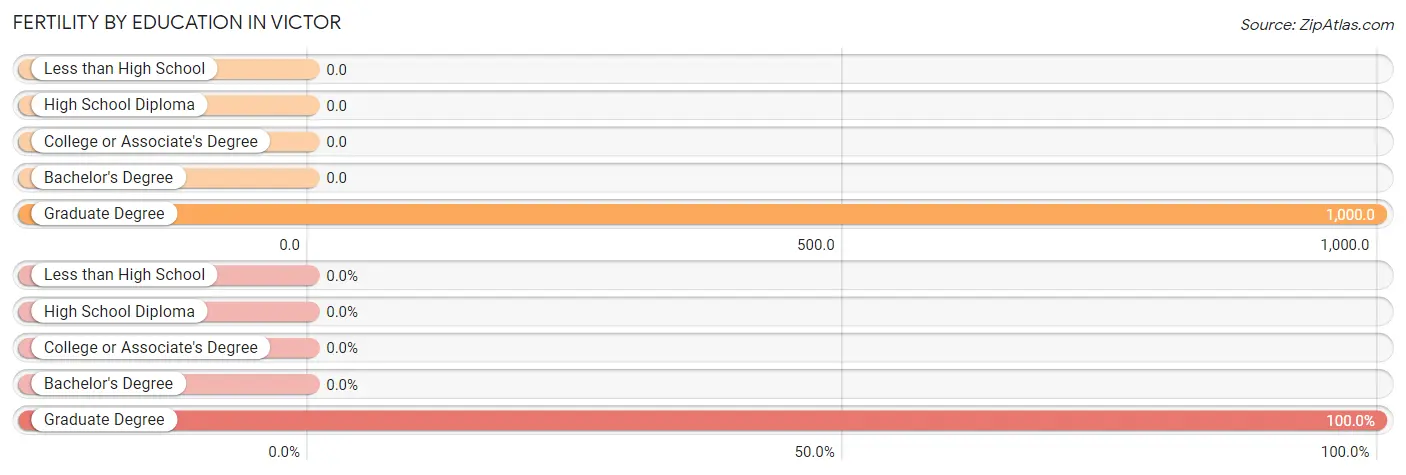
| Educational Attainment | Women with Births | Births / 1,000 Women |
| Less than High School | 0 (0.0%) | 0.0 |
| High School Diploma | 0 (0.0%) | 0.0 |
| College or Associate's Degree | 0 (0.0%) | 0.0 |
| Bachelor's Degree | 0 (0.0%) | 0.0 |
| Graduate Degree | 24 (100.0%) | 1,000.0 |
| Total | 24 (100.0%) | 118.0 |
Fertility by Education by Marriage Status in Victor
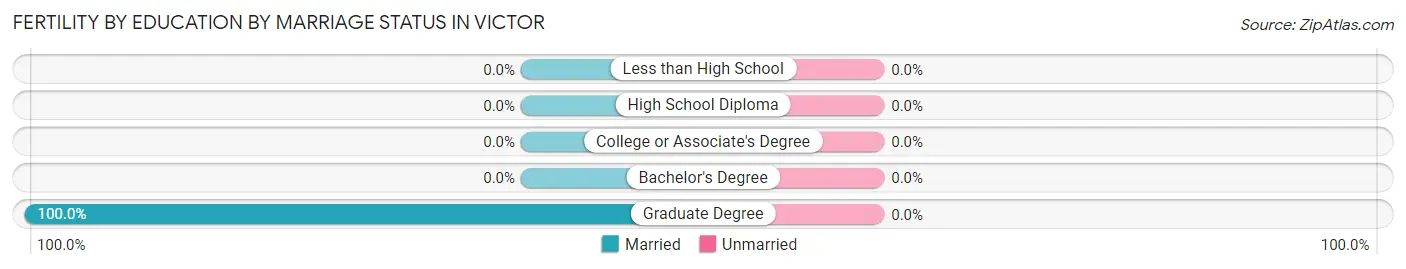
| Educational Attainment | Married | Unmarried |
| Less than High School | 0 (0.0%) | 0 (0.0%) |
| High School Diploma | 0 (0.0%) | 0 (0.0%) |
| College or Associate's Degree | 0 (0.0%) | 0 (0.0%) |
| Bachelor's Degree | 0 (0.0%) | 0 (0.0%) |
| Graduate Degree | 24 (100.0%) | 0 (0.0%) |
| Total | 24 (100.0%) | 0 (0.0%) |
Employment Characteristics in Victor
Employment by Class of Employer in Victor
Among the 309 employed individuals in Victor, private company employees (222 | 71.8%), self-employed (not incorporated) (30 | 9.7%), and not-for-profit organizations (29 | 9.4%) make up the most common classes of employment.
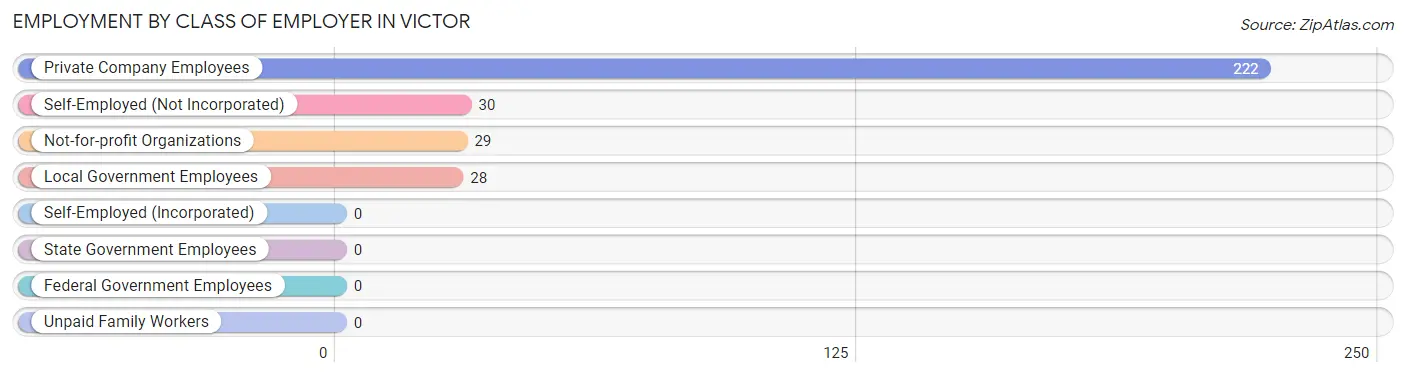
| Employer Class | # Employees | % Employees |
| Private Company Employees | 222 | 71.8% |
| Self-Employed (Incorporated) | 0 | 0.0% |
| Self-Employed (Not Incorporated) | 30 | 9.7% |
| Not-for-profit Organizations | 29 | 9.4% |
| Local Government Employees | 28 | 9.1% |
| State Government Employees | 0 | 0.0% |
| Federal Government Employees | 0 | 0.0% |
| Unpaid Family Workers | 0 | 0.0% |
| Total | 309 | 100.0% |
Employment Status by Age in Victor
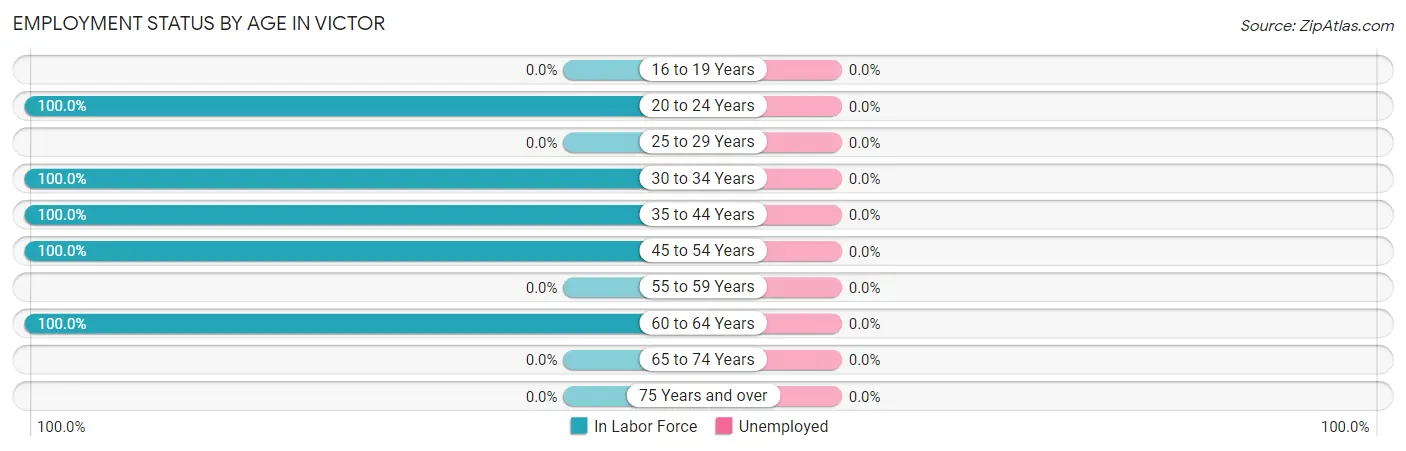
| Age Bracket | In Labor Force | Unemployed |
| 16 to 19 Years | 0 (0.0%) | 0 (0.0%) |
| 20 to 24 Years | 78 (100.0%) | 0 (0.0%) |
| 25 to 29 Years | 0 (0.0%) | 0 (0.0%) |
| 30 to 34 Years | 70 (100.0%) | 0 (0.0%) |
| 35 to 44 Years | 129 (100.0%) | 0 (0.0%) |
| 45 to 54 Years | 23 (100.0%) | 0 (0.0%) |
| 55 to 59 Years | 0 (0.0%) | 0 (0.0%) |
| 60 to 64 Years | 9 (100.0%) | 0 (0.0%) |
| 65 to 74 Years | 0 (0.0%) | 0 (0.0%) |
| 75 Years and over | 0 (0.0%) | 0 (0.0%) |
| Total | 309 (96.6%) | 0 (0.0%) |
Employment Status by Educational Attainment in Victor
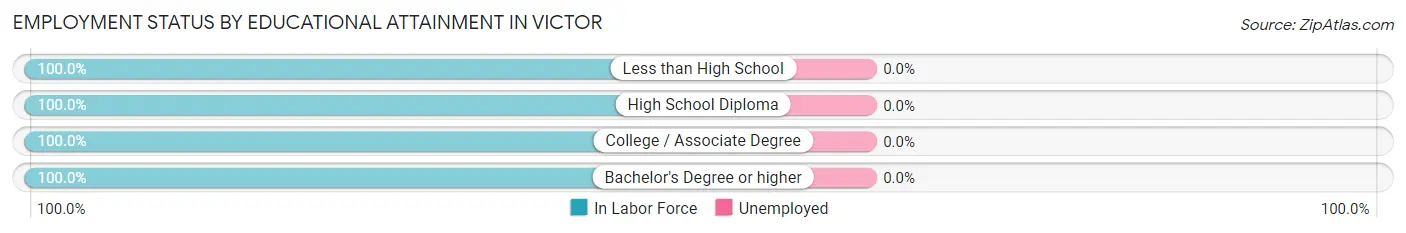
| Educational Attainment | In Labor Force | Unemployed |
| Less than High School | 69 (100.0%) | 0 (0.0%) |
| High School Diploma | 30 (100.0%) | 0 (0.0%) |
| College / Associate Degree | 108 (100.0%) | 0 (0.0%) |
| Bachelor's Degree or higher | 24 (100.0%) | 0 (0.0%) |
| Total | 231 (100.0%) | 0 (0.0%) |
Employment Occupations by Sex in Victor
Management, Business, Science and Arts Occupations
The most common Management, Business, Science and Arts occupations in Victor are , and Management (51 | 16.5%).
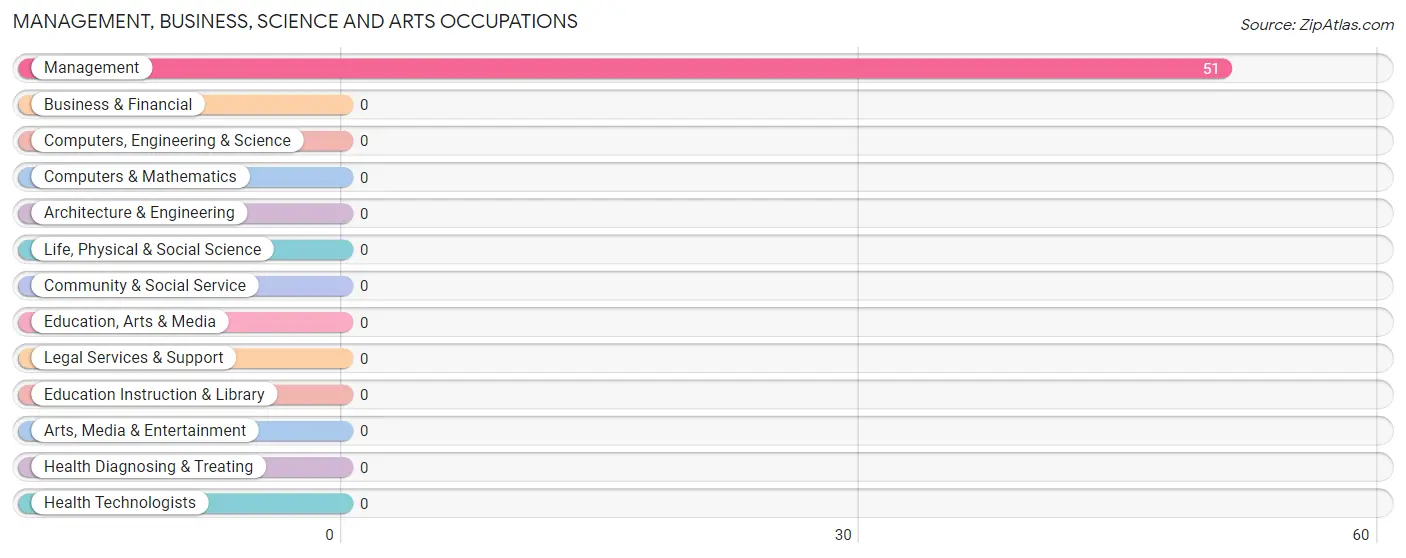
Management, Business, Science and Arts Occupations by Sex
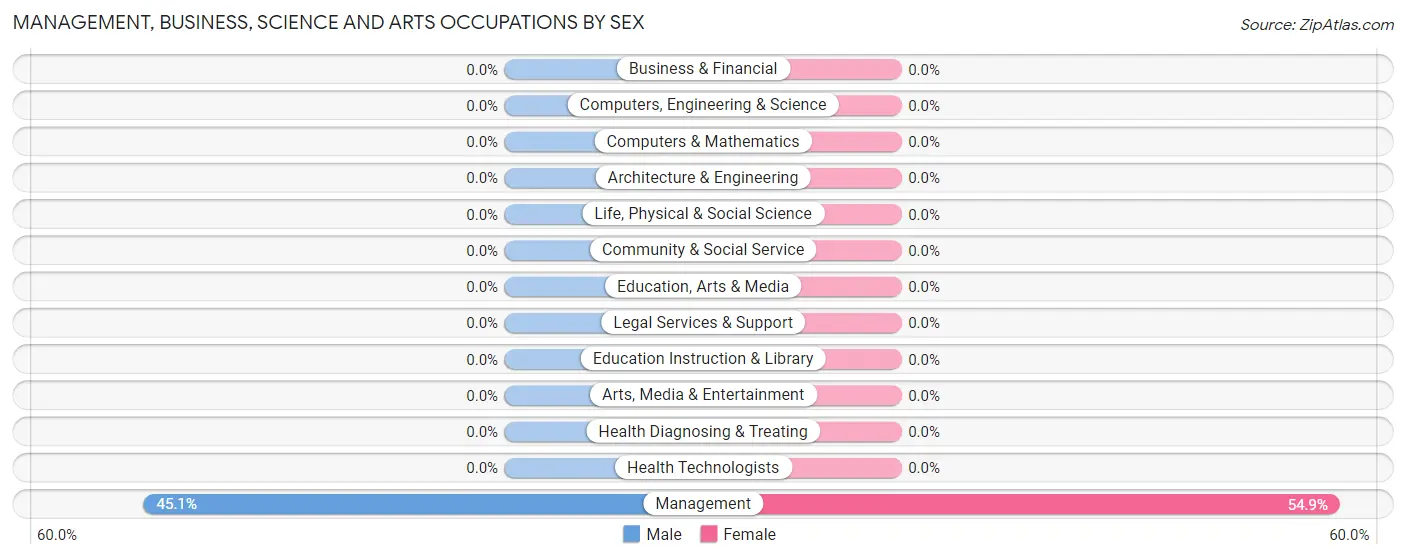
| Occupation | Male | Female |
| Management | 23 (45.1%) | 28 (54.9%) |
| Business & Financial | 0 (0.0%) | 0 (0.0%) |
| Computers, Engineering & Science | 0 (0.0%) | 0 (0.0%) |
| Computers & Mathematics | 0 (0.0%) | 0 (0.0%) |
| Architecture & Engineering | 0 (0.0%) | 0 (0.0%) |
| Life, Physical & Social Science | 0 (0.0%) | 0 (0.0%) |
| Community & Social Service | 0 (0.0%) | 0 (0.0%) |
| Education, Arts & Media | 0 (0.0%) | 0 (0.0%) |
| Legal Services & Support | 0 (0.0%) | 0 (0.0%) |
| Education Instruction & Library | 0 (0.0%) | 0 (0.0%) |
| Arts, Media & Entertainment | 0 (0.0%) | 0 (0.0%) |
| Health Diagnosing & Treating | 0 (0.0%) | 0 (0.0%) |
| Health Technologists | 0 (0.0%) | 0 (0.0%) |
| Total (Category) | 23 (45.1%) | 28 (54.9%) |
| Total (Overall) | 106 (34.3%) | 203 (65.7%) |
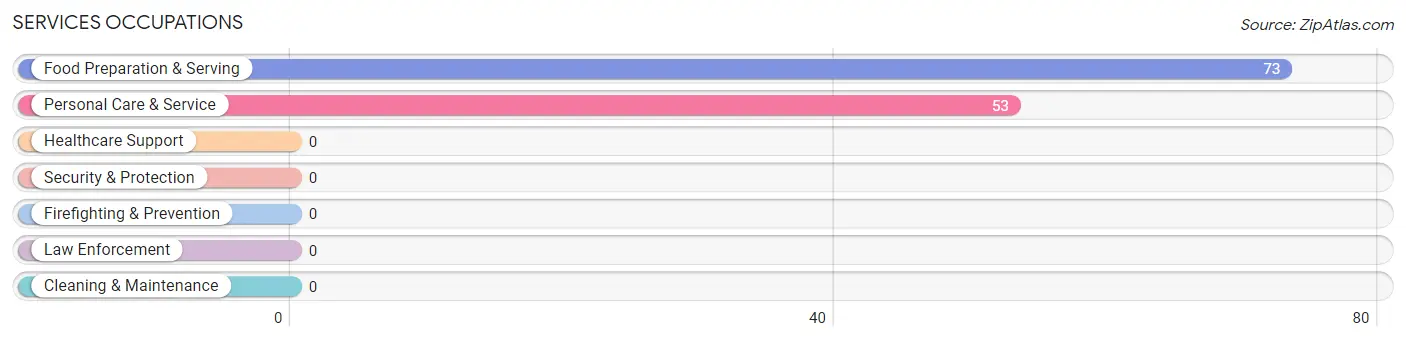
Services Occupations
The most common Services occupations in Victor are Food Preparation & Serving (73 | 23.6%), and Personal Care & Service (53 | 17.2%).
Services Occupations by Sex
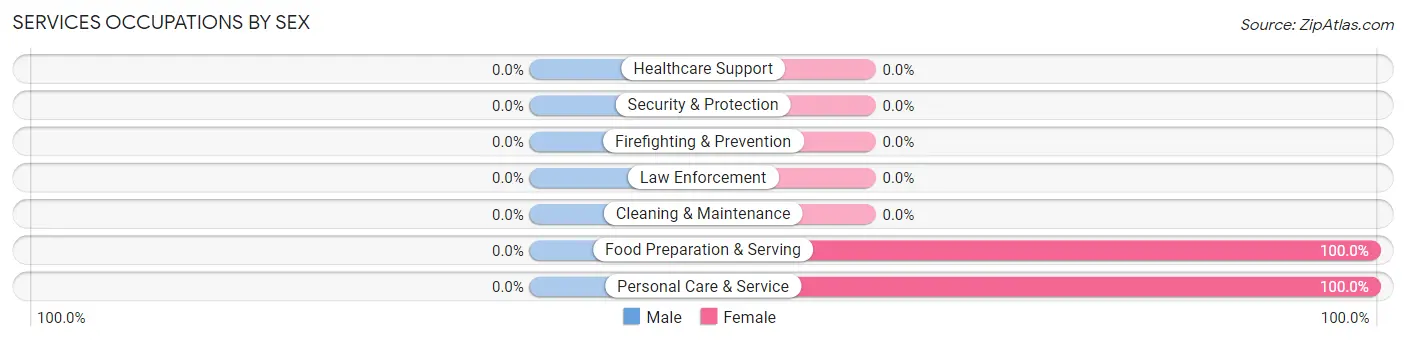
| Occupation | Male | Female |
| Healthcare Support | 0 (0.0%) | 0 (0.0%) |
| Security & Protection | 0 (0.0%) | 0 (0.0%) |
| Firefighting & Prevention | 0 (0.0%) | 0 (0.0%) |
| Law Enforcement | 0 (0.0%) | 0 (0.0%) |
| Food Preparation & Serving | 0 (0.0%) | 73 (100.0%) |
| Cleaning & Maintenance | 0 (0.0%) | 0 (0.0%) |
| Personal Care & Service | 0 (0.0%) | 53 (100.0%) |
| Total (Category) | 0 (0.0%) | 126 (100.0%) |
| Total (Overall) | 106 (34.3%) | 203 (65.7%) |
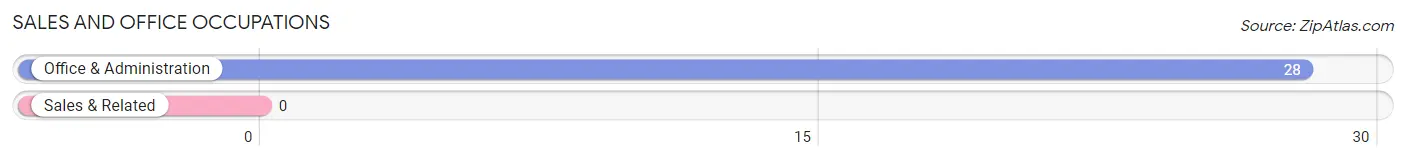
Sales and Office Occupations
The most common Sales and Office occupations in Victor are , and Office & Administration (28 | 9.1%).
Sales and Office Occupations by Sex
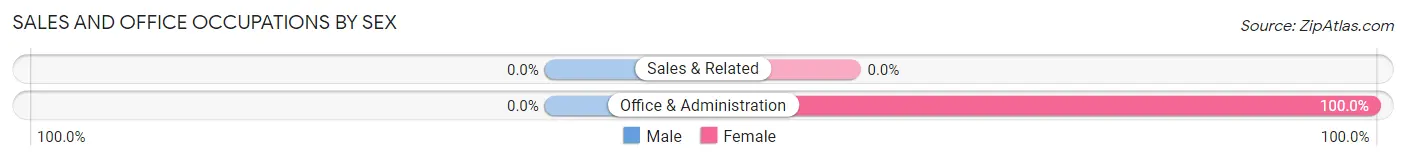
| Occupation | Male | Female |
| Sales & Related | 0 (0.0%) | 0 (0.0%) |
| Office & Administration | 0 (0.0%) | 28 (100.0%) |
| Total (Category) | 0 (0.0%) | 28 (100.0%) |
| Total (Overall) | 106 (34.3%) | 203 (65.7%) |
Natural Resources, Construction and Maintenance Occupations
The most common Natural Resources, Construction and Maintenance occupations in Victor are Construction & Extraction (61 | 19.7%), and Farming, Fishing & Forestry (43 | 13.9%).
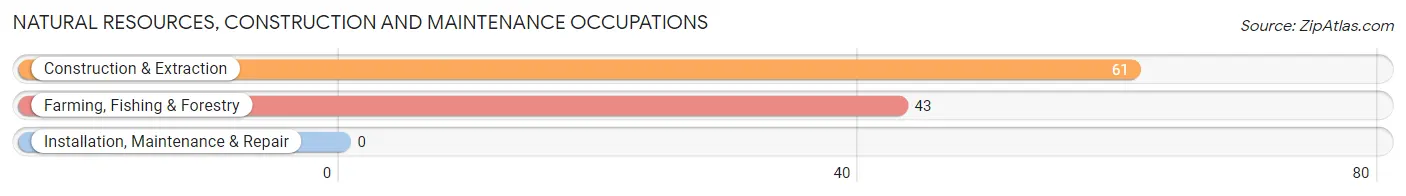
Natural Resources, Construction and Maintenance Occupations by Sex
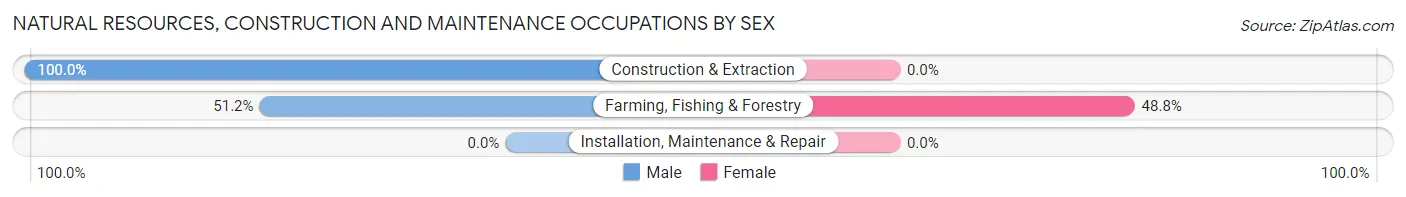
| Occupation | Male | Female |
| Farming, Fishing & Forestry | 22 (51.2%) | 21 (48.8%) |
| Construction & Extraction | 61 (100.0%) | 0 (0.0%) |
| Installation, Maintenance & Repair | 0 (0.0%) | 0 (0.0%) |
| Total (Category) | 83 (79.8%) | 21 (20.2%) |
| Total (Overall) | 106 (34.3%) | 203 (65.7%) |
Production, Transportation and Moving Occupations
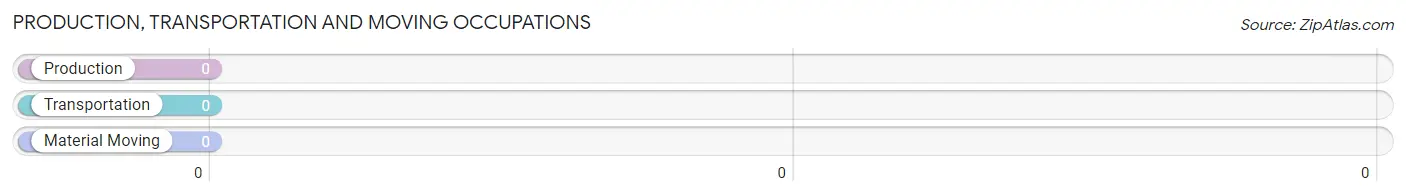
Production, Transportation and Moving Occupations by Sex
| Occupation | Male | Female |
| Production | 0 (0.0%) | 0 (0.0%) |
| Transportation | 0 (0.0%) | 0 (0.0%) |
| Material Moving | 0 (0.0%) | 0 (0.0%) |
| Total (Category) | 0 (0.0%) | 0 (0.0%) |
| Total (Overall) | 106 (34.3%) | 203 (65.7%) |
Employment Industries by Sex in Victor
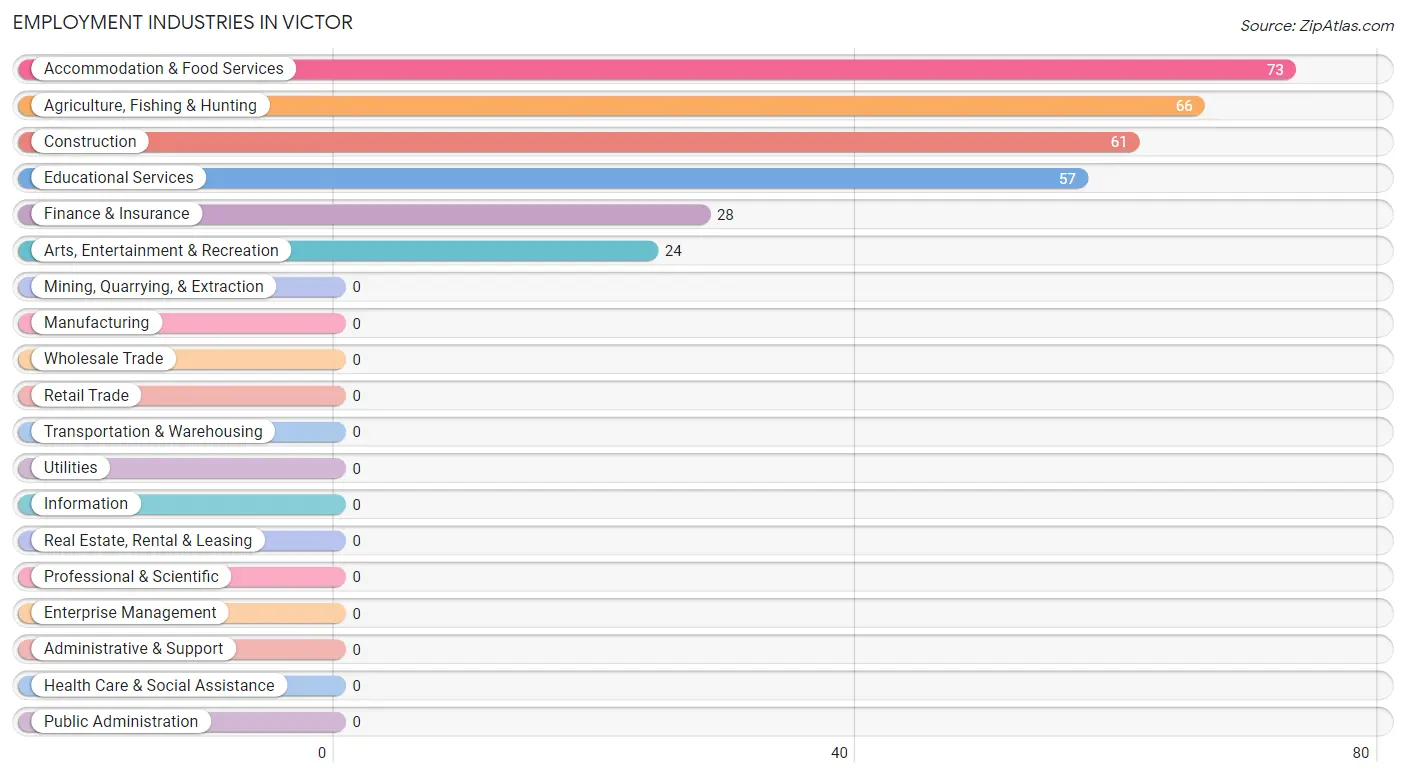
Employment Industries in Victor
The major employment industries in Victor include Accommodation & Food Services (73 | 23.6%), Agriculture, Fishing & Hunting (66 | 21.4%), Construction (61 | 19.7%), Educational Services (57 | 18.4%), and Finance & Insurance (28 | 9.1%).
Employment Industries by Sex in Victor
The Victor industries that see more men than women are Construction (100.0%), and Agriculture, Fishing & Hunting (68.2%), whereas the industries that tend to have a higher number of women are Finance & Insurance (100.0%), Educational Services (100.0%), and Arts, Entertainment & Recreation (100.0%).
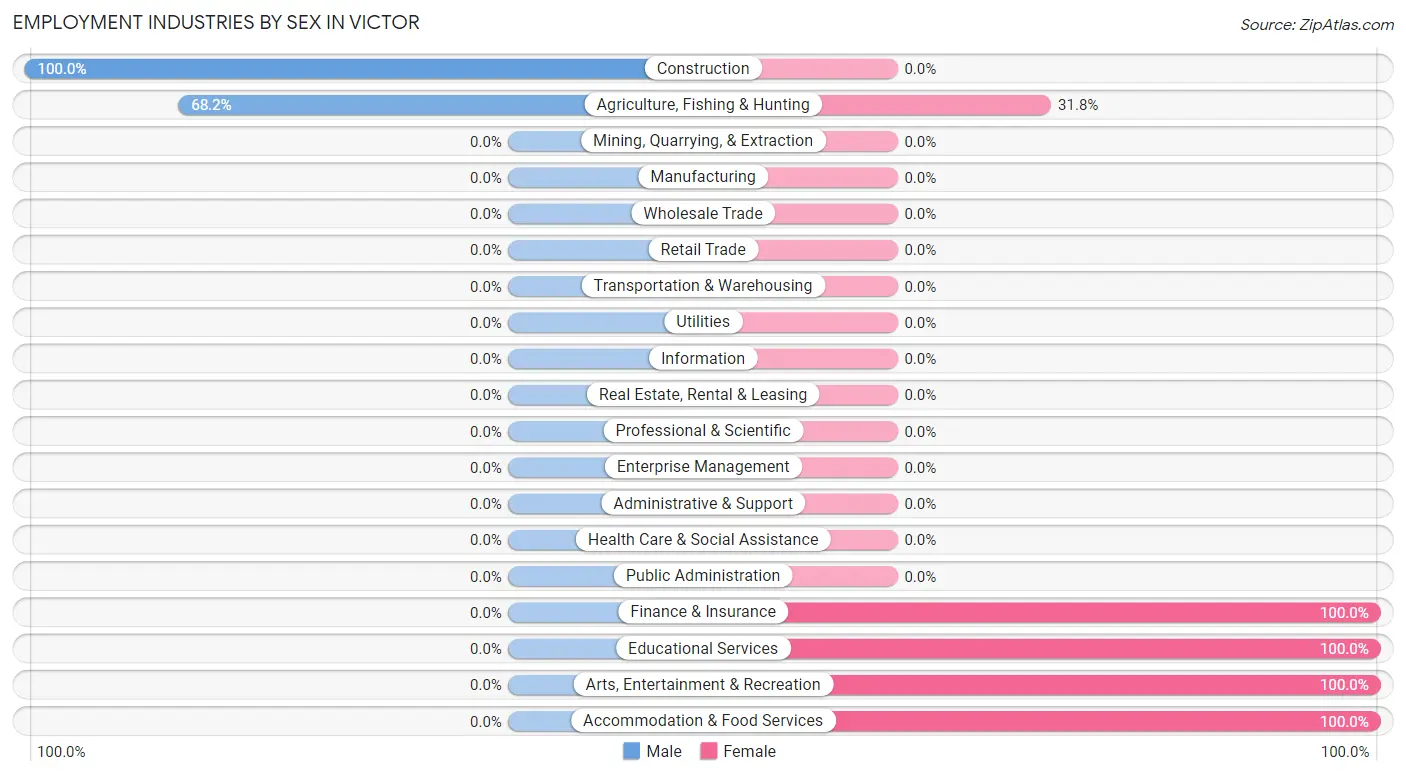
| Industry | Male | Female |
| Agriculture, Fishing & Hunting | 45 (68.2%) | 21 (31.8%) |
| Mining, Quarrying, & Extraction | 0 (0.0%) | 0 (0.0%) |
| Construction | 61 (100.0%) | 0 (0.0%) |
| Manufacturing | 0 (0.0%) | 0 (0.0%) |
| Wholesale Trade | 0 (0.0%) | 0 (0.0%) |
| Retail Trade | 0 (0.0%) | 0 (0.0%) |
| Transportation & Warehousing | 0 (0.0%) | 0 (0.0%) |
| Utilities | 0 (0.0%) | 0 (0.0%) |
| Information | 0 (0.0%) | 0 (0.0%) |
| Finance & Insurance | 0 (0.0%) | 28 (100.0%) |
| Real Estate, Rental & Leasing | 0 (0.0%) | 0 (0.0%) |
| Professional & Scientific | 0 (0.0%) | 0 (0.0%) |
| Enterprise Management | 0 (0.0%) | 0 (0.0%) |
| Administrative & Support | 0 (0.0%) | 0 (0.0%) |
| Educational Services | 0 (0.0%) | 57 (100.0%) |
| Health Care & Social Assistance | 0 (0.0%) | 0 (0.0%) |
| Arts, Entertainment & Recreation | 0 (0.0%) | 24 (100.0%) |
| Accommodation & Food Services | 0 (0.0%) | 73 (100.0%) |
| Public Administration | 0 (0.0%) | 0 (0.0%) |
| Total | 106 (34.3%) | 203 (65.7%) |
Education in Victor
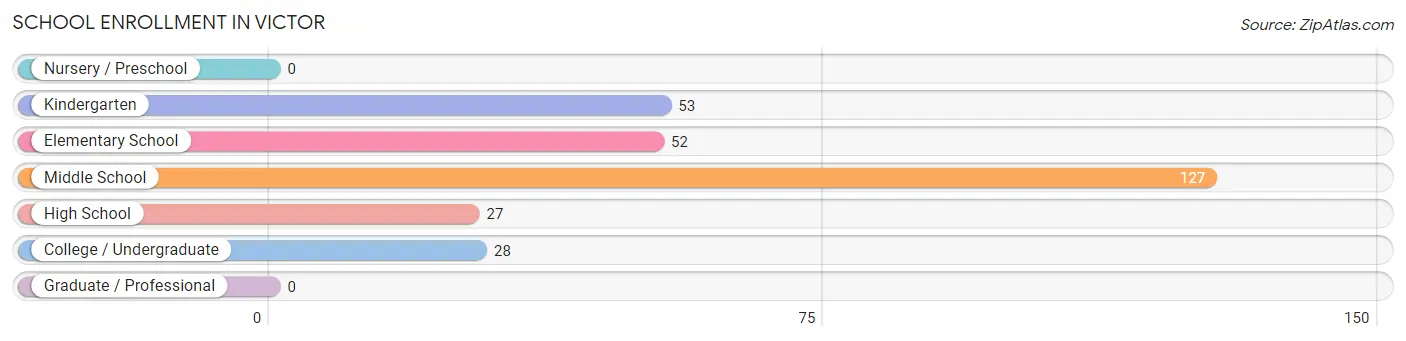
School Enrollment in Victor
The most common levels of schooling among the 287 students in Victor are middle school (127 | 44.3%), kindergarten (53 | 18.5%), and elementary school (52 | 18.1%).
| School Level | # Students | % Students |
| Nursery / Preschool | 0 | 0.0% |
| Kindergarten | 53 | 18.5% |
| Elementary School | 52 | 18.1% |
| Middle School | 127 | 44.3% |
| High School | 27 | 9.4% |
| College / Undergraduate | 28 | 9.8% |
| Graduate / Professional | 0 | 0.0% |
| Total | 287 | 100.0% |
School Enrollment by Age by Funding Source in Victor
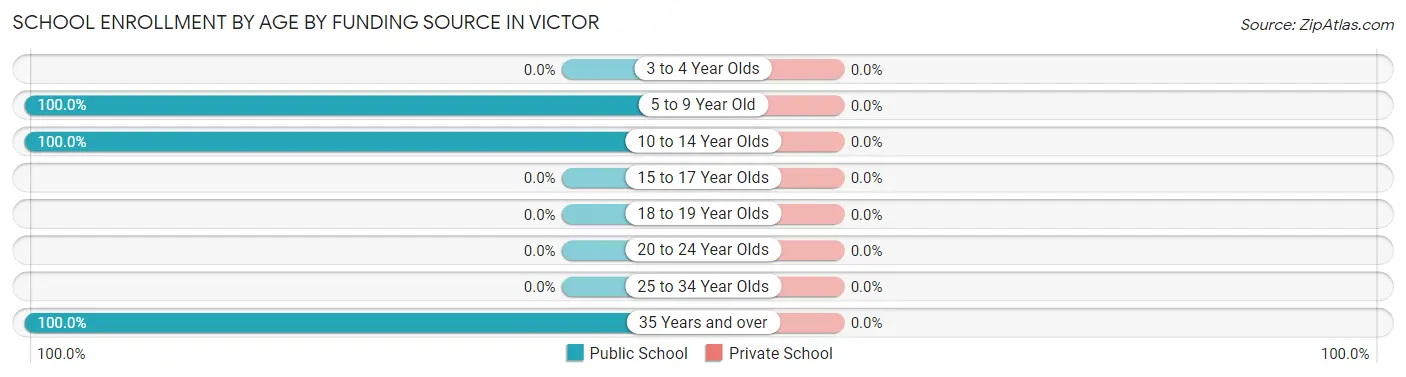
| Age Bracket | Public School | Private School |
| 3 to 4 Year Olds | 0 (0.0%) | 0 (0.0%) |
| 5 to 9 Year Old | 105 (100.0%) | 0 (0.0%) |
| 10 to 14 Year Olds | 154 (100.0%) | 0 (0.0%) |
| 15 to 17 Year Olds | 0 (0.0%) | 0 (0.0%) |
| 18 to 19 Year Olds | 0 (0.0%) | 0 (0.0%) |
| 20 to 24 Year Olds | 0 (0.0%) | 0 (0.0%) |
| 25 to 34 Year Olds | 0 (0.0%) | 0 (0.0%) |
| 35 Years and over | 28 (100.0%) | 0 (0.0%) |
| Total | 287 (100.0%) | 0 (0.0%) |
Educational Attainment by Field of Study in Victor
, and bio, nature & agricultural (24 | 100.0%) are the most common fields of study among 24 individuals in Victor who have obtained a bachelor's degree or higher.
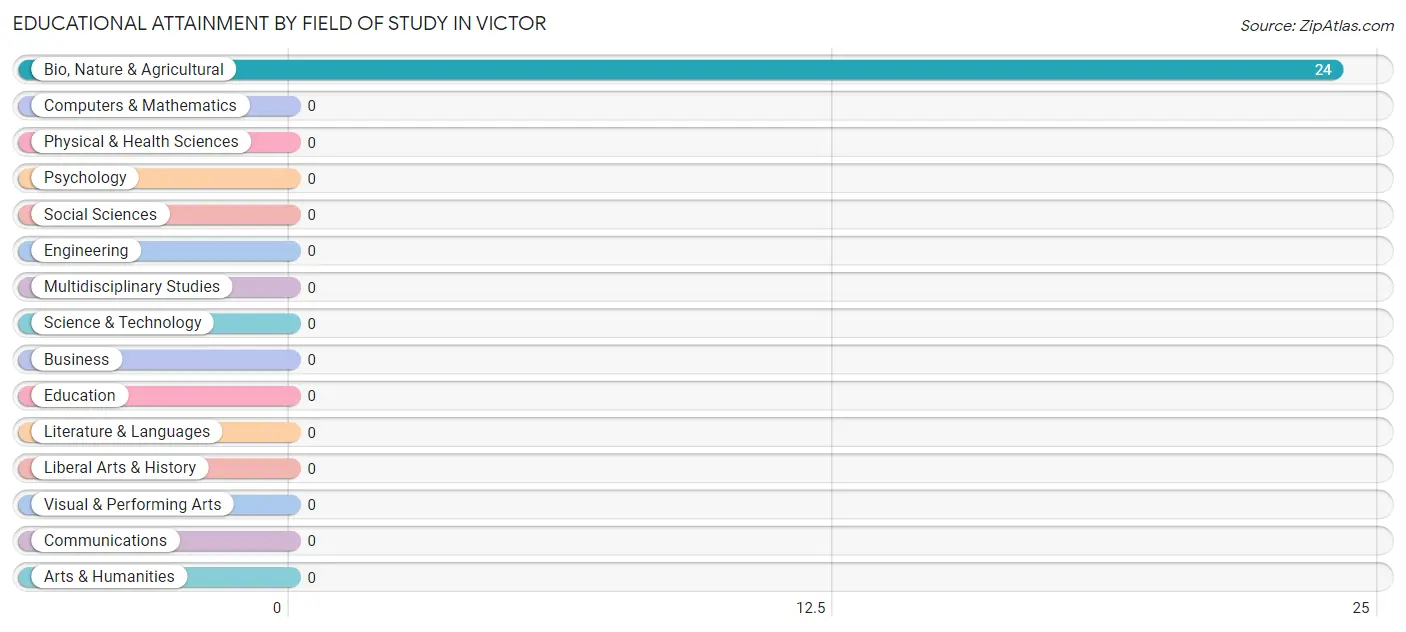
| Field of Study | # Graduates | % Graduates |
| Computers & Mathematics | 0 | 0.0% |
| Bio, Nature & Agricultural | 24 | 100.0% |
| Physical & Health Sciences | 0 | 0.0% |
| Psychology | 0 | 0.0% |
| Social Sciences | 0 | 0.0% |
| Engineering | 0 | 0.0% |
| Multidisciplinary Studies | 0 | 0.0% |
| Science & Technology | 0 | 0.0% |
| Business | 0 | 0.0% |
| Education | 0 | 0.0% |
| Literature & Languages | 0 | 0.0% |
| Liberal Arts & History | 0 | 0.0% |
| Visual & Performing Arts | 0 | 0.0% |
| Communications | 0 | 0.0% |
| Arts & Humanities | 0 | 0.0% |
| Total | 24 | 100.0% |
Transportation & Commute in Victor
Vehicle Availability by Sex in Victor
The most prevalent vehicle ownership categories in Victor are males with 3 vehicles (52, accounting for 49.1%) and females with 3 vehicles (52, making up 25.6%).
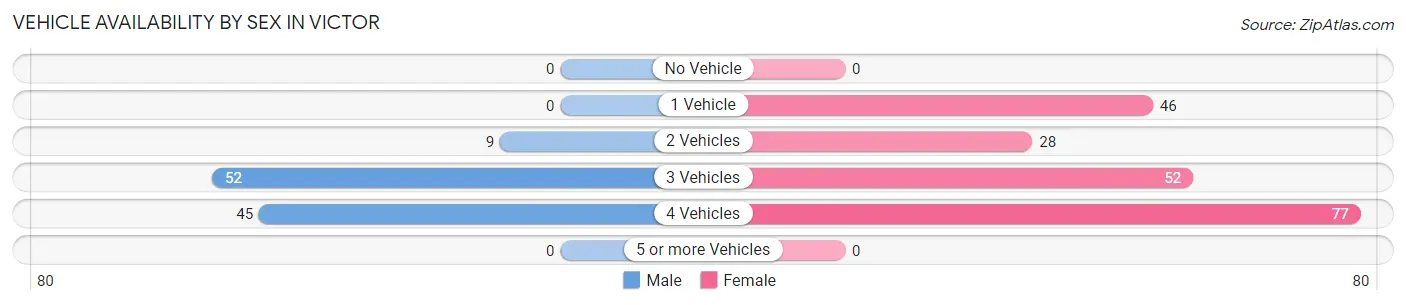
| Vehicles Available | Male | Female |
| No Vehicle | 0 (0.0%) | 0 (0.0%) |
| 1 Vehicle | 0 (0.0%) | 46 (22.7%) |
| 2 Vehicles | 9 (8.5%) | 28 (13.8%) |
| 3 Vehicles | 52 (49.1%) | 52 (25.6%) |
| 4 Vehicles | 45 (42.4%) | 77 (37.9%) |
| 5 or more Vehicles | 0 (0.0%) | 0 (0.0%) |
| Total | 106 (100.0%) | 203 (100.0%) |
Commute Time in Victor
The most frequently occuring commute durations in Victor are 10 to 14 minutes (136 commuters, 44.0%), 30 to 34 minutes (86 commuters, 27.8%), and 20 to 24 minutes (78 commuters, 25.2%).
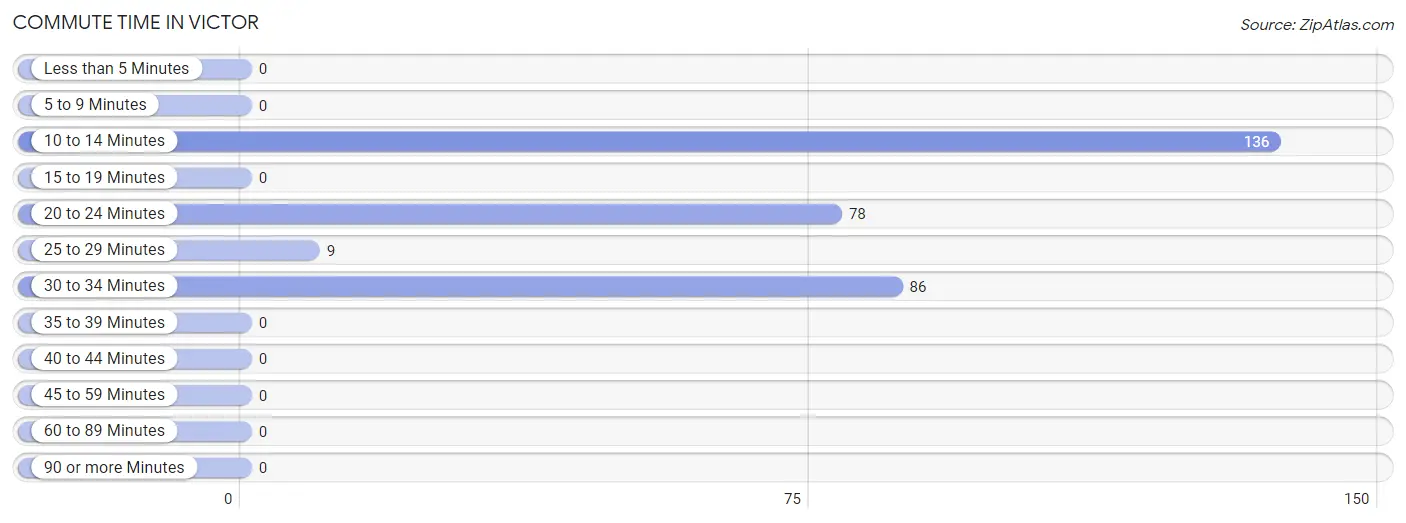
| Commute Time | # Commuters | % Commuters |
| Less than 5 Minutes | 0 | 0.0% |
| 5 to 9 Minutes | 0 | 0.0% |
| 10 to 14 Minutes | 136 | 44.0% |
| 15 to 19 Minutes | 0 | 0.0% |
| 20 to 24 Minutes | 78 | 25.2% |
| 25 to 29 Minutes | 9 | 2.9% |
| 30 to 34 Minutes | 86 | 27.8% |
| 35 to 39 Minutes | 0 | 0.0% |
| 40 to 44 Minutes | 0 | 0.0% |
| 45 to 59 Minutes | 0 | 0.0% |
| 60 to 89 Minutes | 0 | 0.0% |
| 90 or more Minutes | 0 | 0.0% |
Commute Time by Sex in Victor
The most common commute times in Victor are 10 to 14 minutes (45 commuters, 42.4%) for males and 10 to 14 minutes (91 commuters, 44.8%) for females.
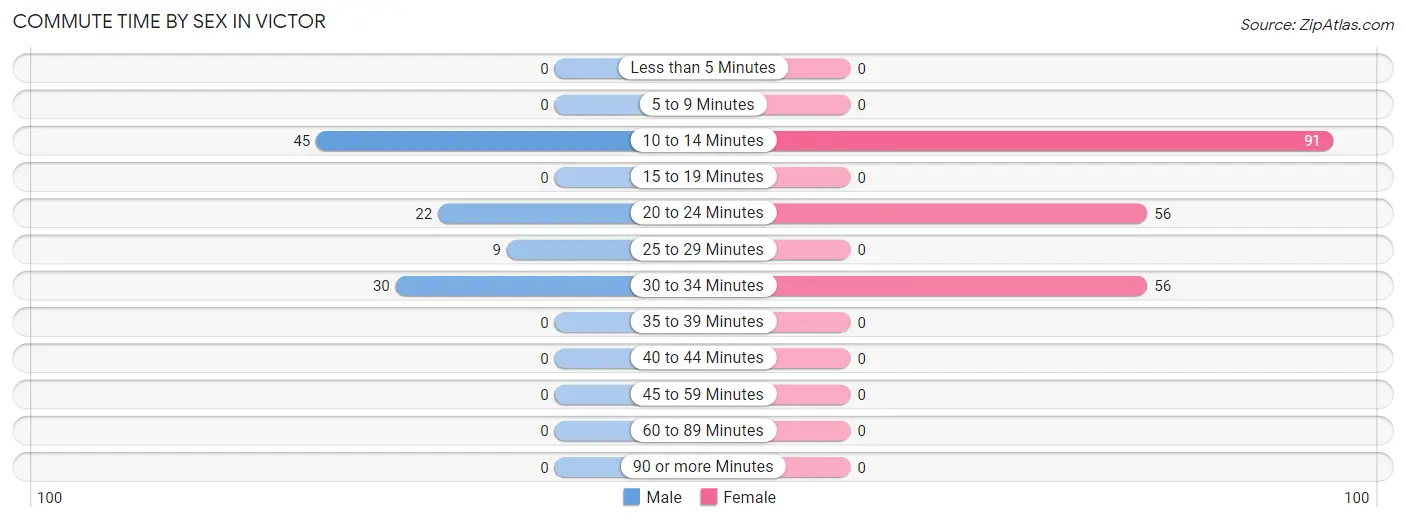
| Commute Time | Male | Female |
| Less than 5 Minutes | 0 (0.0%) | 0 (0.0%) |
| 5 to 9 Minutes | 0 (0.0%) | 0 (0.0%) |
| 10 to 14 Minutes | 45 (42.4%) | 91 (44.8%) |
| 15 to 19 Minutes | 0 (0.0%) | 0 (0.0%) |
| 20 to 24 Minutes | 22 (20.7%) | 56 (27.6%) |
| 25 to 29 Minutes | 9 (8.5%) | 0 (0.0%) |
| 30 to 34 Minutes | 30 (28.3%) | 56 (27.6%) |
| 35 to 39 Minutes | 0 (0.0%) | 0 (0.0%) |
| 40 to 44 Minutes | 0 (0.0%) | 0 (0.0%) |
| 45 to 59 Minutes | 0 (0.0%) | 0 (0.0%) |
| 60 to 89 Minutes | 0 (0.0%) | 0 (0.0%) |
| 90 or more Minutes | 0 (0.0%) | 0 (0.0%) |
Time of Departure to Work by Sex in Victor
The most frequent times of departure to work in Victor are 8:00 AM to 8:29 AM (52, 49.1%) for males and 12:00 PM to 3:59 PM (46, 22.7%) for females.
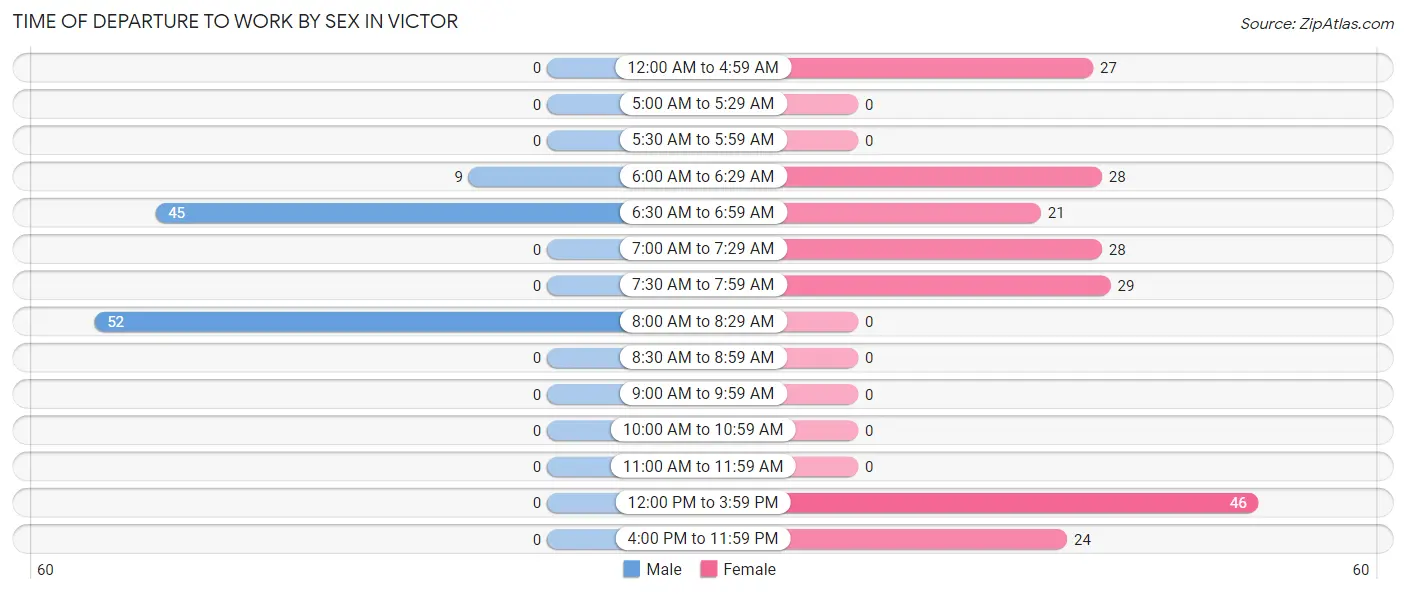
| Time of Departure | Male | Female |
| 12:00 AM to 4:59 AM | 0 (0.0%) | 27 (13.3%) |
| 5:00 AM to 5:29 AM | 0 (0.0%) | 0 (0.0%) |
| 5:30 AM to 5:59 AM | 0 (0.0%) | 0 (0.0%) |
| 6:00 AM to 6:29 AM | 9 (8.5%) | 28 (13.8%) |
| 6:30 AM to 6:59 AM | 45 (42.4%) | 21 (10.3%) |
| 7:00 AM to 7:29 AM | 0 (0.0%) | 28 (13.8%) |
| 7:30 AM to 7:59 AM | 0 (0.0%) | 29 (14.3%) |
| 8:00 AM to 8:29 AM | 52 (49.1%) | 0 (0.0%) |
| 8:30 AM to 8:59 AM | 0 (0.0%) | 0 (0.0%) |
| 9:00 AM to 9:59 AM | 0 (0.0%) | 0 (0.0%) |
| 10:00 AM to 10:59 AM | 0 (0.0%) | 0 (0.0%) |
| 11:00 AM to 11:59 AM | 0 (0.0%) | 0 (0.0%) |
| 12:00 PM to 3:59 PM | 0 (0.0%) | 46 (22.7%) |
| 4:00 PM to 11:59 PM | 0 (0.0%) | 24 (11.8%) |
| Total | 106 (100.0%) | 203 (100.0%) |
Housing Occupancy in Victor
Occupancy by Ownership in Victor
Of the total 158 dwellings in Victor, owner-occupied units account for 52 (32.9%), while renter-occupied units make up 106 (67.1%).
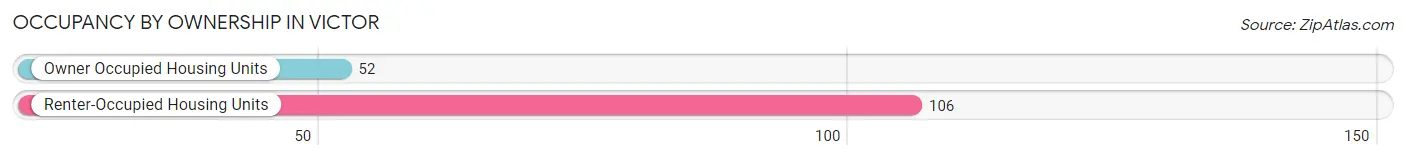
| Occupancy | # Housing Units | % Housing Units |
| Owner Occupied Housing Units | 52 | 32.9% |
| Renter-Occupied Housing Units | 106 | 67.1% |
| Total Occupied Housing Units | 158 | 100.0% |
Occupancy by Household Size in Victor
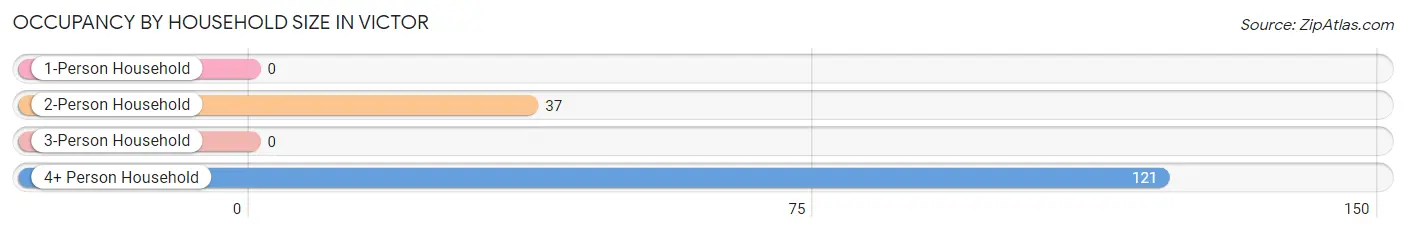
| Household Size | # Housing Units | % Housing Units |
| 1-Person Household | 0 | 0.0% |
| 2-Person Household | 37 | 23.4% |
| 3-Person Household | 0 | 0.0% |
| 4+ Person Household | 121 | 76.6% |
| Total Housing Units | 158 | 100.0% |
Occupancy by Ownership by Household Size in Victor
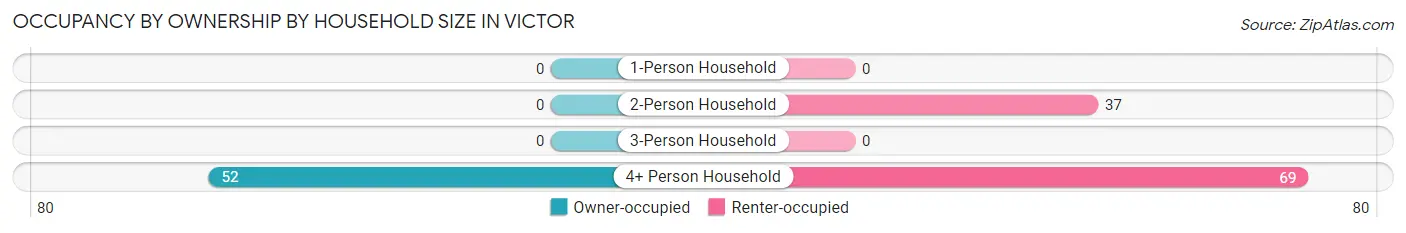
| Household Size | Owner-occupied | Renter-occupied |
| 1-Person Household | 0 (0.0%) | 0 (0.0%) |
| 2-Person Household | 0 (0.0%) | 37 (100.0%) |
| 3-Person Household | 0 (0.0%) | 0 (0.0%) |
| 4+ Person Household | 52 (43.0%) | 69 (57.0%) |
| Total Housing Units | 52 (32.9%) | 106 (67.1%) |
Occupancy by Educational Attainment in Victor
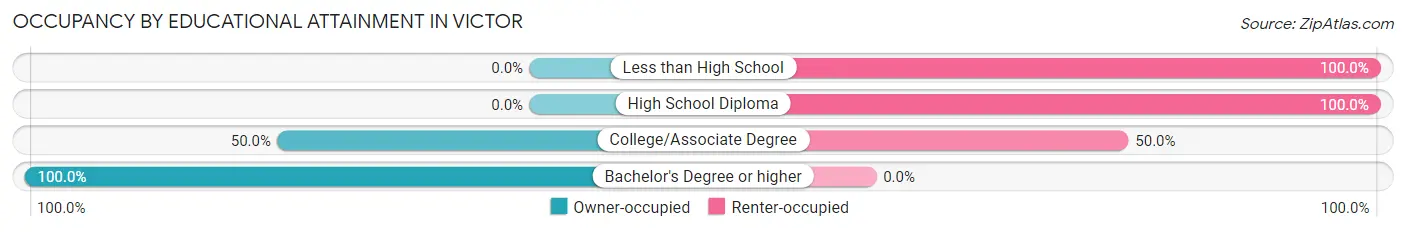
| Household Size | Owner-occupied | Renter-occupied |
| Less than High School | 0 (0.0%) | 69 (100.0%) |
| High School Diploma | 0 (0.0%) | 9 (100.0%) |
| College/Associate Degree | 28 (50.0%) | 28 (50.0%) |
| Bachelor's Degree or higher | 24 (100.0%) | 0 (0.0%) |
Occupancy by Age of Householder in Victor
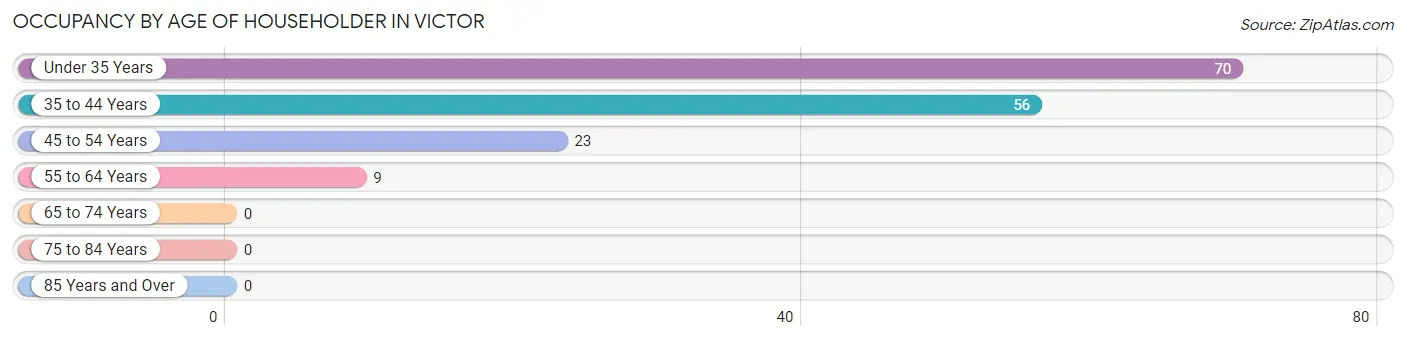
| Age Bracket | # Households | % Households |
| Under 35 Years | 70 | 44.3% |
| 35 to 44 Years | 56 | 35.4% |
| 45 to 54 Years | 23 | 14.6% |
| 55 to 64 Years | 9 | 5.7% |
| 65 to 74 Years | 0 | 0.0% |
| 75 to 84 Years | 0 | 0.0% |
| 85 Years and Over | 0 | 0.0% |
| Total | 158 | 100.0% |
Housing Finances in Victor
Median Income by Occupancy in Victor
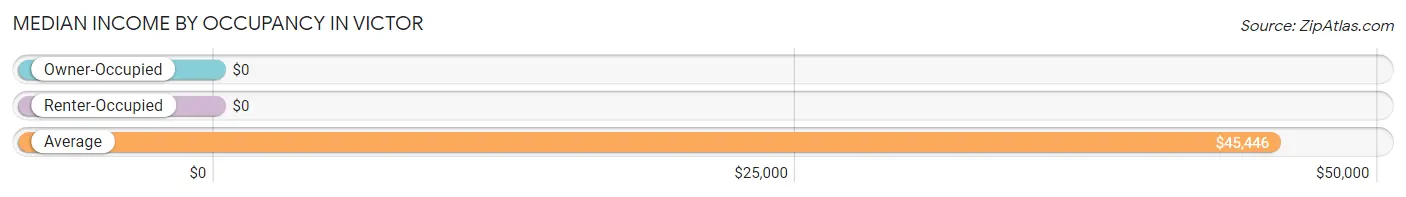
| Occupancy Type | # Households | Median Income |
| Owner-Occupied | 52 (32.9%) | $0 |
| Renter-Occupied | 106 (67.1%) | $0 |
| Average | 158 (100.0%) | $45,446 |
Occupancy by Householder Income Bracket in Victor
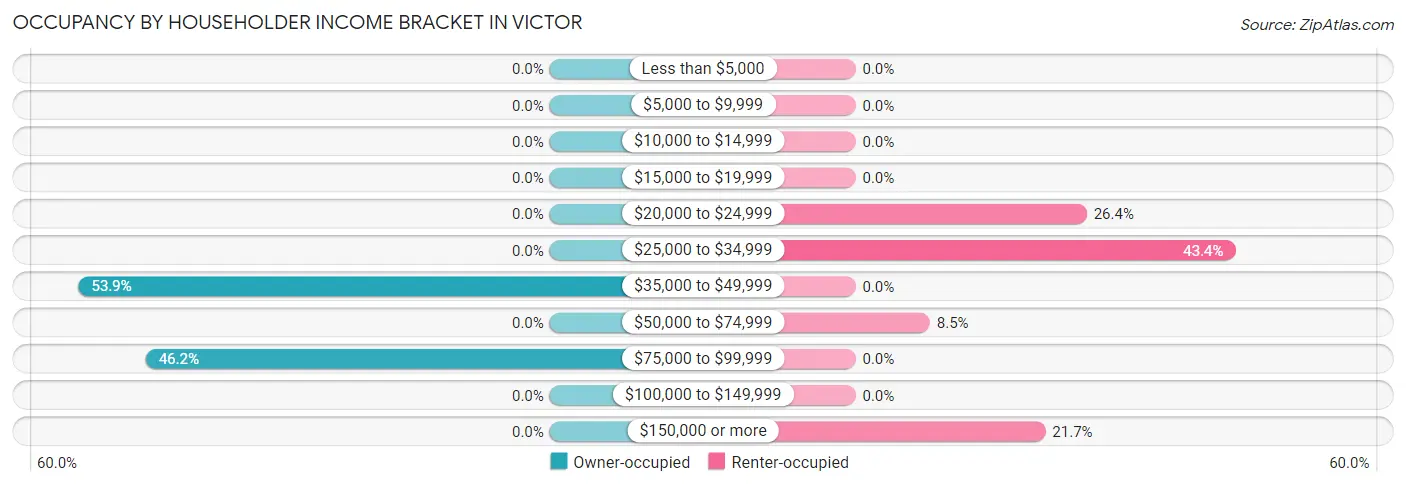
| Income Bracket | Owner-occupied | Renter-occupied |
| Less than $5,000 | 0 (0.0%) | 0 (0.0%) |
| $5,000 to $9,999 | 0 (0.0%) | 0 (0.0%) |
| $10,000 to $14,999 | 0 (0.0%) | 0 (0.0%) |
| $15,000 to $19,999 | 0 (0.0%) | 0 (0.0%) |
| $20,000 to $24,999 | 0 (0.0%) | 28 (26.4%) |
| $25,000 to $34,999 | 0 (0.0%) | 46 (43.4%) |
| $35,000 to $49,999 | 28 (53.8%) | 0 (0.0%) |
| $50,000 to $74,999 | 0 (0.0%) | 9 (8.5%) |
| $75,000 to $99,999 | 24 (46.2%) | 0 (0.0%) |
| $100,000 to $149,999 | 0 (0.0%) | 0 (0.0%) |
| $150,000 or more | 0 (0.0%) | 23 (21.7%) |
| Total | 52 (100.0%) | 106 (100.0%) |
Monthly Housing Cost Tiers in Victor
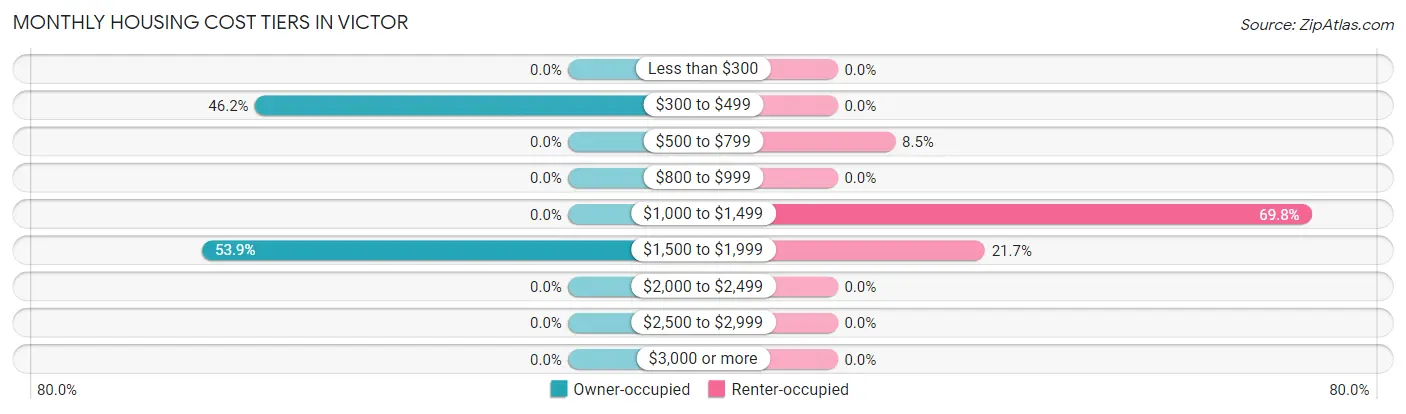
| Monthly Cost | Owner-occupied | Renter-occupied |
| Less than $300 | 0 (0.0%) | 0 (0.0%) |
| $300 to $499 | 24 (46.2%) | 0 (0.0%) |
| $500 to $799 | 0 (0.0%) | 9 (8.5%) |
| $800 to $999 | 0 (0.0%) | 0 (0.0%) |
| $1,000 to $1,499 | 0 (0.0%) | 74 (69.8%) |
| $1,500 to $1,999 | 28 (53.8%) | 23 (21.7%) |
| $2,000 to $2,499 | 0 (0.0%) | 0 (0.0%) |
| $2,500 to $2,999 | 0 (0.0%) | 0 (0.0%) |
| $3,000 or more | 0 (0.0%) | 0 (0.0%) |
| Total | 52 (100.0%) | 106 (100.0%) |
Physical Housing Characteristics in Victor
Housing Structures in Victor
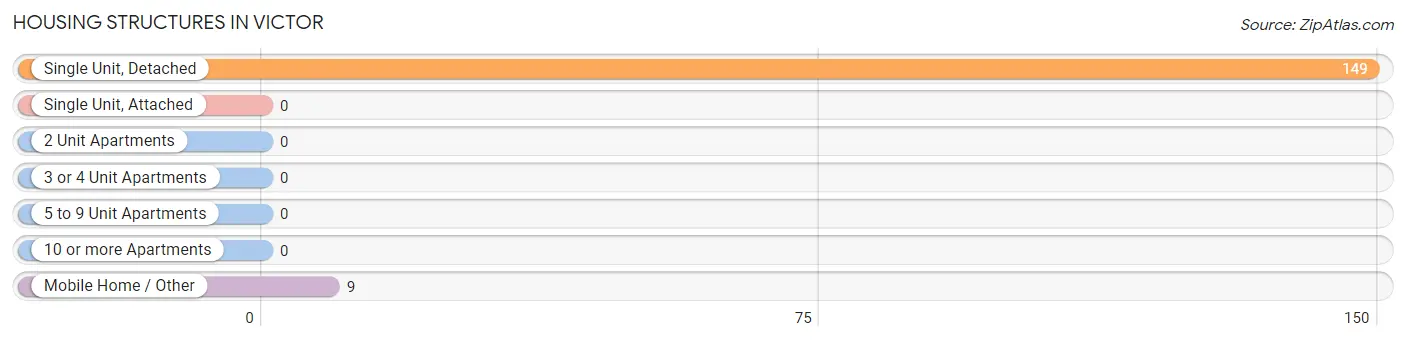
| Structure Type | # Housing Units | % Housing Units |
| Single Unit, Detached | 149 | 94.3% |
| Single Unit, Attached | 0 | 0.0% |
| 2 Unit Apartments | 0 | 0.0% |
| 3 or 4 Unit Apartments | 0 | 0.0% |
| 5 to 9 Unit Apartments | 0 | 0.0% |
| 10 or more Apartments | 0 | 0.0% |
| Mobile Home / Other | 9 | 5.7% |
| Total | 158 | 100.0% |
Housing Structures by Occupancy in Victor
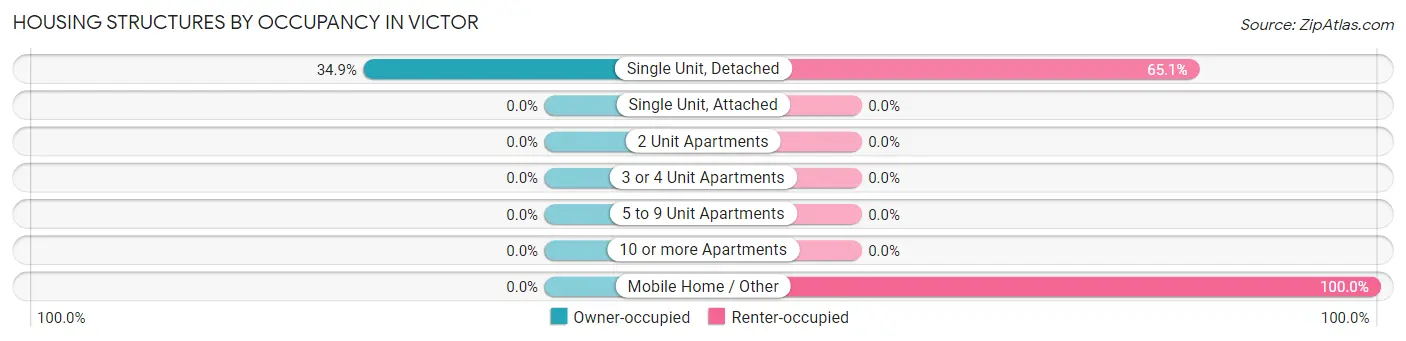
| Structure Type | Owner-occupied | Renter-occupied |
| Single Unit, Detached | 52 (34.9%) | 97 (65.1%) |
| Single Unit, Attached | 0 (0.0%) | 0 (0.0%) |
| 2 Unit Apartments | 0 (0.0%) | 0 (0.0%) |
| 3 or 4 Unit Apartments | 0 (0.0%) | 0 (0.0%) |
| 5 to 9 Unit Apartments | 0 (0.0%) | 0 (0.0%) |
| 10 or more Apartments | 0 (0.0%) | 0 (0.0%) |
| Mobile Home / Other | 0 (0.0%) | 9 (100.0%) |
| Total | 52 (32.9%) | 106 (67.1%) |
Housing Structures by Number of Rooms in Victor
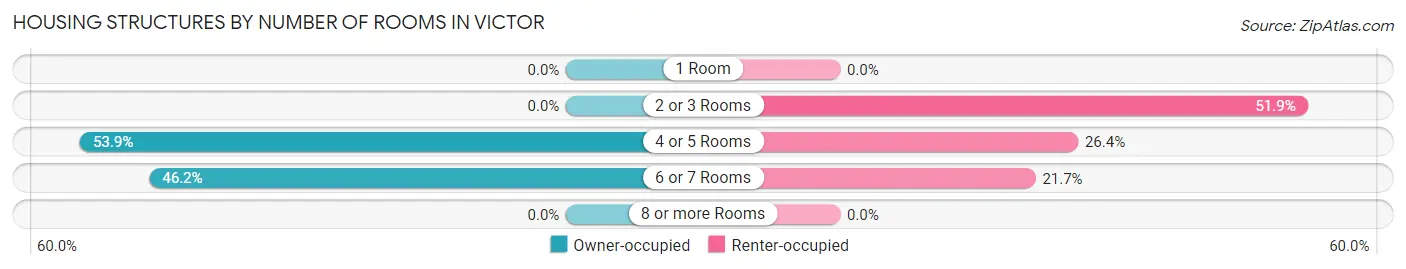
| Number of Rooms | Owner-occupied | Renter-occupied |
| 1 Room | 0 (0.0%) | 0 (0.0%) |
| 2 or 3 Rooms | 0 (0.0%) | 55 (51.9%) |
| 4 or 5 Rooms | 28 (53.8%) | 28 (26.4%) |
| 6 or 7 Rooms | 24 (46.2%) | 23 (21.7%) |
| 8 or more Rooms | 0 (0.0%) | 0 (0.0%) |
| Total | 52 (100.0%) | 106 (100.0%) |
Housing Structure by Heating Type in Victor
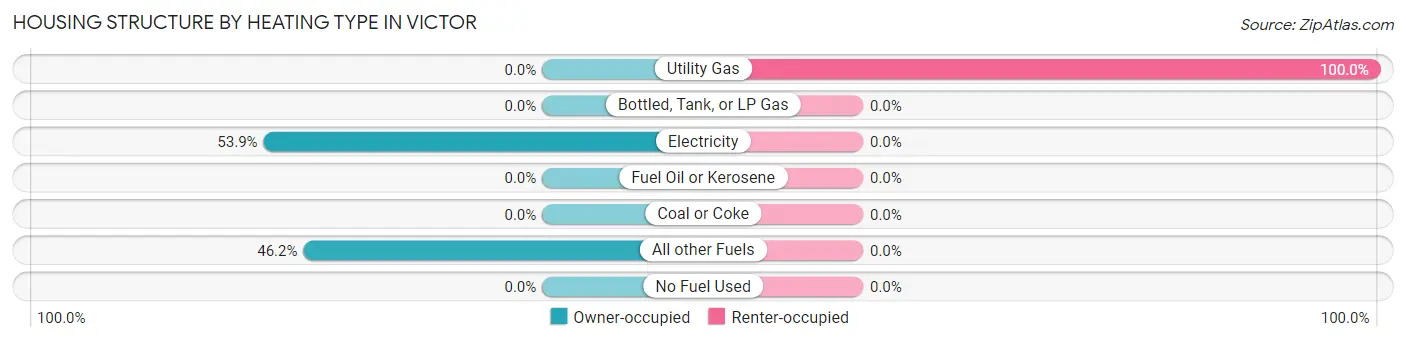
| Heating Type | Owner-occupied | Renter-occupied |
| Utility Gas | 0 (0.0%) | 106 (100.0%) |
| Bottled, Tank, or LP Gas | 0 (0.0%) | 0 (0.0%) |
| Electricity | 28 (53.8%) | 0 (0.0%) |
| Fuel Oil or Kerosene | 0 (0.0%) | 0 (0.0%) |
| Coal or Coke | 0 (0.0%) | 0 (0.0%) |
| All other Fuels | 24 (46.2%) | 0 (0.0%) |
| No Fuel Used | 0 (0.0%) | 0 (0.0%) |
| Total | 52 (100.0%) | 106 (100.0%) |
Household Vehicle Usage in Victor
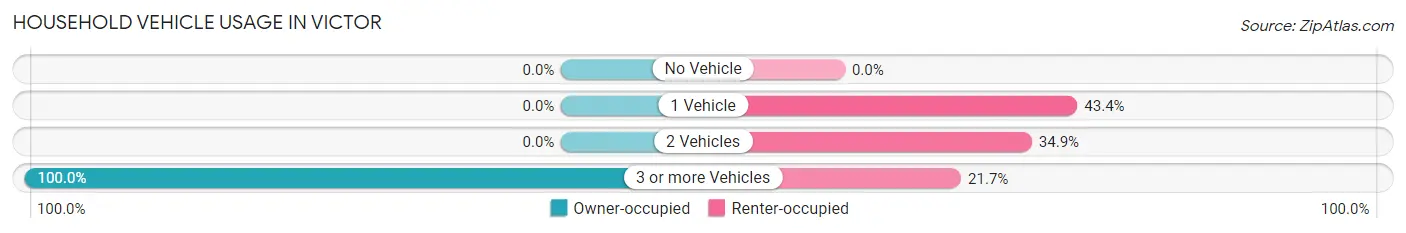
| Vehicles per Household | Owner-occupied | Renter-occupied |
| No Vehicle | 0 (0.0%) | 0 (0.0%) |
| 1 Vehicle | 0 (0.0%) | 46 (43.4%) |
| 2 Vehicles | 0 (0.0%) | 37 (34.9%) |
| 3 or more Vehicles | 52 (100.0%) | 23 (21.7%) |
| Total | 52 (100.0%) | 106 (100.0%) |
Real Estate & Mortgages in Victor
Real Estate and Mortgage Overview in Victor
| Characteristic | Without Mortgage | With Mortgage |
| Housing Units | 24 | 28 |
| Median Property Value | - | - |
| Median Household Income | - | - |
| Monthly Housing Costs | - | - |
| Real Estate Taxes | - | - |
Property Value by Mortgage Status in Victor
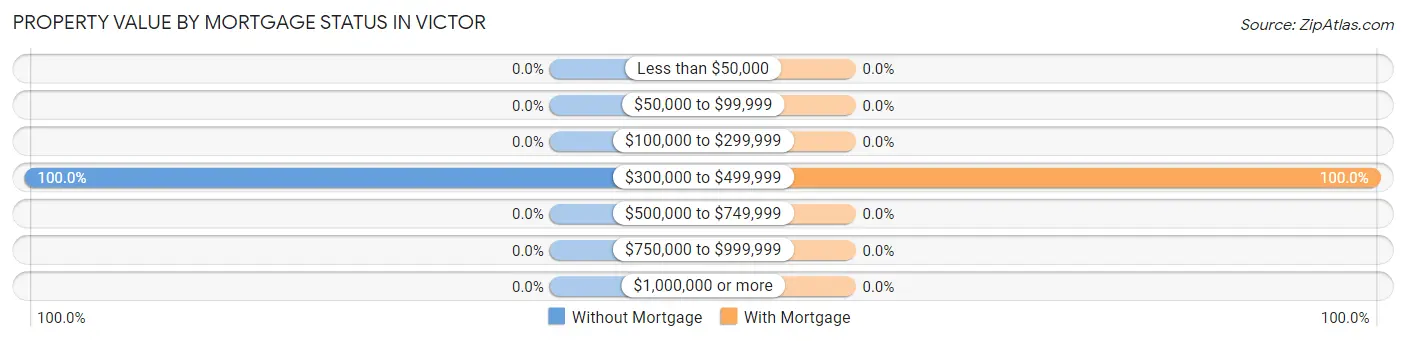
| Property Value | Without Mortgage | With Mortgage |
| Less than $50,000 | 0 (0.0%) | 0 (0.0%) |
| $50,000 to $99,999 | 0 (0.0%) | 0 (0.0%) |
| $100,000 to $299,999 | 0 (0.0%) | 0 (0.0%) |
| $300,000 to $499,999 | 24 (100.0%) | 28 (100.0%) |
| $500,000 to $749,999 | 0 (0.0%) | 0 (0.0%) |
| $750,000 to $999,999 | 0 (0.0%) | 0 (0.0%) |
| $1,000,000 or more | 0 (0.0%) | 0 (0.0%) |
| Total | 24 (100.0%) | 28 (100.0%) |
Household Income by Mortgage Status in Victor
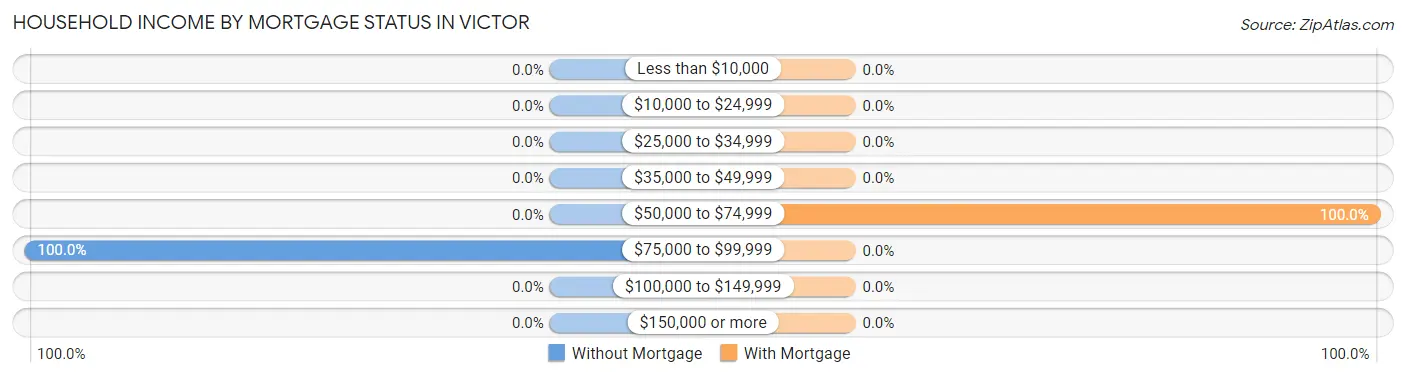
| Household Income | Without Mortgage | With Mortgage |
| Less than $10,000 | 0 (0.0%) | 0 (0.0%) |
| $10,000 to $24,999 | 0 (0.0%) | 0 (0.0%) |
| $25,000 to $34,999 | 0 (0.0%) | 0 (0.0%) |
| $35,000 to $49,999 | 0 (0.0%) | 0 (0.0%) |
| $50,000 to $74,999 | 0 (0.0%) | 28 (100.0%) |
| $75,000 to $99,999 | 24 (100.0%) | 0 (0.0%) |
| $100,000 to $149,999 | 0 (0.0%) | 0 (0.0%) |
| $150,000 or more | 0 (0.0%) | 0 (0.0%) |
| Total | 24 (100.0%) | 28 (100.0%) |
Property Value to Household Income Ratio in Victor
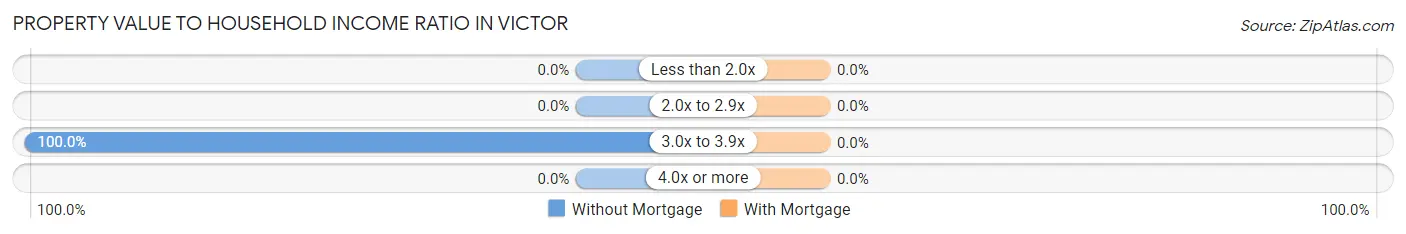
| Value-to-Income Ratio | Without Mortgage | With Mortgage |
| Less than 2.0x | 0 (0.0%) | 0 (0.0%) |
| 2.0x to 2.9x | 0 (0.0%) | 0 (0.0%) |
| 3.0x to 3.9x | 24 (100.0%) | 0 (0.0%) |
| 4.0x or more | 0 (0.0%) | 0 (0.0%) |
| Total | 24 (100.0%) | 28 (100.0%) |
Real Estate Taxes by Mortgage Status in Victor
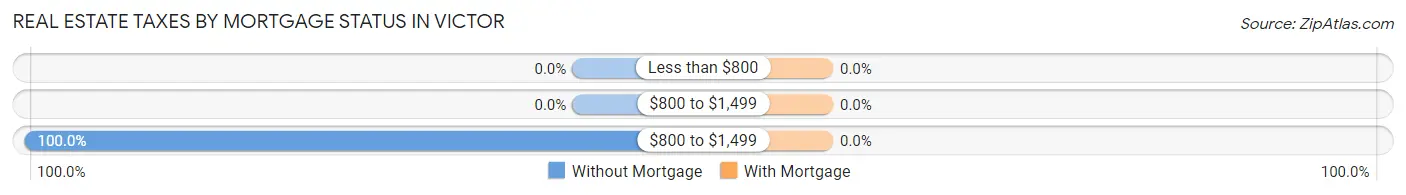
| Property Taxes | Without Mortgage | With Mortgage |
| Less than $800 | 0 (0.0%) | 0 (0.0%) |
| $800 to $1,499 | 0 (0.0%) | 0 (0.0%) |
| $800 to $1,499 | 24 (100.0%) | 0 (0.0%) |
| Total | 24 (100.0%) | 28 (100.0%) |
Health & Disability in Victor
Health Insurance Coverage by Age in Victor
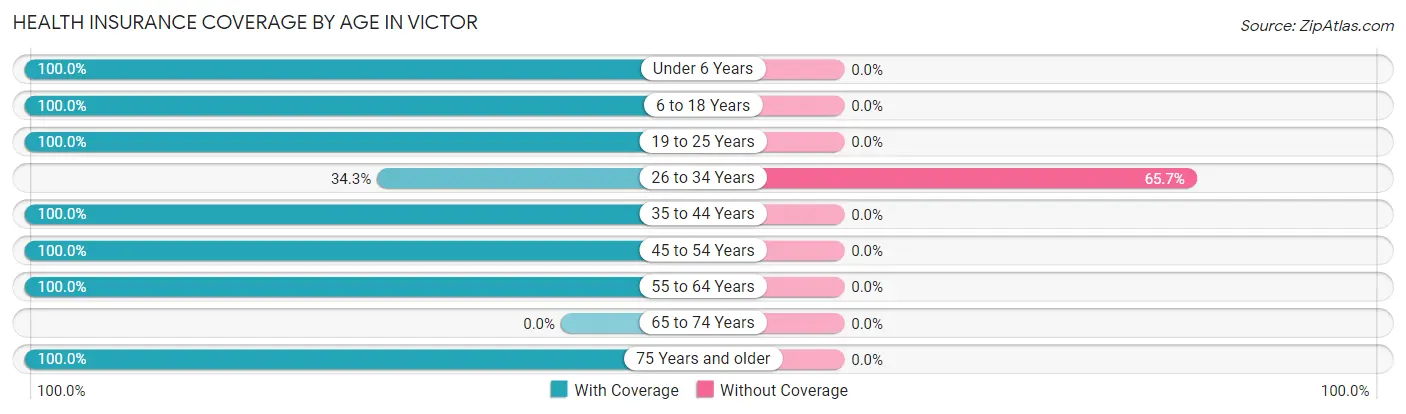
| Age Bracket | With Coverage | Without Coverage |
| Under 6 Years | 82 (100.0%) | 0 (0.0%) |
| 6 to 18 Years | 206 (100.0%) | 0 (0.0%) |
| 19 to 25 Years | 78 (100.0%) | 0 (0.0%) |
| 26 to 34 Years | 24 (34.3%) | 46 (65.7%) |
| 35 to 44 Years | 129 (100.0%) | 0 (0.0%) |
| 45 to 54 Years | 23 (100.0%) | 0 (0.0%) |
| 55 to 64 Years | 9 (100.0%) | 0 (0.0%) |
| 65 to 74 Years | 0 (0.0%) | 0 (0.0%) |
| 75 Years and older | 11 (100.0%) | 0 (0.0%) |
| Total | 562 (92.4%) | 46 (7.6%) |
Health Insurance Coverage by Citizenship Status in Victor
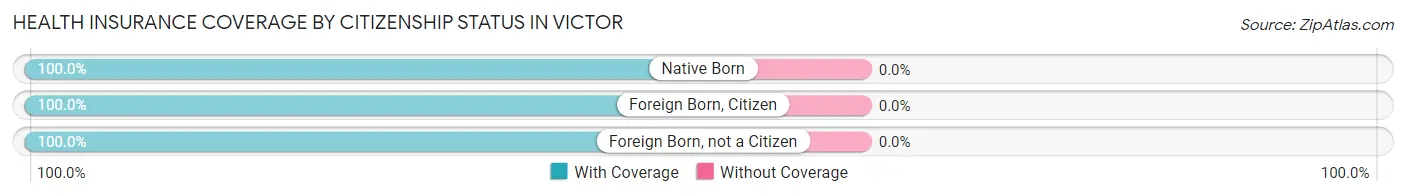
| Citizenship Status | With Coverage | Without Coverage |
| Native Born | 82 (100.0%) | 0 (0.0%) |
| Foreign Born, Citizen | 206 (100.0%) | 0 (0.0%) |
| Foreign Born, not a Citizen | 78 (100.0%) | 0 (0.0%) |
Health Insurance Coverage by Household Income in Victor
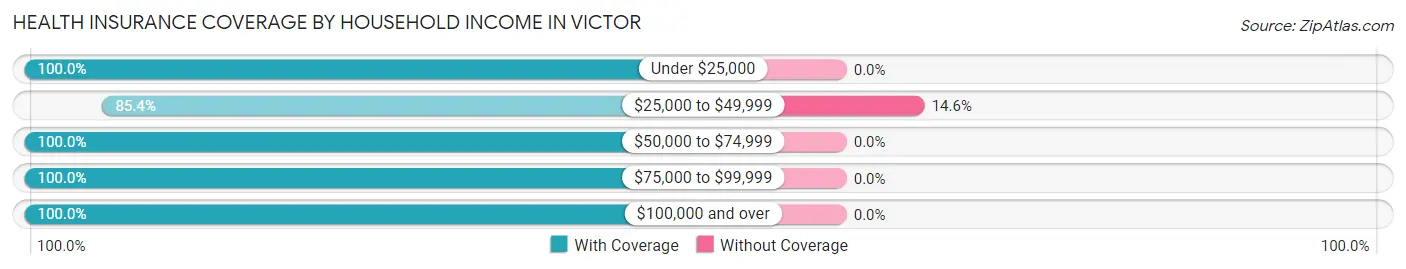
| Household Income | With Coverage | Without Coverage |
| Under $25,000 | 55 (100.0%) | 0 (0.0%) |
| $25,000 to $49,999 | 269 (85.4%) | 46 (14.6%) |
| $50,000 to $74,999 | 20 (100.0%) | 0 (0.0%) |
| $75,000 to $99,999 | 75 (100.0%) | 0 (0.0%) |
| $100,000 and over | 143 (100.0%) | 0 (0.0%) |
Public vs Private Health Insurance Coverage by Age in Victor
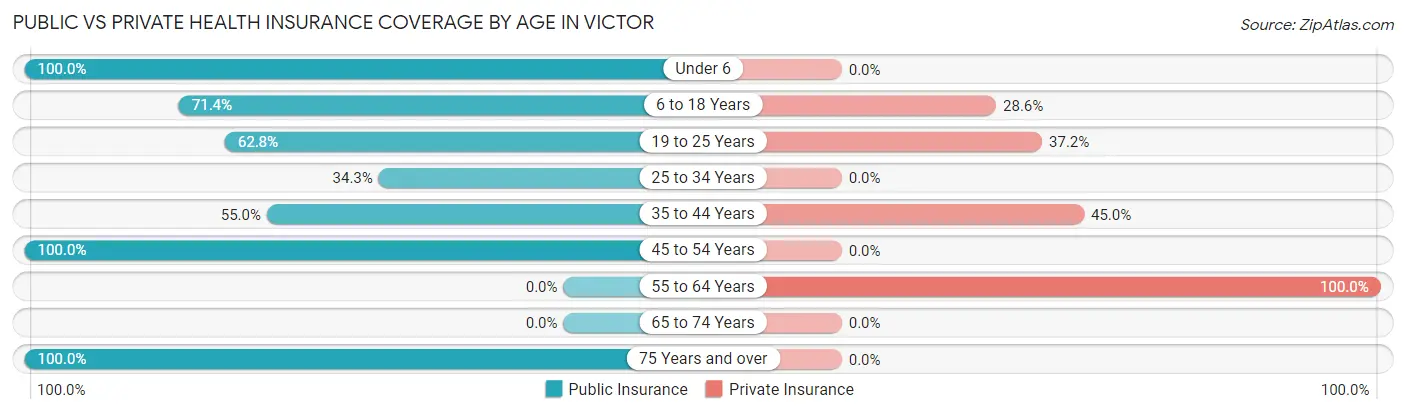
| Age Bracket | Public Insurance | Private Insurance |
| Under 6 | 82 (100.0%) | 0 (0.0%) |
| 6 to 18 Years | 147 (71.4%) | 59 (28.6%) |
| 19 to 25 Years | 49 (62.8%) | 29 (37.2%) |
| 25 to 34 Years | 24 (34.3%) | 0 (0.0%) |
| 35 to 44 Years | 71 (55.0%) | 58 (45.0%) |
| 45 to 54 Years | 23 (100.0%) | 0 (0.0%) |
| 55 to 64 Years | 0 (0.0%) | 9 (100.0%) |
| 65 to 74 Years | 0 (0.0%) | 0 (0.0%) |
| 75 Years and over | 11 (100.0%) | 0 (0.0%) |
| Total | 407 (66.9%) | 155 (25.5%) |
Disability Status by Sex by Age in Victor
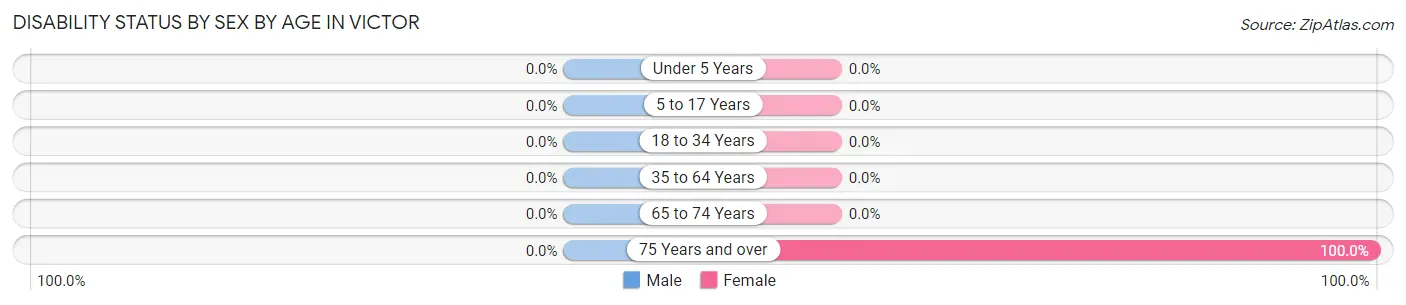
| Age Bracket | Male | Female |
| Under 5 Years | 0 (0.0%) | 0 (0.0%) |
| 5 to 17 Years | 0 (0.0%) | 0 (0.0%) |
| 18 to 34 Years | 0 (0.0%) | 0 (0.0%) |
| 35 to 64 Years | 0 (0.0%) | 0 (0.0%) |
| 65 to 74 Years | 0 (0.0%) | 0 (0.0%) |
| 75 Years and over | 0 (0.0%) | 11 (100.0%) |
Disability Class by Sex by Age in Victor
Disability Class: Hearing Difficulty
| Age Bracket | Male | Female |
| Under 5 Years | 0 (0.0%) | 0 (0.0%) |
| 5 to 17 Years | 0 (0.0%) | 0 (0.0%) |
| 18 to 34 Years | 0 (0.0%) | 0 (0.0%) |
| 35 to 64 Years | 0 (0.0%) | 0 (0.0%) |
| 65 to 74 Years | 0 (0.0%) | 0 (0.0%) |
| 75 Years and over | 0 (0.0%) | 0 (0.0%) |
Disability Class: Vision Difficulty
| Age Bracket | Male | Female |
| Under 5 Years | 0 (0.0%) | 0 (0.0%) |
| 5 to 17 Years | 0 (0.0%) | 0 (0.0%) |
| 18 to 34 Years | 0 (0.0%) | 0 (0.0%) |
| 35 to 64 Years | 0 (0.0%) | 0 (0.0%) |
| 65 to 74 Years | 0 (0.0%) | 0 (0.0%) |
| 75 Years and over | 0 (0.0%) | 0 (0.0%) |
Disability Class: Cognitive Difficulty
| Age Bracket | Male | Female |
| 5 to 17 Years | 0 (0.0%) | 0 (0.0%) |
| 18 to 34 Years | 0 (0.0%) | 0 (0.0%) |
| 35 to 64 Years | 0 (0.0%) | 0 (0.0%) |
| 65 to 74 Years | 0 (0.0%) | 0 (0.0%) |
| 75 Years and over | 0 (0.0%) | 11 (100.0%) |
Disability Class: Ambulatory Difficulty
| Age Bracket | Male | Female |
| 5 to 17 Years | 0 (0.0%) | 0 (0.0%) |
| 18 to 34 Years | 0 (0.0%) | 0 (0.0%) |
| 35 to 64 Years | 0 (0.0%) | 0 (0.0%) |
| 65 to 74 Years | 0 (0.0%) | 0 (0.0%) |
| 75 Years and over | 0 (0.0%) | 11 (100.0%) |
Disability Class: Self-Care Difficulty
| Age Bracket | Male | Female |
| 5 to 17 Years | 0 (0.0%) | 0 (0.0%) |
| 18 to 34 Years | 0 (0.0%) | 0 (0.0%) |
| 35 to 64 Years | 0 (0.0%) | 0 (0.0%) |
| 65 to 74 Years | 0 (0.0%) | 0 (0.0%) |
| 75 Years and over | 0 (0.0%) | 0 (0.0%) |
Technology Access in Victor
Computing Device Access in Victor
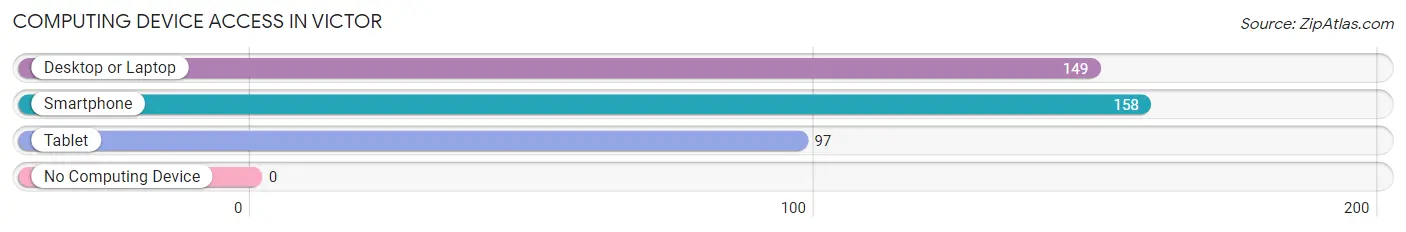
| Device Type | # Households | % Households |
| Desktop or Laptop | 149 | 94.3% |
| Smartphone | 158 | 100.0% |
| Tablet | 97 | 61.4% |
| No Computing Device | 0 | 0.0% |
| Total | 158 | 100.0% |
Internet Access in Victor
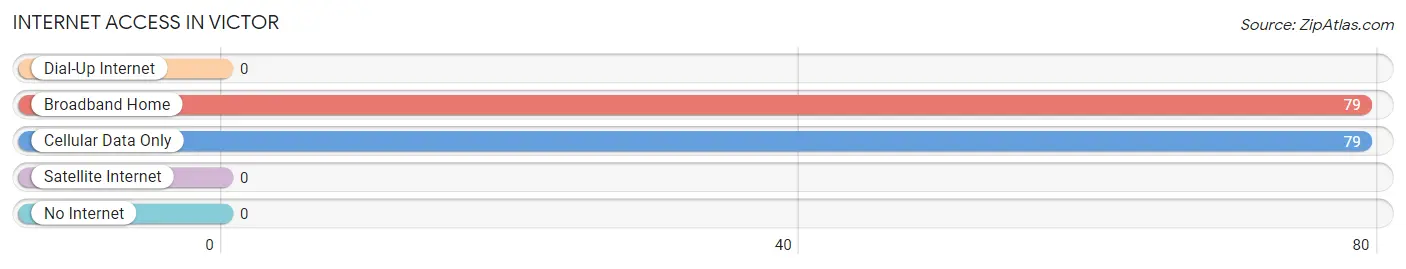
| Internet Type | # Households | % Households |
| Dial-Up Internet | 0 | 0.0% |
| Broadband Home | 79 | 50.0% |
| Cellular Data Only | 79 | 50.0% |
| Satellite Internet | 0 | 0.0% |
| No Internet | 0 | 0.0% |
| Total | 158 | 100.0% |
Victor Summary
Victor, California is a small unincorporated community located in San Bernardino County, California. It is situated in the Mojave Desert, approximately 10 miles east of Barstow and 40 miles north of Needles. The population of Victor was estimated to be 1,958 in 2019.
History
Victor was founded in 1885 by the Southern Pacific Railroad as a water stop for steam locomotives. The town was named after Jacob Nash Victor, a civil engineer who worked for the railroad. In the early 1900s, Victor was a bustling mining town, with gold, silver, and copper being mined in the area. The town was also home to a number of saloons, hotels, and stores.
In the 1920s, Victor began to decline as the mining industry in the area declined. The town was nearly abandoned by the 1940s. In the 1950s, Victor began to experience a resurgence as a result of the nearby military bases. The town was home to a number of military personnel and their families.
Geography
Victor is located in the Mojave Desert, at an elevation of 2,845 feet. The town is situated on the western edge of the Mojave National Preserve, and is surrounded by the Providence Mountains to the east and the New York Mountains to the west. The climate in Victor is arid and hot, with temperatures reaching over 100 degrees Fahrenheit in the summer months.
Economy
Victor’s economy is largely based on tourism and services. The town is home to a number of restaurants, hotels, and stores. The nearby military bases also provide employment opportunities for residents. Additionally, Victor is home to a number of small businesses, including a gas station, a grocery store, and a post office.
Demographics
As of 2019, the population of Victor was estimated to be 1,958. The racial makeup of the town was 79.3% White, 8.2% Hispanic or Latino, 6.2% African American, and 4.3% Native American. The median household income in Victor was $45,000, and the median age was 37.
Conclusion
Victor, California is a small unincorporated community located in San Bernardino County, California. It is situated in the Mojave Desert, approximately 10 miles east of Barstow and 40 miles north of Needles. The population of Victor was estimated to be 1,958 in 2019. The town’s economy is largely based on tourism and services, and the nearby military bases provide employment opportunities for residents. The racial makeup of the town was 79.3% White, 8.2% Hispanic or Latino, 6.2% African American, and 4.3% Native American. The median household income in Victor was $45,000, and the median age was 37.
Common Questions
What is Per Capita Income in Victor?
Per Capita income in Victor is $17,449.
What is the Median Family Income in Victor?
Median Family Income in Victor is $45,446.
What is the Median Household income in Victor?
Median Household Income in Victor is $45,446.
What is Income or Wage Gap in Victor?
Income or Wage Gap in Victor is 59.5%.
Women in Victor earn 40.5 cents for every dollar earned by a man.
What is Inequality or Gini Index in Victor?
Inequality or Gini Index in Victor is 0.43.
What is the Total Population of Victor?
Total Population of Victor is 608.
What is the Total Male Population of Victor?
Total Male Population of Victor is 252.
What is the Total Female Population of Victor?
Total Female Population of Victor is 356.
What is the Ratio of Males per 100 Females in Victor?
There are 70.79 Males per 100 Females in Victor.
What is the Ratio of Females per 100 Males in Victor?
There are 141.27 Females per 100 Males in Victor.
What is the Median Population Age in Victor?
Median Population Age in Victor is 20.6 Years.
What is the Average Family Size in Victor
Average Family Size in Victor is 3.9 People.
What is the Average Household Size in Victor
Average Household Size in Victor is 3.9 People.
How Large is the Labor Force in Victor?
There are 309 People in the Labor Forcein in Victor.
What is the Percentage of People in the Labor Force in Victor?
96.6% of People are in the Labor Force in Victor.