Cities with the Highest Percentage of Population Employed in Food Preparation & Serving in West Virginia
RELATED REPORTS & OPTIONS
Food Preparation & Serving
West Virginia
Compare Cities
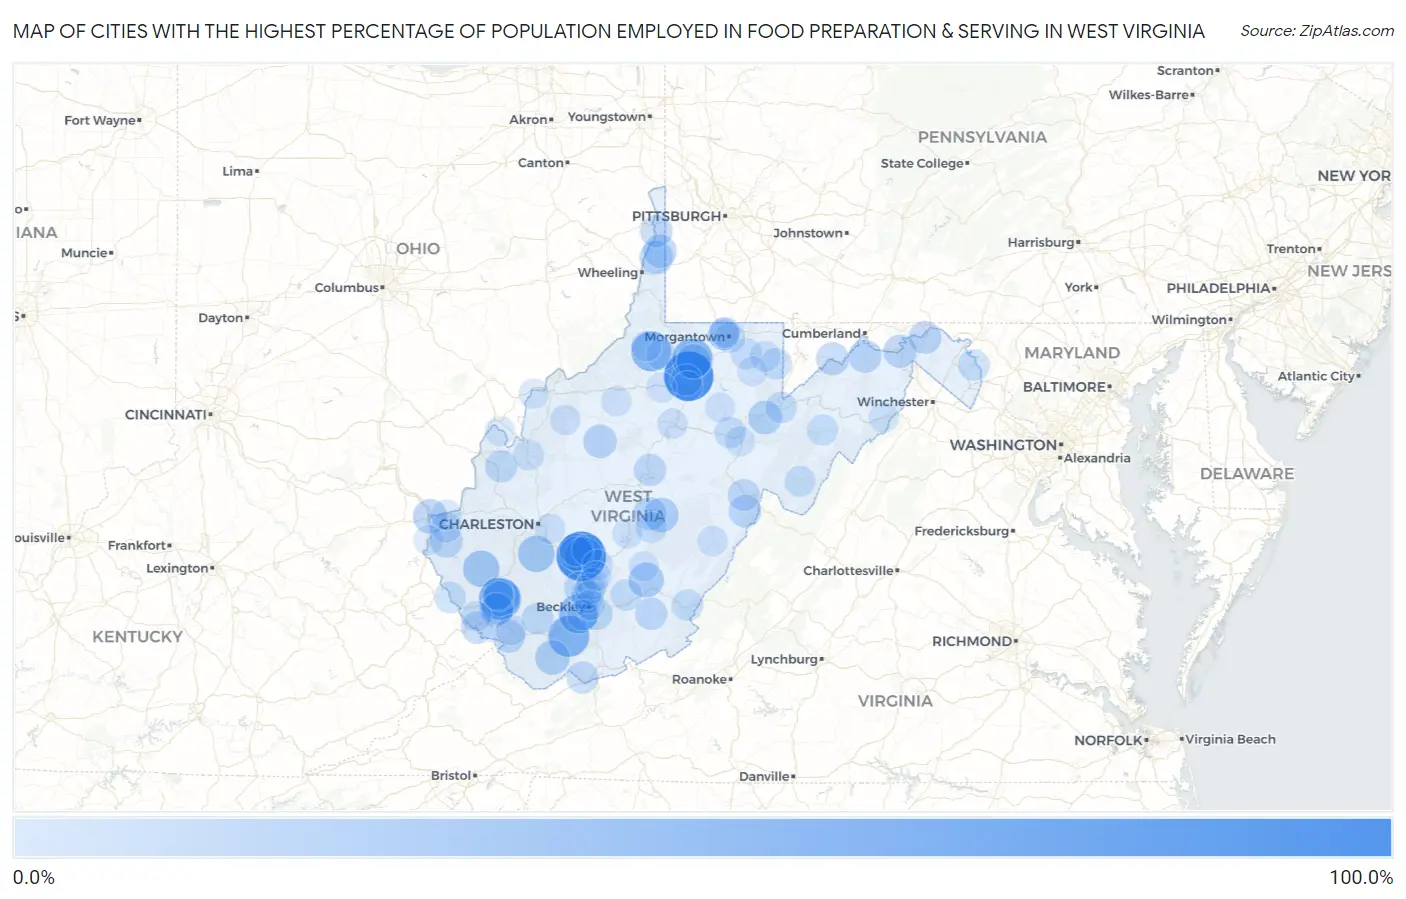
Map of Cities with the Highest Percentage of Population Employed in Food Preparation & Serving in West Virginia
0.0%
100.0%
Cities with the Highest Percentage of Population Employed in Food Preparation & Serving in West Virginia
| City | % Employed | vs State | vs National | |
| 1. | Deep Water | 100.0% | 5.7%(+94.3)#1 | 5.3%(+94.7)#4 |
| 2. | Gypsy | 100.0% | 5.7%(+94.3)#2 | 5.3%(+94.7)#16 |
| 3. | Mcconnell | 63.9% | 5.7%(+58.2)#3 | 5.3%(+58.6)#62 |
| 4. | Corinne | 58.8% | 5.7%(+53.2)#4 | 5.3%(+53.5)#78 |
| 5. | Carolina | 56.1% | 5.7%(+50.5)#5 | 5.3%(+50.9)#84 |
| 6. | Jacksonburg | 54.3% | 5.7%(+48.6)#6 | 5.3%(+49.0)#91 |
| 7. | Glen White | 51.5% | 5.7%(+45.9)#7 | 5.3%(+46.3)#102 |
| 8. | Charlton Heights | 44.3% | 5.7%(+38.7)#8 | 5.3%(+39.0)#145 |
| 9. | Stollings | 41.6% | 5.7%(+35.9)#9 | 5.3%(+36.3)#172 |
| 10. | Racine | 37.1% | 5.7%(+31.4)#10 | 5.3%(+31.8)#216 |
| 11. | Harts | 36.8% | 5.7%(+31.2)#11 | 5.3%(+31.6)#223 |
| 12. | Hollygrove | 32.3% | 5.7%(+26.6)#12 | 5.3%(+27.0)#292 |
| 13. | Rupert | 30.7% | 5.7%(+25.0)#13 | 5.3%(+25.4)#329 |
| 14. | Kimball | 28.6% | 5.7%(+22.9)#14 | 5.3%(+23.3)#380 |
| 15. | Cowen | 27.9% | 5.7%(+22.3)#15 | 5.3%(+22.6)#402 |
| 16. | Worthington | 27.5% | 5.7%(+21.8)#16 | 5.3%(+22.2)#413 |
| 17. | Kimberly | 27.0% | 5.7%(+21.3)#17 | 5.3%(+21.7)#430 |
| 18. | Kenova | 26.5% | 5.7%(+20.8)#18 | 5.3%(+21.2)#449 |
| 19. | West Liberty | 24.4% | 5.7%(+18.7)#19 | 5.3%(+19.1)#531 |
| 20. | Hambleton | 24.2% | 5.7%(+18.6)#20 | 5.3%(+19.0)#541 |
| 21. | Grantsville | 23.6% | 5.7%(+18.0)#21 | 5.3%(+18.3)#574 |
| 22. | Omar | 22.4% | 5.7%(+16.8)#22 | 5.3%(+17.2)#644 |
| 23. | Bethany | 22.4% | 5.7%(+16.7)#23 | 5.3%(+17.1)#646 |
| 24. | Paw Paw | 21.7% | 5.7%(+16.1)#24 | 5.3%(+16.4)#696 |
| 25. | Tioga | 21.7% | 5.7%(+16.0)#25 | 5.3%(+16.4)#697 |
| 26. | Fort Ashby | 21.4% | 5.7%(+15.8)#26 | 5.3%(+16.2)#710 |
| 27. | Gilbert Creek | 21.1% | 5.7%(+15.4)#27 | 5.3%(+15.8)#727 |
| 28. | Smithers | 20.9% | 5.7%(+15.3)#28 | 5.3%(+15.7)#739 |
| 29. | Piedmont | 20.7% | 5.7%(+15.0)#29 | 5.3%(+15.4)#768 |
| 30. | Bath Berkeley Springs | 20.3% | 5.7%(+14.7)#30 | 5.3%(+15.0)#801 |
| 31. | Wayne | 20.0% | 5.7%(+14.3)#31 | 5.3%(+14.7)#833 |
| 32. | Daniels | 19.6% | 5.7%(+13.9)#32 | 5.3%(+14.3)#885 |
| 33. | Matewan | 19.2% | 5.7%(+13.5)#33 | 5.3%(+13.9)#931 |
| 34. | Follansbee | 18.7% | 5.7%(+13.1)#34 | 5.3%(+13.5)#978 |
| 35. | Arbovale | 18.6% | 5.7%(+12.9)#35 | 5.3%(+13.3)#1,000 |
| 36. | Chauncey | 18.5% | 5.7%(+12.9)#36 | 5.3%(+13.2)#1,004 |
| 37. | Leon | 18.1% | 5.7%(+12.4)#37 | 5.3%(+12.8)#1,054 |
| 38. | Flatwoods | 18.0% | 5.7%(+12.3)#38 | 5.3%(+12.7)#1,065 |
| 39. | Booth | 17.9% | 5.7%(+12.2)#39 | 5.3%(+12.6)#1,080 |
| 40. | Alderson | 17.5% | 5.7%(+11.9)#40 | 5.3%(+12.2)#1,126 |
| 41. | Durbin | 16.8% | 5.7%(+11.1)#41 | 5.3%(+11.5)#1,228 |
| 42. | Brush Fork | 16.7% | 5.7%(+11.0)#42 | 5.3%(+11.4)#1,243 |
| 43. | West Logan | 16.6% | 5.7%(+10.9)#43 | 5.3%(+11.3)#1,289 |
| 44. | Granville | 16.5% | 5.7%(+10.8)#44 | 5.3%(+11.2)#1,295 |
| 45. | Pax | 16.0% | 5.7%(+10.3)#45 | 5.3%(+10.7)#1,409 |
| 46. | Oceana | 16.0% | 5.7%(+10.3)#46 | 5.3%(+10.7)#1,410 |
| 47. | Institute | 15.2% | 5.7%(+9.49)#47 | 5.3%(+9.87)#1,585 |
| 48. | Prosperity | 14.4% | 5.7%(+8.79)#48 | 5.3%(+9.16)#1,781 |
| 49. | White Sulphur Springs | 14.4% | 5.7%(+8.79)#49 | 5.3%(+9.16)#1,783 |
| 50. | Hepzibah | 14.3% | 5.7%(+8.63)#50 | 5.3%(+9.00)#1,811 |
| 51. | Kermit | 14.3% | 5.7%(+8.63)#51 | 5.3%(+9.00)#1,816 |
| 52. | Meadow Bridge | 14.2% | 5.7%(+8.53)#52 | 5.3%(+8.90)#1,863 |
| 53. | Terra Alta | 14.1% | 5.7%(+8.49)#53 | 5.3%(+8.86)#1,869 |
| 54. | Junior | 14.0% | 5.7%(+8.30)#54 | 5.3%(+8.67)#1,929 |
| 55. | Thomas | 13.8% | 5.7%(+8.11)#55 | 5.3%(+8.48)#1,982 |
| 56. | Shepherdstown | 13.7% | 5.7%(+8.01)#56 | 5.3%(+8.39)#2,012 |
| 57. | Gauley Bridge | 13.6% | 5.7%(+7.98)#57 | 5.3%(+8.35)#2,023 |
| 58. | Bradley | 13.3% | 5.7%(+7.67)#58 | 5.3%(+8.04)#2,136 |
| 59. | Petersburg | 12.8% | 5.7%(+7.17)#59 | 5.3%(+7.54)#2,337 |
| 60. | Hilltop | 12.5% | 5.7%(+6.84)#60 | 5.3%(+7.21)#2,485 |
| 61. | Reedsville | 12.3% | 5.7%(+6.61)#61 | 5.3%(+6.98)#2,611 |
| 62. | Craigsville | 12.1% | 5.7%(+6.46)#62 | 5.3%(+6.83)#2,699 |
| 63. | Franklin | 12.0% | 5.7%(+6.37)#63 | 5.3%(+6.74)#2,739 |
| 64. | Albright | 11.8% | 5.7%(+6.17)#64 | 5.3%(+6.54)#2,867 |
| 65. | Ripley | 11.7% | 5.7%(+6.03)#65 | 5.3%(+6.40)#2,952 |
| 66. | Mount Hope | 11.6% | 5.7%(+5.94)#66 | 5.3%(+6.31)#3,004 |
| 67. | Morgantown | 10.7% | 5.7%(+5.03)#67 | 5.3%(+5.40)#3,589 |
| 68. | Lavalette | 10.7% | 5.7%(+5.01)#68 | 5.3%(+5.38)#3,602 |
| 69. | Huntington | 10.6% | 5.7%(+4.93)#69 | 5.3%(+5.30)#3,663 |
| 70. | Sophia | 10.5% | 5.7%(+4.83)#70 | 5.3%(+5.20)#3,736 |
| 71. | Fayetteville | 10.4% | 5.7%(+4.79)#71 | 5.3%(+5.16)#3,762 |
| 72. | Westover | 10.2% | 5.7%(+4.59)#72 | 5.3%(+4.96)#3,905 |
| 73. | Marlinton | 10.2% | 5.7%(+4.54)#73 | 5.3%(+4.91)#3,948 |
| 74. | Gilbert | 10.1% | 5.7%(+4.42)#74 | 5.3%(+4.79)#4,034 |
| 75. | Weston | 9.8% | 5.7%(+4.19)#75 | 5.3%(+4.56)#4,223 |
| 76. | Coal Fork | 9.8% | 5.7%(+4.12)#76 | 5.3%(+4.49)#4,280 |
| 77. | Star City | 9.8% | 5.7%(+4.12)#77 | 5.3%(+4.49)#4,284 |
| 78. | Delbarton | 9.4% | 5.7%(+3.74)#78 | 5.3%(+4.11)#4,641 |
| 79. | Norton | 9.3% | 5.7%(+3.68)#79 | 5.3%(+4.05)#4,710 |
| 80. | Raleigh | 9.3% | 5.7%(+3.66)#80 | 5.3%(+4.03)#4,727 |
| 81. | Clarksburg | 9.2% | 5.7%(+3.55)#81 | 5.3%(+3.93)#4,828 |
| 82. | Smithfield | 9.1% | 5.7%(+3.43)#82 | 5.3%(+3.80)#4,963 |
| 83. | Elizabeth | 9.0% | 5.7%(+3.34)#83 | 5.3%(+3.71)#5,065 |
| 84. | Newark | 8.9% | 5.7%(+3.21)#84 | 5.3%(+3.58)#5,232 |
| 85. | Pine Grove | 8.9% | 5.7%(+3.20)#85 | 5.3%(+3.57)#5,244 |
| 86. | Elkins | 8.9% | 5.7%(+3.19)#86 | 5.3%(+3.56)#5,254 |
| 87. | Oak Hill | 8.8% | 5.7%(+3.15)#87 | 5.3%(+3.52)#5,306 |
| 88. | Beckley | 8.7% | 5.7%(+3.05)#88 | 5.3%(+3.42)#5,421 |
| 89. | Pullman | 8.6% | 5.7%(+2.95)#89 | 5.3%(+3.32)#5,543 |
| 90. | Prichard | 8.6% | 5.7%(+2.90)#90 | 5.3%(+3.27)#5,597 |
| 91. | Sprague | 8.5% | 5.7%(+2.82)#91 | 5.3%(+3.19)#5,689 |
| 92. | Quinwood | 8.3% | 5.7%(+2.68)#92 | 5.3%(+3.05)#5,887 |
| 93. | Salem | 8.3% | 5.7%(+2.66)#93 | 5.3%(+3.03)#5,919 |
| 94. | Tunnelton | 8.3% | 5.7%(+2.63)#94 | 5.3%(+3.00)#5,954 |
| 95. | Logan | 8.3% | 5.7%(+2.60)#95 | 5.3%(+2.97)#5,984 |
| 96. | New Haven | 8.2% | 5.7%(+2.56)#96 | 5.3%(+2.93)#6,035 |
| 97. | Philippi | 8.2% | 5.7%(+2.56)#97 | 5.3%(+2.93)#6,043 |
| 98. | Washington | 8.2% | 5.7%(+2.51)#98 | 5.3%(+2.88)#6,114 |
| 99. | Wardensville | 8.2% | 5.7%(+2.51)#99 | 5.3%(+2.88)#6,118 |
| 100. | Summersville | 8.2% | 5.7%(+2.50)#100 | 5.3%(+2.87)#6,127 |
Common Questions
What are the Top 10 Cities with the Highest Percentage of Population Employed in Food Preparation & Serving in West Virginia?
Top 10 Cities with the Highest Percentage of Population Employed in Food Preparation & Serving in West Virginia are:
#1
100.0%
#2
100.0%
#3
63.9%
#4
58.8%
#5
56.1%
#6
54.3%
#7
51.5%
#8
44.3%
#9
41.6%
#10
37.1%
What city has the Highest Percentage of Population Employed in Food Preparation & Serving in West Virginia?
Deep Water has the Highest Percentage of Population Employed in Food Preparation & Serving in West Virginia with 100.0%.
What is the Percentage of Population Employed in Food Preparation & Serving in the State of West Virginia?
Percentage of Population Employed in Food Preparation & Serving in West Virginia is 5.7%.
What is the Percentage of Population Employed in Food Preparation & Serving in the United States?
Percentage of Population Employed in Food Preparation & Serving in the United States is 5.3%.