Cities with the Highest Percentage of Population Employed in Food Preparation & Serving in Kentucky
RELATED REPORTS & OPTIONS
Food Preparation & Serving
Kentucky
Compare Cities
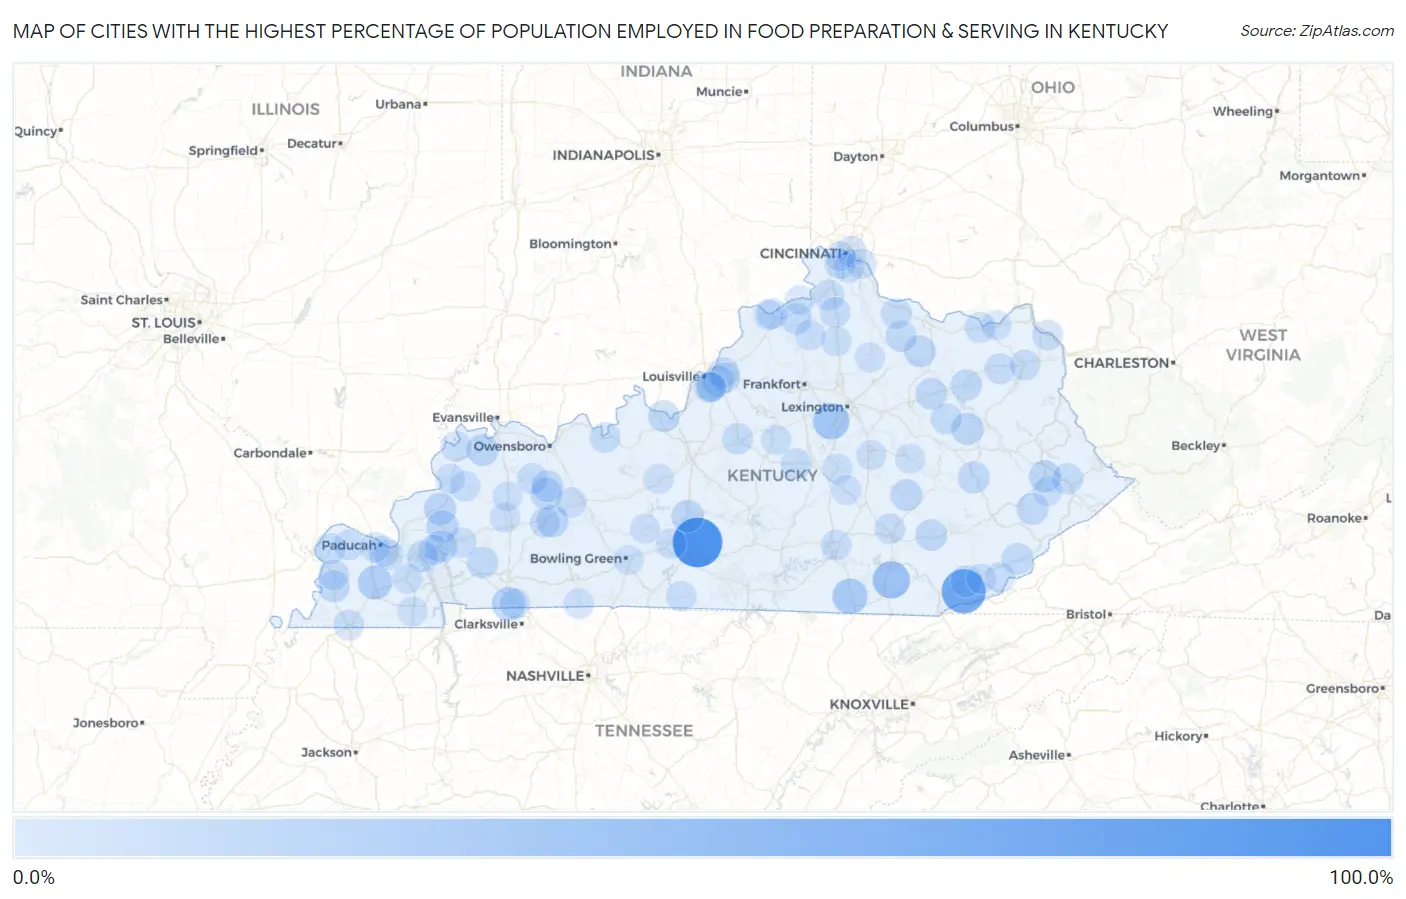
Map of Cities with the Highest Percentage of Population Employed in Food Preparation & Serving in Kentucky
0.0%
100.0%
Cities with the Highest Percentage of Population Employed in Food Preparation & Serving in Kentucky
| City | % Employed | vs State | vs National | |
| 1. | Hiseville | 100.0% | 5.1%(+94.9)#1 | 5.3%(+94.7)#8 |
| 2. | Pathfork | 73.9% | 5.1%(+68.8)#2 | 5.3%(+68.6)#51 |
| 3. | Moseleyville | 51.2% | 5.1%(+46.1)#3 | 5.3%(+45.9)#104 |
| 4. | Rockholds | 40.7% | 5.1%(+35.7)#4 | 5.3%(+35.5)#181 |
| 5. | Keene | 35.9% | 5.1%(+30.8)#5 | 5.3%(+30.6)#238 |
| 6. | Whitley City | 31.7% | 5.1%(+26.6)#6 | 5.3%(+26.4)#302 |
| 7. | Curdsville | 31.0% | 5.1%(+25.9)#7 | 5.3%(+25.7)#322 |
| 8. | Hickory | 26.3% | 5.1%(+21.2)#8 | 5.3%(+21.0)#457 |
| 9. | Fort Campbell North | 24.0% | 5.1%(+18.9)#9 | 5.3%(+18.7)#551 |
| 10. | Munfordville | 19.1% | 5.1%(+14.0)#10 | 5.3%(+13.8)#933 |
| 11. | Ezel | 17.7% | 5.1%(+12.6)#11 | 5.3%(+12.4)#1,096 |
| 12. | Marion | 17.7% | 5.1%(+12.6)#12 | 5.3%(+12.4)#1,104 |
| 13. | Corydon | 17.1% | 5.1%(+12.0)#13 | 5.3%(+11.8)#1,195 |
| 14. | Martin | 17.1% | 5.1%(+12.0)#14 | 5.3%(+11.8)#1,197 |
| 15. | Cleaton | 17.0% | 5.1%(+11.9)#15 | 5.3%(+11.7)#1,210 |
| 16. | Fredonia | 16.8% | 5.1%(+11.7)#16 | 5.3%(+11.5)#1,225 |
| 17. | Jackson | 16.7% | 5.1%(+11.6)#17 | 5.3%(+11.4)#1,242 |
| 18. | Mckee | 16.7% | 5.1%(+11.6)#18 | 5.3%(+11.4)#1,249 |
| 19. | Eddyville | 16.5% | 5.1%(+11.4)#19 | 5.3%(+11.2)#1,300 |
| 20. | Arlington | 16.3% | 5.1%(+11.2)#20 | 5.3%(+11.0)#1,331 |
| 21. | Pippa Passes | 16.2% | 5.1%(+11.1)#21 | 5.3%(+10.9)#1,363 |
| 22. | Owingsville | 16.2% | 5.1%(+11.1)#22 | 5.3%(+10.9)#1,364 |
| 23. | Ewing | 15.8% | 5.1%(+10.8)#23 | 5.3%(+10.6)#1,441 |
| 24. | Island | 15.7% | 5.1%(+10.6)#24 | 5.3%(+10.4)#1,473 |
| 25. | Manchester | 15.6% | 5.1%(+10.5)#25 | 5.3%(+10.3)#1,496 |
| 26. | Doe Valley | 15.5% | 5.1%(+10.4)#26 | 5.3%(+10.2)#1,504 |
| 27. | Coldiron | 15.4% | 5.1%(+10.3)#27 | 5.3%(+10.1)#1,520 |
| 28. | Livermore | 15.4% | 5.1%(+10.3)#28 | 5.3%(+10.1)#1,521 |
| 29. | Cumberland | 15.0% | 5.1%(+9.92)#29 | 5.3%(+9.71)#1,626 |
| 30. | Grand Rivers | 14.9% | 5.1%(+9.86)#30 | 5.3%(+9.66)#1,655 |
| 31. | Cerulean | 14.6% | 5.1%(+9.49)#31 | 5.3%(+9.29)#1,749 |
| 32. | Mount Olivet | 14.3% | 5.1%(+9.20)#32 | 5.3%(+9.00)#1,820 |
| 33. | Morehead | 14.2% | 5.1%(+9.11)#33 | 5.3%(+8.91)#1,861 |
| 34. | Sanders | 14.0% | 5.1%(+8.96)#34 | 5.3%(+8.76)#1,904 |
| 35. | Coal Run Village | 13.6% | 5.1%(+8.54)#35 | 5.3%(+8.34)#2,030 |
| 36. | Bardstown | 12.9% | 5.1%(+7.84)#36 | 5.3%(+7.63)#2,286 |
| 37. | Frenchburg | 12.7% | 5.1%(+7.63)#37 | 5.3%(+7.43)#2,396 |
| 38. | Farley | 12.4% | 5.1%(+7.31)#38 | 5.3%(+7.11)#2,565 |
| 39. | Meadowview Estates | 12.3% | 5.1%(+7.20)#39 | 5.3%(+6.99)#2,605 |
| 40. | Calhoun | 12.2% | 5.1%(+7.08)#40 | 5.3%(+6.88)#2,669 |
| 41. | Perryville | 12.0% | 5.1%(+6.94)#41 | 5.3%(+6.73)#2,747 |
| 42. | Rolling Hills | 11.8% | 5.1%(+6.75)#42 | 5.3%(+6.55)#2,861 |
| 43. | Brooksville | 11.7% | 5.1%(+6.66)#43 | 5.3%(+6.46)#2,913 |
| 44. | Verona | 11.7% | 5.1%(+6.62)#44 | 5.3%(+6.42)#2,940 |
| 45. | Barlow | 11.7% | 5.1%(+6.58)#45 | 5.3%(+6.38)#2,961 |
| 46. | Olive Hill | 11.6% | 5.1%(+6.51)#46 | 5.3%(+6.31)#3,005 |
| 47. | Uniontown | 11.5% | 5.1%(+6.42)#47 | 5.3%(+6.22)#3,069 |
| 48. | Raceland | 11.5% | 5.1%(+6.41)#48 | 5.3%(+6.21)#3,071 |
| 49. | Wildwood | 11.4% | 5.1%(+6.32)#49 | 5.3%(+6.12)#3,126 |
| 50. | Oak Grove | 11.3% | 5.1%(+6.26)#50 | 5.3%(+6.06)#3,165 |
| 51. | Fulton | 11.3% | 5.1%(+6.26)#51 | 5.3%(+6.06)#3,168 |
| 52. | Cloverport | 11.0% | 5.1%(+5.93)#52 | 5.3%(+5.73)#3,383 |
| 53. | Vanceburg | 10.9% | 5.1%(+5.86)#53 | 5.3%(+5.66)#3,424 |
| 54. | East Bernstadt | 10.9% | 5.1%(+5.82)#54 | 5.3%(+5.62)#3,436 |
| 55. | Dry Ridge | 10.9% | 5.1%(+5.82)#55 | 5.3%(+5.62)#3,443 |
| 56. | Grayson | 10.9% | 5.1%(+5.79)#56 | 5.3%(+5.59)#3,458 |
| 57. | Bardwell | 10.9% | 5.1%(+5.78)#57 | 5.3%(+5.58)#3,461 |
| 58. | Carrollton | 10.8% | 5.1%(+5.71)#58 | 5.3%(+5.51)#3,515 |
| 59. | Park City | 10.8% | 5.1%(+5.68)#59 | 5.3%(+5.48)#3,536 |
| 60. | Lynnview | 10.8% | 5.1%(+5.68)#60 | 5.3%(+5.48)#3,537 |
| 61. | Kevil | 10.6% | 5.1%(+5.49)#61 | 5.3%(+5.29)#3,671 |
| 62. | Adairville | 10.5% | 5.1%(+5.44)#62 | 5.3%(+5.24)#3,690 |
| 63. | Wheatcroft | 10.3% | 5.1%(+5.26)#63 | 5.3%(+5.06)#3,841 |
| 64. | Princeton | 10.2% | 5.1%(+5.15)#64 | 5.3%(+4.95)#3,911 |
| 65. | Kenvir | 10.1% | 5.1%(+5.06)#65 | 5.3%(+4.86)#3,983 |
| 66. | Dayton | 10.1% | 5.1%(+5.03)#66 | 5.3%(+4.83)#4,006 |
| 67. | Somerset | 10.0% | 5.1%(+4.89)#67 | 5.3%(+4.69)#4,135 |
| 68. | Owenton | 10.0% | 5.1%(+4.88)#68 | 5.3%(+4.68)#4,140 |
| 69. | Fairview | 9.9% | 5.1%(+4.79)#69 | 5.3%(+4.59)#4,206 |
| 70. | Powderly | 9.7% | 5.1%(+4.61)#70 | 5.3%(+4.41)#4,360 |
| 71. | Kuttawa | 9.6% | 5.1%(+4.54)#71 | 5.3%(+4.34)#4,412 |
| 72. | Crestview Hills | 9.6% | 5.1%(+4.49)#72 | 5.3%(+4.29)#4,472 |
| 73. | Corinth | 9.6% | 5.1%(+4.48)#73 | 5.3%(+4.28)#4,477 |
| 74. | Sturgis | 9.4% | 5.1%(+4.30)#74 | 5.3%(+4.09)#4,654 |
| 75. | Fountain Run | 9.4% | 5.1%(+4.27)#75 | 5.3%(+4.07)#4,690 |
| 76. | Willisburg | 9.3% | 5.1%(+4.24)#76 | 5.3%(+4.04)#4,715 |
| 77. | Lancaster | 9.3% | 5.1%(+4.23)#77 | 5.3%(+4.03)#4,724 |
| 78. | Mchenry | 9.3% | 5.1%(+4.23)#78 | 5.3%(+4.03)#4,726 |
| 79. | Prestonville | 9.3% | 5.1%(+4.22)#79 | 5.3%(+4.02)#4,747 |
| 80. | Benton | 9.2% | 5.1%(+4.09)#80 | 5.3%(+3.89)#4,860 |
| 81. | Garrison | 9.1% | 5.1%(+4.01)#81 | 5.3%(+3.80)#4,944 |
| 82. | Reidland | 9.1% | 5.1%(+3.98)#82 | 5.3%(+3.78)#4,989 |
| 83. | Bromley | 9.0% | 5.1%(+3.90)#83 | 5.3%(+3.70)#5,069 |
| 84. | Brownsville | 9.0% | 5.1%(+3.88)#84 | 5.3%(+3.67)#5,113 |
| 85. | Big Clifty | 9.0% | 5.1%(+3.87)#85 | 5.3%(+3.67)#5,128 |
| 86. | Cynthiana | 8.9% | 5.1%(+3.82)#86 | 5.3%(+3.62)#5,183 |
| 87. | Poplar Hills | 8.9% | 5.1%(+3.81)#87 | 5.3%(+3.61)#5,199 |
| 88. | Earlington | 8.9% | 5.1%(+3.80)#88 | 5.3%(+3.60)#5,207 |
| 89. | Paducah | 8.9% | 5.1%(+3.80)#89 | 5.3%(+3.59)#5,225 |
| 90. | Richmond | 8.9% | 5.1%(+3.78)#90 | 5.3%(+3.57)#5,242 |
| 91. | Melbourne | 8.8% | 5.1%(+3.75)#91 | 5.3%(+3.55)#5,263 |
| 92. | Watterson Park | 8.7% | 5.1%(+3.66)#92 | 5.3%(+3.46)#5,371 |
| 93. | Bowling Green | 8.7% | 5.1%(+3.63)#93 | 5.3%(+3.43)#5,408 |
| 94. | Hanson | 8.5% | 5.1%(+3.46)#94 | 5.3%(+3.25)#5,614 |
| 95. | Crab Orchard | 8.5% | 5.1%(+3.38)#95 | 5.3%(+3.18)#5,698 |
| 96. | Harlan | 8.5% | 5.1%(+3.38)#96 | 5.3%(+3.18)#5,702 |
| 97. | Mcdowell | 8.5% | 5.1%(+3.38)#97 | 5.3%(+3.18)#5,709 |
| 98. | Ravenna | 8.4% | 5.1%(+3.32)#98 | 5.3%(+3.11)#5,788 |
| 99. | Murray | 8.4% | 5.1%(+3.31)#99 | 5.3%(+3.10)#5,801 |
| 100. | Warsaw | 8.4% | 5.1%(+3.27)#100 | 5.3%(+3.06)#5,839 |
Common Questions
What are the Top 10 Cities with the Highest Percentage of Population Employed in Food Preparation & Serving in Kentucky?
Top 10 Cities with the Highest Percentage of Population Employed in Food Preparation & Serving in Kentucky are:
#1
100.0%
#2
73.9%
#3
40.7%
#4
35.9%
#5
31.7%
#6
26.3%
#7
24.0%
#8
19.1%
#9
17.7%
#10
17.7%
What city has the Highest Percentage of Population Employed in Food Preparation & Serving in Kentucky?
Hiseville has the Highest Percentage of Population Employed in Food Preparation & Serving in Kentucky with 100.0%.
What is the Percentage of Population Employed in Food Preparation & Serving in the State of Kentucky?
Percentage of Population Employed in Food Preparation & Serving in Kentucky is 5.1%.
What is the Percentage of Population Employed in Food Preparation & Serving in the United States?
Percentage of Population Employed in Food Preparation & Serving in the United States is 5.3%.