Wawona, CA Map & Demographics
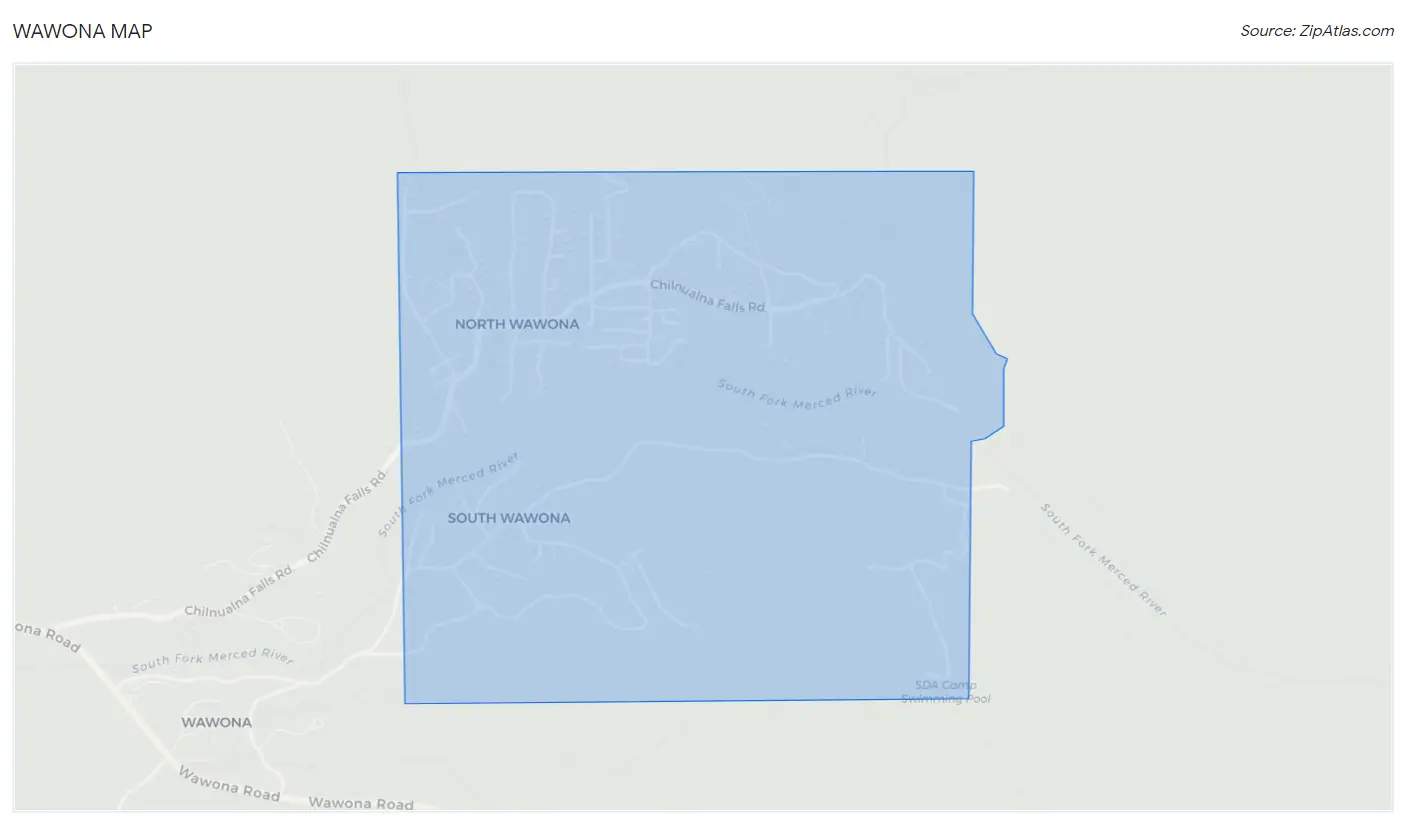
Wawona Map
Wawona Overview
$48,376
PER CAPITA INCOME
$64,896
AVG HOUSEHOLD INCOME
0.15
INEQUALITY / GINI INDEX
122
TOTAL POPULATION
70
MALE POPULATION
52
FEMALE POPULATION
134.62
MALES / 100 FEMALES
74.29
FEMALES / 100 MALES
61.5
MEDIAN AGE
1.7
AVG FAMILY SIZE
1.1
AVG HOUSEHOLD SIZE
89
LABOR FORCE [ PEOPLE ]
73.0%
PERCENT IN LABOR FORCE
6.7%
UNEMPLOYMENT RATE
Wawona Area Codes
Income in Wawona
Income Overview in Wawona
| Characteristic | Number | Measure |
| Per Capita Income | 122 | $48,376 |
| Median Family Income | 19 | $0 |
| Mean Family Income | 19 | $0 |
| Median Household Income | 89 | $64,896 |
| Mean Household Income | 89 | $56,566 |
| Income Deficit | 19 | $0 |
| Wage / Income Gap (%) | 122 | 0.00% |
| Wage / Income Gap ($) | 122 | 100.00¢ per $1 |
| Gini / Inequality Index | 122 | 0.15 |
Earnings by Sex in Wawona
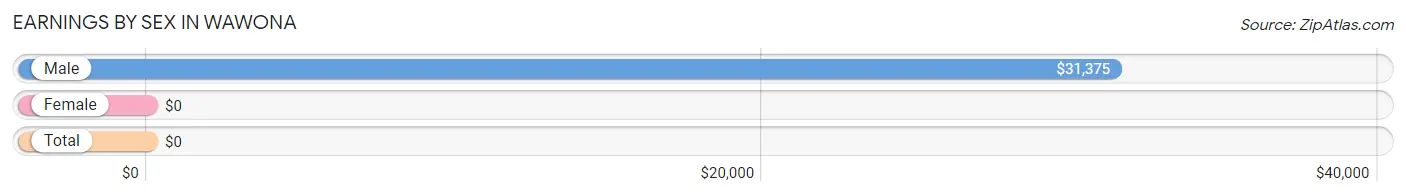
| Sex | Number | Average Earnings |
| Male | 44 (49.4%) | $31,375 |
| Female | 45 (50.6%) | $0 |
| Total | 89 (100.0%) | $0 |
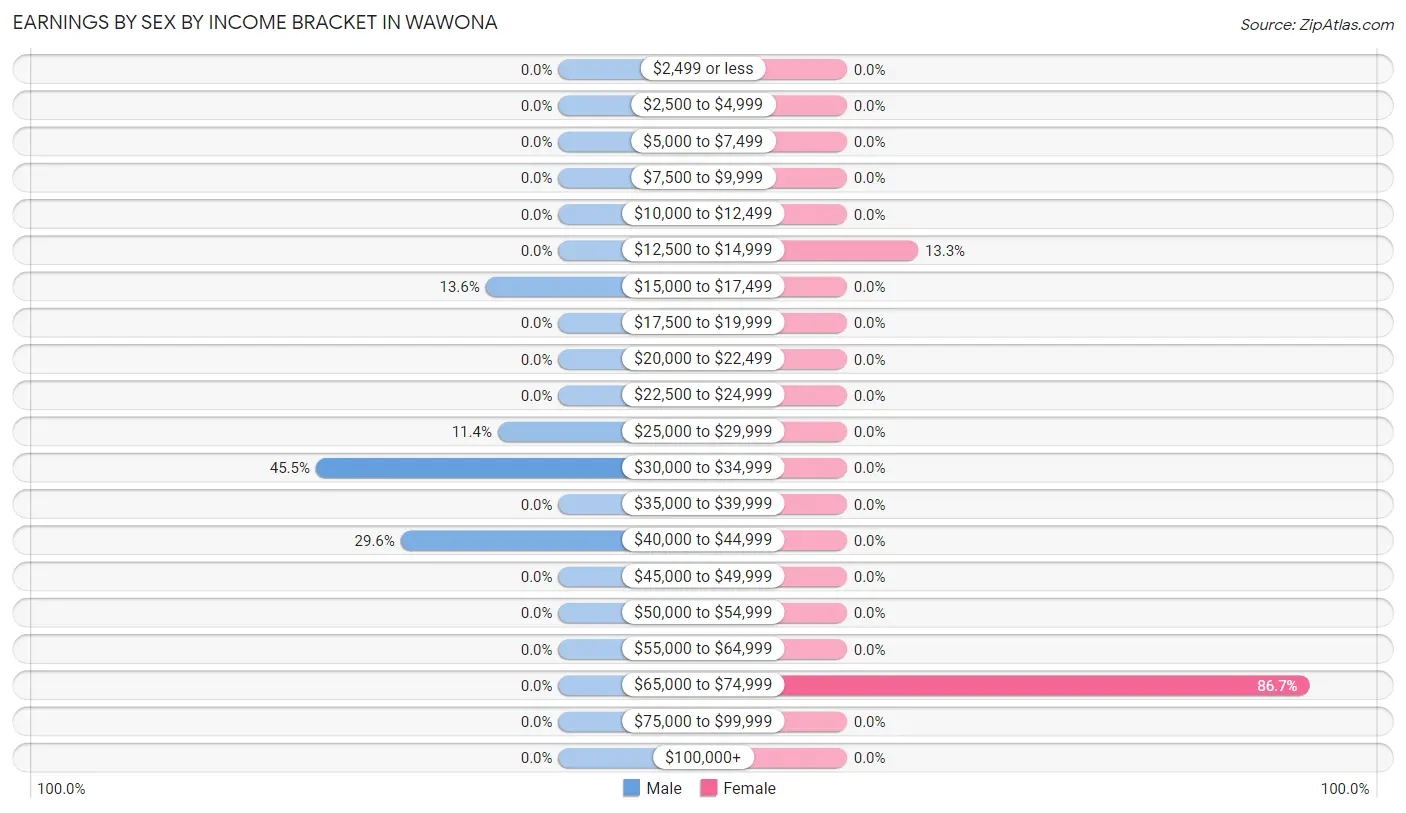
Earnings by Sex by Income Bracket in Wawona
The most common earnings brackets in Wawona are $30,000 to $34,999 for men (20 | 45.5%) and $65,000 to $74,999 for women (39 | 86.7%).
| Income | Male | Female |
| $2,499 or less | 0 (0.0%) | 0 (0.0%) |
| $2,500 to $4,999 | 0 (0.0%) | 0 (0.0%) |
| $5,000 to $7,499 | 0 (0.0%) | 0 (0.0%) |
| $7,500 to $9,999 | 0 (0.0%) | 0 (0.0%) |
| $10,000 to $12,499 | 0 (0.0%) | 0 (0.0%) |
| $12,500 to $14,999 | 0 (0.0%) | 6 (13.3%) |
| $15,000 to $17,499 | 6 (13.6%) | 0 (0.0%) |
| $17,500 to $19,999 | 0 (0.0%) | 0 (0.0%) |
| $20,000 to $22,499 | 0 (0.0%) | 0 (0.0%) |
| $22,500 to $24,999 | 0 (0.0%) | 0 (0.0%) |
| $25,000 to $29,999 | 5 (11.4%) | 0 (0.0%) |
| $30,000 to $34,999 | 20 (45.5%) | 0 (0.0%) |
| $35,000 to $39,999 | 0 (0.0%) | 0 (0.0%) |
| $40,000 to $44,999 | 13 (29.5%) | 0 (0.0%) |
| $45,000 to $49,999 | 0 (0.0%) | 0 (0.0%) |
| $50,000 to $54,999 | 0 (0.0%) | 0 (0.0%) |
| $55,000 to $64,999 | 0 (0.0%) | 0 (0.0%) |
| $65,000 to $74,999 | 0 (0.0%) | 39 (86.7%) |
| $75,000 to $99,999 | 0 (0.0%) | 0 (0.0%) |
| $100,000+ | 0 (0.0%) | 0 (0.0%) |
| Total | 44 (100.0%) | 45 (100.0%) |
Earnings by Sex by Educational Attainment in Wawona
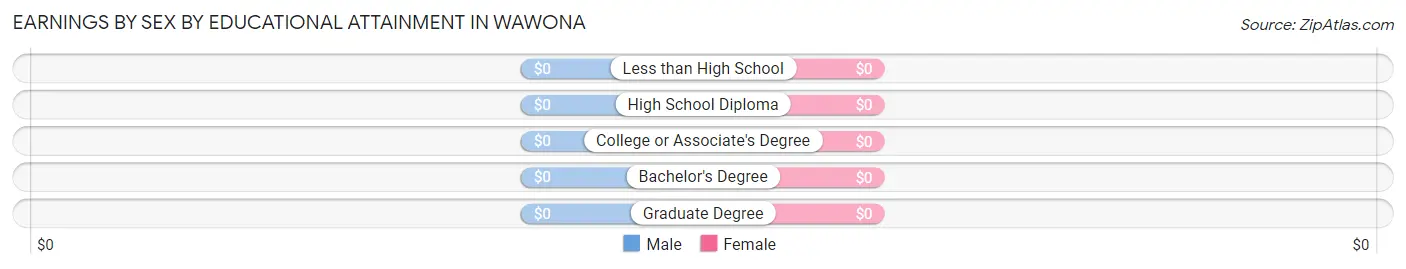
| Educational Attainment | Male Income | Female Income |
| Less than High School | - | - |
| High School Diploma | - | - |
| College or Associate's Degree | - | - |
| Bachelor's Degree | - | - |
| Graduate Degree | - | - |
| Total | $31,375 | $0 |
Family Income in Wawona
Family Income Brackets in Wawona
According to the Wawona family income data, there are 19 families falling into the $50,000 to $74,999 income range, which is the most common income bracket and makes up 100.0% of all families.
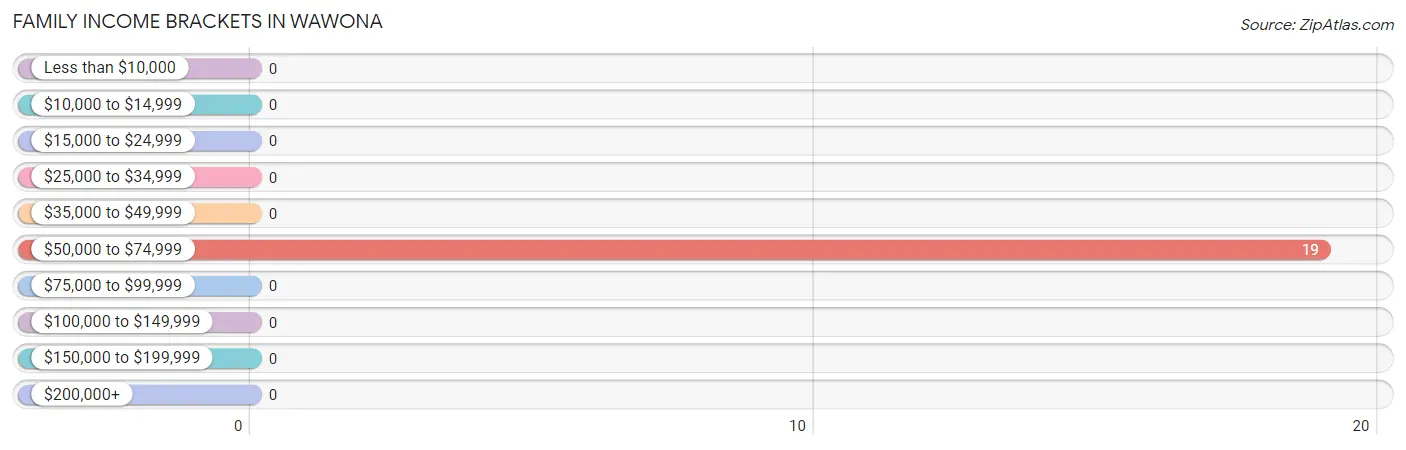
| Income Bracket | # Families | % Families |
| Less than $10,000 | 0 | 0.0% |
| $10,000 to $14,999 | 0 | 0.0% |
| $15,000 to $24,999 | 0 | 0.0% |
| $25,000 to $34,999 | 0 | 0.0% |
| $35,000 to $49,999 | 0 | 0.0% |
| $50,000 to $74,999 | 19 | 100.0% |
| $75,000 to $99,999 | 0 | 0.0% |
| $100,000 to $149,999 | 0 | 0.0% |
| $150,000 to $199,999 | 0 | 0.0% |
| $200,000+ | 0 | 0.0% |
Family Income by Famaliy Size in Wawona
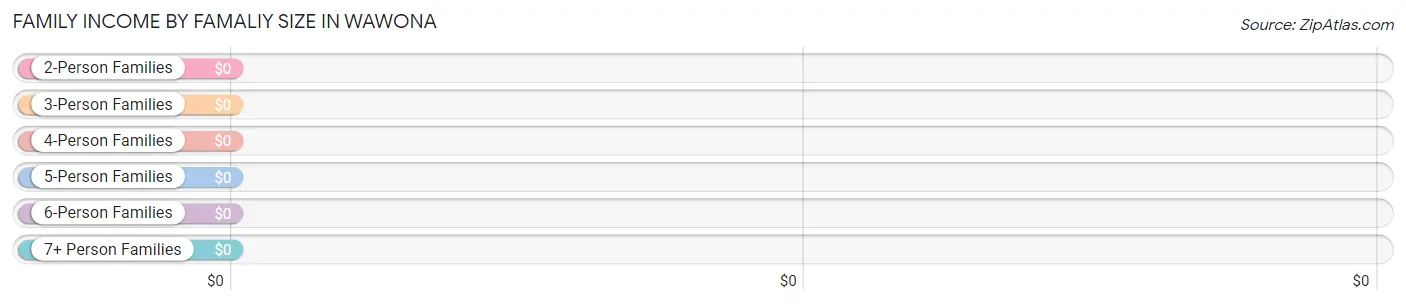
| Income Bracket | # Families | Median Income |
| 2-Person Families | 19 (100.0%) | $0 |
| 3-Person Families | 0 (0.0%) | $0 |
| 4-Person Families | 0 (0.0%) | $0 |
| 5-Person Families | 0 (0.0%) | $0 |
| 6-Person Families | 0 (0.0%) | $0 |
| 7+ Person Families | 0 (0.0%) | $0 |
| Total | 19 (100.0%) | $0 |
Family Income by Number of Earners in Wawona
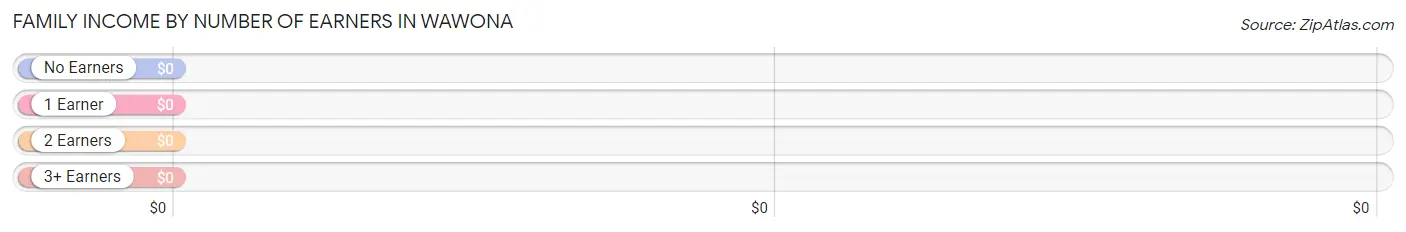
| Number of Earners | # Families | Median Income |
| No Earners | 12 (63.2%) | $0 |
| 1 Earner | 7 (36.8%) | $0 |
| 2 Earners | 0 (0.0%) | $0 |
| 3+ Earners | 0 (0.0%) | $0 |
| Total | 19 (100.0%) | $0 |
Household Income in Wawona
Household Income Brackets in Wawona
With 58 households falling in the category, the $50,000 to $74,999 income range is the most frequent in Wawona, accounting for 65.2% of all households.
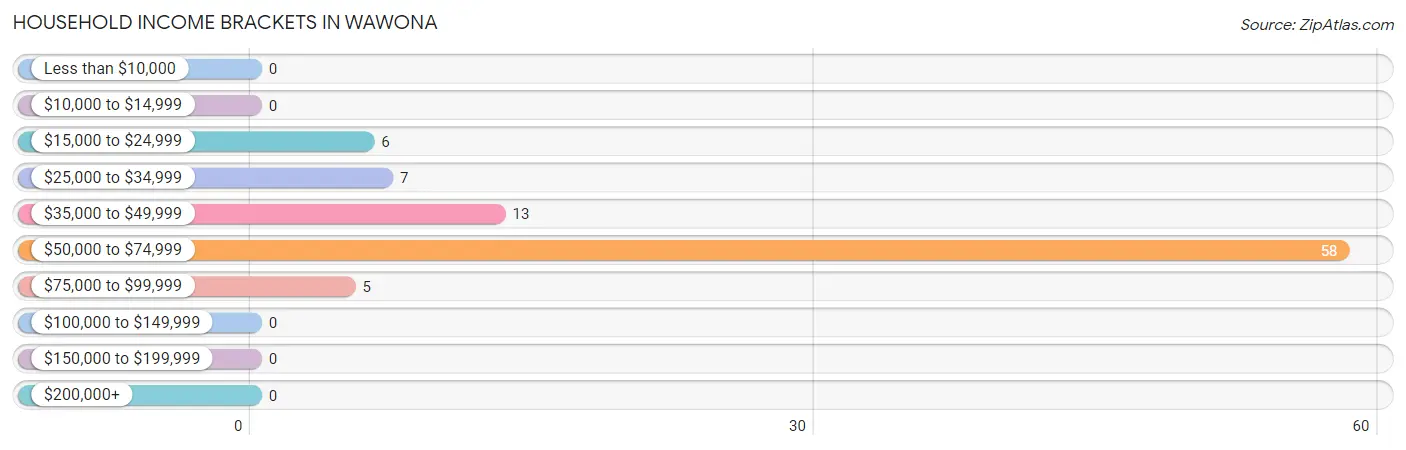
| Income Bracket | # Households | % Households |
| Less than $10,000 | 0 | 0.0% |
| $10,000 to $14,999 | 0 | 0.0% |
| $15,000 to $24,999 | 6 | 6.7% |
| $25,000 to $34,999 | 7 | 7.9% |
| $35,000 to $49,999 | 13 | 14.6% |
| $50,000 to $74,999 | 58 | 65.2% |
| $75,000 to $99,999 | 5 | 5.6% |
| $100,000 to $149,999 | 0 | 0.0% |
| $150,000 to $199,999 | 0 | 0.0% |
| $200,000+ | 0 | 0.0% |
Household Income by Householder Age in Wawona
The median household income in Wawona is $64,896, with the highest median household income of $62,813 found in the 65+ years age bracket for the primary householder. A total of 31 households (34.8%) fall into this category.
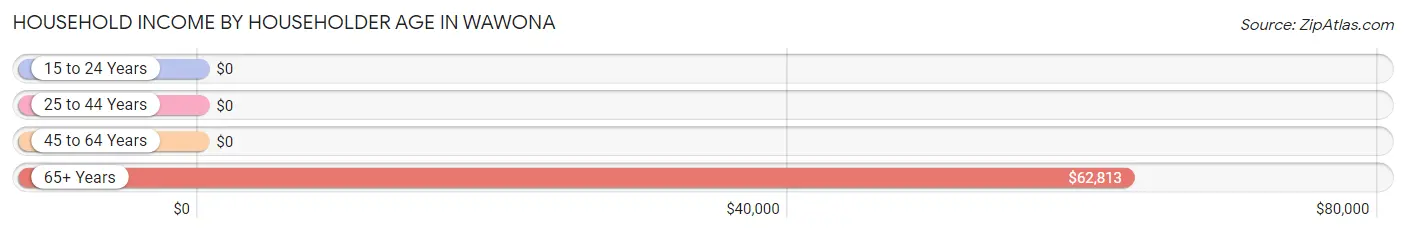
| Income Bracket | # Households | Median Income |
| 15 to 24 Years | 0 (0.0%) | $0 |
| 25 to 44 Years | 45 (50.6%) | $0 |
| 45 to 64 Years | 13 (14.6%) | $0 |
| 65+ Years | 31 (34.8%) | $62,813 |
| Total | 89 (100.0%) | $64,896 |
Poverty in Wawona
Income Below Poverty by Sex and Age in Wawona
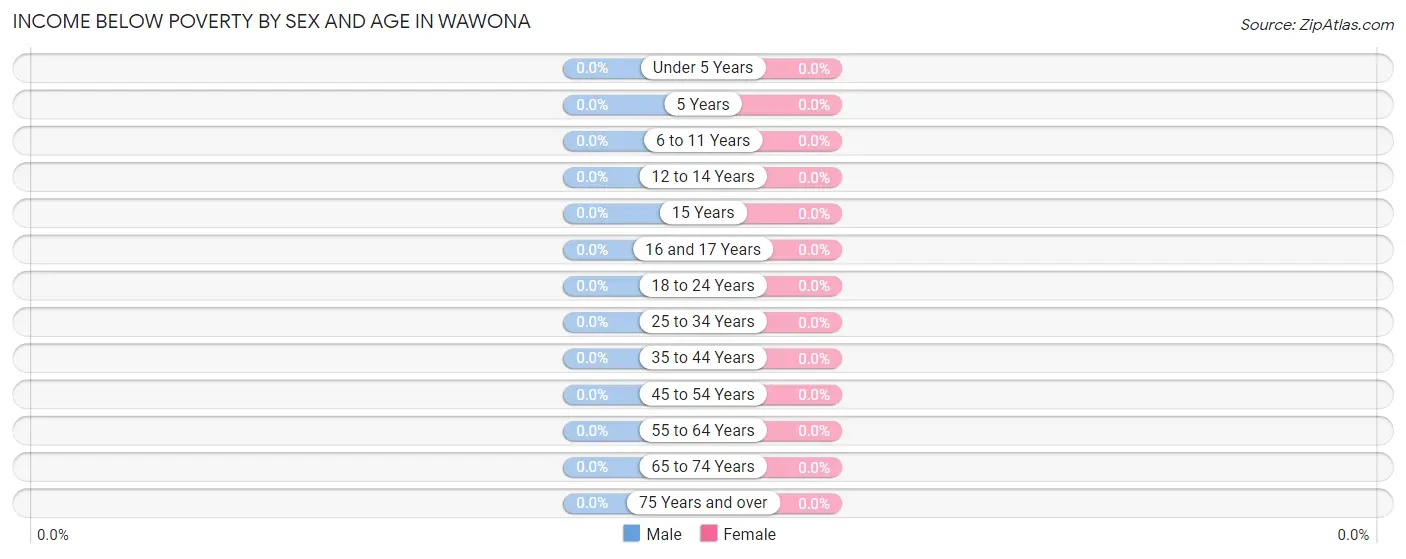
| Age Bracket | Male | Female |
| Under 5 Years | 0 (0.0%) | 0 (0.0%) |
| 5 Years | 0 (0.0%) | 0 (0.0%) |
| 6 to 11 Years | 0 (0.0%) | 0 (0.0%) |
| 12 to 14 Years | 0 (0.0%) | 0 (0.0%) |
| 15 Years | 0 (0.0%) | 0 (0.0%) |
| 16 and 17 Years | 0 (0.0%) | 0 (0.0%) |
| 18 to 24 Years | 0 (0.0%) | 0 (0.0%) |
| 25 to 34 Years | 0 (0.0%) | 0 (0.0%) |
| 35 to 44 Years | 0 (0.0%) | 0 (0.0%) |
| 45 to 54 Years | 0 (0.0%) | 0 (0.0%) |
| 55 to 64 Years | 0 (0.0%) | 0 (0.0%) |
| 65 to 74 Years | 0 (0.0%) | 0 (0.0%) |
| 75 Years and over | 0 (0.0%) | 0 (0.0%) |
| Total | 0 (0.0%) | 0 (0.0%) |
Income Above Poverty by Sex and Age in Wawona
According to the poverty statistics in Wawona, males aged 25 to 34 years and females aged 25 to 34 years are the age groups that are most secure financially, with 100.0% of males and 100.0% of females in these age groups living above the poverty line.
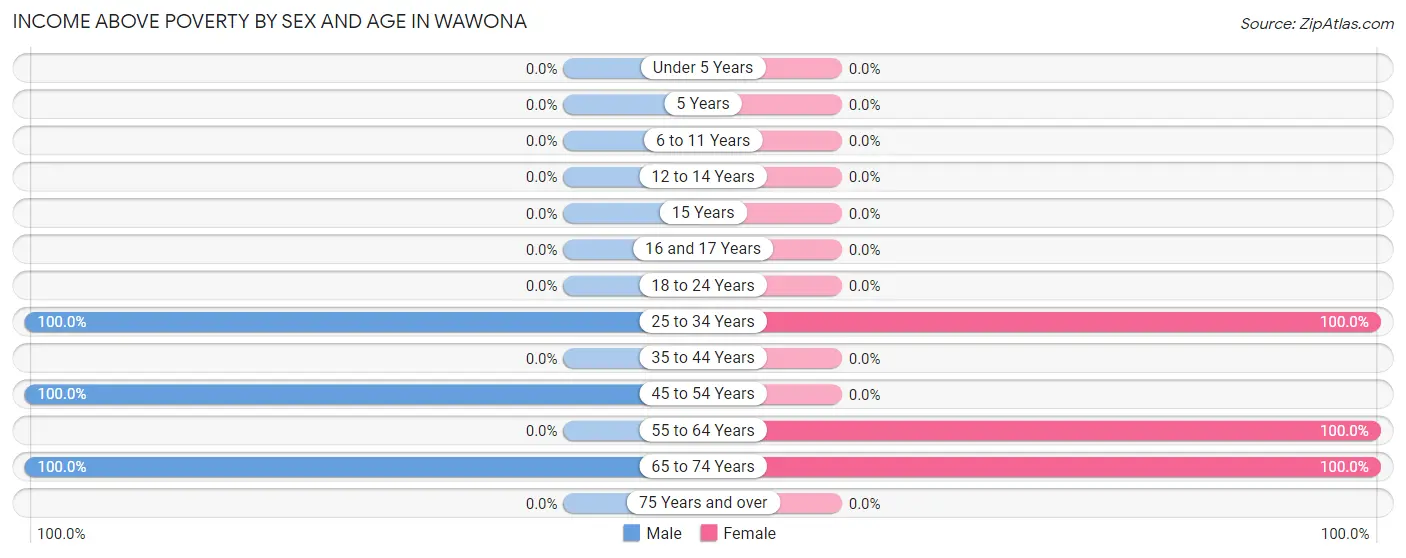
| Age Bracket | Male | Female |
| Under 5 Years | 0 (0.0%) | 0 (0.0%) |
| 5 Years | 0 (0.0%) | 0 (0.0%) |
| 6 to 11 Years | 0 (0.0%) | 0 (0.0%) |
| 12 to 14 Years | 0 (0.0%) | 0 (0.0%) |
| 15 Years | 0 (0.0%) | 0 (0.0%) |
| 16 and 17 Years | 0 (0.0%) | 0 (0.0%) |
| 18 to 24 Years | 0 (0.0%) | 0 (0.0%) |
| 25 to 34 Years | 6 (100.0%) | 39 (100.0%) |
| 35 to 44 Years | 0 (0.0%) | 0 (0.0%) |
| 45 to 54 Years | 13 (100.0%) | 0 (0.0%) |
| 55 to 64 Years | 0 (0.0%) | 6 (100.0%) |
| 65 to 74 Years | 51 (100.0%) | 7 (100.0%) |
| 75 Years and over | 0 (0.0%) | 0 (0.0%) |
| Total | 70 (100.0%) | 52 (100.0%) |
Income Below Poverty Among Married-Couple Families in Wawona
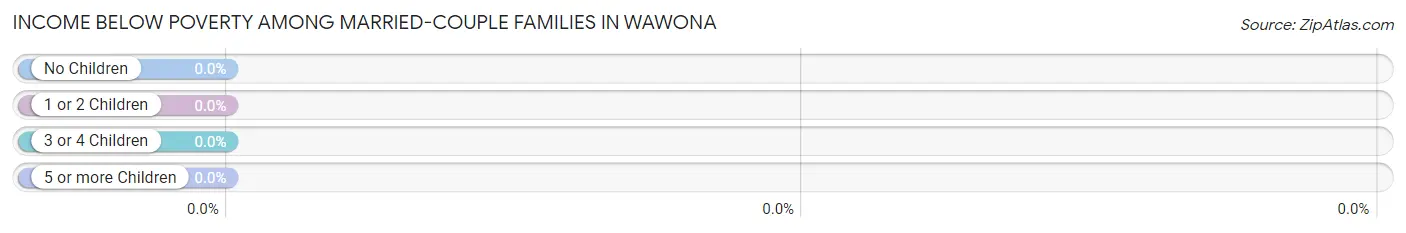
| Children | Above Poverty | Below Poverty |
| No Children | 19 (100.0%) | 0 (0.0%) |
| 1 or 2 Children | 0 (0.0%) | 0 (0.0%) |
| 3 or 4 Children | 0 (0.0%) | 0 (0.0%) |
| 5 or more Children | 0 (0.0%) | 0 (0.0%) |
| Total | 19 (100.0%) | 0 (0.0%) |
Income Below Poverty Among Single-Parent Households in Wawona
| Children | Single Father | Single Mother |
| No Children | 0 (0.0%) | 0 (0.0%) |
| 1 or 2 Children | 0 (0.0%) | 0 (0.0%) |
| 3 or 4 Children | 0 (0.0%) | 0 (0.0%) |
| 5 or more Children | 0 (0.0%) | 0 (0.0%) |
| Total | 0 (0.0%) | 0 (0.0%) |
Income Below Poverty Among Married-Couple vs Single-Parent Households in Wawona
| Children | Married-Couple Families | Single-Parent Households |
| No Children | 0 (0.0%) | 0 (0.0%) |
| 1 or 2 Children | 0 (0.0%) | 0 (0.0%) |
| 3 or 4 Children | 0 (0.0%) | 0 (0.0%) |
| 5 or more Children | 0 (0.0%) | 0 (0.0%) |
| Total | 0 (0.0%) | 0 (0.0%) |
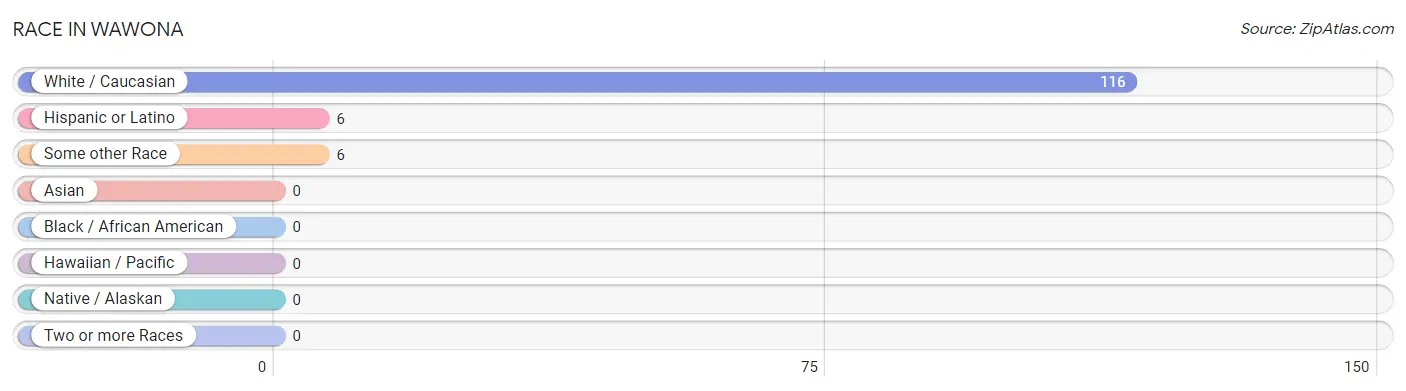
Race in Wawona
The most populous races in Wawona are White / Caucasian (116 | 95.1%), Hispanic or Latino (6 | 4.9%), and Some other Race (6 | 4.9%).
| Race | # Population | % Population |
| Asian | 0 | 0.0% |
| Black / African American | 0 | 0.0% |
| Hawaiian / Pacific | 0 | 0.0% |
| Hispanic or Latino | 6 | 4.9% |
| Native / Alaskan | 0 | 0.0% |
| White / Caucasian | 116 | 95.1% |
| Two or more Races | 0 | 0.0% |
| Some other Race | 6 | 4.9% |
| Total | 122 | 100.0% |
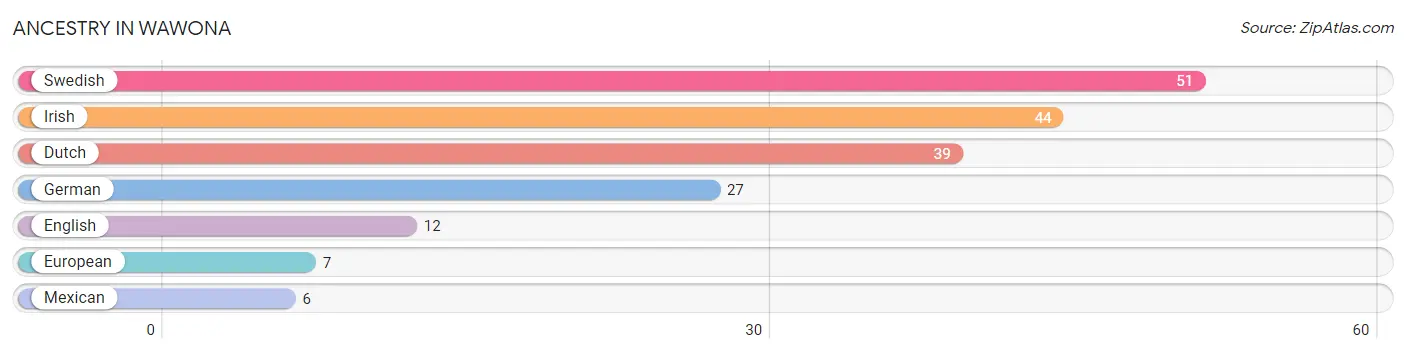
Ancestry in Wawona
The most populous ancestries reported in Wawona are Swedish (51 | 41.8%), Irish (44 | 36.1%), Dutch (39 | 32.0%), German (27 | 22.1%), and English (12 | 9.8%), together accounting for 141.8% of all Wawona residents.
| Ancestry | # Population | % Population |
| Dutch | 39 | 32.0% |
| English | 12 | 9.8% |
| European | 7 | 5.7% |
| German | 27 | 22.1% |
| Irish | 44 | 36.1% |
| Mexican | 6 | 4.9% |
| Swedish | 51 | 41.8% | View All 7 Rows |
Immigrants in Wawona

| Immigration Origin | # Population | % Population | View All 0 Rows |
Sex and Age in Wawona
Sex and Age in Wawona
The most populous age groups in Wawona are 65 to 69 Years (26 | 37.1%) for men and 30 to 34 Years (39 | 75.0%) for women.
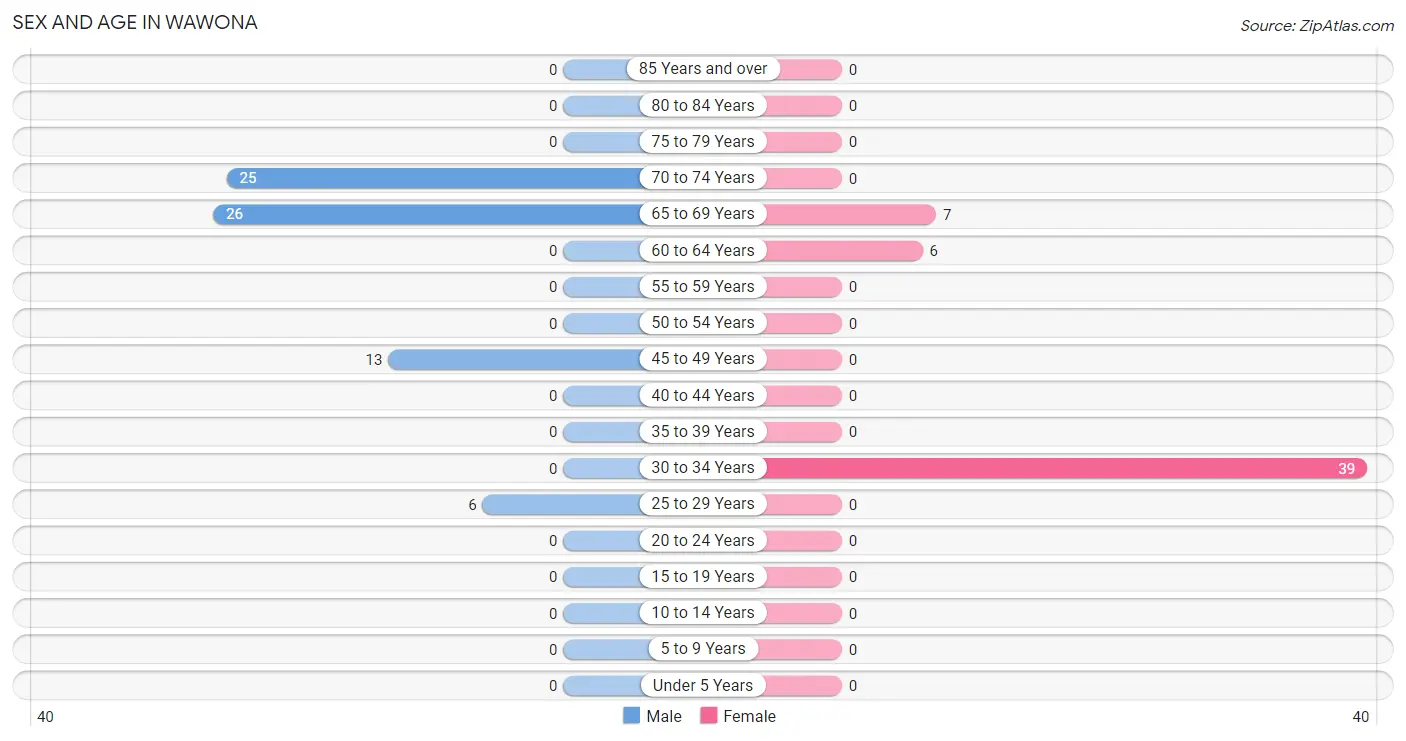
| Age Bracket | Male | Female |
| Under 5 Years | 0 (0.0%) | 0 (0.0%) |
| 5 to 9 Years | 0 (0.0%) | 0 (0.0%) |
| 10 to 14 Years | 0 (0.0%) | 0 (0.0%) |
| 15 to 19 Years | 0 (0.0%) | 0 (0.0%) |
| 20 to 24 Years | 0 (0.0%) | 0 (0.0%) |
| 25 to 29 Years | 6 (8.6%) | 0 (0.0%) |
| 30 to 34 Years | 0 (0.0%) | 39 (75.0%) |
| 35 to 39 Years | 0 (0.0%) | 0 (0.0%) |
| 40 to 44 Years | 0 (0.0%) | 0 (0.0%) |
| 45 to 49 Years | 13 (18.6%) | 0 (0.0%) |
| 50 to 54 Years | 0 (0.0%) | 0 (0.0%) |
| 55 to 59 Years | 0 (0.0%) | 0 (0.0%) |
| 60 to 64 Years | 0 (0.0%) | 6 (11.5%) |
| 65 to 69 Years | 26 (37.1%) | 7 (13.5%) |
| 70 to 74 Years | 25 (35.7%) | 0 (0.0%) |
| 75 to 79 Years | 0 (0.0%) | 0 (0.0%) |
| 80 to 84 Years | 0 (0.0%) | 0 (0.0%) |
| 85 Years and over | 0 (0.0%) | 0 (0.0%) |
| Total | 70 (100.0%) | 52 (100.0%) |
Families and Households in Wawona
Median Family Size in Wawona
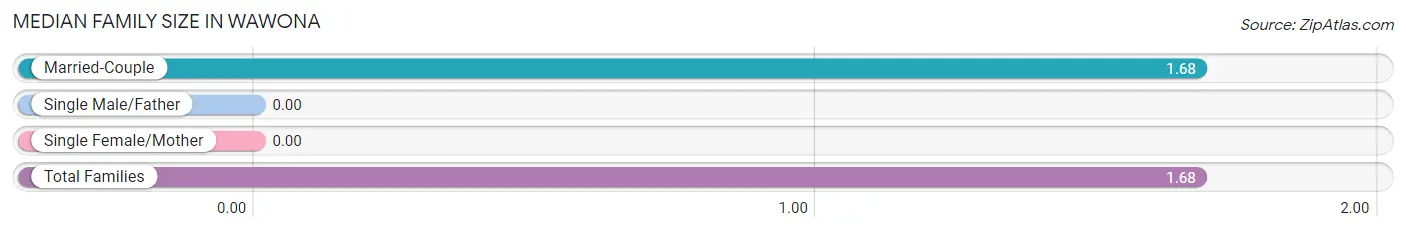
| Family Type | # Families | Family Size |
| Married-Couple | 19 (100.0%) | 1.68 |
| Single Male/Father | 0 (0.0%) | - |
| Single Female/Mother | 0 (0.0%) | - |
| Total Families | 19 (100.0%) | 1.68 |
Median Household Size in Wawona
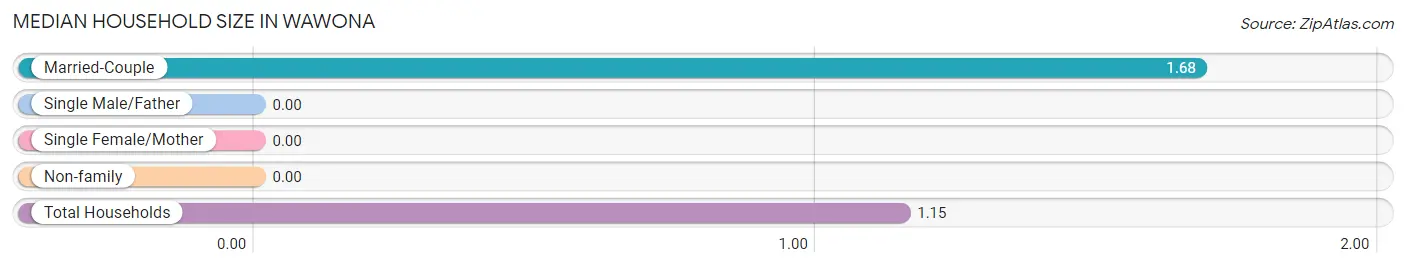
| Household Type | # Households | Household Size |
| Married-Couple | 19 (21.3%) | 1.68 |
| Single Male/Father | 0 (0.0%) | - |
| Single Female/Mother | 0 (0.0%) | - |
| Non-family | 70 (78.6%) | - |
| Total Households | 89 (100.0%) | 1.15 |
Household Size by Marriage Status in Wawona
Out of a total of 89 households in Wawona, 19 (21.3%) are family households, while 70 (78.6%) are nonfamily households. The most numerous type of family households are 2-person households, comprising 19, and the most common type of nonfamily households are 1-person households, comprising 70.
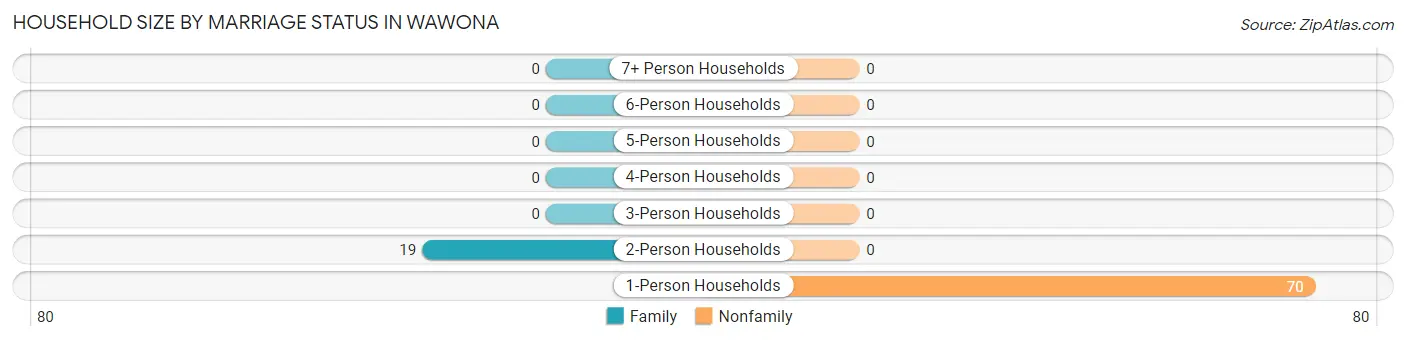
| Household Size | Family Households | Nonfamily Households |
| 1-Person Households | - | 70 (78.6%) |
| 2-Person Households | 19 (21.3%) | 0 (0.0%) |
| 3-Person Households | 0 (0.0%) | 0 (0.0%) |
| 4-Person Households | 0 (0.0%) | 0 (0.0%) |
| 5-Person Households | 0 (0.0%) | 0 (0.0%) |
| 6-Person Households | 0 (0.0%) | 0 (0.0%) |
| 7+ Person Households | 0 (0.0%) | 0 (0.0%) |
| Total | 19 (21.3%) | 70 (78.6%) |
Female Fertility in Wawona
Fertility by Age in Wawona
| Age Bracket | Women with Births | Births / 1,000 Women |
| 15 to 19 years | 0 (0.0%) | 0.0 |
| 20 to 34 years | 0 (0.0%) | 0.0 |
| 35 to 50 years | 0 (0.0%) | 0.0 |
| Total | 0 (0.0%) | 0.0 |
Fertility by Age by Marriage Status in Wawona
| Age Bracket | Married | Unmarried |
| 15 to 19 years | 0 (0.0%) | 0 (0.0%) |
| 20 to 34 years | 0 (0.0%) | 0 (0.0%) |
| 35 to 50 years | 0 (0.0%) | 0 (0.0%) |
| Total | 0 (0.0%) | 0 (0.0%) |
Fertility by Education in Wawona
| Educational Attainment | Women with Births | Births / 1,000 Women |
| Less than High School | 0 (0.0%) | 0.0 |
| High School Diploma | 0 (0.0%) | 0.0 |
| College or Associate's Degree | 0 (0.0%) | 0.0 |
| Bachelor's Degree | 0 (0.0%) | 0.0 |
| Graduate Degree | 0 (0.0%) | 0.0 |
| Total | 0 (0.0%) | 0.0 |
Fertility by Education by Marriage Status in Wawona
| Educational Attainment | Married | Unmarried |
| Less than High School | 0 (0.0%) | 0 (0.0%) |
| High School Diploma | 0 (0.0%) | 0 (0.0%) |
| College or Associate's Degree | 0 (0.0%) | 0 (0.0%) |
| Bachelor's Degree | 0 (0.0%) | 0 (0.0%) |
| Graduate Degree | 0 (0.0%) | 0 (0.0%) |
| Total | 0 (0.0%) | 0 (0.0%) |
Employment Characteristics in Wawona
Employment by Class of Employer in Wawona
Among the 83 employed individuals in Wawona, private company employees (44 | 53.0%), and federal government employees (39 | 47.0%) make up the most common classes of employment.
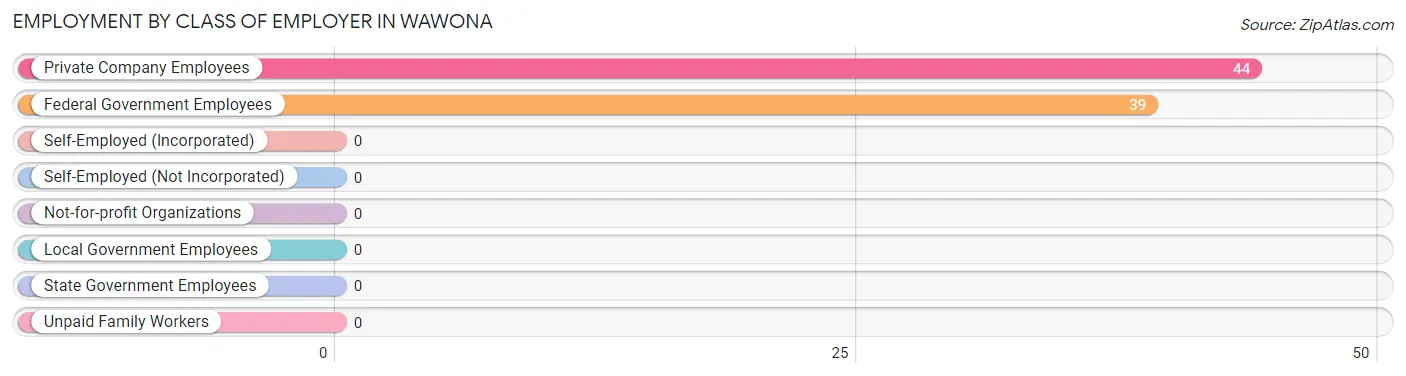
| Employer Class | # Employees | % Employees |
| Private Company Employees | 44 | 53.0% |
| Self-Employed (Incorporated) | 0 | 0.0% |
| Self-Employed (Not Incorporated) | 0 | 0.0% |
| Not-for-profit Organizations | 0 | 0.0% |
| Local Government Employees | 0 | 0.0% |
| State Government Employees | 0 | 0.0% |
| Federal Government Employees | 39 | 47.0% |
| Unpaid Family Workers | 0 | 0.0% |
| Total | 83 | 100.0% |
Employment Status by Age in Wawona
According to the labor force statistics for Wawona, out of the total population over 16 years of age (122), 73.0% or 89 individuals are in the labor force, with 6.7% or 6 of them unemployed. The age group with the highest labor force participation rate is 25 to 29 years, with 100.0% or 6 individuals in the labor force. Within the labor force, the 60 to 64 years age range has the highest percentage of unemployed individuals, with 100.0% or 6 of them being unemployed.
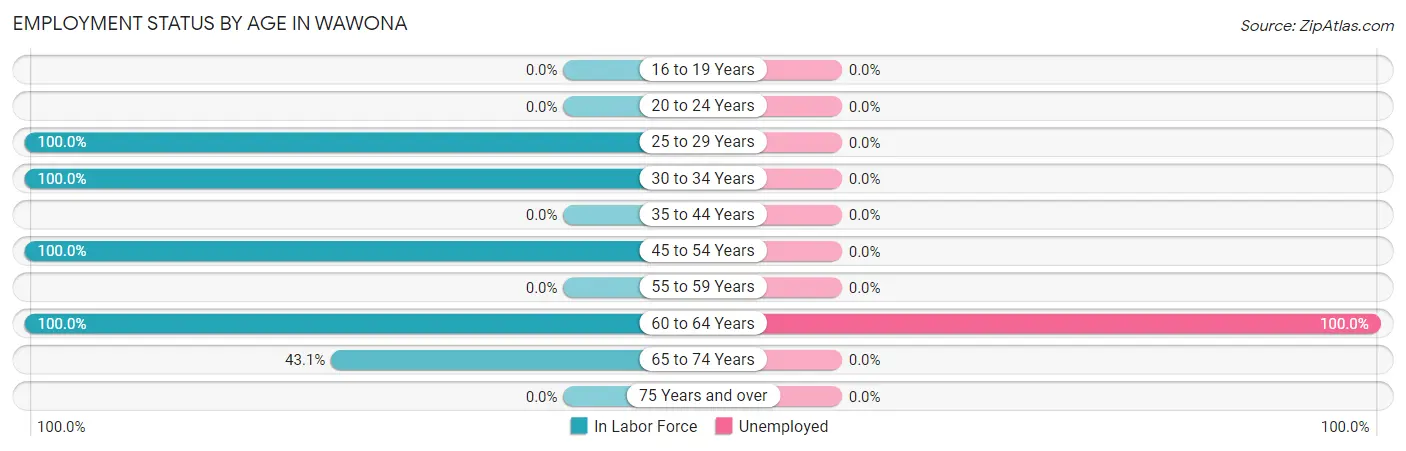
| Age Bracket | In Labor Force | Unemployed |
| 16 to 19 Years | 0 (0.0%) | 0 (0.0%) |
| 20 to 24 Years | 0 (0.0%) | 0 (0.0%) |
| 25 to 29 Years | 6 (100.0%) | 0 (0.0%) |
| 30 to 34 Years | 39 (100.0%) | 0 (0.0%) |
| 35 to 44 Years | 0 (0.0%) | 0 (0.0%) |
| 45 to 54 Years | 13 (100.0%) | 0 (0.0%) |
| 55 to 59 Years | 0 (0.0%) | 0 (0.0%) |
| 60 to 64 Years | 6 (100.0%) | 6 (100.0%) |
| 65 to 74 Years | 25 (43.1%) | 0 (0.0%) |
| 75 Years and over | 0 (0.0%) | 0 (0.0%) |
| Total | 89 (73.0%) | 6 (6.7%) |
Employment Status by Educational Attainment in Wawona
According to labor force statistics for Wawona, 100.0% of individuals (64) out of the total population between 25 and 64 years of age (64) are in the labor force, with 9.4% or 6 of them being unemployed. The group with the highest labor force participation rate are those with the educational attainment of high school diploma, with 100.0% or 19 individuals in the labor force. Within the labor force, individuals with high school diploma education have the highest percentage of unemployment, with 31.6% or 6 of them being unemployed.
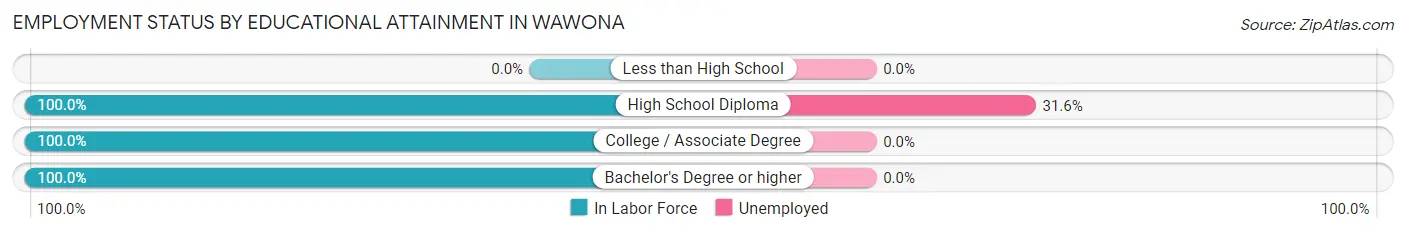
| Educational Attainment | In Labor Force | Unemployed |
| Less than High School | 0 (0.0%) | 0 (0.0%) |
| High School Diploma | 19 (100.0%) | 6 (31.6%) |
| College / Associate Degree | 6 (100.0%) | 0 (0.0%) |
| Bachelor's Degree or higher | 39 (100.0%) | 0 (0.0%) |
| Total | 64 (100.0%) | 6 (9.4%) |
Employment Occupations by Sex in Wawona
Management, Business, Science and Arts Occupations
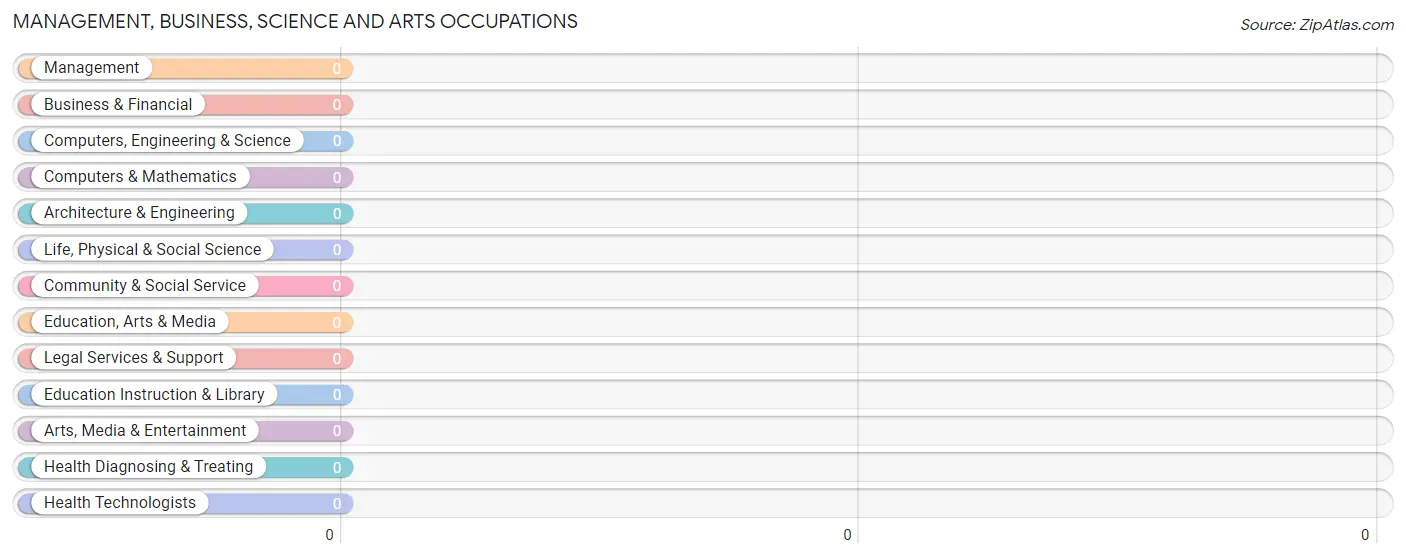
Management, Business, Science and Arts Occupations by Sex
| Occupation | Male | Female |
| Management | 0 (0.0%) | 0 (0.0%) |
| Business & Financial | 0 (0.0%) | 0 (0.0%) |
| Computers, Engineering & Science | 0 (0.0%) | 0 (0.0%) |
| Computers & Mathematics | 0 (0.0%) | 0 (0.0%) |
| Architecture & Engineering | 0 (0.0%) | 0 (0.0%) |
| Life, Physical & Social Science | 0 (0.0%) | 0 (0.0%) |
| Community & Social Service | 0 (0.0%) | 0 (0.0%) |
| Education, Arts & Media | 0 (0.0%) | 0 (0.0%) |
| Legal Services & Support | 0 (0.0%) | 0 (0.0%) |
| Education Instruction & Library | 0 (0.0%) | 0 (0.0%) |
| Arts, Media & Entertainment | 0 (0.0%) | 0 (0.0%) |
| Health Diagnosing & Treating | 0 (0.0%) | 0 (0.0%) |
| Health Technologists | 0 (0.0%) | 0 (0.0%) |
| Total (Category) | 0 (0.0%) | 0 (0.0%) |
| Total (Overall) | 44 (53.0%) | 39 (47.0%) |
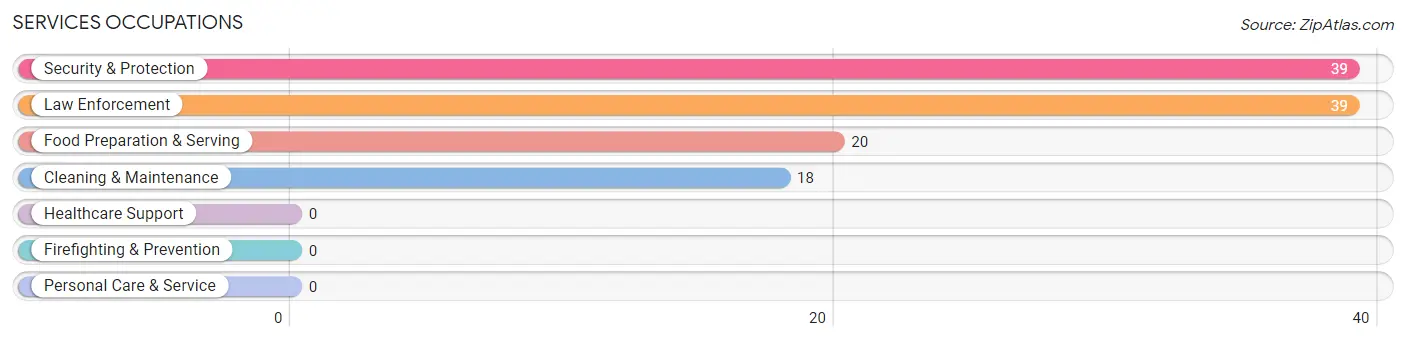
Services Occupations
The most common Services occupations in Wawona are Security & Protection (39 | 47.0%), Law Enforcement (39 | 47.0%), Food Preparation & Serving (20 | 24.1%), and Cleaning & Maintenance (18 | 21.7%).
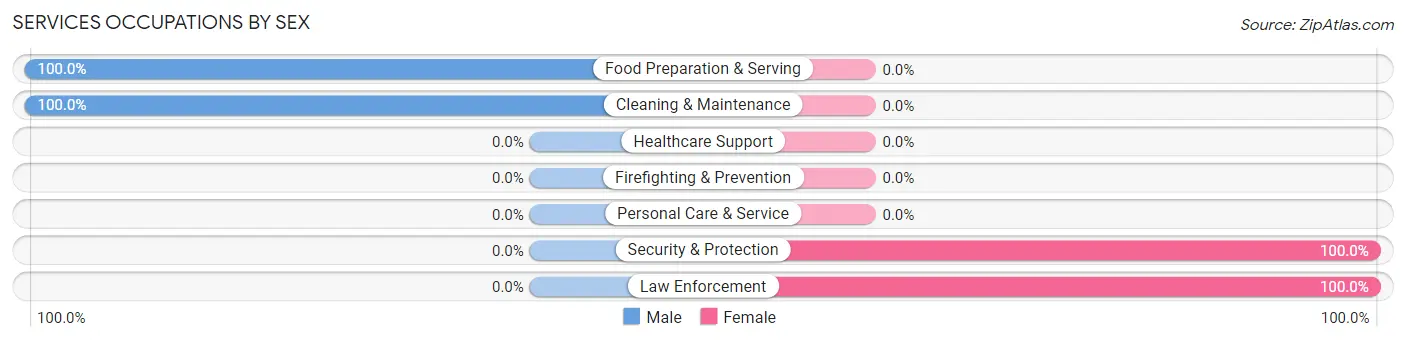
Services Occupations by Sex
Within the Services occupations in Wawona, the most male-oriented occupations are Food Preparation & Serving (100.0%), and Cleaning & Maintenance (100.0%), while the most female-oriented occupations are Security & Protection (100.0%), and Law Enforcement (100.0%).
| Occupation | Male | Female |
| Healthcare Support | 0 (0.0%) | 0 (0.0%) |
| Security & Protection | 0 (0.0%) | 39 (100.0%) |
| Firefighting & Prevention | 0 (0.0%) | 0 (0.0%) |
| Law Enforcement | 0 (0.0%) | 39 (100.0%) |
| Food Preparation & Serving | 20 (100.0%) | 0 (0.0%) |
| Cleaning & Maintenance | 18 (100.0%) | 0 (0.0%) |
| Personal Care & Service | 0 (0.0%) | 0 (0.0%) |
| Total (Category) | 38 (49.3%) | 39 (50.6%) |
| Total (Overall) | 44 (53.0%) | 39 (47.0%) |
Sales and Office Occupations
Sales and Office Occupations by Sex
| Occupation | Male | Female |
| Sales & Related | 0 (0.0%) | 0 (0.0%) |
| Office & Administration | 0 (0.0%) | 0 (0.0%) |
| Total (Category) | 0 (0.0%) | 0 (0.0%) |
| Total (Overall) | 44 (53.0%) | 39 (47.0%) |
Natural Resources, Construction and Maintenance Occupations
Natural Resources, Construction and Maintenance Occupations by Sex
| Occupation | Male | Female |
| Farming, Fishing & Forestry | 0 (0.0%) | 0 (0.0%) |
| Construction & Extraction | 0 (0.0%) | 0 (0.0%) |
| Installation, Maintenance & Repair | 0 (0.0%) | 0 (0.0%) |
| Total (Category) | 0 (0.0%) | 0 (0.0%) |
| Total (Overall) | 44 (53.0%) | 39 (47.0%) |
Production, Transportation and Moving Occupations
The most common Production, Transportation and Moving occupations in Wawona are , and Material Moving (6 | 7.2%).
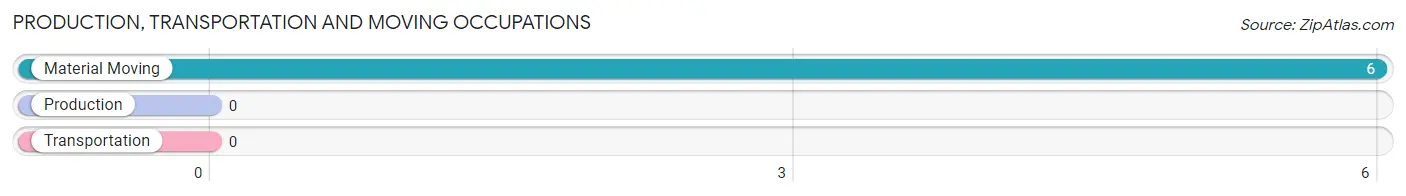
Production, Transportation and Moving Occupations by Sex
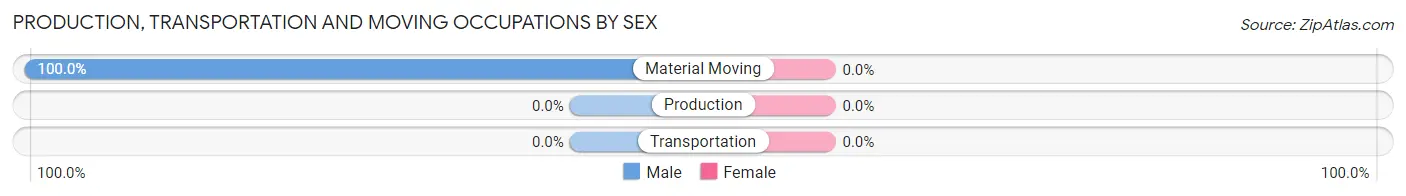
| Occupation | Male | Female |
| Production | 0 (0.0%) | 0 (0.0%) |
| Transportation | 0 (0.0%) | 0 (0.0%) |
| Material Moving | 6 (100.0%) | 0 (0.0%) |
| Total (Category) | 6 (100.0%) | 0 (0.0%) |
| Total (Overall) | 44 (53.0%) | 39 (47.0%) |
Employment Industries by Sex in Wawona
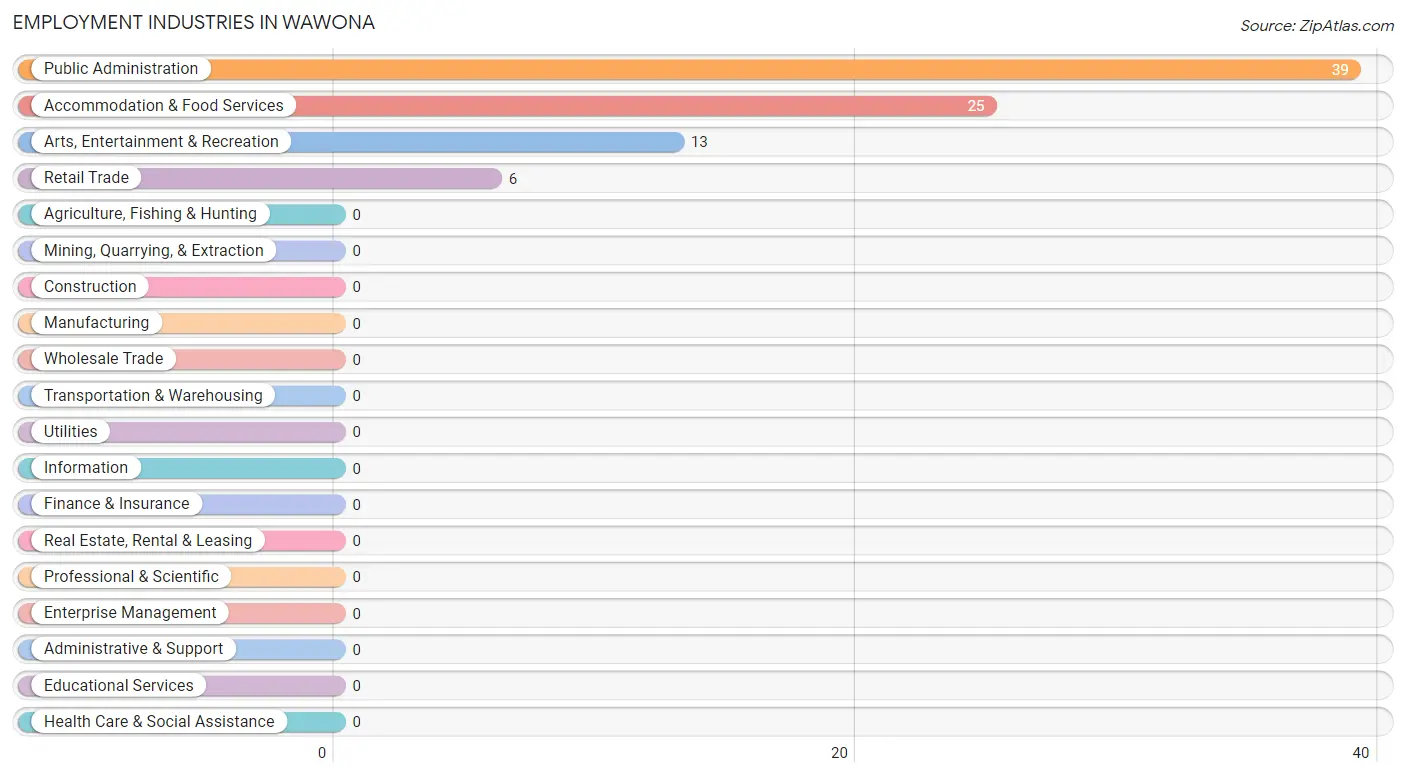
Employment Industries in Wawona
The major employment industries in Wawona include Public Administration (39 | 47.0%), Accommodation & Food Services (25 | 30.1%), Arts, Entertainment & Recreation (13 | 15.7%), and Retail Trade (6 | 7.2%).
Employment Industries by Sex in Wawona
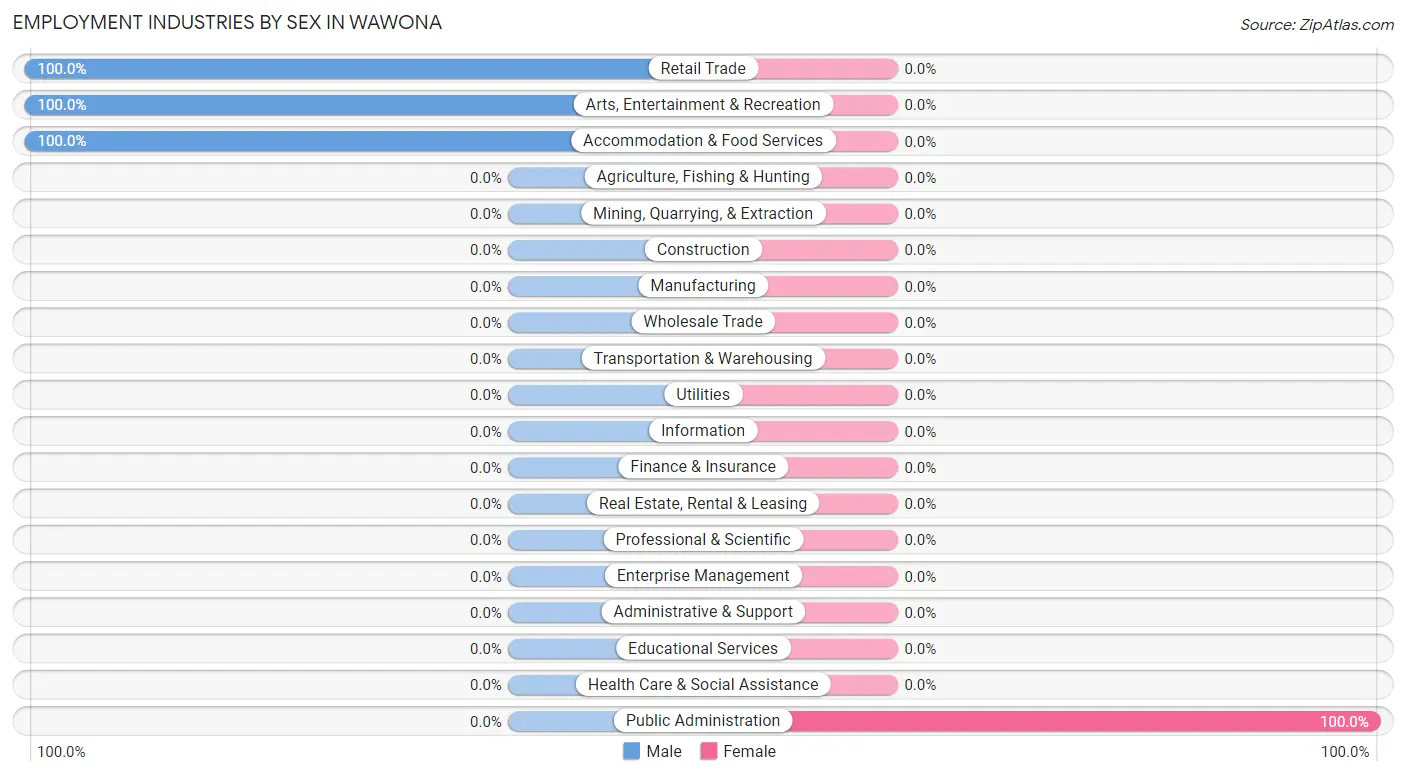
| Industry | Male | Female |
| Agriculture, Fishing & Hunting | 0 (0.0%) | 0 (0.0%) |
| Mining, Quarrying, & Extraction | 0 (0.0%) | 0 (0.0%) |
| Construction | 0 (0.0%) | 0 (0.0%) |
| Manufacturing | 0 (0.0%) | 0 (0.0%) |
| Wholesale Trade | 0 (0.0%) | 0 (0.0%) |
| Retail Trade | 6 (100.0%) | 0 (0.0%) |
| Transportation & Warehousing | 0 (0.0%) | 0 (0.0%) |
| Utilities | 0 (0.0%) | 0 (0.0%) |
| Information | 0 (0.0%) | 0 (0.0%) |
| Finance & Insurance | 0 (0.0%) | 0 (0.0%) |
| Real Estate, Rental & Leasing | 0 (0.0%) | 0 (0.0%) |
| Professional & Scientific | 0 (0.0%) | 0 (0.0%) |
| Enterprise Management | 0 (0.0%) | 0 (0.0%) |
| Administrative & Support | 0 (0.0%) | 0 (0.0%) |
| Educational Services | 0 (0.0%) | 0 (0.0%) |
| Health Care & Social Assistance | 0 (0.0%) | 0 (0.0%) |
| Arts, Entertainment & Recreation | 13 (100.0%) | 0 (0.0%) |
| Accommodation & Food Services | 25 (100.0%) | 0 (0.0%) |
| Public Administration | 0 (0.0%) | 39 (100.0%) |
| Total | 44 (53.0%) | 39 (47.0%) |
Education in Wawona
School Enrollment in Wawona
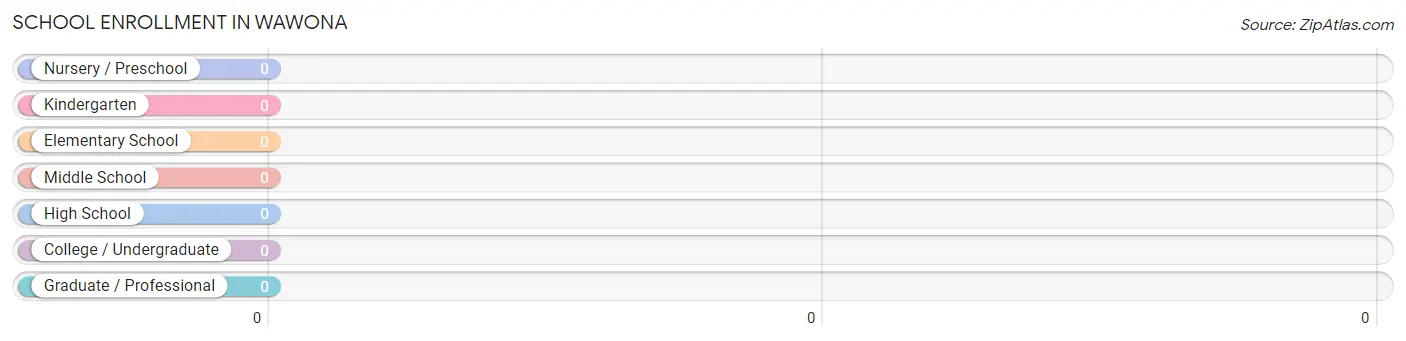
| School Level | # Students | % Students |
| Nursery / Preschool | 0 | 0.0% |
| Kindergarten | 0 | 0.0% |
| Elementary School | 0 | 0.0% |
| Middle School | 0 | 0.0% |
| High School | 0 | 0.0% |
| College / Undergraduate | 0 | 0.0% |
| Graduate / Professional | 0 | 0.0% |
| Total | 0 | 0.0% |
School Enrollment by Age by Funding Source in Wawona
| Age Bracket | Public School | Private School |
| 3 to 4 Year Olds | 0 (0.0%) | 0 (0.0%) |
| 5 to 9 Year Old | 0 (0.0%) | 0 (0.0%) |
| 10 to 14 Year Olds | 0 (0.0%) | 0 (0.0%) |
| 15 to 17 Year Olds | 0 (0.0%) | 0 (0.0%) |
| 18 to 19 Year Olds | 0 (0.0%) | 0 (0.0%) |
| 20 to 24 Year Olds | 0 (0.0%) | 0 (0.0%) |
| 25 to 34 Year Olds | 0 (0.0%) | 0 (0.0%) |
| 35 Years and over | 0 (0.0%) | 0 (0.0%) |
| Total | 0 (0.0%) | 0 (0.0%) |
Educational Attainment by Field of Study in Wawona
Science & technology (39 | 43.3%), arts & humanities (39 | 43.3%), and bio, nature & agricultural (12 | 13.3%) are the most common fields of study among 90 individuals in Wawona who have obtained a bachelor's degree or higher.
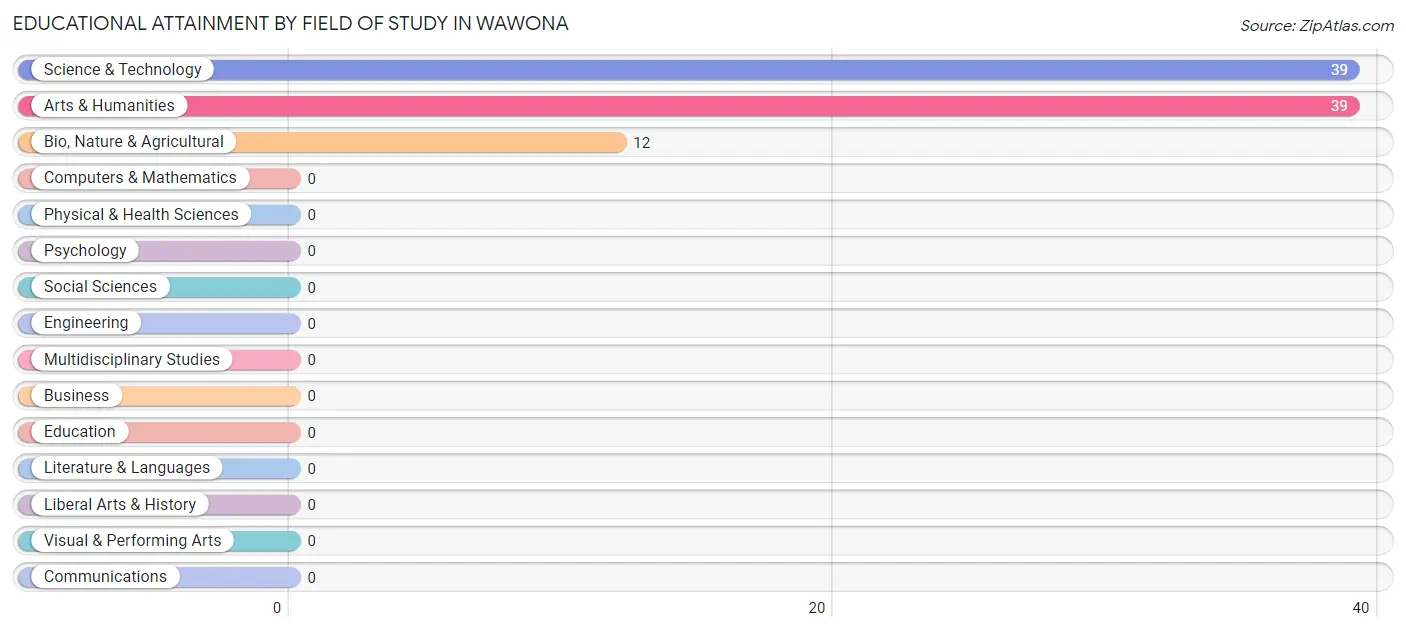
| Field of Study | # Graduates | % Graduates |
| Computers & Mathematics | 0 | 0.0% |
| Bio, Nature & Agricultural | 12 | 13.3% |
| Physical & Health Sciences | 0 | 0.0% |
| Psychology | 0 | 0.0% |
| Social Sciences | 0 | 0.0% |
| Engineering | 0 | 0.0% |
| Multidisciplinary Studies | 0 | 0.0% |
| Science & Technology | 39 | 43.3% |
| Business | 0 | 0.0% |
| Education | 0 | 0.0% |
| Literature & Languages | 0 | 0.0% |
| Liberal Arts & History | 0 | 0.0% |
| Visual & Performing Arts | 0 | 0.0% |
| Communications | 0 | 0.0% |
| Arts & Humanities | 39 | 43.3% |
| Total | 90 | 100.0% |
Transportation & Commute in Wawona
Vehicle Availability by Sex in Wawona
The most prevalent vehicle ownership categories in Wawona are males with 2 vehicles (13, accounting for 54.2%) and females with 2 vehicles (0, making up 33.3%).
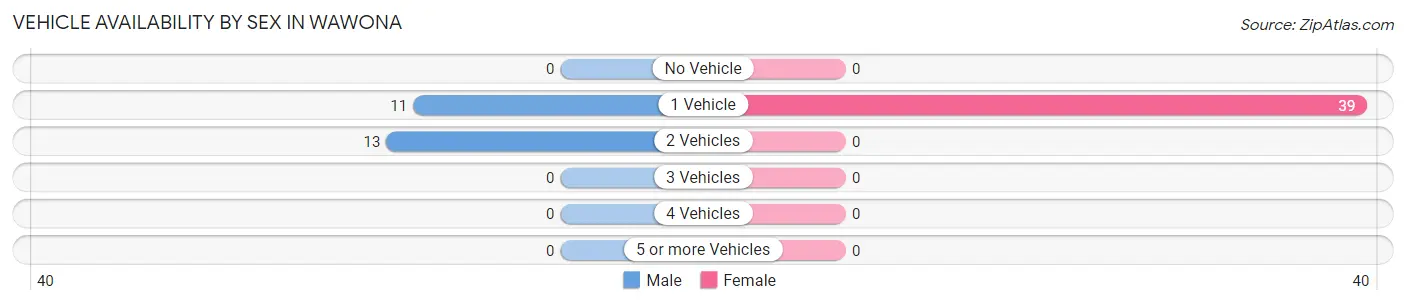
| Vehicles Available | Male | Female |
| No Vehicle | 0 (0.0%) | 0 (0.0%) |
| 1 Vehicle | 11 (45.8%) | 39 (100.0%) |
| 2 Vehicles | 13 (54.2%) | 0 (0.0%) |
| 3 Vehicles | 0 (0.0%) | 0 (0.0%) |
| 4 Vehicles | 0 (0.0%) | 0 (0.0%) |
| 5 or more Vehicles | 0 (0.0%) | 0 (0.0%) |
| Total | 24 (100.0%) | 39 (100.0%) |
Commute Time in Wawona
The most frequently occuring commute durations in Wawona are 5 to 9 minutes (39 commuters, 47.0%), 45 to 59 minutes (20 commuters, 24.1%), and 10 to 14 minutes (18 commuters, 21.7%).
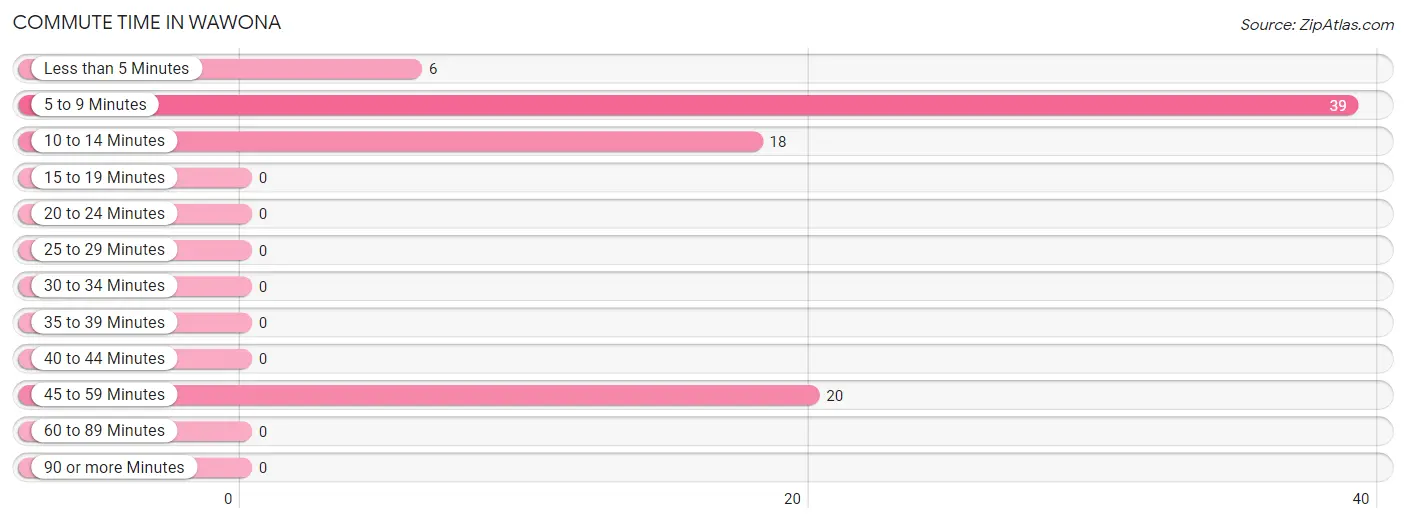
| Commute Time | # Commuters | % Commuters |
| Less than 5 Minutes | 6 | 7.2% |
| 5 to 9 Minutes | 39 | 47.0% |
| 10 to 14 Minutes | 18 | 21.7% |
| 15 to 19 Minutes | 0 | 0.0% |
| 20 to 24 Minutes | 0 | 0.0% |
| 25 to 29 Minutes | 0 | 0.0% |
| 30 to 34 Minutes | 0 | 0.0% |
| 35 to 39 Minutes | 0 | 0.0% |
| 40 to 44 Minutes | 0 | 0.0% |
| 45 to 59 Minutes | 20 | 24.1% |
| 60 to 89 Minutes | 0 | 0.0% |
| 90 or more Minutes | 0 | 0.0% |
Commute Time by Sex in Wawona
The most common commute times in Wawona are 45 to 59 minutes (20 commuters, 45.5%) for males and 5 to 9 minutes (39 commuters, 100.0%) for females.
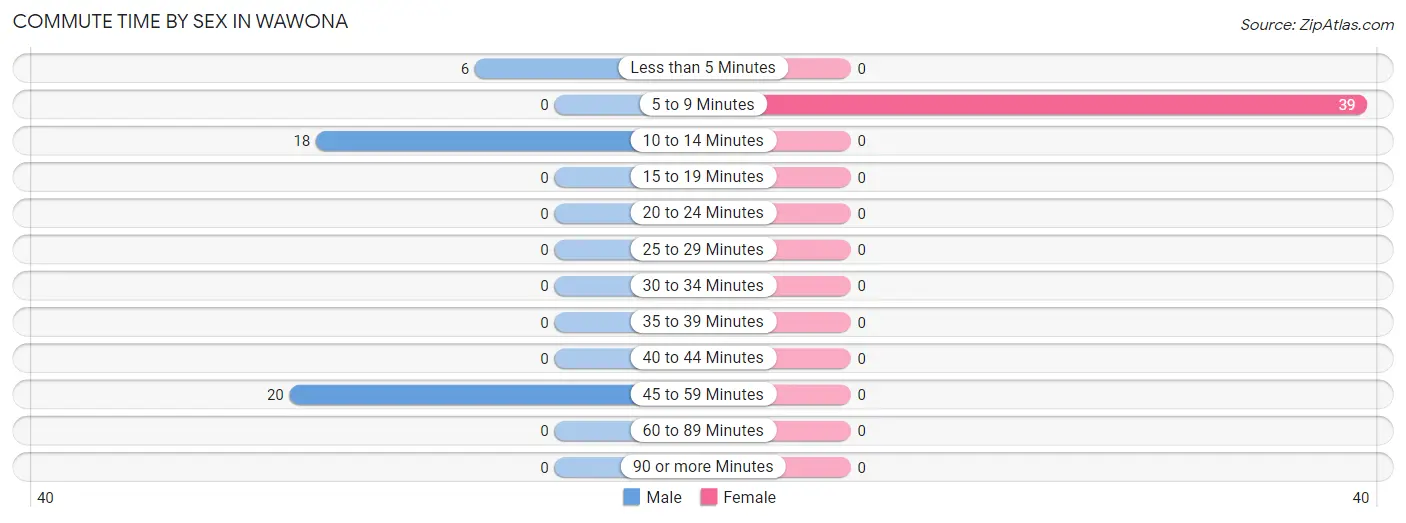
| Commute Time | Male | Female |
| Less than 5 Minutes | 6 (13.6%) | 0 (0.0%) |
| 5 to 9 Minutes | 0 (0.0%) | 39 (100.0%) |
| 10 to 14 Minutes | 18 (40.9%) | 0 (0.0%) |
| 15 to 19 Minutes | 0 (0.0%) | 0 (0.0%) |
| 20 to 24 Minutes | 0 (0.0%) | 0 (0.0%) |
| 25 to 29 Minutes | 0 (0.0%) | 0 (0.0%) |
| 30 to 34 Minutes | 0 (0.0%) | 0 (0.0%) |
| 35 to 39 Minutes | 0 (0.0%) | 0 (0.0%) |
| 40 to 44 Minutes | 0 (0.0%) | 0 (0.0%) |
| 45 to 59 Minutes | 20 (45.5%) | 0 (0.0%) |
| 60 to 89 Minutes | 0 (0.0%) | 0 (0.0%) |
| 90 or more Minutes | 0 (0.0%) | 0 (0.0%) |
Time of Departure to Work by Sex in Wawona
The most frequent times of departure to work in Wawona are 5:30 AM to 5:59 AM (20, 45.5%) for males and 7:00 AM to 7:29 AM (39, 100.0%) for females.
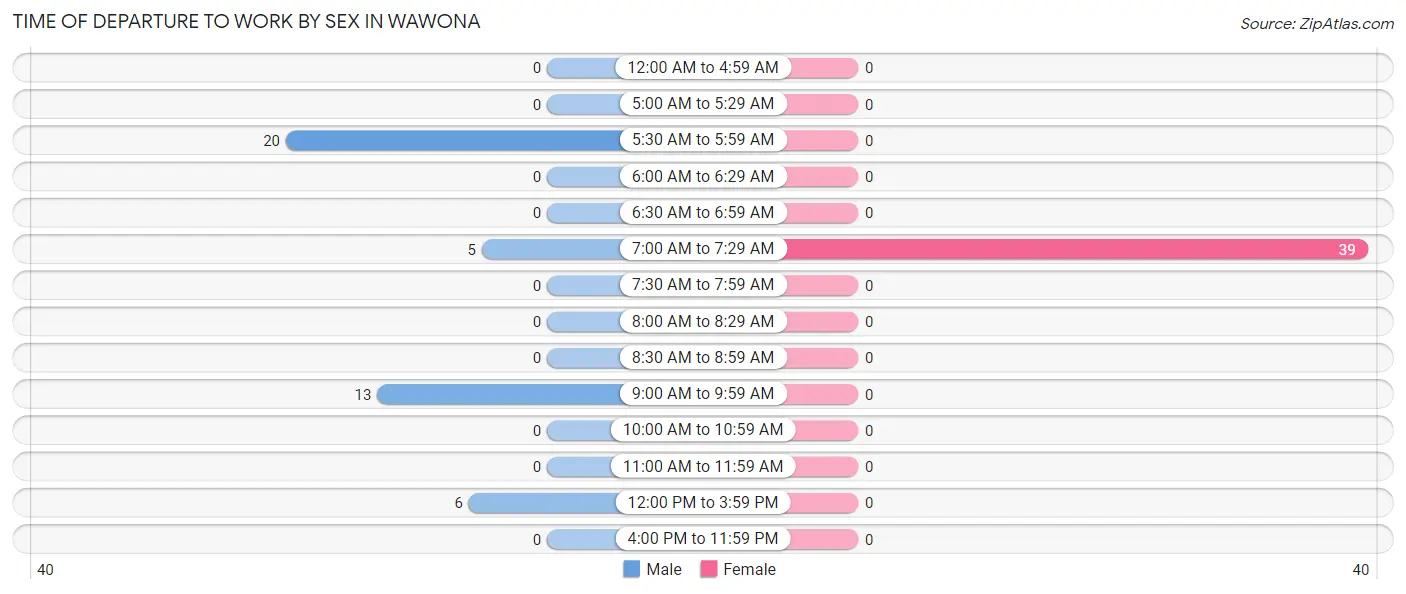
| Time of Departure | Male | Female |
| 12:00 AM to 4:59 AM | 0 (0.0%) | 0 (0.0%) |
| 5:00 AM to 5:29 AM | 0 (0.0%) | 0 (0.0%) |
| 5:30 AM to 5:59 AM | 20 (45.5%) | 0 (0.0%) |
| 6:00 AM to 6:29 AM | 0 (0.0%) | 0 (0.0%) |
| 6:30 AM to 6:59 AM | 0 (0.0%) | 0 (0.0%) |
| 7:00 AM to 7:29 AM | 5 (11.4%) | 39 (100.0%) |
| 7:30 AM to 7:59 AM | 0 (0.0%) | 0 (0.0%) |
| 8:00 AM to 8:29 AM | 0 (0.0%) | 0 (0.0%) |
| 8:30 AM to 8:59 AM | 0 (0.0%) | 0 (0.0%) |
| 9:00 AM to 9:59 AM | 13 (29.5%) | 0 (0.0%) |
| 10:00 AM to 10:59 AM | 0 (0.0%) | 0 (0.0%) |
| 11:00 AM to 11:59 AM | 0 (0.0%) | 0 (0.0%) |
| 12:00 PM to 3:59 PM | 6 (13.6%) | 0 (0.0%) |
| 4:00 PM to 11:59 PM | 0 (0.0%) | 0 (0.0%) |
| Total | 44 (100.0%) | 39 (100.0%) |
Housing Occupancy in Wawona
Occupancy by Ownership in Wawona
Of the total 89 dwellings in Wawona, owner-occupied units account for 12 (13.5%), while renter-occupied units make up 77 (86.5%).
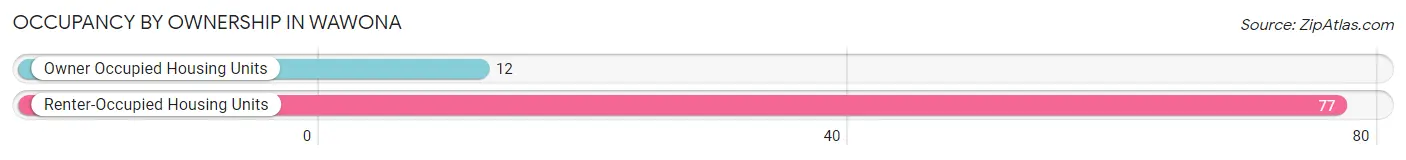
| Occupancy | # Housing Units | % Housing Units |
| Owner Occupied Housing Units | 12 | 13.5% |
| Renter-Occupied Housing Units | 77 | 86.5% |
| Total Occupied Housing Units | 89 | 100.0% |
Occupancy by Household Size in Wawona
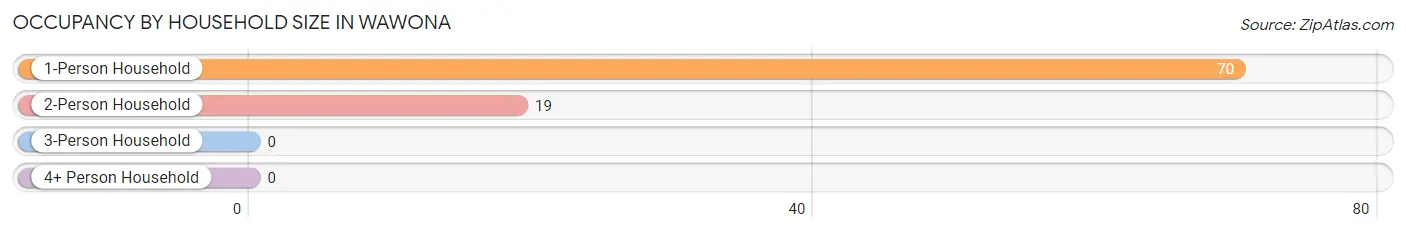
| Household Size | # Housing Units | % Housing Units |
| 1-Person Household | 70 | 78.6% |
| 2-Person Household | 19 | 21.3% |
| 3-Person Household | 0 | 0.0% |
| 4+ Person Household | 0 | 0.0% |
| Total Housing Units | 89 | 100.0% |
Occupancy by Ownership by Household Size in Wawona
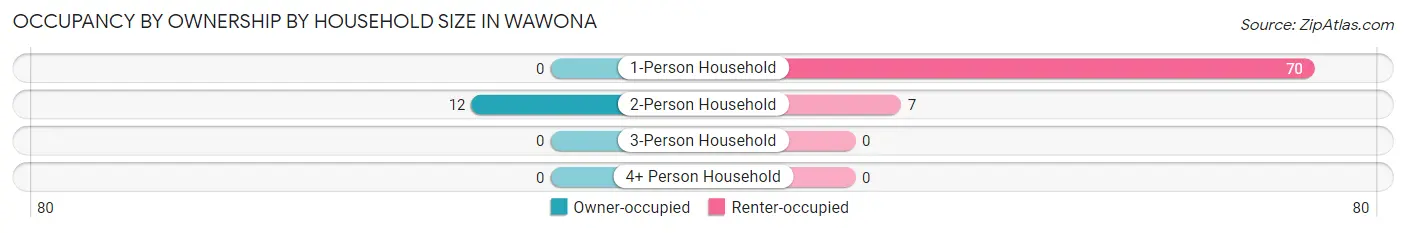
| Household Size | Owner-occupied | Renter-occupied |
| 1-Person Household | 0 (0.0%) | 70 (100.0%) |
| 2-Person Household | 12 (63.2%) | 7 (36.8%) |
| 3-Person Household | 0 (0.0%) | 0 (0.0%) |
| 4+ Person Household | 0 (0.0%) | 0 (0.0%) |
| Total Housing Units | 12 (13.5%) | 77 (86.5%) |
Occupancy by Educational Attainment in Wawona
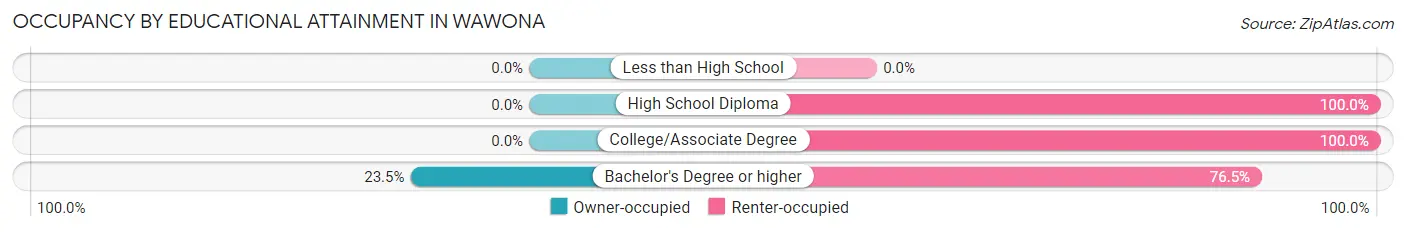
| Household Size | Owner-occupied | Renter-occupied |
| Less than High School | 0 (0.0%) | 0 (0.0%) |
| High School Diploma | 0 (0.0%) | 13 (100.0%) |
| College/Associate Degree | 0 (0.0%) | 25 (100.0%) |
| Bachelor's Degree or higher | 12 (23.5%) | 39 (76.5%) |
Occupancy by Age of Householder in Wawona
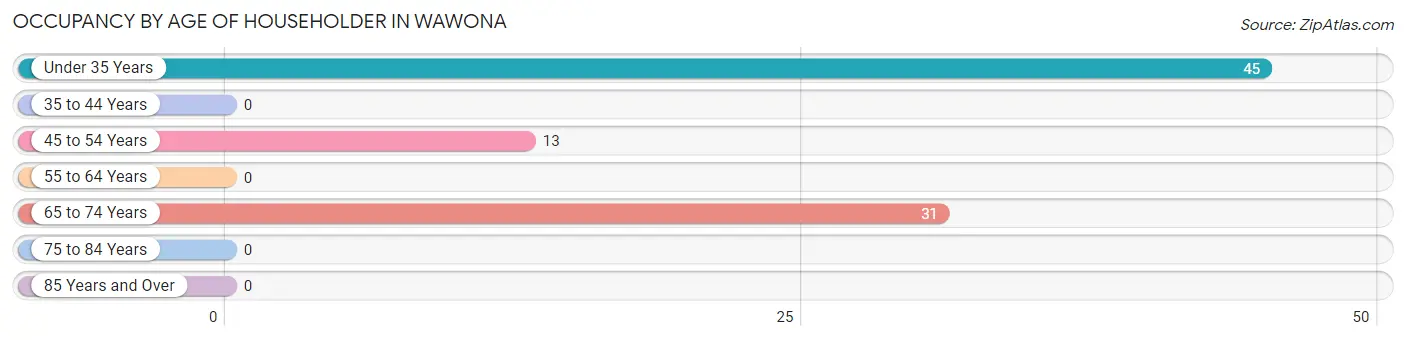
| Age Bracket | # Households | % Households |
| Under 35 Years | 45 | 50.6% |
| 35 to 44 Years | 0 | 0.0% |
| 45 to 54 Years | 13 | 14.6% |
| 55 to 64 Years | 0 | 0.0% |
| 65 to 74 Years | 31 | 34.8% |
| 75 to 84 Years | 0 | 0.0% |
| 85 Years and Over | 0 | 0.0% |
| Total | 89 | 100.0% |
Housing Finances in Wawona
Median Income by Occupancy in Wawona
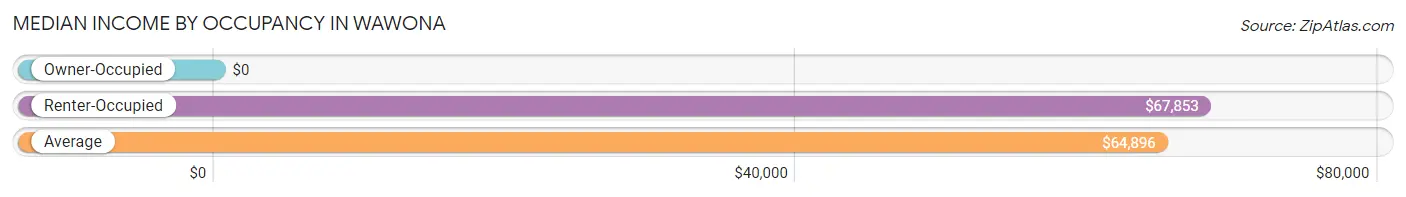
| Occupancy Type | # Households | Median Income |
| Owner-Occupied | 12 (13.5%) | $0 |
| Renter-Occupied | 77 (86.5%) | $67,853 |
| Average | 89 (100.0%) | $64,896 |
Occupancy by Householder Income Bracket in Wawona
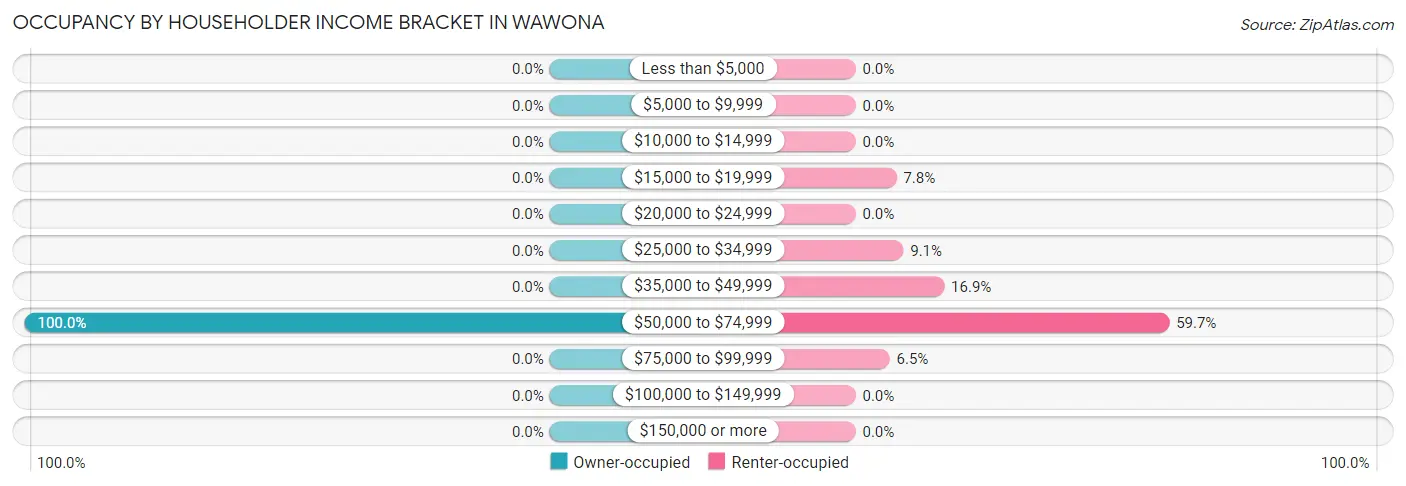
| Income Bracket | Owner-occupied | Renter-occupied |
| Less than $5,000 | 0 (0.0%) | 0 (0.0%) |
| $5,000 to $9,999 | 0 (0.0%) | 0 (0.0%) |
| $10,000 to $14,999 | 0 (0.0%) | 0 (0.0%) |
| $15,000 to $19,999 | 0 (0.0%) | 6 (7.8%) |
| $20,000 to $24,999 | 0 (0.0%) | 0 (0.0%) |
| $25,000 to $34,999 | 0 (0.0%) | 7 (9.1%) |
| $35,000 to $49,999 | 0 (0.0%) | 13 (16.9%) |
| $50,000 to $74,999 | 12 (100.0%) | 46 (59.7%) |
| $75,000 to $99,999 | 0 (0.0%) | 5 (6.5%) |
| $100,000 to $149,999 | 0 (0.0%) | 0 (0.0%) |
| $150,000 or more | 0 (0.0%) | 0 (0.0%) |
| Total | 12 (100.0%) | 77 (100.0%) |
Monthly Housing Cost Tiers in Wawona
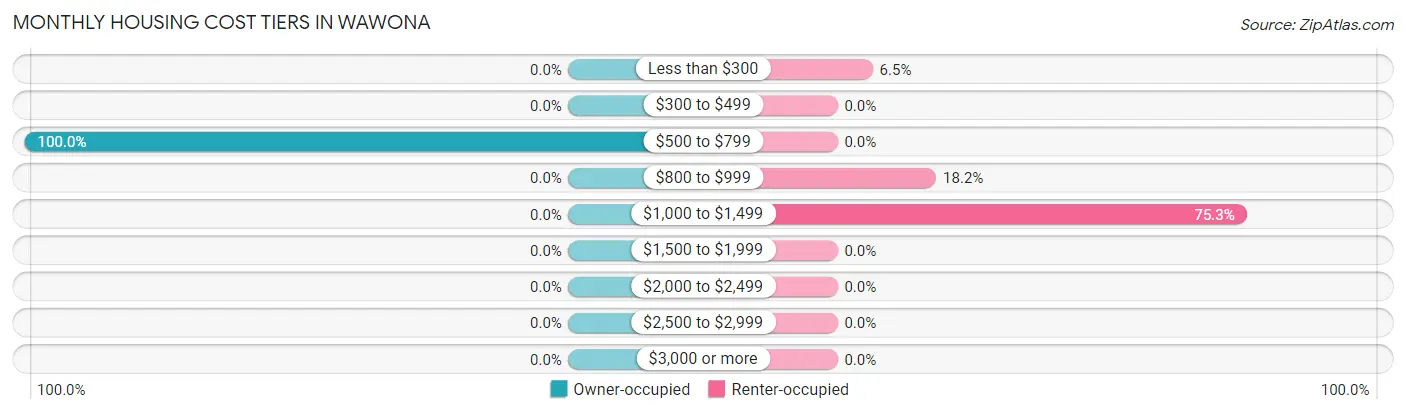
| Monthly Cost | Owner-occupied | Renter-occupied |
| Less than $300 | 0 (0.0%) | 5 (6.5%) |
| $300 to $499 | 0 (0.0%) | 0 (0.0%) |
| $500 to $799 | 12 (100.0%) | 0 (0.0%) |
| $800 to $999 | 0 (0.0%) | 14 (18.2%) |
| $1,000 to $1,499 | 0 (0.0%) | 58 (75.3%) |
| $1,500 to $1,999 | 0 (0.0%) | 0 (0.0%) |
| $2,000 to $2,499 | 0 (0.0%) | 0 (0.0%) |
| $2,500 to $2,999 | 0 (0.0%) | 0 (0.0%) |
| $3,000 or more | 0 (0.0%) | 0 (0.0%) |
| Total | 12 (100.0%) | 77 (100.0%) |
Physical Housing Characteristics in Wawona
Housing Structures in Wawona
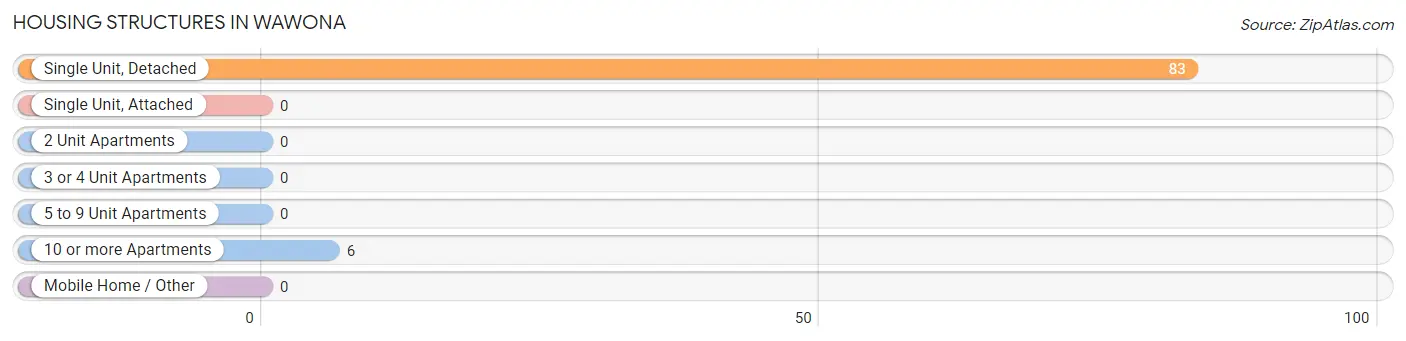
| Structure Type | # Housing Units | % Housing Units |
| Single Unit, Detached | 83 | 93.3% |
| Single Unit, Attached | 0 | 0.0% |
| 2 Unit Apartments | 0 | 0.0% |
| 3 or 4 Unit Apartments | 0 | 0.0% |
| 5 to 9 Unit Apartments | 0 | 0.0% |
| 10 or more Apartments | 6 | 6.7% |
| Mobile Home / Other | 0 | 0.0% |
| Total | 89 | 100.0% |
Housing Structures by Occupancy in Wawona
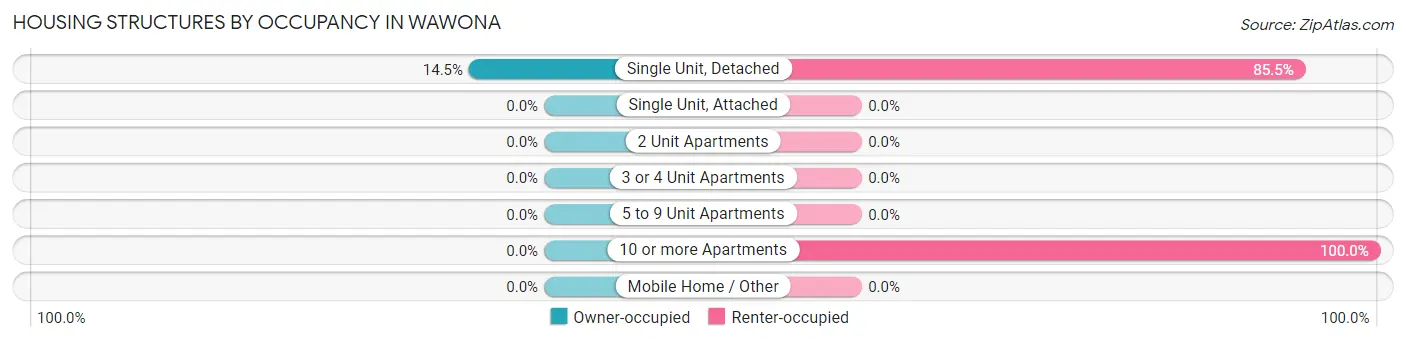
| Structure Type | Owner-occupied | Renter-occupied |
| Single Unit, Detached | 12 (14.5%) | 71 (85.5%) |
| Single Unit, Attached | 0 (0.0%) | 0 (0.0%) |
| 2 Unit Apartments | 0 (0.0%) | 0 (0.0%) |
| 3 or 4 Unit Apartments | 0 (0.0%) | 0 (0.0%) |
| 5 to 9 Unit Apartments | 0 (0.0%) | 0 (0.0%) |
| 10 or more Apartments | 0 (0.0%) | 6 (100.0%) |
| Mobile Home / Other | 0 (0.0%) | 0 (0.0%) |
| Total | 12 (13.5%) | 77 (86.5%) |
Housing Structures by Number of Rooms in Wawona
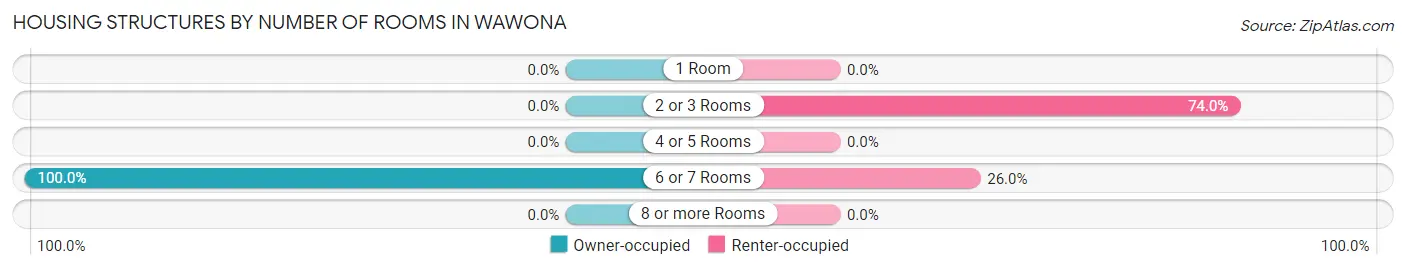
| Number of Rooms | Owner-occupied | Renter-occupied |
| 1 Room | 0 (0.0%) | 0 (0.0%) |
| 2 or 3 Rooms | 0 (0.0%) | 57 (74.0%) |
| 4 or 5 Rooms | 0 (0.0%) | 0 (0.0%) |
| 6 or 7 Rooms | 12 (100.0%) | 20 (26.0%) |
| 8 or more Rooms | 0 (0.0%) | 0 (0.0%) |
| Total | 12 (100.0%) | 77 (100.0%) |
Housing Structure by Heating Type in Wawona
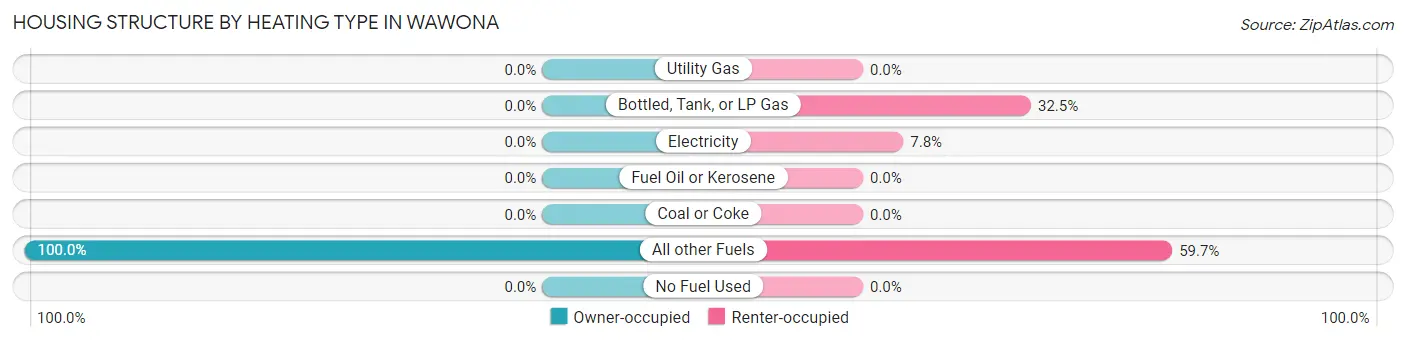
| Heating Type | Owner-occupied | Renter-occupied |
| Utility Gas | 0 (0.0%) | 0 (0.0%) |
| Bottled, Tank, or LP Gas | 0 (0.0%) | 25 (32.5%) |
| Electricity | 0 (0.0%) | 6 (7.8%) |
| Fuel Oil or Kerosene | 0 (0.0%) | 0 (0.0%) |
| Coal or Coke | 0 (0.0%) | 0 (0.0%) |
| All other Fuels | 12 (100.0%) | 46 (59.7%) |
| No Fuel Used | 0 (0.0%) | 0 (0.0%) |
| Total | 12 (100.0%) | 77 (100.0%) |
Household Vehicle Usage in Wawona
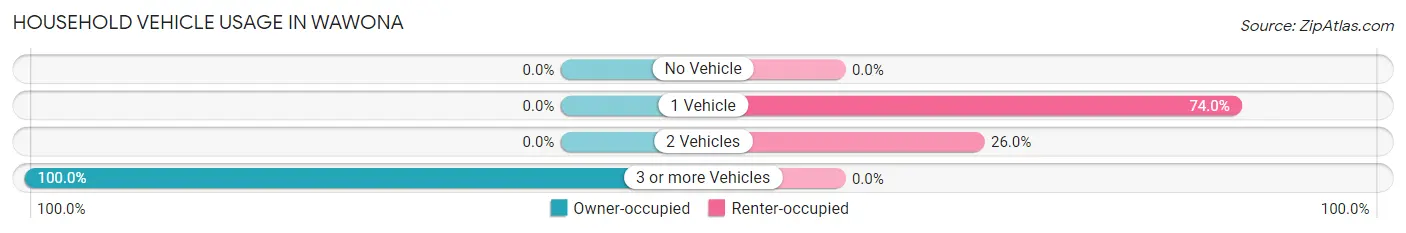
| Vehicles per Household | Owner-occupied | Renter-occupied |
| No Vehicle | 0 (0.0%) | 0 (0.0%) |
| 1 Vehicle | 0 (0.0%) | 57 (74.0%) |
| 2 Vehicles | 0 (0.0%) | 20 (26.0%) |
| 3 or more Vehicles | 12 (100.0%) | 0 (0.0%) |
| Total | 12 (100.0%) | 77 (100.0%) |
Real Estate & Mortgages in Wawona
Real Estate and Mortgage Overview in Wawona
| Characteristic | Without Mortgage | With Mortgage |
| Housing Units | 12 | 0 |
| Median Property Value | - | - |
| Median Household Income | - | - |
| Monthly Housing Costs | - | - |
| Real Estate Taxes | - | - |
Property Value by Mortgage Status in Wawona
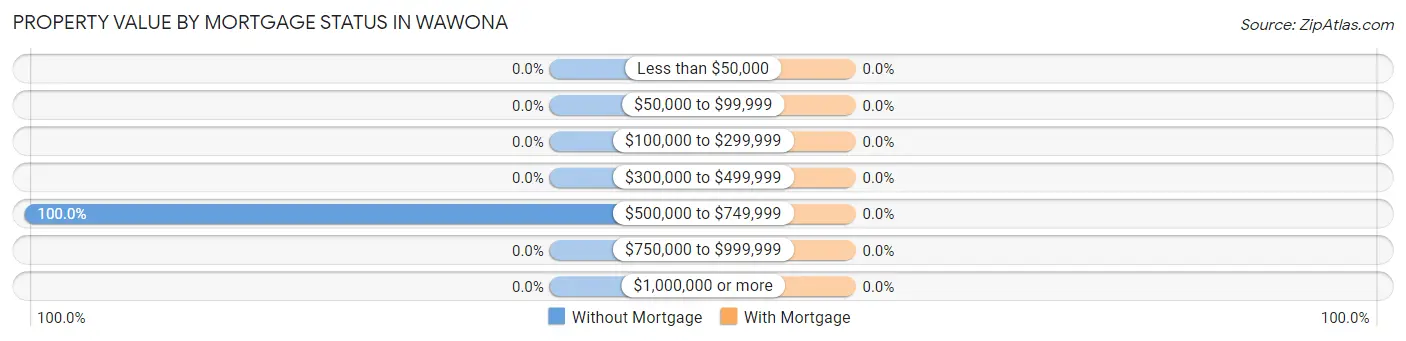
| Property Value | Without Mortgage | With Mortgage |
| Less than $50,000 | 0 (0.0%) | 0 (0.0%) |
| $50,000 to $99,999 | 0 (0.0%) | 0 (0.0%) |
| $100,000 to $299,999 | 0 (0.0%) | 0 (0.0%) |
| $300,000 to $499,999 | 0 (0.0%) | 0 (0.0%) |
| $500,000 to $749,999 | 12 (100.0%) | 0 (0.0%) |
| $750,000 to $999,999 | 0 (0.0%) | 0 (0.0%) |
| $1,000,000 or more | 0 (0.0%) | 0 (0.0%) |
| Total | 12 (100.0%) | 0 (0.0%) |
Household Income by Mortgage Status in Wawona
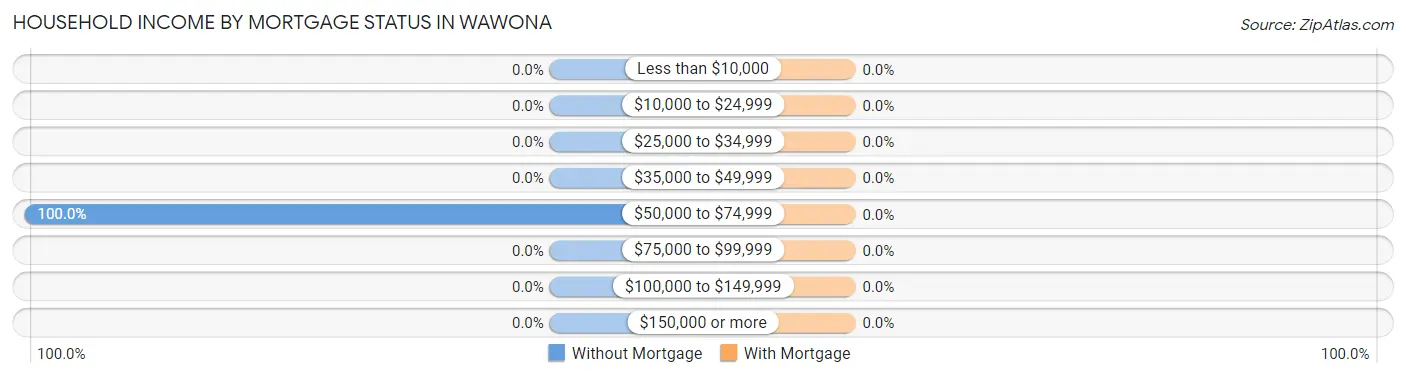
| Household Income | Without Mortgage | With Mortgage |
| Less than $10,000 | 0 (0.0%) | 0 (0.0%) |
| $10,000 to $24,999 | 0 (0.0%) | 0 (0.0%) |
| $25,000 to $34,999 | 0 (0.0%) | 0 (0.0%) |
| $35,000 to $49,999 | 0 (0.0%) | 0 (0.0%) |
| $50,000 to $74,999 | 12 (100.0%) | 0 (0.0%) |
| $75,000 to $99,999 | 0 (0.0%) | 0 (0.0%) |
| $100,000 to $149,999 | 0 (0.0%) | 0 (0.0%) |
| $150,000 or more | 0 (0.0%) | 0 (0.0%) |
| Total | 12 (100.0%) | 0 (0.0%) |
Property Value to Household Income Ratio in Wawona
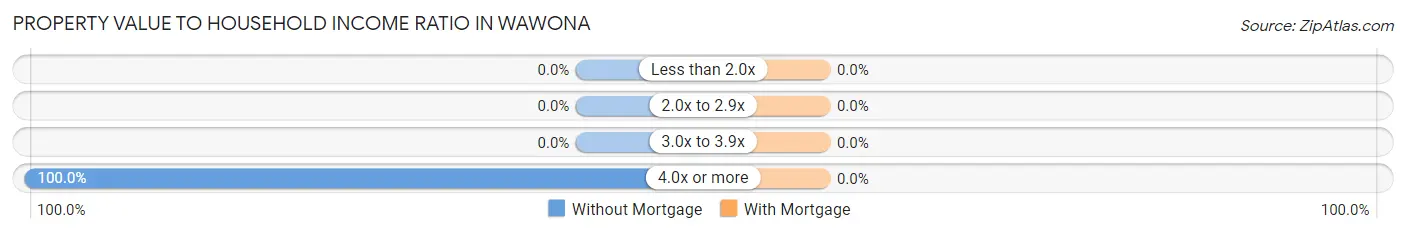
| Value-to-Income Ratio | Without Mortgage | With Mortgage |
| Less than 2.0x | 0 (0.0%) | 0 (0.0%) |
| 2.0x to 2.9x | 0 (0.0%) | 0 (0.0%) |
| 3.0x to 3.9x | 0 (0.0%) | 0 (0.0%) |
| 4.0x or more | 12 (100.0%) | 0 (0.0%) |
| Total | 12 (100.0%) | 0 (0.0%) |
Real Estate Taxes by Mortgage Status in Wawona
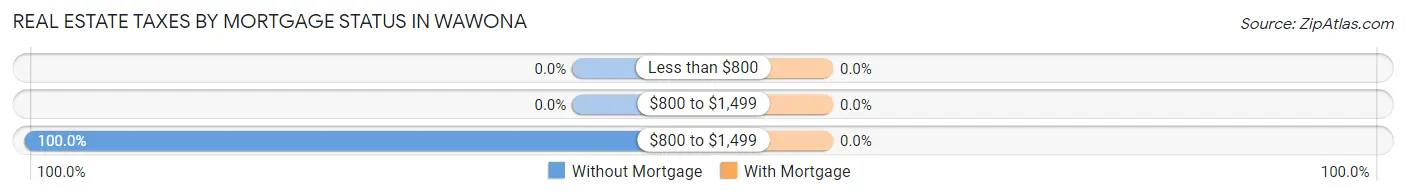
| Property Taxes | Without Mortgage | With Mortgage |
| Less than $800 | 0 (0.0%) | 0 (0.0%) |
| $800 to $1,499 | 0 (0.0%) | 0 (0.0%) |
| $800 to $1,499 | 12 (100.0%) | 0 (0.0%) |
| Total | 12 (100.0%) | 0 (0.0%) |
Health & Disability in Wawona
Health Insurance Coverage by Age in Wawona
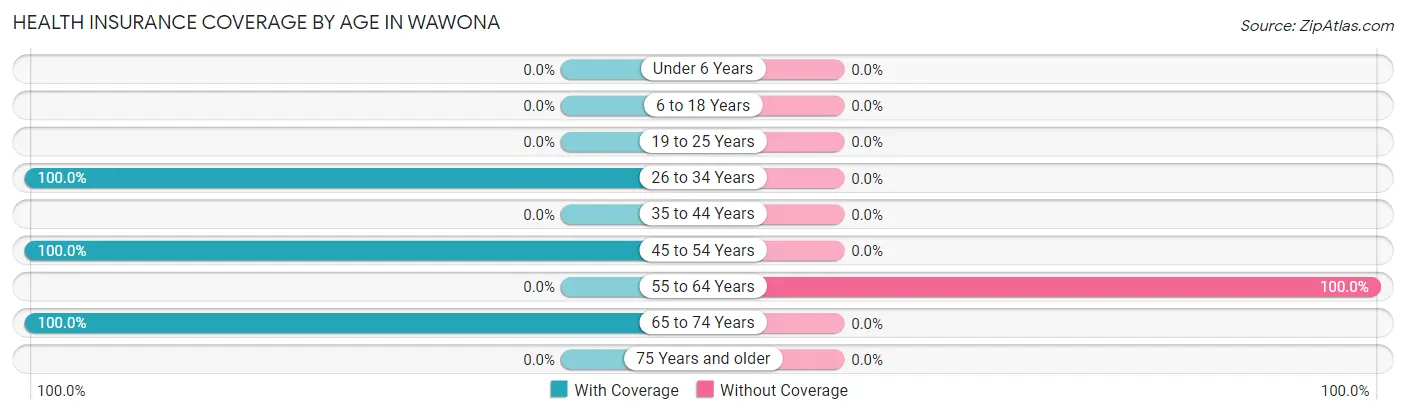
| Age Bracket | With Coverage | Without Coverage |
| Under 6 Years | 0 (0.0%) | 0 (0.0%) |
| 6 to 18 Years | 0 (0.0%) | 0 (0.0%) |
| 19 to 25 Years | 0 (0.0%) | 0 (0.0%) |
| 26 to 34 Years | 45 (100.0%) | 0 (0.0%) |
| 35 to 44 Years | 0 (0.0%) | 0 (0.0%) |
| 45 to 54 Years | 13 (100.0%) | 0 (0.0%) |
| 55 to 64 Years | 0 (0.0%) | 6 (100.0%) |
| 65 to 74 Years | 58 (100.0%) | 0 (0.0%) |
| 75 Years and older | 0 (0.0%) | 0 (0.0%) |
| Total | 116 (95.1%) | 6 (4.9%) |
Health Insurance Coverage by Citizenship Status in Wawona
| Citizenship Status | With Coverage | Without Coverage |
| Native Born | 0 (0.0%) | 0 (0.0%) |
| Foreign Born, Citizen | 0 (0.0%) | 0 (0.0%) |
| Foreign Born, not a Citizen | 0 (0.0%) | 0 (0.0%) |
Health Insurance Coverage by Household Income in Wawona
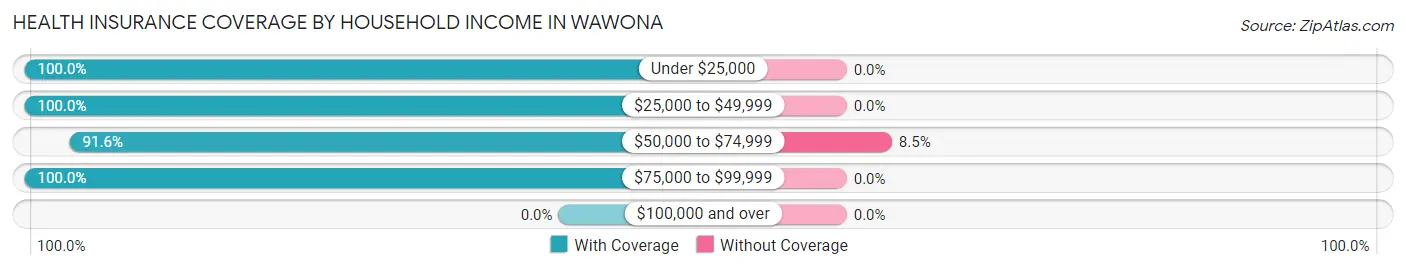
| Household Income | With Coverage | Without Coverage |
| Under $25,000 | 6 (100.0%) | 0 (0.0%) |
| $25,000 to $49,999 | 20 (100.0%) | 0 (0.0%) |
| $50,000 to $74,999 | 65 (91.5%) | 6 (8.5%) |
| $75,000 to $99,999 | 5 (100.0%) | 0 (0.0%) |
| $100,000 and over | 0 (0.0%) | 0 (0.0%) |
Public vs Private Health Insurance Coverage by Age in Wawona
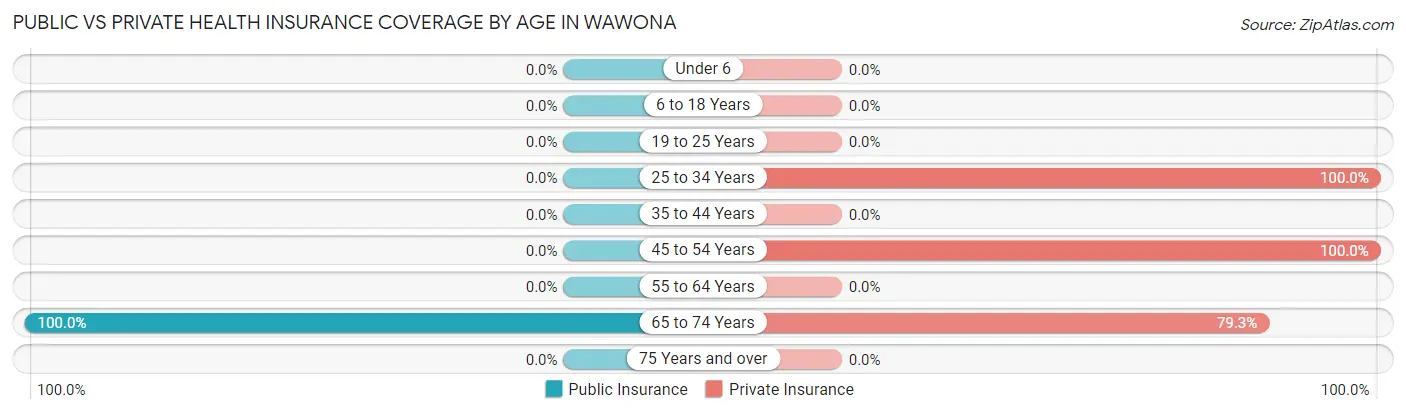
| Age Bracket | Public Insurance | Private Insurance |
| Under 6 | 0 (0.0%) | 0 (0.0%) |
| 6 to 18 Years | 0 (0.0%) | 0 (0.0%) |
| 19 to 25 Years | 0 (0.0%) | 0 (0.0%) |
| 25 to 34 Years | 0 (0.0%) | 45 (100.0%) |
| 35 to 44 Years | 0 (0.0%) | 0 (0.0%) |
| 45 to 54 Years | 0 (0.0%) | 13 (100.0%) |
| 55 to 64 Years | 0 (0.0%) | 0 (0.0%) |
| 65 to 74 Years | 58 (100.0%) | 46 (79.3%) |
| 75 Years and over | 0 (0.0%) | 0 (0.0%) |
| Total | 58 (47.5%) | 104 (85.3%) |
Disability Status by Sex by Age in Wawona
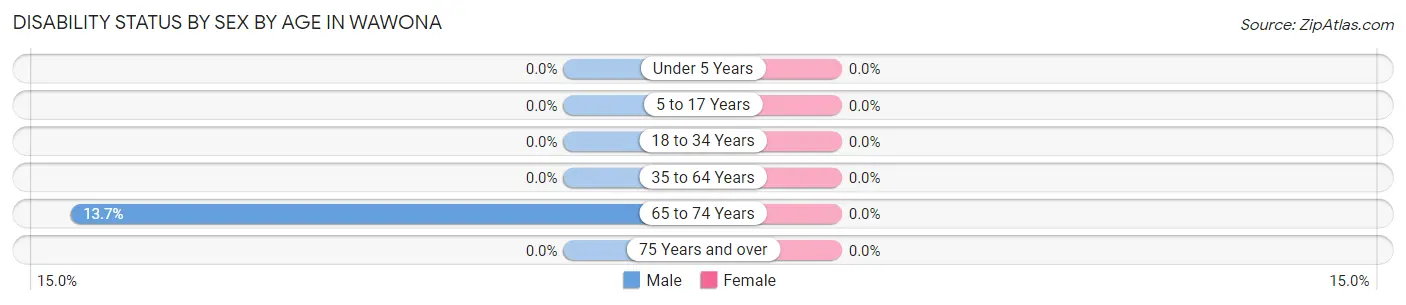
| Age Bracket | Male | Female |
| Under 5 Years | 0 (0.0%) | 0 (0.0%) |
| 5 to 17 Years | 0 (0.0%) | 0 (0.0%) |
| 18 to 34 Years | 0 (0.0%) | 0 (0.0%) |
| 35 to 64 Years | 0 (0.0%) | 0 (0.0%) |
| 65 to 74 Years | 7 (13.7%) | 0 (0.0%) |
| 75 Years and over | 0 (0.0%) | 0 (0.0%) |
Disability Class by Sex by Age in Wawona
Disability Class: Hearing Difficulty
| Age Bracket | Male | Female |
| Under 5 Years | 0 (0.0%) | 0 (0.0%) |
| 5 to 17 Years | 0 (0.0%) | 0 (0.0%) |
| 18 to 34 Years | 0 (0.0%) | 0 (0.0%) |
| 35 to 64 Years | 0 (0.0%) | 0 (0.0%) |
| 65 to 74 Years | 0 (0.0%) | 0 (0.0%) |
| 75 Years and over | 0 (0.0%) | 0 (0.0%) |
Disability Class: Vision Difficulty
| Age Bracket | Male | Female |
| Under 5 Years | 0 (0.0%) | 0 (0.0%) |
| 5 to 17 Years | 0 (0.0%) | 0 (0.0%) |
| 18 to 34 Years | 0 (0.0%) | 0 (0.0%) |
| 35 to 64 Years | 0 (0.0%) | 0 (0.0%) |
| 65 to 74 Years | 7 (13.7%) | 0 (0.0%) |
| 75 Years and over | 0 (0.0%) | 0 (0.0%) |
Disability Class: Cognitive Difficulty
| Age Bracket | Male | Female |
| 5 to 17 Years | 0 (0.0%) | 0 (0.0%) |
| 18 to 34 Years | 0 (0.0%) | 0 (0.0%) |
| 35 to 64 Years | 0 (0.0%) | 0 (0.0%) |
| 65 to 74 Years | 0 (0.0%) | 0 (0.0%) |
| 75 Years and over | 0 (0.0%) | 0 (0.0%) |
Disability Class: Ambulatory Difficulty
| Age Bracket | Male | Female |
| 5 to 17 Years | 0 (0.0%) | 0 (0.0%) |
| 18 to 34 Years | 0 (0.0%) | 0 (0.0%) |
| 35 to 64 Years | 0 (0.0%) | 0 (0.0%) |
| 65 to 74 Years | 0 (0.0%) | 0 (0.0%) |
| 75 Years and over | 0 (0.0%) | 0 (0.0%) |
Disability Class: Self-Care Difficulty
| Age Bracket | Male | Female |
| 5 to 17 Years | 0 (0.0%) | 0 (0.0%) |
| 18 to 34 Years | 0 (0.0%) | 0 (0.0%) |
| 35 to 64 Years | 0 (0.0%) | 0 (0.0%) |
| 65 to 74 Years | 0 (0.0%) | 0 (0.0%) |
| 75 Years and over | 0 (0.0%) | 0 (0.0%) |
Technology Access in Wawona
Computing Device Access in Wawona
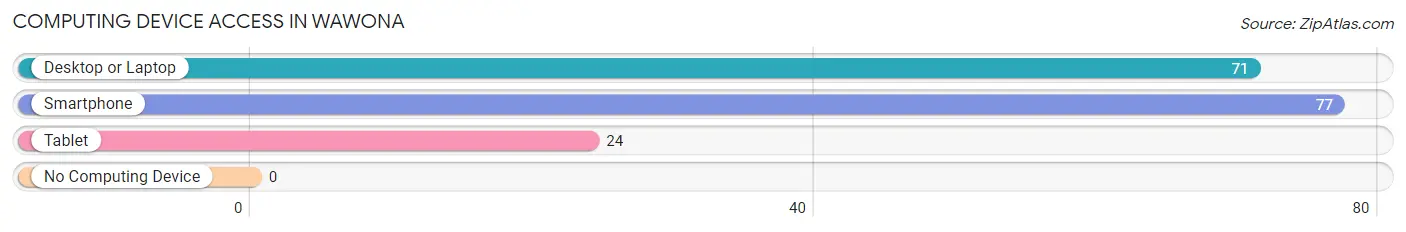
| Device Type | # Households | % Households |
| Desktop or Laptop | 71 | 79.8% |
| Smartphone | 77 | 86.5% |
| Tablet | 24 | 27.0% |
| No Computing Device | 0 | 0.0% |
| Total | 89 | 100.0% |
Internet Access in Wawona
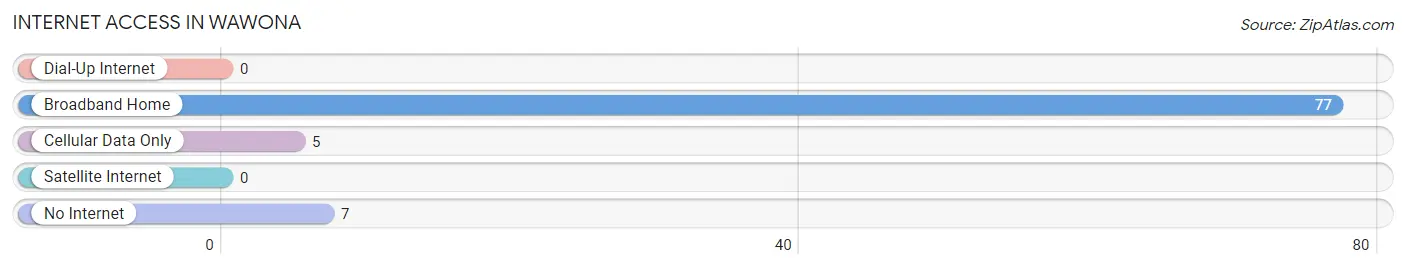
| Internet Type | # Households | % Households |
| Dial-Up Internet | 0 | 0.0% |
| Broadband Home | 77 | 86.5% |
| Cellular Data Only | 5 | 5.6% |
| Satellite Internet | 0 | 0.0% |
| No Internet | 7 | 7.9% |
| Total | 89 | 100.0% |
Wawona Summary
Wawona is a small unincorporated community located in Mariposa County, California, United States. It is situated in the Sierra Nevada mountains, about 8 miles south of Yosemite National Park. The community is located along the South Fork of the Merced River, at an elevation of 4,000 feet. Wawona is a popular tourist destination, known for its historic buildings, scenic views, and recreational activities.
History
The area now known as Wawona was first inhabited by the Ahwahneechee Native Americans. The first non-native settlers arrived in the area in the late 1850s, and the town was officially established in 1856. The name “Wawona” is derived from the Ahwahneechee word for “big tree”, referring to the giant sequoia trees that are found in the area.
In 1879, the Wawona Hotel was built, and it quickly became a popular destination for tourists. The hotel was expanded in the early 1900s, and it remains a popular destination today. In the late 1800s, the Wawona area was also home to a stagecoach stop, a post office, and a general store.
In 1906, the Wawona Tunnel was built, connecting the town to Yosemite Valley. This tunnel is still in use today, and it is the only way to access Yosemite Valley from the south.
Geography
Wawona is located in the Sierra Nevada mountains, about 8 miles south of Yosemite National Park. The town is situated along the South Fork of the Merced River, at an elevation of 4,000 feet. The area is characterized by rolling hills, dense forests, and meadows. The climate is mild, with hot summers and cold winters.
The Wawona area is home to a variety of wildlife, including black bears, deer, coyotes, and mountain lions. The area is also home to a variety of plant life, including giant sequoia trees, ponderosa pines, and manzanita bushes.
Economy
The economy of Wawona is largely based on tourism. The town is a popular destination for visitors to Yosemite National Park, and it is home to a variety of hotels, restaurants, and other tourist-oriented businesses. The Wawona Hotel is a popular destination for visitors, and it is listed on the National Register of Historic Places.
In addition to tourism, the town is also home to a variety of small businesses, including a general store, a post office, and a gas station. The town is also home to a number of small farms, which produce a variety of fruits and vegetables.
Demographics
As of the 2010 census, the population of Wawona was 568. The racial makeup of the town was 94.2% White, 0.7% African American, 0.7% Native American, 0.7% Asian, 0.4% Pacific Islander, and 2.3% from other races. The median household income was $45,000, and the median age was 44.
Wawona is a small, close-knit community. The town is home to a variety of churches, and it is known for its friendly atmosphere and welcoming attitude. The town is also home to a variety of recreational activities, including hiking, fishing, and camping.
Common Questions
What is Per Capita Income in Wawona?
Per Capita income in Wawona is $48,376.
What is the Median Household income in Wawona?
Median Household Income in Wawona is $64,896.
What is Inequality or Gini Index in Wawona?
Inequality or Gini Index in Wawona is 0.15.
What is the Total Population of Wawona?
Total Population of Wawona is 122.
What is the Total Male Population of Wawona?
Total Male Population of Wawona is 70.
What is the Total Female Population of Wawona?
Total Female Population of Wawona is 52.
What is the Ratio of Males per 100 Females in Wawona?
There are 134.62 Males per 100 Females in Wawona.
What is the Ratio of Females per 100 Males in Wawona?
There are 74.29 Females per 100 Males in Wawona.
What is the Median Population Age in Wawona?
Median Population Age in Wawona is 61.5 Years.
What is the Average Family Size in Wawona
Average Family Size in Wawona is 1.7 People.
What is the Average Household Size in Wawona
Average Household Size in Wawona is 1.1 People.
How Large is the Labor Force in Wawona?
There are 89 People in the Labor Forcein in Wawona.
What is the Percentage of People in the Labor Force in Wawona?
73.0% of People are in the Labor Force in Wawona.
What is the Unemployment Rate in Wawona?
Unemployment Rate in Wawona is 6.7%.