Cities with the Highest Percentage of Population Employed in Food Preparation & Serving in Rhode Island

RELATED REPORTS & OPTIONS

Food Preparation & Serving
Population
Families and Households
Female Fertility
Female Fertility (Unmarried)
Race (Community Size)
Race (Percentage)
Ancestry (Community Size)
AfghanAfricanAlaska NativeAlaskan AthabascanAlbanianAleutAlsatianAmericanApacheArabArapahoArgentineanArmenianAssyrian / Chaldean / SyriacAustralianAustrianBahamianBangladeshiBarbadianBasqueBelgianBelizeanBermudanBhutaneseBlackfeetBolivianBrazilianBritishBritish West IndianBulgarianBurmeseCajunCambodianCanadianCape VerdeanCarpatho RusynCelticCentral AmericanCentral American IndianCherokeeCheyenneChickasawChileanChineseChippewaChoctawColombianColvilleComancheCosta RicanCreeCreekCroatianCrowCubanCypriotCzechCzechoslovakianDanishDelawareDominicanDutchDutch West IndianEastern EuropeanEcuadorianEgyptianEnglishEstonianEthiopianEuropeanFijianFilipinoFinnishFrenchFrench American IndianFrench CanadianGermanGerman RussianGhanaianGreekGuamanian / ChamorroGuatemalanGuyaneseHaitianHmongHonduranHopiHoumaHungarianIcelanderIndian (Asian)IndonesianInupiatIranianIraqiIrishIroquoisIsraeliItalianJamaicanJapaneseJordanianKenyanKiowaKoreanLaotianLatvianLebaneseLiberianLithuanianLumbeeLuxembourgerMacedonianMalaysianMalteseMarshalleseMenomineeMexicanMexican American IndianMongolianMoroccanNative HawaiianNavajoNepaleseNew ZealanderNicaraguanNigerianNorthern EuropeanNorwegianOkinawanOsageOttawaPaiutePakistaniPalestinianPanamanianParaguayanPennsylvania GermanPeruvianPimaPolishPortuguesePotawatomiPuebloPuerto RicanPuget Sound SalishRomanianRussianSalvadoranSamoanScandinavianScotch-IrishScottishSeminoleSenegaleseSerbianShoshoneSierra LeoneanSiouxSlavicSlovakSloveneSomaliSouth AfricanSouth AmericanSouth American IndianSoviet UnionSpaniardSpanishSpanish AmericanSpanish American IndianSri LankanSubsaharan AfricanSudaneseSwedishSwissSyrianTaiwaneseThaiTlingit-HaidaTohono O'OdhamTonganTrinidadian and TobagonianTsimshianTurkishU.S. Virgin IslanderUgandanUkrainianUruguayanUteVenezuelanVietnameseWelshWest IndianYakamaYaquiYugoslavianYumanYup'ikZimbabwean
Ancestry (Percentage)
AfghanAfricanAlaska NativeAlaskan AthabascanAlbanianAleutAlsatianAmericanApacheArabArapahoArgentineanArmenianAssyrian / Chaldean / SyriacAustralianAustrianBahamianBangladeshiBarbadianBasqueBelgianBelizeanBermudanBhutaneseBlackfeetBolivianBrazilianBritishBritish West IndianBulgarianBurmeseCajunCambodianCanadianCape VerdeanCarpatho RusynCelticCentral AmericanCentral American IndianCherokeeCheyenneChickasawChileanChineseChippewaChoctawColombianColvilleComancheCosta RicanCreeCreekCroatianCrowCubanCypriotCzechCzechoslovakianDanishDelawareDominicanDutchDutch West IndianEastern EuropeanEcuadorianEgyptianEnglishEstonianEthiopianEuropeanFijianFilipinoFinnishFrenchFrench American IndianFrench CanadianGermanGerman RussianGhanaianGreekGuamanian / ChamorroGuatemalanGuyaneseHaitianHmongHonduranHopiHoumaHungarianIcelanderIndian (Asian)IndonesianInupiatIranianIraqiIrishIroquoisIsraeliItalianJamaicanJapaneseJordanianKenyanKiowaKoreanLaotianLatvianLebaneseLiberianLithuanianLumbeeLuxembourgerMacedonianMalaysianMalteseMarshalleseMenomineeMexicanMexican American IndianMongolianMoroccanNative HawaiianNavajoNepaleseNew ZealanderNicaraguanNigerianNorthern EuropeanNorwegianOkinawanOsageOttawaPaiutePakistaniPalestinianPanamanianParaguayanPennsylvania GermanPeruvianPimaPolishPortuguesePotawatomiPuebloPuerto RicanPuget Sound SalishRomanianRussianSalvadoranSamoanScandinavianScotch-IrishScottishSeminoleSenegaleseSerbianShoshoneSierra LeoneanSiouxSlavicSlovakSloveneSomaliSouth AfricanSouth AmericanSouth American IndianSoviet UnionSpaniardSpanishSpanish AmericanSpanish American IndianSri LankanSubsaharan AfricanSudaneseSwedishSwissSyrianTaiwaneseThaiTlingit-HaidaTohono O'OdhamTonganTrinidadian and TobagonianTsimshianTurkishU.S. Virgin IslanderUgandanUkrainianUruguayanUteVenezuelanVietnameseWelshWest IndianYakamaYaquiYugoslavianYumanYup'ikZimbabwean
Immigrant Origin (Total)
AfghanistanAfricaAlbaniaArgentinaArmeniaAsiaAustraliaAustriaAzoresBahamasBangladeshBarbadosBelarusBelgiumBelizeBoliviaBosnia and HerzegovinaBrazilBulgariaBurma / MyanmarCabo VerdeCambodiaCameroonCanadaCaribbeanCentral AmericaChileChinaColombiaCongoCosta RicaCroatiaCubaCzechoslovakiaDenmarkDominicaDominican RepublicEastern AfricaEastern AsiaEastern EuropeEcuadorEgyptEl SalvadorEnglandEritreaEthiopiaEuropeFijiFranceGermanyGhanaGreeceGrenadaGuatemalaGuyanaHaitiHondurasHong KongHungaryIndiaIndonesiaIranIraqIrelandIsraelItalyJamaicaJapanJordanKazakhstanKenyaKoreaKuwaitLaosLatin AmericaLatviaLebanonLiberiaLithuaniaMalaysiaMexicoMicronesiaMiddle AfricaMoldovaMoroccoNepalNetherlandsNicaraguaNigeriaNorth MacedoniaNorthern AfricaNorthern EuropeNorwayOceaniaPakistanPanamaPeruPhilippinesPolandPortugalRomaniaRussiaSaudi ArabiaScotlandSenegalSerbiaSierra LeoneSingaporeSomaliaSouth AfricaSouth AmericaSouth Central AsiaSouth Eastern AsiaSouthern EuropeSpainSri LankaSt. Vincent and the GrenadinesSudanSwedenSwitzerlandSyriaTaiwanThailandTrinidad and TobagoTurkeyUgandaUkraineUruguayUzbekistanVenezuelaVietnamWest IndiesWestern AfricaWestern AsiaWestern EuropeYemenZaireZimbabwe
Immigrant Origin (Percentage)
AfghanistanAfricaAlbaniaArgentinaArmeniaAsiaAustraliaAustriaAzoresBahamasBangladeshBarbadosBelarusBelgiumBelizeBoliviaBosnia and HerzegovinaBrazilBulgariaBurma / MyanmarCabo VerdeCambodiaCameroonCanadaCaribbeanCentral AmericaChileChinaColombiaCongoCosta RicaCroatiaCubaCzechoslovakiaDenmarkDominicaDominican RepublicEastern AfricaEastern AsiaEastern EuropeEcuadorEgyptEl SalvadorEnglandEritreaEthiopiaEuropeFijiFranceGermanyGhanaGreeceGrenadaGuatemalaGuyanaHaitiHondurasHong KongHungaryIndiaIndonesiaIranIraqIrelandIsraelItalyJamaicaJapanJordanKazakhstanKenyaKoreaKuwaitLaosLatin AmericaLatviaLebanonLiberiaLithuaniaMalaysiaMexicoMicronesiaMiddle AfricaMoldovaMoroccoNepalNetherlandsNicaraguaNigeriaNorth MacedoniaNorthern AfricaNorthern EuropeNorwayOceaniaPakistanPanamaPeruPhilippinesPolandPortugalRomaniaRussiaSaudi ArabiaScotlandSenegalSerbiaSierra LeoneSingaporeSomaliaSouth AfricaSouth AmericaSouth Central AsiaSouth Eastern AsiaSouthern EuropeSpainSri LankaSt. Vincent and the GrenadinesSudanSwedenSwitzerlandSyriaTaiwanThailandTrinidad and TobagoTurkeyUgandaUkraineUruguayUzbekistanVenezuelaVietnamWest IndiesWestern AfricaWestern AsiaWestern EuropeYemenZaireZimbabwe
Income
Income (Families)
Income (Households)
Poverty
Poverty (Families)
Unemployment
Employment Occupations
Employment Industries
Employer Class
Commute Time
Commute Means
School Enrollment
Education by Degree Field
Occupancy
Finances
Physical Characteristics
Rhode Island
Compare Cities
Comparison Subject

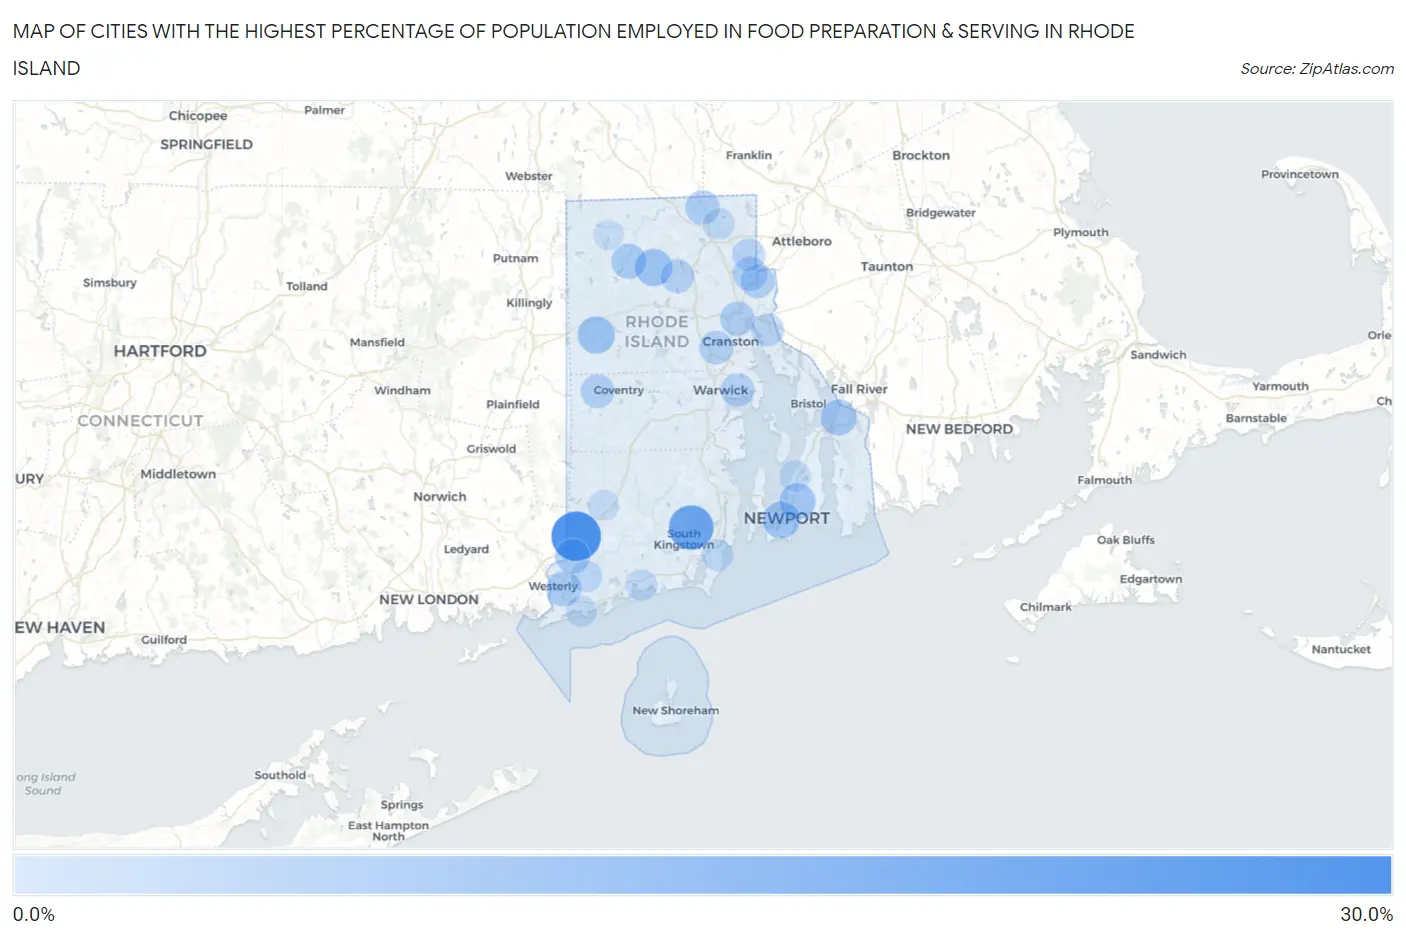
Map of Cities with the Highest Percentage of Population Employed in Food Preparation & Serving in Rhode Island

0.0%
30.0%
Cities with the Highest Percentage of Population Employed in Food Preparation & Serving in Rhode Island Map

Cities with the Highest Percentage of Population Employed in Food Preparation & Serving in Rhode Island

City % Employed vs State vs National
1.Hopkinton28.0%5.6%(+22.4)#15.3%(+22.7)#400
2.Kingston20.8%5.6%(+15.2)#25.3%(+15.5)#756
3.Harmony10.0%5.6%(+4.43)#35.3%(+4.70)#4,130
4.Foster Center9.9%5.6%(+4.36)#45.3%(+4.63)#4,180
5.Newport9.4%5.6%(+3.85)#55.3%(+4.13)#4,621
6.Newport East8.5%5.6%(+2.95)#65.3%(+3.22)#5,649
7.Tiverton8.3%5.6%(+2.75)#75.3%(+3.02)#5,928
8.Westerly7.4%5.6%(+1.86)#85.3%(+2.13)#7,252
9.Chepachet7.0%5.6%(+1.49)#95.3%(+1.76)#7,923
10.Ashaway6.6%5.6%(+1.04)#105.3%(+1.31)#8,870
11.Providence6.4%5.6%(+0.862)#115.3%(+1.13)#9,297
12.Woonsocket6.1%5.6%(+0.578)#125.3%(+0.851)#9,977
13.Central Falls6.0%5.6%(+0.452)#135.3%(+0.725)#10,310
14.Wakefield-Peace Dale5.7%5.6%(+0.180)#145.3%(+0.453)#10,968
15.Pawtucket5.5%5.6%(-0.079)#155.3%(+0.194)#11,678
16.Greene5.3%5.6%(-0.296)#165.3%(-0.023)#12,255
17.Cranston5.2%5.6%(-0.312)#175.3%(-0.039)#12,314
18.Greenville5.1%5.6%(-0.413)#185.3%(-0.140)#12,588
19.Warwick4.9%5.6%(-0.651)#195.3%(-0.378)#13,282
20.East Providence4.3%5.6%(-1.25)#205.3%(-0.974)#15,007
21.Valley Falls4.1%5.6%(-1.42)#215.3%(-1.15)#15,546
22.Bradford2.6%5.6%(-2.91)#225.3%(-2.64)#19,943
23.Narragansett Pier2.6%5.6%(-2.95)#235.3%(-2.68)#20,038
24.Charlestown2.5%5.6%(-3.09)#245.3%(-2.82)#20,410
25.Cumberland Hill2.3%5.6%(-3.24)#255.3%(-2.97)#20,837
26.Melville2.3%5.6%(-3.27)#265.3%(-3.00)#20,916
27.Weekapaug1.9%5.6%(-3.66)#275.3%(-3.38)#21,911
28.Hope Valley1.5%5.6%(-4.04)#285.3%(-3.77)#22,801
29.Pascoag0.92%5.6%(-4.64)#295.3%(-4.36)#23,861

Common Questions

What are the Top 10 Cities with the Highest Percentage of Population Employed in Food Preparation & Serving in Rhode Island?
Top 10 Cities with the Highest Percentage of Population Employed in Food Preparation & Serving in Rhode Island are:
#1
28.0%
#2
20.8%
#3
10.0%
#4
9.9%
#5
9.4%
#6
8.5%
#7
8.3%
#8
7.4%
#9
7.0%
#10
6.6%
What city has the Highest Percentage of Population Employed in Food Preparation & Serving in Rhode Island?
Hopkinton has the Highest Percentage of Population Employed in Food Preparation & Serving in Rhode Island with 28.0%.
What is the Percentage of Population Employed in Food Preparation & Serving in the State of Rhode Island?
Percentage of Population Employed in Food Preparation & Serving in Rhode Island is 5.6%.
What is the Percentage of Population Employed in Food Preparation & Serving in the United States?
Percentage of Population Employed in Food Preparation & Serving in the United States is 5.3%.