Cities with the Highest Percentage of Population Employed in Food Preparation & Serving in Louisiana
RELATED REPORTS & OPTIONS
Food Preparation & Serving
Louisiana
Compare Cities
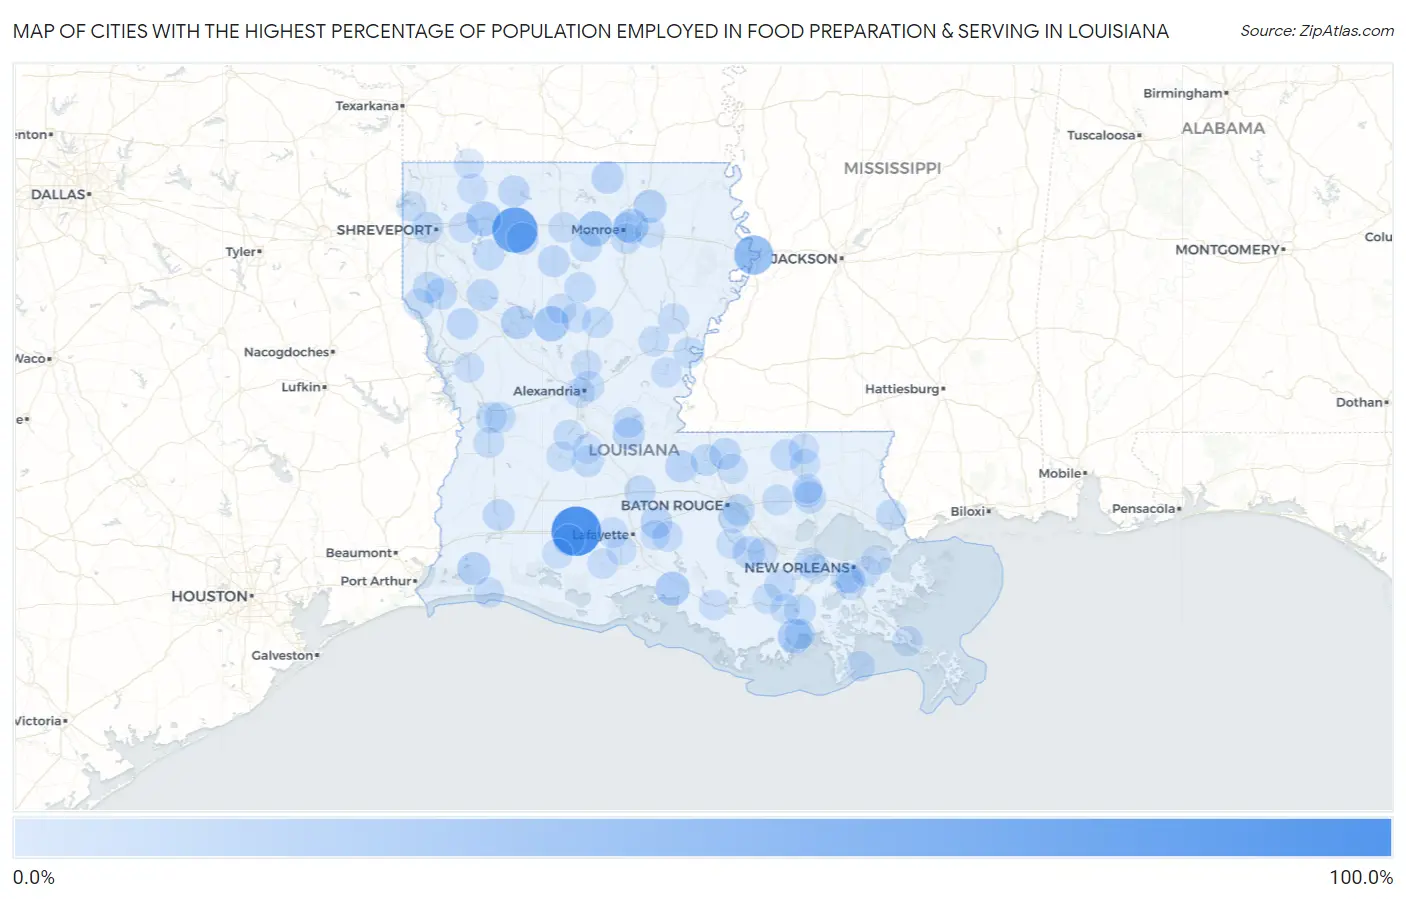
Map of Cities with the Highest Percentage of Population Employed in Food Preparation & Serving in Louisiana
0.0%
100.0%
Cities with the Highest Percentage of Population Employed in Food Preparation & Serving in Louisiana
| City | % Employed | vs State | vs National | |
| 1. | Egan | 89.2% | 6.0%(+83.2)#1 | 5.3%(+83.9)#35 |
| 2. | Mount Lebanon | 71.1% | 6.0%(+65.0)#2 | 5.3%(+65.8)#55 |
| 3. | Delta | 45.5% | 6.0%(+39.4)#3 | 5.3%(+40.2)#135 |
| 4. | Trout | 45.3% | 6.0%(+39.3)#4 | 5.3%(+40.0)#137 |
| 5. | Good Pine | 44.2% | 6.0%(+38.2)#5 | 5.3%(+38.9)#147 |
| 6. | Calhoun | 29.3% | 6.0%(+23.3)#6 | 5.3%(+24.1)#361 |
| 7. | Atlanta | 28.4% | 6.0%(+22.3)#7 | 5.3%(+23.1)#389 |
| 8. | Dixie Inn | 27.6% | 6.0%(+21.5)#8 | 5.3%(+22.3)#410 |
| 9. | Lakeshore | 26.2% | 6.0%(+20.1)#9 | 5.3%(+20.9)#461 |
| 10. | Chauvin | 26.1% | 6.0%(+20.0)#10 | 5.3%(+20.8)#467 |
| 11. | Glencoe | 24.7% | 6.0%(+18.7)#11 | 5.3%(+19.4)#517 |
| 12. | Clarence | 20.9% | 6.0%(+14.9)#12 | 5.3%(+15.7)#738 |
| 13. | Hackberry | 20.6% | 6.0%(+14.6)#13 | 5.3%(+15.3)#776 |
| 14. | Midland | 20.4% | 6.0%(+14.3)#14 | 5.3%(+15.1)#799 |
| 15. | Collinston | 20.3% | 6.0%(+14.2)#15 | 5.3%(+15.0)#808 |
| 16. | Marion | 18.0% | 6.0%(+11.9)#16 | 5.3%(+12.7)#1,068 |
| 17. | Donaldsonville | 17.5% | 6.0%(+11.4)#17 | 5.3%(+12.2)#1,137 |
| 18. | Henderson | 17.3% | 6.0%(+11.2)#18 | 5.3%(+12.0)#1,171 |
| 19. | Cottonport | 17.1% | 6.0%(+11.1)#19 | 5.3%(+11.8)#1,190 |
| 20. | Bryceland | 16.9% | 6.0%(+10.9)#20 | 5.3%(+11.6)#1,215 |
| 21. | Morganza | 16.8% | 6.0%(+10.8)#21 | 5.3%(+11.5)#1,226 |
| 22. | Hammond | 15.9% | 6.0%(+9.88)#22 | 5.3%(+10.6)#1,418 |
| 23. | Westminster | 15.7% | 6.0%(+9.68)#23 | 5.3%(+10.4)#1,469 |
| 24. | Coushatta | 15.4% | 6.0%(+9.35)#24 | 5.3%(+10.1)#1,524 |
| 25. | East Hodge | 15.3% | 6.0%(+9.25)#25 | 5.3%(+10.0)#1,558 |
| 26. | Mansfield | 15.3% | 6.0%(+9.21)#26 | 5.3%(+9.97)#1,566 |
| 27. | Lakeview | 15.0% | 6.0%(+9.00)#27 | 5.3%(+9.75)#1,618 |
| 28. | St Francisville | 14.9% | 6.0%(+8.84)#28 | 5.3%(+9.60)#1,665 |
| 29. | Homer | 14.8% | 6.0%(+8.74)#29 | 5.3%(+9.50)#1,691 |
| 30. | Pleasant Hill | 14.8% | 6.0%(+8.71)#30 | 5.3%(+9.47)#1,699 |
| 31. | Gillis | 14.6% | 6.0%(+8.60)#31 | 5.3%(+9.36)#1,722 |
| 32. | Jackson | 14.6% | 6.0%(+8.58)#32 | 5.3%(+9.34)#1,727 |
| 33. | Greensburg | 14.5% | 6.0%(+8.49)#33 | 5.3%(+9.25)#1,759 |
| 34. | Port Barre | 14.3% | 6.0%(+8.30)#34 | 5.3%(+9.05)#1,804 |
| 35. | Grand Cane | 14.3% | 6.0%(+8.24)#35 | 5.3%(+9.00)#1,825 |
| 36. | Lockport Heights | 14.1% | 6.0%(+8.02)#36 | 5.3%(+8.77)#1,899 |
| 37. | Pine Prairie | 13.7% | 6.0%(+7.65)#37 | 5.3%(+8.41)#2,007 |
| 38. | Choctaw | 13.7% | 6.0%(+7.61)#38 | 5.3%(+8.37)#2,021 |
| 39. | Mermentau | 13.4% | 6.0%(+7.38)#39 | 5.3%(+8.14)#2,091 |
| 40. | Ridgecrest | 12.9% | 6.0%(+6.90)#40 | 5.3%(+7.66)#2,278 |
| 41. | Eros | 12.9% | 6.0%(+6.90)#41 | 5.3%(+7.66)#2,281 |
| 42. | Gardere | 12.8% | 6.0%(+6.80)#42 | 5.3%(+7.55)#2,327 |
| 43. | Tullos | 12.7% | 6.0%(+6.67)#43 | 5.3%(+7.43)#2,397 |
| 44. | Fort Polk North | 12.6% | 6.0%(+6.51)#44 | 5.3%(+7.27)#2,460 |
| 45. | Ringgold | 12.4% | 6.0%(+6.35)#45 | 5.3%(+7.10)#2,567 |
| 46. | Echo | 12.2% | 6.0%(+6.14)#46 | 5.3%(+6.89)#2,660 |
| 47. | Leesville | 12.1% | 6.0%(+6.08)#47 | 5.3%(+6.84)#2,685 |
| 48. | Pearl River | 12.1% | 6.0%(+6.05)#48 | 5.3%(+6.80)#2,708 |
| 49. | Mansura | 12.0% | 6.0%(+5.97)#49 | 5.3%(+6.72)#2,753 |
| 50. | Sikes | 12.0% | 6.0%(+5.96)#50 | 5.3%(+6.71)#2,761 |
| 51. | Pineville | 11.9% | 6.0%(+5.83)#51 | 5.3%(+6.58)#2,840 |
| 52. | Livingston | 11.7% | 6.0%(+5.68)#52 | 5.3%(+6.44)#2,923 |
| 53. | Rosepine | 11.7% | 6.0%(+5.63)#53 | 5.3%(+6.38)#2,958 |
| 54. | Duson | 11.5% | 6.0%(+5.49)#54 | 5.3%(+6.24)#3,056 |
| 55. | Catahoula | 11.2% | 6.0%(+5.12)#55 | 5.3%(+5.87)#3,288 |
| 56. | Glenmora | 11.1% | 6.0%(+5.03)#56 | 5.3%(+5.79)#3,346 |
| 57. | Sicily Island | 11.0% | 6.0%(+4.98)#57 | 5.3%(+5.74)#3,381 |
| 58. | Wallace Ridge | 10.9% | 6.0%(+4.83)#58 | 5.3%(+5.59)#3,457 |
| 59. | Stanley | 10.9% | 6.0%(+4.83)#59 | 5.3%(+5.58)#3,470 |
| 60. | Ruston | 10.8% | 6.0%(+4.76)#60 | 5.3%(+5.51)#3,517 |
| 61. | Montegut | 10.8% | 6.0%(+4.71)#61 | 5.3%(+5.47)#3,544 |
| 62. | Montz | 10.7% | 6.0%(+4.64)#62 | 5.3%(+5.40)#3,592 |
| 63. | Richwood | 10.7% | 6.0%(+4.63)#63 | 5.3%(+5.39)#3,595 |
| 64. | Monterey | 10.4% | 6.0%(+4.38)#64 | 5.3%(+5.13)#3,782 |
| 65. | Winnfield | 10.3% | 6.0%(+4.26)#65 | 5.3%(+5.01)#3,864 |
| 66. | Union | 10.3% | 6.0%(+4.25)#66 | 5.3%(+5.01)#3,868 |
| 67. | Kaplan | 10.3% | 6.0%(+4.21)#67 | 5.3%(+4.96)#3,897 |
| 68. | Westwego | 10.2% | 6.0%(+4.16)#68 | 5.3%(+4.91)#3,943 |
| 69. | Pollock | 10.2% | 6.0%(+4.14)#69 | 5.3%(+4.89)#3,962 |
| 70. | Cameron | 10.1% | 6.0%(+4.10)#70 | 5.3%(+4.86)#3,985 |
| 71. | Grand Isle | 10.1% | 6.0%(+4.09)#71 | 5.3%(+4.85)#3,995 |
| 72. | Tangipahoa | 10.1% | 6.0%(+4.03)#72 | 5.3%(+4.78)#4,046 |
| 73. | Empire | 10.0% | 6.0%(+3.98)#73 | 5.3%(+4.74)#4,080 |
| 74. | Natalbany | 9.9% | 6.0%(+3.88)#74 | 5.3%(+4.64)#4,172 |
| 75. | Maurice | 9.9% | 6.0%(+3.87)#75 | 5.3%(+4.63)#4,183 |
| 76. | Estelle | 9.9% | 6.0%(+3.81)#76 | 5.3%(+4.57)#4,221 |
| 77. | Cotton Valley | 9.8% | 6.0%(+3.71)#77 | 5.3%(+4.47)#4,301 |
| 78. | Haughton | 9.7% | 6.0%(+3.65)#78 | 5.3%(+4.40)#4,362 |
| 79. | Patterson | 9.6% | 6.0%(+3.57)#79 | 5.3%(+4.33)#4,426 |
| 80. | Oakdale | 9.5% | 6.0%(+3.49)#80 | 5.3%(+4.25)#4,504 |
| 81. | Fisher | 9.5% | 6.0%(+3.48)#81 | 5.3%(+4.24)#4,512 |
| 82. | Slaughter | 9.5% | 6.0%(+3.46)#82 | 5.3%(+4.22)#4,535 |
| 83. | Chalmette | 9.5% | 6.0%(+3.45)#83 | 5.3%(+4.21)#4,547 |
| 84. | Schriever | 9.5% | 6.0%(+3.44)#84 | 5.3%(+4.19)#4,560 |
| 85. | Mooringsport | 9.5% | 6.0%(+3.43)#85 | 5.3%(+4.18)#4,570 |
| 86. | White Castle | 9.5% | 6.0%(+3.42)#86 | 5.3%(+4.17)#4,578 |
| 87. | Alexandria | 9.3% | 6.0%(+3.29)#87 | 5.3%(+4.05)#4,712 |
| 88. | Lake Arthur | 9.3% | 6.0%(+3.25)#88 | 5.3%(+4.01)#4,750 |
| 89. | Parks | 9.1% | 6.0%(+3.08)#89 | 5.3%(+3.83)#4,916 |
| 90. | Start | 9.0% | 6.0%(+3.00)#90 | 5.3%(+3.76)#5,010 |
| 91. | Hahnville | 9.0% | 6.0%(+2.95)#91 | 5.3%(+3.70)#5,068 |
| 92. | Springhill | 9.0% | 6.0%(+2.95)#92 | 5.3%(+3.70)#5,077 |
| 93. | Roseland | 9.0% | 6.0%(+2.91)#93 | 5.3%(+3.67)#5,123 |
| 94. | Monroe | 8.9% | 6.0%(+2.88)#94 | 5.3%(+3.64)#5,171 |
| 95. | New Orleans | 8.9% | 6.0%(+2.85)#95 | 5.3%(+3.61)#5,206 |
| 96. | Bayou Blue | 8.9% | 6.0%(+2.84)#96 | 5.3%(+3.60)#5,215 |
| 97. | Jordan Hill | 8.8% | 6.0%(+2.73)#97 | 5.3%(+3.49)#5,345 |
| 98. | Tickfaw | 8.7% | 6.0%(+2.71)#98 | 5.3%(+3.46)#5,368 |
| 99. | Turkey Creek | 8.7% | 6.0%(+2.62)#99 | 5.3%(+3.38)#5,481 |
| 100. | Marrero | 8.5% | 6.0%(+2.48)#100 | 5.3%(+3.24)#5,630 |
Common Questions
What are the Top 10 Cities with the Highest Percentage of Population Employed in Food Preparation & Serving in Louisiana?
Top 10 Cities with the Highest Percentage of Population Employed in Food Preparation & Serving in Louisiana are:
What city has the Highest Percentage of Population Employed in Food Preparation & Serving in Louisiana?
Egan has the Highest Percentage of Population Employed in Food Preparation & Serving in Louisiana with 89.2%.
What is the Percentage of Population Employed in Food Preparation & Serving in the State of Louisiana?
Percentage of Population Employed in Food Preparation & Serving in Louisiana is 6.0%.
What is the Percentage of Population Employed in Food Preparation & Serving in the United States?
Percentage of Population Employed in Food Preparation & Serving in the United States is 5.3%.