Cities with the Highest Percentage of Population Employed in Food Preparation & Serving in Washington
RELATED REPORTS & OPTIONS
Food Preparation & Serving
Washington
Compare Cities
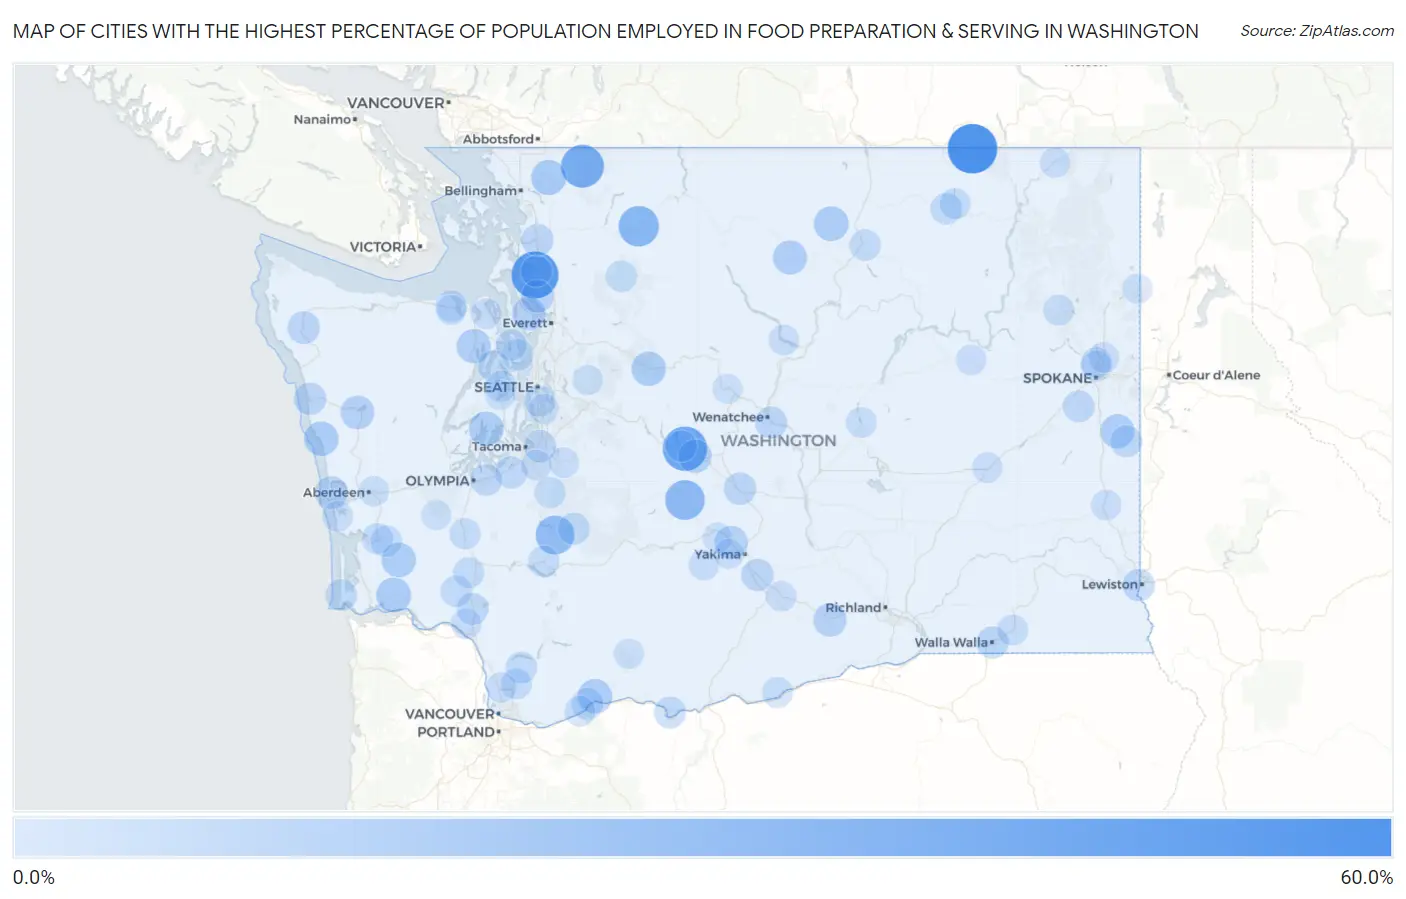
Map of Cities with the Highest Percentage of Population Employed in Food Preparation & Serving in Washington
0.0%
60.0%
Cities with the Highest Percentage of Population Employed in Food Preparation & Serving in Washington
| City | % Employed | vs State | vs National | |
| 1. | Danville | 56.5% | 5.1%(+51.4)#1 | 5.3%(+51.2)#83 |
| 2. | Northwest Stanwood | 50.0% | 5.1%(+44.9)#2 | 5.3%(+44.7)#111 |
| 3. | Ronald | 43.2% | 5.1%(+38.1)#3 | 5.3%(+37.9)#157 |
| 4. | Glacier | 39.7% | 5.1%(+34.6)#4 | 5.3%(+34.4)#191 |
| 5. | Marblemount | 33.3% | 5.1%(+28.2)#5 | 5.3%(+28.0)#272 |
| 6. | Cliffdell | 31.4% | 5.1%(+26.3)#6 | 5.3%(+26.1)#308 |
| 7. | Bow | 31.4% | 5.1%(+26.2)#7 | 5.3%(+26.1)#310 |
| 8. | Mineral | 29.1% | 5.1%(+23.9)#8 | 5.3%(+23.8)#370 |
| 9. | Deming | 20.3% | 5.1%(+15.2)#9 | 5.3%(+15.0)#802 |
| 10. | Grays River | 19.4% | 5.1%(+14.3)#10 | 5.3%(+14.1)#903 |
| 11. | Conconully | 19.4% | 5.1%(+14.3)#11 | 5.3%(+14.1)#907 |
| 12. | Lebam | 19.1% | 5.1%(+14.0)#12 | 5.3%(+13.8)#932 |
| 13. | Skykomish | 18.8% | 5.1%(+13.6)#13 | 5.3%(+13.5)#975 |
| 14. | Santiago | 18.8% | 5.1%(+13.6)#14 | 5.3%(+13.5)#976 |
| 15. | Vaughn | 18.7% | 5.1%(+13.6)#15 | 5.3%(+13.4)#981 |
| 16. | Carson | 18.6% | 5.1%(+13.5)#16 | 5.3%(+13.3)#995 |
| 17. | Quilcene | 18.0% | 5.1%(+12.8)#17 | 5.3%(+12.7)#1,069 |
| 18. | Waverly | 18.0% | 5.1%(+12.8)#18 | 5.3%(+12.7)#1,071 |
| 19. | Twisp | 17.9% | 5.1%(+12.8)#19 | 5.3%(+12.7)#1,074 |
| 20. | South Cle Elum | 16.7% | 5.1%(+11.5)#20 | 5.3%(+11.4)#1,252 |
| 21. | Amanda Park | 16.7% | 5.1%(+11.5)#21 | 5.3%(+11.4)#1,267 |
| 22. | Langley | 16.2% | 5.1%(+11.0)#22 | 5.3%(+10.9)#1,358 |
| 23. | Prosser | 16.2% | 5.1%(+11.0)#23 | 5.3%(+10.9)#1,367 |
| 24. | Eschbach | 16.2% | 5.1%(+11.0)#24 | 5.3%(+10.9)#1,373 |
| 25. | Kayak Point | 14.8% | 5.1%(+9.65)#25 | 5.3%(+9.51)#1,690 |
| 26. | Ocean Shores | 14.5% | 5.1%(+9.37)#26 | 5.3%(+9.22)#1,769 |
| 27. | Forks | 14.2% | 5.1%(+9.09)#27 | 5.3%(+8.94)#1,849 |
| 28. | Ellensburg | 14.2% | 5.1%(+9.03)#28 | 5.3%(+8.89)#1,866 |
| 29. | Queets | 13.8% | 5.1%(+8.65)#29 | 5.3%(+8.51)#1,971 |
| 30. | Clarkston | 13.7% | 5.1%(+8.52)#30 | 5.3%(+8.38)#2,015 |
| 31. | Walla Walla | 13.5% | 5.1%(+8.36)#31 | 5.3%(+8.21)#2,068 |
| 32. | Milton | 13.5% | 5.1%(+8.35)#32 | 5.3%(+8.20)#2,070 |
| 33. | South Wenatchee | 13.4% | 5.1%(+8.27)#33 | 5.3%(+8.13)#2,096 |
| 34. | Donald | 13.4% | 5.1%(+8.26)#34 | 5.3%(+8.12)#2,104 |
| 35. | Burlington | 13.3% | 5.1%(+8.15)#35 | 5.3%(+8.01)#2,143 |
| 36. | Kitsap Lake | 13.1% | 5.1%(+8.00)#36 | 5.3%(+7.86)#2,203 |
| 37. | Fort Lewis | 12.9% | 5.1%(+7.73)#37 | 5.3%(+7.59)#2,309 |
| 38. | Latah | 12.8% | 5.1%(+7.62)#38 | 5.3%(+7.48)#2,365 |
| 39. | Castle Rock | 12.7% | 5.1%(+7.53)#39 | 5.3%(+7.38)#2,418 |
| 40. | Ashford | 12.7% | 5.1%(+7.51)#40 | 5.3%(+7.36)#2,423 |
| 41. | Cheney | 12.4% | 5.1%(+7.31)#41 | 5.3%(+7.16)#2,539 |
| 42. | Dallesport | 12.2% | 5.1%(+7.10)#42 | 5.3%(+6.96)#2,626 |
| 43. | Tanglewilde | 12.2% | 5.1%(+7.09)#43 | 5.3%(+6.95)#2,632 |
| 44. | Kingston | 12.2% | 5.1%(+7.06)#44 | 5.3%(+6.92)#2,643 |
| 45. | Bangor Base | 12.2% | 5.1%(+7.04)#45 | 5.3%(+6.90)#2,659 |
| 46. | Stevenson | 12.1% | 5.1%(+6.94)#46 | 5.3%(+6.80)#2,713 |
| 47. | Republic | 12.0% | 5.1%(+6.86)#47 | 5.3%(+6.71)#2,757 |
| 48. | Amboy | 12.0% | 5.1%(+6.81)#48 | 5.3%(+6.67)#2,787 |
| 49. | Ocosta | 11.9% | 5.1%(+6.76)#49 | 5.3%(+6.62)#2,826 |
| 50. | Ryderwood | 11.9% | 5.1%(+6.72)#50 | 5.3%(+6.58)#2,841 |
| 51. | Long Beach | 11.7% | 5.1%(+6.58)#51 | 5.3%(+6.44)#2,924 |
| 52. | Sequim | 11.7% | 5.1%(+6.57)#52 | 5.3%(+6.43)#2,931 |
| 53. | North Omak | 11.6% | 5.1%(+6.41)#53 | 5.3%(+6.27)#3,035 |
| 54. | Roslyn | 11.4% | 5.1%(+6.27)#54 | 5.3%(+6.13)#3,115 |
| 55. | Darrington | 11.4% | 5.1%(+6.23)#55 | 5.3%(+6.08)#3,152 |
| 56. | Beverly | 11.4% | 5.1%(+6.21)#56 | 5.3%(+6.07)#3,164 |
| 57. | Tracyton | 11.3% | 5.1%(+6.20)#57 | 5.3%(+6.06)#3,169 |
| 58. | Winlock | 11.3% | 5.1%(+6.19)#58 | 5.3%(+6.04)#3,178 |
| 59. | Lake Ketchum | 11.3% | 5.1%(+6.16)#59 | 5.3%(+6.02)#3,204 |
| 60. | Willapa | 11.3% | 5.1%(+6.12)#60 | 5.3%(+5.98)#3,218 |
| 61. | Boulevard Park | 11.1% | 5.1%(+5.95)#61 | 5.3%(+5.80)#3,339 |
| 62. | Morton | 11.1% | 5.1%(+5.94)#62 | 5.3%(+5.80)#3,342 |
| 63. | Raymond | 11.1% | 5.1%(+5.93)#63 | 5.3%(+5.79)#3,345 |
| 64. | Port Gamble Tribal Community | 11.0% | 5.1%(+5.81)#64 | 5.3%(+5.66)#3,420 |
| 65. | Centralia | 10.8% | 5.1%(+5.67)#65 | 5.3%(+5.53)#3,502 |
| 66. | Kapowsin | 10.8% | 5.1%(+5.63)#66 | 5.3%(+5.49)#3,528 |
| 67. | Torboy | 10.7% | 5.1%(+5.54)#67 | 5.3%(+5.40)#3,591 |
| 68. | Lewisville | 10.7% | 5.1%(+5.51)#68 | 5.3%(+5.36)#3,619 |
| 69. | Springdale | 10.5% | 5.1%(+5.34)#69 | 5.3%(+5.20)#3,737 |
| 70. | Dixie | 10.4% | 5.1%(+5.30)#70 | 5.3%(+5.16)#3,766 |
| 71. | Roosevelt | 10.3% | 5.1%(+5.20)#71 | 5.3%(+5.06)#3,840 |
| 72. | Town And Country | 10.1% | 5.1%(+5.00)#72 | 5.3%(+4.86)#3,990 |
| 73. | Soap Lake | 9.9% | 5.1%(+4.76)#73 | 5.3%(+4.62)#4,190 |
| 74. | North Bonneville | 9.9% | 5.1%(+4.72)#74 | 5.3%(+4.58)#4,213 |
| 75. | Country Homes | 9.9% | 5.1%(+4.72)#75 | 5.3%(+4.57)#4,216 |
| 76. | Mead | 9.8% | 5.1%(+4.65)#76 | 5.3%(+4.51)#4,265 |
| 77. | Manson | 9.7% | 5.1%(+4.53)#77 | 5.3%(+4.39)#4,370 |
| 78. | Grayland | 9.7% | 5.1%(+4.51)#78 | 5.3%(+4.37)#4,386 |
| 79. | Port Hadlock Irondale | 9.6% | 5.1%(+4.48)#79 | 5.3%(+4.34)#4,419 |
| 80. | Longview Heights | 9.6% | 5.1%(+4.47)#80 | 5.3%(+4.33)#4,425 |
| 81. | Summit View | 9.5% | 5.1%(+4.37)#81 | 5.3%(+4.23)#4,528 |
| 82. | Tampico | 9.5% | 5.1%(+4.35)#82 | 5.3%(+4.21)#4,545 |
| 83. | Creston | 9.5% | 5.1%(+4.32)#83 | 5.3%(+4.17)#4,580 |
| 84. | Colfax | 9.4% | 5.1%(+4.29)#84 | 5.3%(+4.15)#4,593 |
| 85. | Ritzville | 9.4% | 5.1%(+4.25)#85 | 5.3%(+4.11)#4,640 |
| 86. | Granger | 9.3% | 5.1%(+4.12)#86 | 5.3%(+3.98)#4,783 |
| 87. | Northport | 9.3% | 5.1%(+4.12)#87 | 5.3%(+3.97)#4,790 |
| 88. | Carnation | 9.3% | 5.1%(+4.11)#88 | 5.3%(+3.97)#4,793 |
| 89. | Prairie Heights | 9.3% | 5.1%(+4.11)#89 | 5.3%(+3.97)#4,794 |
| 90. | Duluth | 9.2% | 5.1%(+4.05)#90 | 5.3%(+3.90)#4,845 |
| 91. | Aberdeen | 9.1% | 5.1%(+3.91)#91 | 5.3%(+3.76)#5,003 |
| 92. | Bell Hill | 9.0% | 5.1%(+3.86)#92 | 5.3%(+3.71)#5,056 |
| 93. | Trout Lake | 9.0% | 5.1%(+3.84)#93 | 5.3%(+3.70)#5,081 |
| 94. | Leavenworth | 8.9% | 5.1%(+3.79)#94 | 5.3%(+3.65)#5,160 |
| 95. | Tukwila | 8.9% | 5.1%(+3.77)#95 | 5.3%(+3.63)#5,179 |
| 96. | Newport | 8.8% | 5.1%(+3.65)#96 | 5.3%(+3.50)#5,328 |
| 97. | Tieton | 8.8% | 5.1%(+3.64)#97 | 5.3%(+3.49)#5,337 |
| 98. | Oakville | 8.8% | 5.1%(+3.62)#98 | 5.3%(+3.48)#5,359 |
| 99. | Navy Yard City | 8.6% | 5.1%(+3.49)#99 | 5.3%(+3.34)#5,507 |
| 100. | Summitview | 8.6% | 5.1%(+3.47)#100 | 5.3%(+3.33)#5,530 |
Common Questions
What are the Top 10 Cities with the Highest Percentage of Population Employed in Food Preparation & Serving in Washington?
Top 10 Cities with the Highest Percentage of Population Employed in Food Preparation & Serving in Washington are:
#1
56.5%
#2
50.0%
#3
43.2%
#4
39.7%
#5
33.3%
#6
31.4%
#7
29.1%
#8
20.3%
#9
19.4%
#10
19.4%
What city has the Highest Percentage of Population Employed in Food Preparation & Serving in Washington?
Danville has the Highest Percentage of Population Employed in Food Preparation & Serving in Washington with 56.5%.
What is the Percentage of Population Employed in Food Preparation & Serving in the State of Washington?
Percentage of Population Employed in Food Preparation & Serving in Washington is 5.1%.
What is the Percentage of Population Employed in Food Preparation & Serving in the United States?
Percentage of Population Employed in Food Preparation & Serving in the United States is 5.3%.