Cities with the Highest Percentage of Population Employed in Food Preparation & Serving in Idaho
RELATED REPORTS & OPTIONS
Food Preparation & Serving
Idaho
Compare Cities
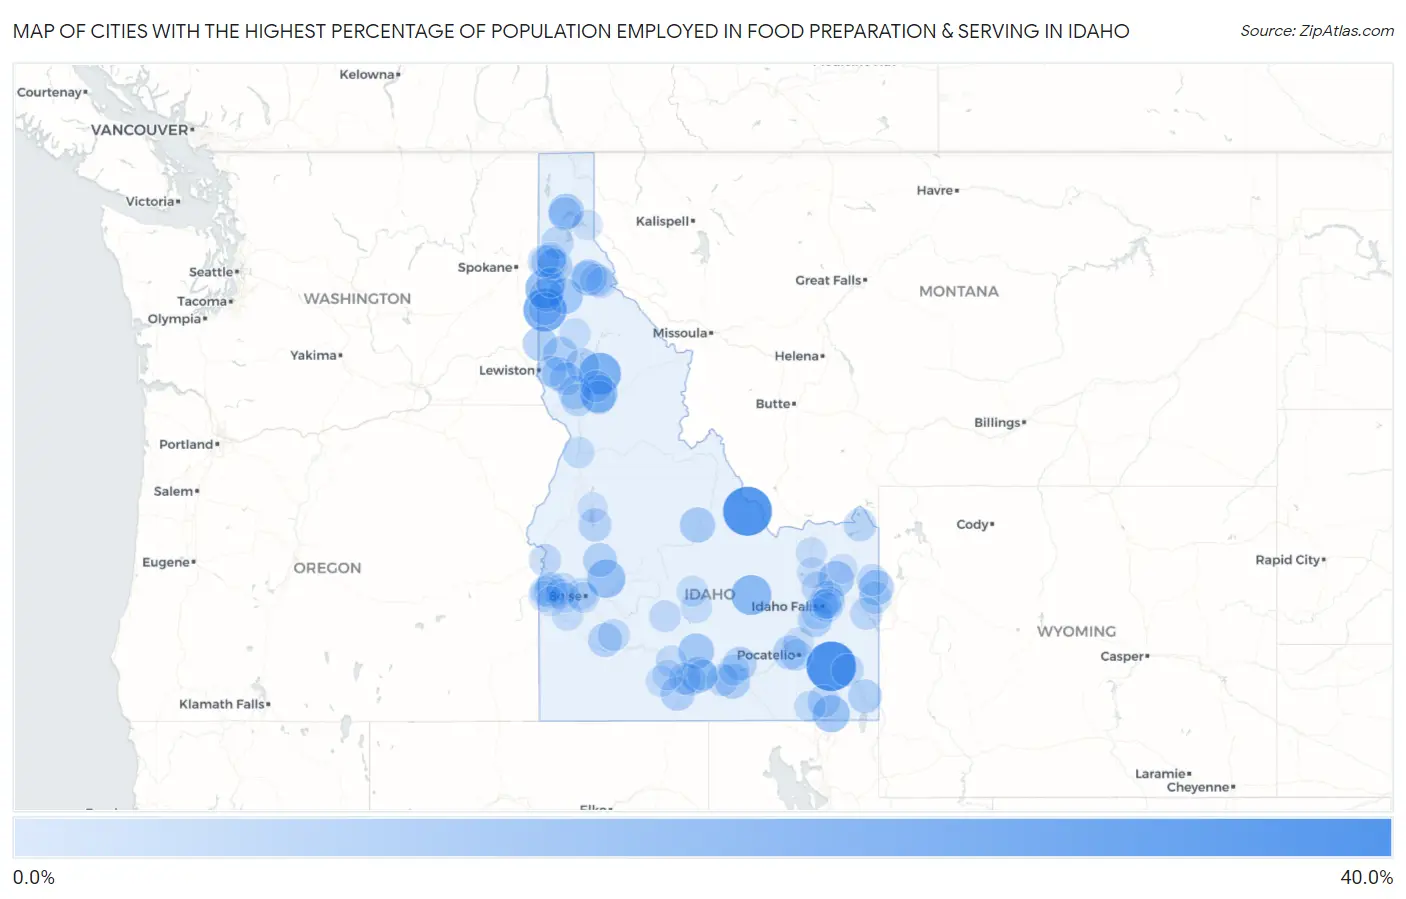
Map of Cities with the Highest Percentage of Population Employed in Food Preparation & Serving in Idaho
0.0%
40.0%
Cities with the Highest Percentage of Population Employed in Food Preparation & Serving in Idaho
| City | % Employed | vs State | vs National | |
| 1. | Bancroft | 32.0% | 5.7%(+26.3)#1 | 5.3%(+26.7)#296 |
| 2. | Leadore | 31.0% | 5.7%(+25.4)#2 | 5.3%(+25.7)#318 |
| 3. | Laclede | 28.2% | 5.7%(+22.5)#3 | 5.3%(+22.9)#393 |
| 4. | De Smet | 22.9% | 5.7%(+17.2)#4 | 5.3%(+17.6)#625 |
| 5. | Hammett | 22.8% | 5.7%(+17.2)#5 | 5.3%(+17.5)#626 |
| 6. | Weippe | 21.1% | 5.7%(+15.4)#6 | 5.3%(+15.8)#729 |
| 7. | Arco | 18.6% | 5.7%(+12.9)#7 | 5.3%(+13.3)#998 |
| 8. | Worley | 17.4% | 5.7%(+11.7)#8 | 5.3%(+12.1)#1,147 |
| 9. | Idaho City | 15.9% | 5.7%(+10.2)#9 | 5.3%(+10.6)#1,435 |
| 10. | Kooskia | 15.3% | 5.7%(+9.66)#10 | 5.3%(+10.0)#1,548 |
| 11. | Preston | 14.3% | 5.7%(+8.64)#11 | 5.3%(+9.03)#1,807 |
| 12. | Kellogg | 13.2% | 5.7%(+7.51)#12 | 5.3%(+7.90)#2,189 |
| 13. | Eden | 12.6% | 5.7%(+6.93)#13 | 5.3%(+7.31)#2,440 |
| 14. | Dietrich | 12.5% | 5.7%(+6.83)#14 | 5.3%(+7.21)#2,495 |
| 15. | St Maries | 12.5% | 5.7%(+6.79)#15 | 5.3%(+7.18)#2,536 |
| 16. | Rexburg | 12.4% | 5.7%(+6.75)#16 | 5.3%(+7.14)#2,550 |
| 17. | Challis | 12.0% | 5.7%(+6.28)#17 | 5.3%(+6.67)#2,789 |
| 18. | Driggs | 11.7% | 5.7%(+6.04)#18 | 5.3%(+6.43)#2,930 |
| 19. | Ponderay | 11.7% | 5.7%(+6.03)#19 | 5.3%(+6.42)#2,939 |
| 20. | Declo | 11.4% | 5.7%(+5.77)#20 | 5.3%(+6.15)#3,098 |
| 21. | Fernan Lake Village | 11.1% | 5.7%(+5.44)#21 | 5.3%(+5.83)#3,321 |
| 22. | Huetter | 10.9% | 5.7%(+5.20)#22 | 5.3%(+5.58)#3,468 |
| 23. | Moscow | 10.7% | 5.7%(+5.01)#23 | 5.3%(+5.40)#3,594 |
| 24. | Kendrick | 10.7% | 5.7%(+4.98)#24 | 5.3%(+5.37)#3,616 |
| 25. | Gannett | 10.6% | 5.7%(+4.93)#25 | 5.3%(+5.32)#3,652 |
| 26. | Firth | 10.4% | 5.7%(+4.77)#26 | 5.3%(+5.16)#3,763 |
| 27. | Hollister | 10.3% | 5.7%(+4.65)#27 | 5.3%(+5.04)#3,851 |
| 28. | Arbon Valley | 10.1% | 5.7%(+4.42)#28 | 5.3%(+4.81)#4,024 |
| 29. | Mountain Home Afb | 10.1% | 5.7%(+4.40)#29 | 5.3%(+4.79)#4,042 |
| 30. | Garden Valley | 10.0% | 5.7%(+4.36)#30 | 5.3%(+4.75)#4,068 |
| 31. | Minidoka | 10.0% | 5.7%(+4.33)#31 | 5.3%(+4.71)#4,110 |
| 32. | Culdesac | 9.9% | 5.7%(+4.26)#32 | 5.3%(+4.65)#4,164 |
| 33. | Montpelier | 9.9% | 5.7%(+4.22)#33 | 5.3%(+4.61)#4,195 |
| 34. | Orofino | 9.8% | 5.7%(+4.15)#34 | 5.3%(+4.54)#4,247 |
| 35. | Plummer | 9.8% | 5.7%(+4.14)#35 | 5.3%(+4.53)#4,251 |
| 36. | Stites | 9.6% | 5.7%(+3.94)#36 | 5.3%(+4.33)#4,431 |
| 37. | Ucon | 9.6% | 5.7%(+3.94)#37 | 5.3%(+4.32)#4,436 |
| 38. | Ferdinand | 9.4% | 5.7%(+3.70)#38 | 5.3%(+4.09)#4,665 |
| 39. | Sandpoint | 9.1% | 5.7%(+3.39)#39 | 5.3%(+3.78)#4,997 |
| 40. | Greenleaf | 9.0% | 5.7%(+3.34)#40 | 5.3%(+3.73)#5,041 |
| 41. | Cascade | 9.0% | 5.7%(+3.30)#41 | 5.3%(+3.68)#5,102 |
| 42. | Reubens | 8.8% | 5.7%(+3.15)#42 | 5.3%(+3.54)#5,291 |
| 43. | Osburn | 8.6% | 5.7%(+2.95)#43 | 5.3%(+3.33)#5,521 |
| 44. | Cottonwood | 8.4% | 5.7%(+2.70)#44 | 5.3%(+3.08)#5,819 |
| 45. | Island Park | 8.3% | 5.7%(+2.66)#45 | 5.3%(+3.05)#5,889 |
| 46. | Tensed | 8.3% | 5.7%(+2.66)#46 | 5.3%(+3.05)#5,900 |
| 47. | Oxford | 8.3% | 5.7%(+2.66)#47 | 5.3%(+3.05)#5,902 |
| 48. | Victor | 8.2% | 5.7%(+2.57)#48 | 5.3%(+2.96)#5,999 |
| 49. | Athol | 7.9% | 5.7%(+2.27)#49 | 5.3%(+2.66)#6,418 |
| 50. | Irwin | 7.9% | 5.7%(+2.26)#50 | 5.3%(+2.65)#6,439 |
| 51. | Soda Springs | 7.9% | 5.7%(+2.25)#51 | 5.3%(+2.64)#6,457 |
| 52. | Roberts | 7.8% | 5.7%(+2.17)#52 | 5.3%(+2.56)#6,594 |
| 53. | Kimberly | 7.8% | 5.7%(+2.15)#53 | 5.3%(+2.54)#6,623 |
| 54. | Twin Falls | 7.8% | 5.7%(+2.08)#54 | 5.3%(+2.47)#6,736 |
| 55. | Burley | 7.7% | 5.7%(+2.06)#55 | 5.3%(+2.45)#6,763 |
| 56. | Payette | 7.7% | 5.7%(+2.01)#56 | 5.3%(+2.40)#6,871 |
| 57. | Post Falls | 7.6% | 5.7%(+1.98)#57 | 5.3%(+2.36)#6,915 |
| 58. | Kamiah | 7.6% | 5.7%(+1.97)#58 | 5.3%(+2.35)#6,931 |
| 59. | Mountain Home | 7.5% | 5.7%(+1.79)#59 | 5.3%(+2.17)#7,193 |
| 60. | Iona | 7.4% | 5.7%(+1.77)#60 | 5.3%(+2.16)#7,212 |
| 61. | Middleton | 7.3% | 5.7%(+1.64)#61 | 5.3%(+2.03)#7,436 |
| 62. | Fairfield | 7.3% | 5.7%(+1.59)#62 | 5.3%(+1.98)#7,500 |
| 63. | Shelley | 7.2% | 5.7%(+1.51)#63 | 5.3%(+1.90)#7,641 |
| 64. | Pocatello | 7.2% | 5.7%(+1.48)#64 | 5.3%(+1.87)#7,693 |
| 65. | Tetonia | 7.1% | 5.7%(+1.47)#65 | 5.3%(+1.86)#7,726 |
| 66. | Malad City | 6.8% | 5.7%(+1.12)#66 | 5.3%(+1.51)#8,409 |
| 67. | Garden City | 6.8% | 5.7%(+1.11)#67 | 5.3%(+1.50)#8,430 |
| 68. | Wendell | 6.7% | 5.7%(+1.05)#68 | 5.3%(+1.44)#8,561 |
| 69. | Melba | 6.7% | 5.7%(+1.02)#69 | 5.3%(+1.41)#8,622 |
| 70. | Avimor | 6.7% | 5.7%(+0.993)#70 | 5.3%(+1.38)#8,674 |
| 71. | Riggins | 6.7% | 5.7%(+0.993)#71 | 5.3%(+1.38)#8,690 |
| 72. | Acequia | 6.7% | 5.7%(+0.993)#72 | 5.3%(+1.38)#8,697 |
| 73. | Bellevue | 6.6% | 5.7%(+0.947)#73 | 5.3%(+1.33)#8,799 |
| 74. | Sun Valley | 6.6% | 5.7%(+0.894)#74 | 5.3%(+1.28)#8,935 |
| 75. | Wallace | 6.5% | 5.7%(+0.873)#75 | 5.3%(+1.26)#8,978 |
| 76. | Lapwai | 6.5% | 5.7%(+0.848)#76 | 5.3%(+1.24)#9,026 |
| 77. | Castleford | 6.4% | 5.7%(+0.737)#77 | 5.3%(+1.12)#9,312 |
| 78. | Hazelton | 6.4% | 5.7%(+0.718)#78 | 5.3%(+1.10)#9,350 |
| 79. | Bovill | 6.3% | 5.7%(+0.676)#79 | 5.3%(+1.06)#9,443 |
| 80. | Notus | 6.3% | 5.7%(+0.671)#80 | 5.3%(+1.06)#9,454 |
| 81. | Coeur D Alene | 6.3% | 5.7%(+0.616)#81 | 5.3%(+1.00)#9,568 |
| 82. | Boise City | 6.3% | 5.7%(+0.605)#82 | 5.3%(+0.992)#9,596 |
| 83. | Idaho Falls | 6.3% | 5.7%(+0.587)#83 | 5.3%(+0.974)#9,632 |
| 84. | Homedale | 6.0% | 5.7%(+0.365)#84 | 5.3%(+0.752)#10,234 |
| 85. | Wilder | 6.0% | 5.7%(+0.348)#85 | 5.3%(+0.735)#10,286 |
| 86. | Fort Hall | 6.0% | 5.7%(+0.347)#86 | 5.3%(+0.734)#10,288 |
| 87. | Dubois | 5.9% | 5.7%(+0.250)#87 | 5.3%(+0.637)#10,514 |
| 88. | Hamer | 5.9% | 5.7%(+0.209)#88 | 5.3%(+0.596)#10,621 |
| 89. | Hayden | 5.9% | 5.7%(+0.203)#89 | 5.3%(+0.590)#10,627 |
| 90. | Buhl | 5.7% | 5.7%(+0.041)#90 | 5.3%(+0.428)#11,034 |
| 91. | Smelterville | 5.7% | 5.7%(+0.026)#91 | 5.3%(+0.413)#11,088 |
| 92. | Caldwell | 5.5% | 5.7%(-0.130)#92 | 5.3%(+0.257)#11,538 |
| 93. | Clark Fork | 5.3% | 5.7%(-0.337)#93 | 5.3%(+0.050)#12,060 |
| 94. | Nampa | 5.3% | 5.7%(-0.379)#94 | 5.3%(+0.009)#12,167 |
| 95. | Donnelly | 5.3% | 5.7%(-0.410)#95 | 5.3%(-0.023)#12,270 |
| 96. | Marsing | 5.2% | 5.7%(-0.431)#96 | 5.3%(-0.043)#12,329 |
| 97. | Harrison | 5.1% | 5.7%(-0.571)#97 | 5.3%(-0.184)#12,730 |
| 98. | Ammon | 5.1% | 5.7%(-0.621)#98 | 5.3%(-0.234)#12,860 |
| 99. | Lincoln | 5.0% | 5.7%(-0.637)#99 | 5.3%(-0.250)#12,918 |
| 100. | St Anthony | 5.0% | 5.7%(-0.651)#100 | 5.3%(-0.264)#12,950 |
Common Questions
What are the Top 10 Cities with the Highest Percentage of Population Employed in Food Preparation & Serving in Idaho?
Top 10 Cities with the Highest Percentage of Population Employed in Food Preparation & Serving in Idaho are:
What city has the Highest Percentage of Population Employed in Food Preparation & Serving in Idaho?
Bancroft has the Highest Percentage of Population Employed in Food Preparation & Serving in Idaho with 32.0%.
What is the Percentage of Population Employed in Food Preparation & Serving in the State of Idaho?
Percentage of Population Employed in Food Preparation & Serving in Idaho is 5.7%.
What is the Percentage of Population Employed in Food Preparation & Serving in the United States?
Percentage of Population Employed in Food Preparation & Serving in the United States is 5.3%.