Yosemite Valley, CA Map & Demographics
Yosemite Valley Map
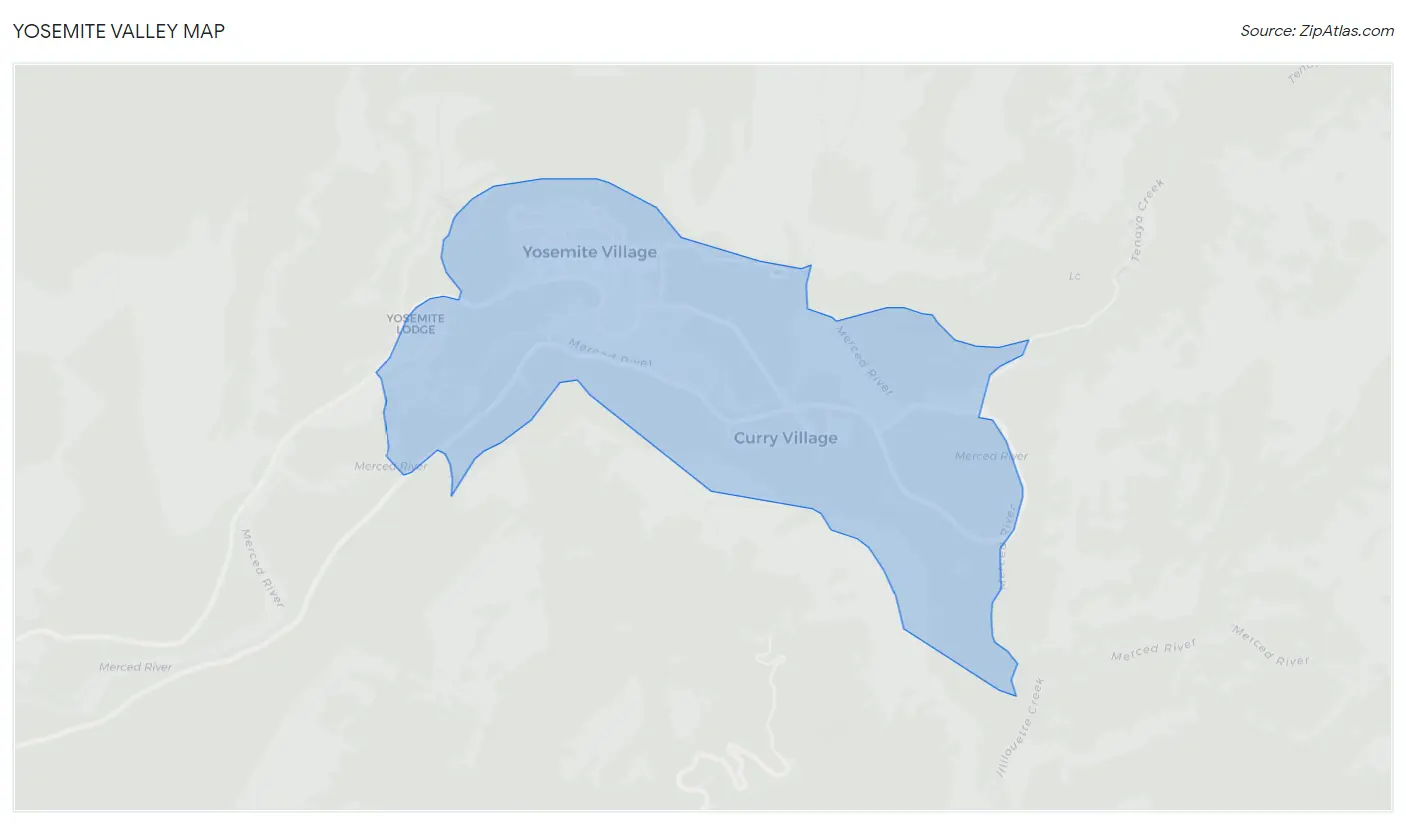
Yosemite Valley Overview
$34,905
PER CAPITA INCOME
$40,987
AVG HOUSEHOLD INCOME
4.7%
WAGE / INCOME GAP [ % ]
95.3¢/ $1
WAGE / INCOME GAP [ $ ]
0.29
INEQUALITY / GINI INDEX
1,737
TOTAL POPULATION
1,223
MALE POPULATION
514
FEMALE POPULATION
237.94
MALES / 100 FEMALES
42.03
FEMALES / 100 MALES
32.7
MEDIAN AGE
2.4
AVG FAMILY SIZE
1.1
AVG HOUSEHOLD SIZE
1,535
LABOR FORCE [ PEOPLE ]
89.9%
PERCENT IN LABOR FORCE
4.5%
UNEMPLOYMENT RATE
Income in Yosemite Valley
Income Overview in Yosemite Valley
| Characteristic | Number | Measure |
| Per Capita Income | 1,737 | $34,905 |
| Median Family Income | 17 | $0 |
| Mean Family Income | 17 | $0 |
| Median Household Income | 185 | $40,987 |
| Mean Household Income | 185 | $51,721 |
| Income Deficit | 17 | $0 |
| Wage / Income Gap (%) | 1,737 | 4.74% |
| Wage / Income Gap ($) | 1,737 | 95.26¢ per $1 |
| Gini / Inequality Index | 1,737 | 0.29 |
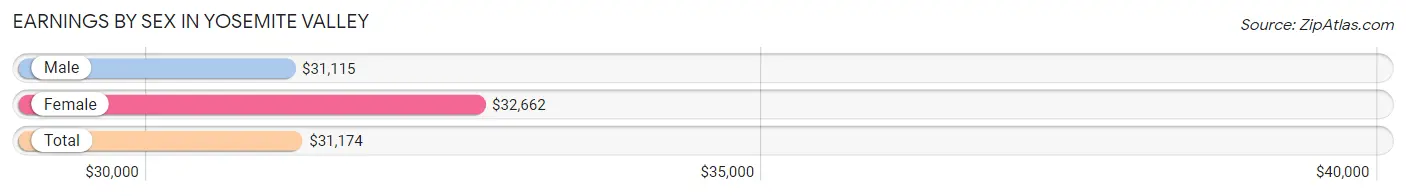
Earnings by Sex in Yosemite Valley
Average Earnings in Yosemite Valley are $31,174, $31,115 for men and $32,662 for women, a difference of 4.7%.
| Sex | Number | Average Earnings |
| Male | 1,134 (72.5%) | $31,115 |
| Female | 431 (27.5%) | $32,662 |
| Total | 1,565 (100.0%) | $31,174 |
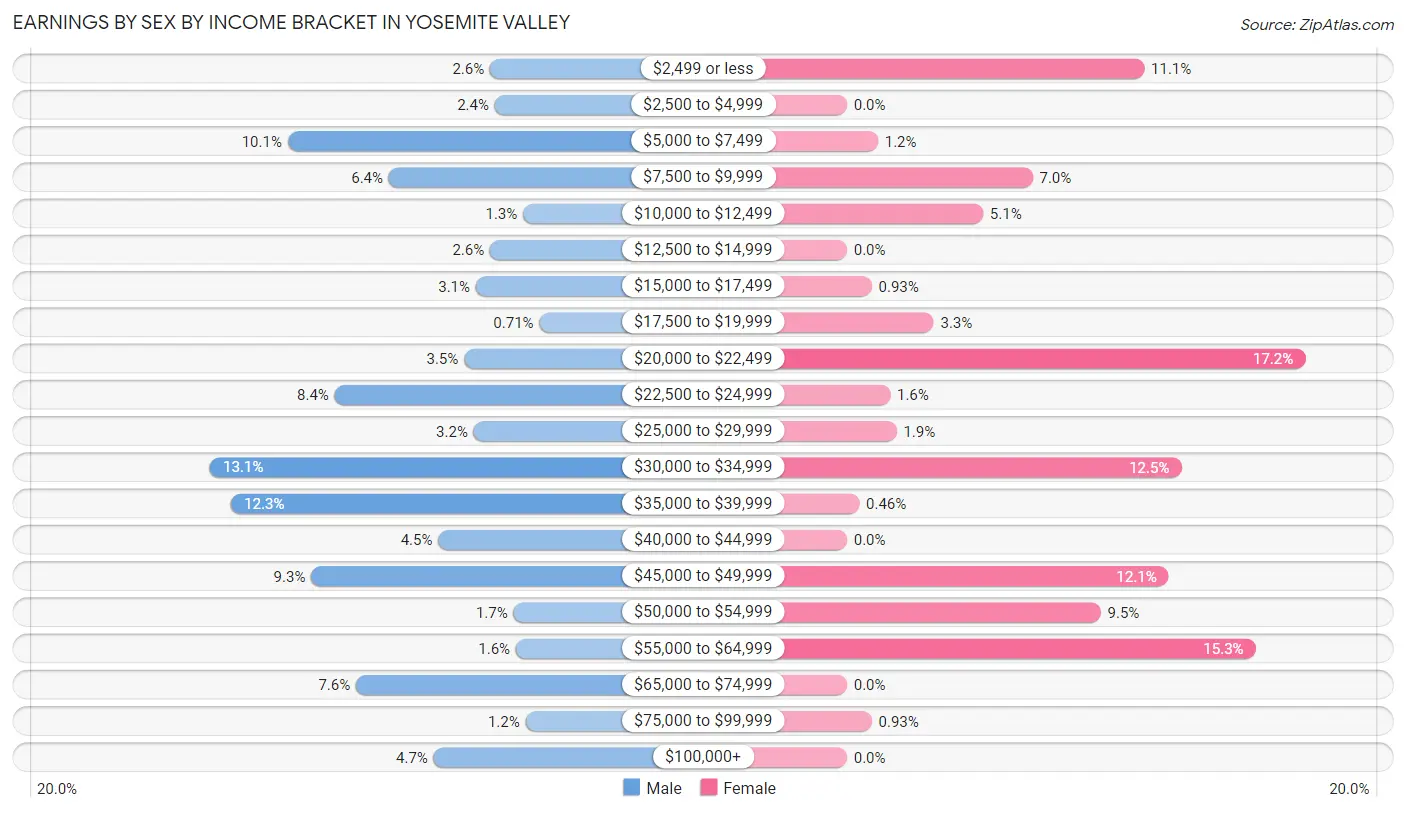
Earnings by Sex by Income Bracket in Yosemite Valley
The most common earnings brackets in Yosemite Valley are $30,000 to $34,999 for men (148 | 13.1%) and $20,000 to $22,499 for women (74 | 17.2%).
| Income | Male | Female |
| $2,499 or less | 29 (2.6%) | 48 (11.1%) |
| $2,500 to $4,999 | 27 (2.4%) | 0 (0.0%) |
| $5,000 to $7,499 | 115 (10.1%) | 5 (1.2%) |
| $7,500 to $9,999 | 72 (6.4%) | 30 (7.0%) |
| $10,000 to $12,499 | 15 (1.3%) | 22 (5.1%) |
| $12,500 to $14,999 | 29 (2.6%) | 0 (0.0%) |
| $15,000 to $17,499 | 35 (3.1%) | 4 (0.9%) |
| $17,500 to $19,999 | 8 (0.7%) | 14 (3.3%) |
| $20,000 to $22,499 | 40 (3.5%) | 74 (17.2%) |
| $22,500 to $24,999 | 95 (8.4%) | 7 (1.6%) |
| $25,000 to $29,999 | 36 (3.2%) | 8 (1.9%) |
| $30,000 to $34,999 | 148 (13.1%) | 54 (12.5%) |
| $35,000 to $39,999 | 139 (12.3%) | 2 (0.5%) |
| $40,000 to $44,999 | 51 (4.5%) | 0 (0.0%) |
| $45,000 to $49,999 | 105 (9.3%) | 52 (12.1%) |
| $50,000 to $54,999 | 19 (1.7%) | 41 (9.5%) |
| $55,000 to $64,999 | 18 (1.6%) | 66 (15.3%) |
| $65,000 to $74,999 | 86 (7.6%) | 0 (0.0%) |
| $75,000 to $99,999 | 14 (1.2%) | 4 (0.9%) |
| $100,000+ | 53 (4.7%) | 0 (0.0%) |
| Total | 1,134 (100.0%) | 431 (100.0%) |
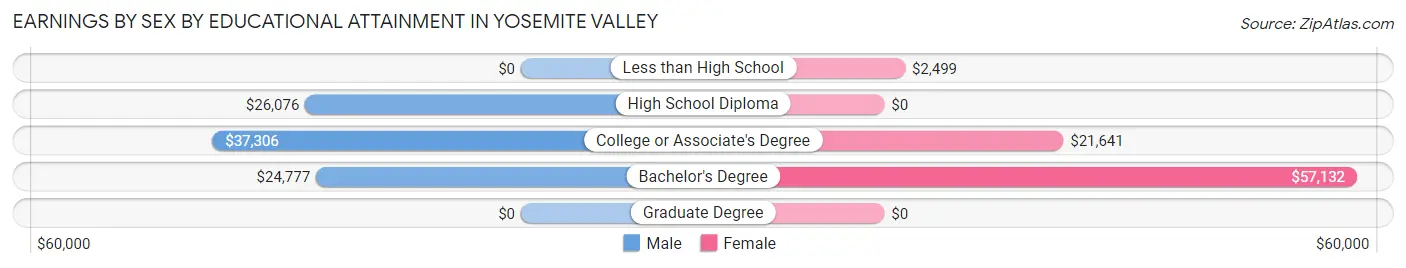
Earnings by Sex by Educational Attainment in Yosemite Valley
Average earnings in Yosemite Valley are $31,758 for men and $45,120 for women, a difference of 29.6%. Men with an educational attainment of college or associate's degree enjoy the highest average annual earnings of $37,306, while those with bachelor's degree education earn the least with $24,777. Women with an educational attainment of bachelor's degree earn the most with the average annual earnings of $57,132, while those with less than high school education have the smallest earnings of $2,499.
| Educational Attainment | Male Income | Female Income |
| Less than High School | - | - |
| High School Diploma | $26,076 | $0 |
| College or Associate's Degree | $37,306 | $21,641 |
| Bachelor's Degree | $24,777 | $57,132 |
| Graduate Degree | - | - |
| Total | $31,758 | $45,120 |
Family Income in Yosemite Valley
Family Income Brackets in Yosemite Valley
According to the Yosemite Valley family income data, there are 17 families falling into the $50,000 to $74,999 income range, which is the most common income bracket and makes up 100.0% of all families.
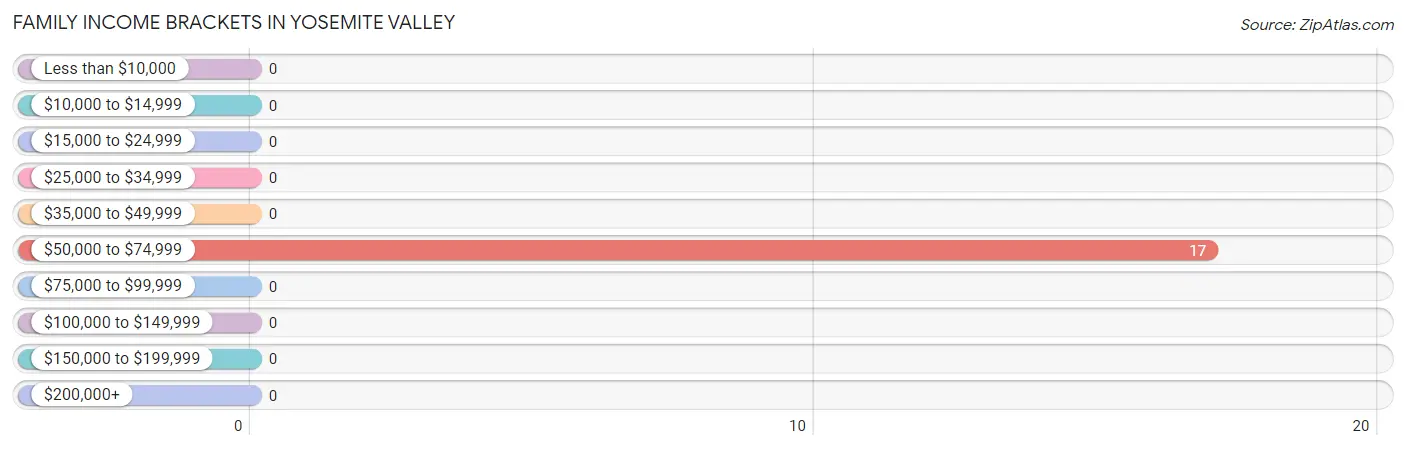
| Income Bracket | # Families | % Families |
| Less than $10,000 | 0 | 0.0% |
| $10,000 to $14,999 | 0 | 0.0% |
| $15,000 to $24,999 | 0 | 0.0% |
| $25,000 to $34,999 | 0 | 0.0% |
| $35,000 to $49,999 | 0 | 0.0% |
| $50,000 to $74,999 | 17 | 100.0% |
| $75,000 to $99,999 | 0 | 0.0% |
| $100,000 to $149,999 | 0 | 0.0% |
| $150,000 to $199,999 | 0 | 0.0% |
| $200,000+ | 0 | 0.0% |
Family Income by Famaliy Size in Yosemite Valley
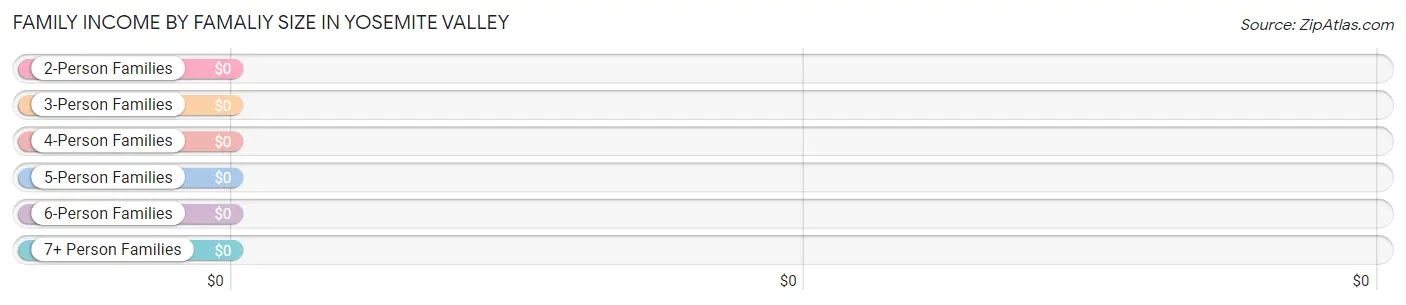
| Income Bracket | # Families | Median Income |
| 2-Person Families | 17 (100.0%) | $0 |
| 3-Person Families | 0 (0.0%) | $0 |
| 4-Person Families | 0 (0.0%) | $0 |
| 5-Person Families | 0 (0.0%) | $0 |
| 6-Person Families | 0 (0.0%) | $0 |
| 7+ Person Families | 0 (0.0%) | $0 |
| Total | 17 (100.0%) | $0 |
Family Income by Number of Earners in Yosemite Valley
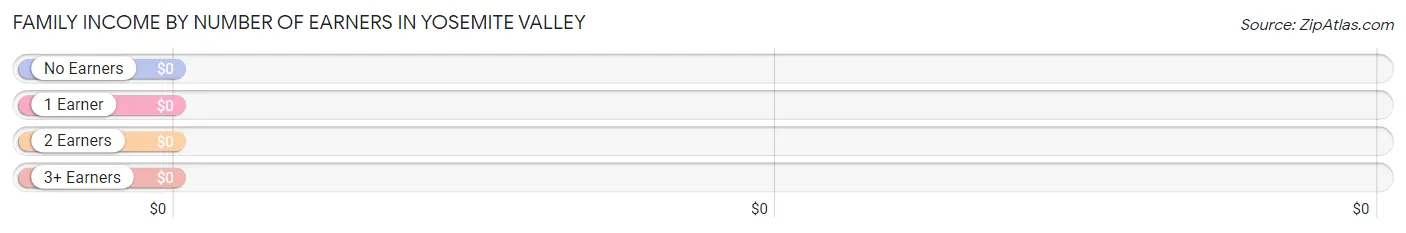
| Number of Earners | # Families | Median Income |
| No Earners | 0 (0.0%) | $0 |
| 1 Earner | 0 (0.0%) | $0 |
| 2 Earners | 17 (100.0%) | $0 |
| 3+ Earners | 0 (0.0%) | $0 |
| Total | 17 (100.0%) | $0 |
Household Income in Yosemite Valley
Household Income Brackets in Yosemite Valley
With 70 households falling in the category, the $25,000 to $34,999 income range is the most frequent in Yosemite Valley, accounting for 37.8% of all households.
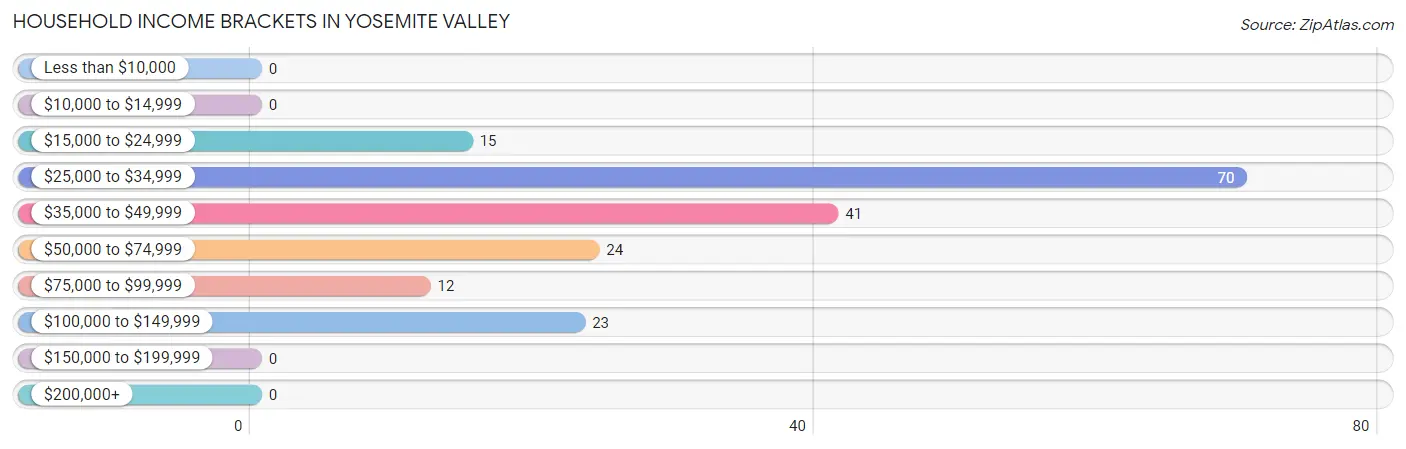
| Income Bracket | # Households | % Households |
| Less than $10,000 | 0 | 0.0% |
| $10,000 to $14,999 | 0 | 0.0% |
| $15,000 to $24,999 | 15 | 8.1% |
| $25,000 to $34,999 | 70 | 37.8% |
| $35,000 to $49,999 | 41 | 22.2% |
| $50,000 to $74,999 | 24 | 13.0% |
| $75,000 to $99,999 | 12 | 6.5% |
| $100,000 to $149,999 | 23 | 12.4% |
| $150,000 to $199,999 | 0 | 0.0% |
| $200,000+ | 0 | 0.0% |
Household Income by Householder Age in Yosemite Valley
The median household income in Yosemite Valley is $40,987, with the highest median household income of $31,921 found in the 45 to 64 years age bracket for the primary householder. A total of 83 households (44.9%) fall into this category.
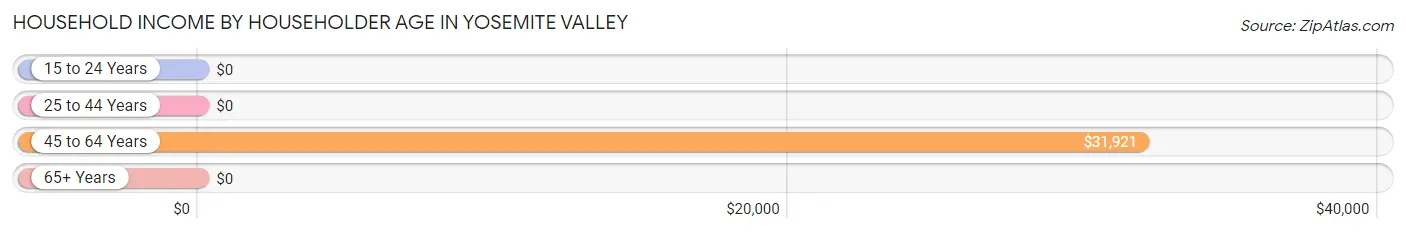
| Income Bracket | # Households | Median Income |
| 15 to 24 Years | 0 (0.0%) | $0 |
| 25 to 44 Years | 71 (38.4%) | $0 |
| 45 to 64 Years | 83 (44.9%) | $31,921 |
| 65+ Years | 31 (16.8%) | $0 |
| Total | 185 (100.0%) | $40,987 |
Poverty in Yosemite Valley
Income Below Poverty by Sex and Age in Yosemite Valley
With 24.1% poverty level for males and 18.3% for females among the residents of Yosemite Valley, 75 year old and over males and 25 to 34 year old females are the most vulnerable to poverty, with 2 males (100.0%) and 64 females (40.8%) in their respective age groups living below the poverty level.
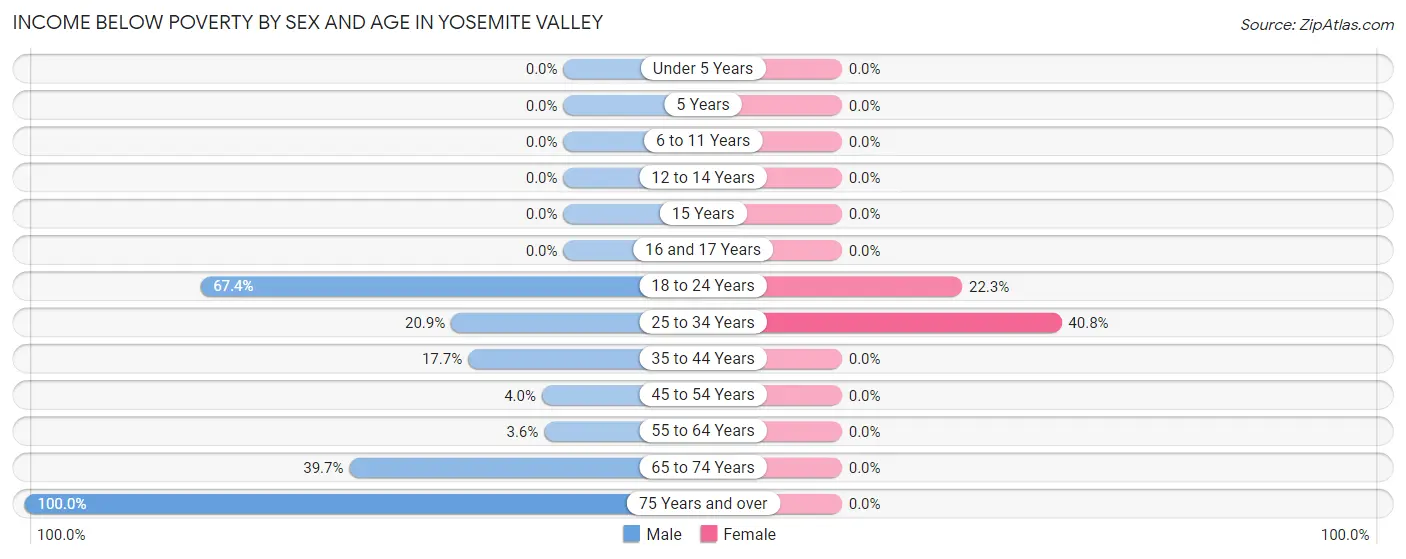
| Age Bracket | Male | Female |
| Under 5 Years | 0 (0.0%) | 0 (0.0%) |
| 5 Years | 0 (0.0%) | 0 (0.0%) |
| 6 to 11 Years | 0 (0.0%) | 0 (0.0%) |
| 12 to 14 Years | 0 (0.0%) | 0 (0.0%) |
| 15 Years | 0 (0.0%) | 0 (0.0%) |
| 16 and 17 Years | 0 (0.0%) | 0 (0.0%) |
| 18 to 24 Years | 122 (67.4%) | 25 (22.3%) |
| 25 to 34 Years | 93 (20.8%) | 64 (40.8%) |
| 35 to 44 Years | 37 (17.7%) | 0 (0.0%) |
| 45 to 54 Years | 8 (4.0%) | 0 (0.0%) |
| 55 to 64 Years | 4 (3.6%) | 0 (0.0%) |
| 65 to 74 Years | 29 (39.7%) | 0 (0.0%) |
| 75 Years and over | 2 (100.0%) | 0 (0.0%) |
| Total | 295 (24.1%) | 89 (18.3%) |
Income Above Poverty by Sex and Age in Yosemite Valley
According to the poverty statistics in Yosemite Valley, males aged 55 to 64 years and females aged 16 and 17 years are the age groups that are most secure financially, with 96.4% of males and 100.0% of females in these age groups living above the poverty line.
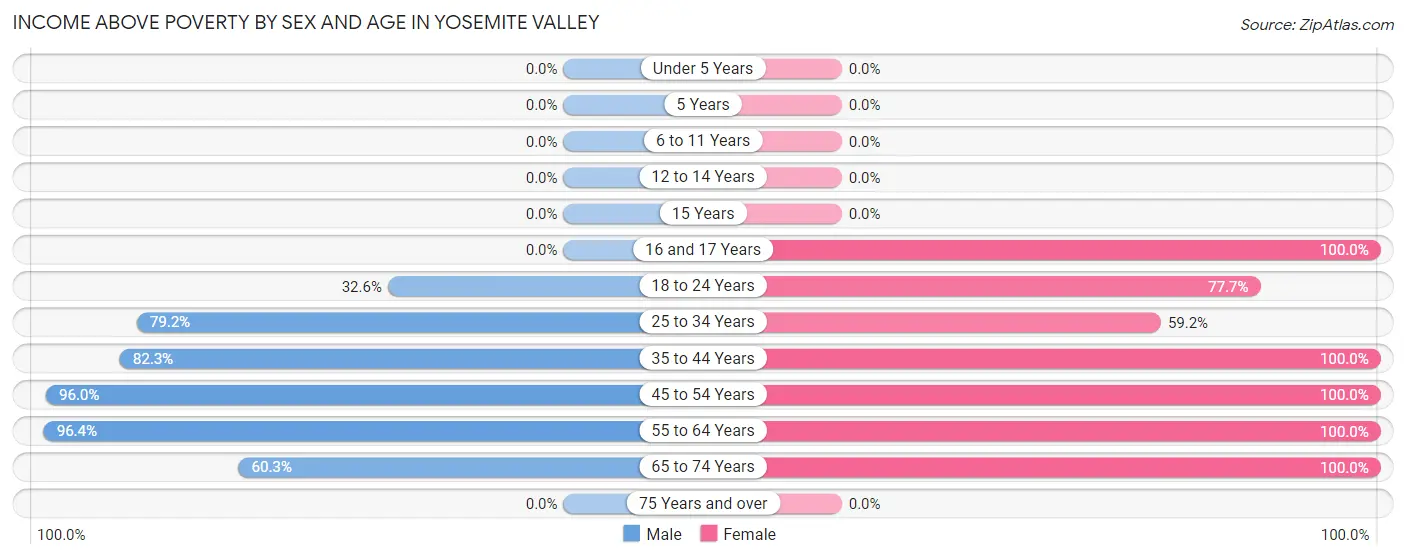
| Age Bracket | Male | Female |
| Under 5 Years | 0 (0.0%) | 0 (0.0%) |
| 5 Years | 0 (0.0%) | 0 (0.0%) |
| 6 to 11 Years | 0 (0.0%) | 0 (0.0%) |
| 12 to 14 Years | 0 (0.0%) | 0 (0.0%) |
| 15 Years | 0 (0.0%) | 0 (0.0%) |
| 16 and 17 Years | 0 (0.0%) | 23 (100.0%) |
| 18 to 24 Years | 59 (32.6%) | 87 (77.7%) |
| 25 to 34 Years | 353 (79.1%) | 93 (59.2%) |
| 35 to 44 Years | 172 (82.3%) | 132 (100.0%) |
| 45 to 54 Years | 192 (96.0%) | 11 (100.0%) |
| 55 to 64 Years | 108 (96.4%) | 39 (100.0%) |
| 65 to 74 Years | 44 (60.3%) | 11 (100.0%) |
| 75 Years and over | 0 (0.0%) | 0 (0.0%) |
| Total | 928 (75.9%) | 396 (81.7%) |
Income Below Poverty Among Married-Couple Families in Yosemite Valley
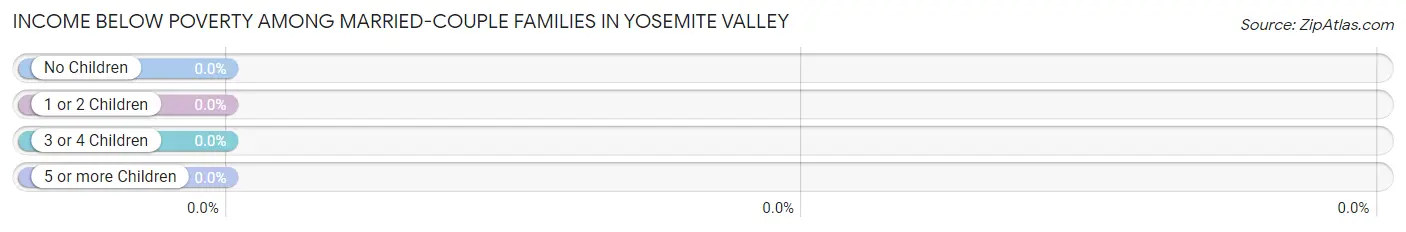
| Children | Above Poverty | Below Poverty |
| No Children | 0 (0.0%) | 0 (0.0%) |
| 1 or 2 Children | 0 (0.0%) | 0 (0.0%) |
| 3 or 4 Children | 0 (0.0%) | 0 (0.0%) |
| 5 or more Children | 0 (0.0%) | 0 (0.0%) |
| Total | 0 (0.0%) | 0 (0.0%) |
Income Below Poverty Among Single-Parent Households in Yosemite Valley
| Children | Single Father | Single Mother |
| No Children | 0 (0.0%) | 0 (0.0%) |
| 1 or 2 Children | 0 (0.0%) | 0 (0.0%) |
| 3 or 4 Children | 0 (0.0%) | 0 (0.0%) |
| 5 or more Children | 0 (0.0%) | 0 (0.0%) |
| Total | 0 (0.0%) | 0 (0.0%) |
Income Below Poverty Among Married-Couple vs Single-Parent Households in Yosemite Valley
| Children | Married-Couple Families | Single-Parent Households |
| No Children | 0 (0.0%) | 0 (0.0%) |
| 1 or 2 Children | 0 (0.0%) | 0 (0.0%) |
| 3 or 4 Children | 0 (0.0%) | 0 (0.0%) |
| 5 or more Children | 0 (0.0%) | 0 (0.0%) |
| Total | 0 (0.0%) | 0 (0.0%) |
Race in Yosemite Valley
The most populous races in Yosemite Valley are White / Caucasian (1,069 | 61.5%), Hispanic or Latino (521 | 30.0%), and Two or more Races (235 | 13.5%).
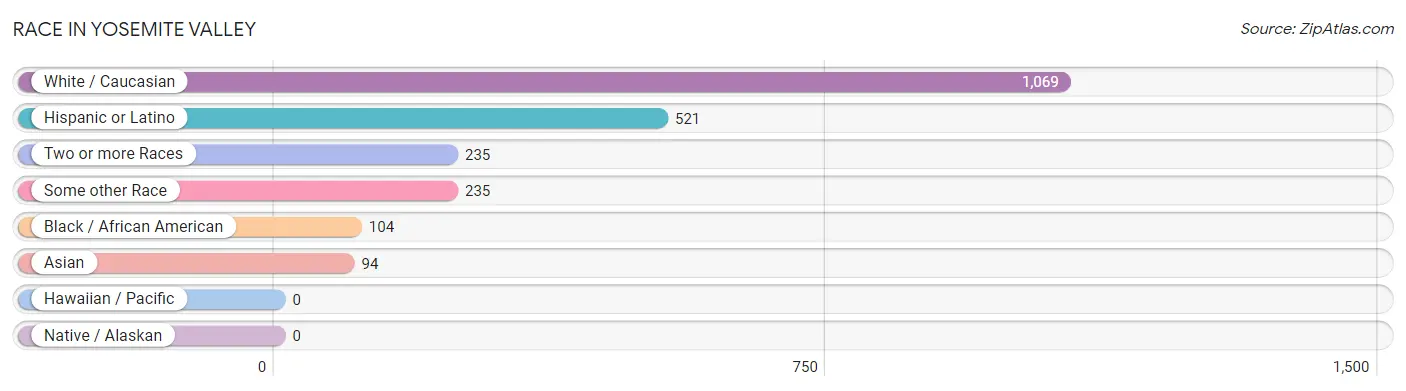
| Race | # Population | % Population |
| Asian | 94 | 5.4% |
| Black / African American | 104 | 6.0% |
| Hawaiian / Pacific | 0 | 0.0% |
| Hispanic or Latino | 521 | 30.0% |
| Native / Alaskan | 0 | 0.0% |
| White / Caucasian | 1,069 | 61.5% |
| Two or more Races | 235 | 13.5% |
| Some other Race | 235 | 13.5% |
| Total | 1,737 | 100.0% |
Ancestry in Yosemite Valley
The most populous ancestries reported in Yosemite Valley are Mexican (441 | 25.4%), German (294 | 16.9%), Irish (160 | 9.2%), English (71 | 4.1%), and Finnish (58 | 3.3%), together accounting for 59.0% of all Yosemite Valley residents.
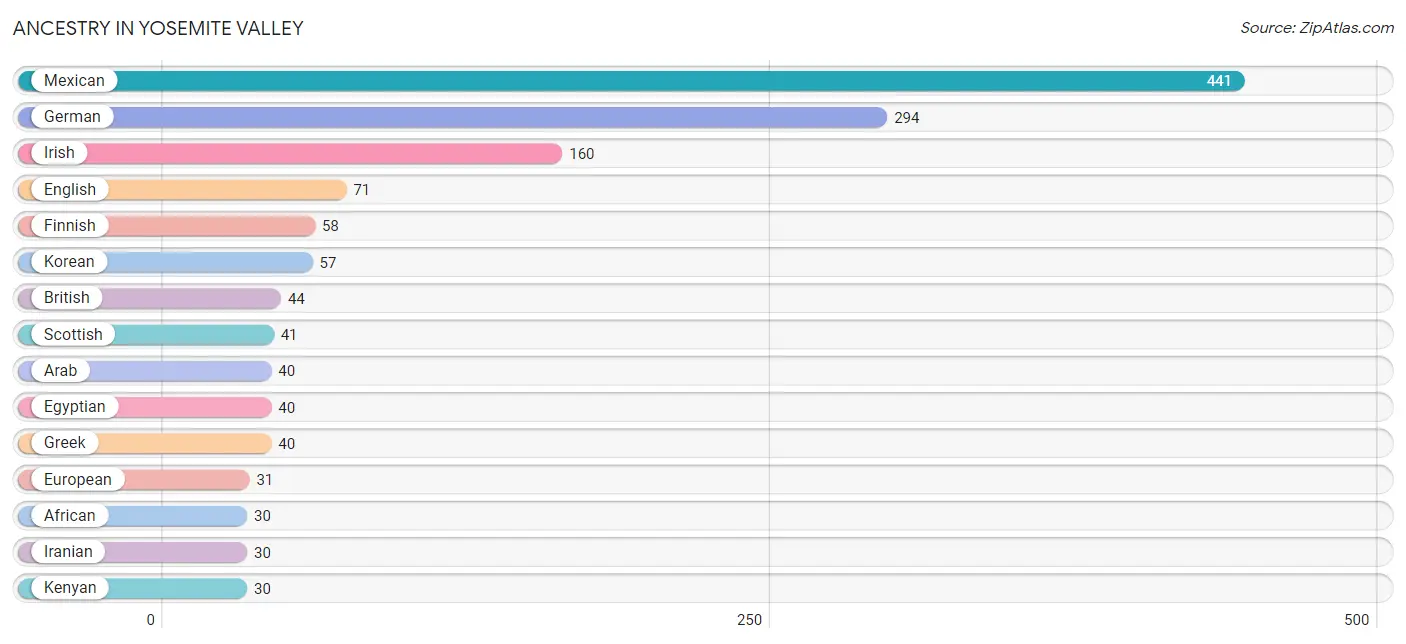
| Ancestry | # Population | % Population |
| African | 30 | 1.7% |
| Arab | 40 | 2.3% |
| Austrian | 21 | 1.2% |
| Bangladeshi | 8 | 0.5% |
| British | 44 | 2.5% |
| Burmese | 29 | 1.7% |
| Central American | 14 | 0.8% |
| Chickasaw | 12 | 0.7% |
| Croatian | 16 | 0.9% |
| Danish | 4 | 0.2% |
| Dutch | 2 | 0.1% |
| Egyptian | 40 | 2.3% |
| English | 71 | 4.1% |
| European | 31 | 1.8% |
| Finnish | 58 | 3.3% |
| German | 294 | 16.9% |
| Greek | 40 | 2.3% |
| Honduran | 12 | 0.7% |
| Houma | 7 | 0.4% |
| Hungarian | 5 | 0.3% |
| Iranian | 30 | 1.7% |
| Irish | 160 | 9.2% |
| Italian | 21 | 1.2% |
| Kenyan | 30 | 1.7% |
| Korean | 57 | 3.3% |
| Mexican | 441 | 25.4% |
| Mexican American Indian | 30 | 1.7% |
| Nicaraguan | 2 | 0.1% |
| Norwegian | 8 | 0.5% |
| Polish | 29 | 1.7% |
| Puerto Rican | 12 | 0.7% |
| Scottish | 41 | 2.4% |
| Subsaharan African | 30 | 1.7% |
| Swiss | 6 | 0.4% | View All 34 Rows |
Immigrants in Yosemite Valley
The most numerous immigrant groups reported in Yosemite Valley came from Central America (351 | 20.2%), Latin America (351 | 20.2%), Mexico (349 | 20.1%), Asia (69 | 4.0%), and Africa (30 | 1.7%), together accounting for 66.2% of all Yosemite Valley residents.
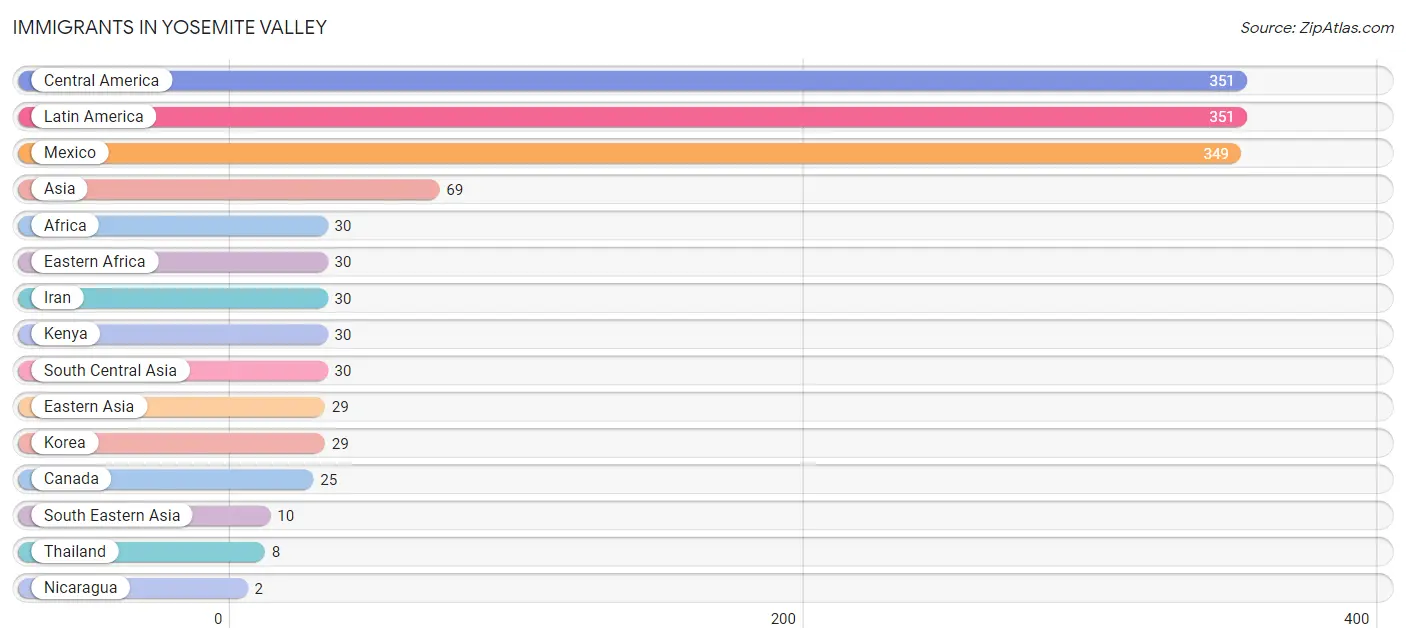
| Immigration Origin | # Population | % Population |
| Africa | 30 | 1.7% |
| Asia | 69 | 4.0% |
| Canada | 25 | 1.4% |
| Central America | 351 | 20.2% |
| Eastern Africa | 30 | 1.7% |
| Eastern Asia | 29 | 1.7% |
| Iran | 30 | 1.7% |
| Kenya | 30 | 1.7% |
| Korea | 29 | 1.7% |
| Latin America | 351 | 20.2% |
| Mexico | 349 | 20.1% |
| Nicaragua | 2 | 0.1% |
| Philippines | 2 | 0.1% |
| South Central Asia | 30 | 1.7% |
| South Eastern Asia | 10 | 0.6% |
| Thailand | 8 | 0.5% | View All 16 Rows |
Sex and Age in Yosemite Valley
Sex and Age in Yosemite Valley
The most populous age groups in Yosemite Valley are 25 to 29 Years (235 | 19.2%) for men and 25 to 29 Years (120 | 23.4%) for women.
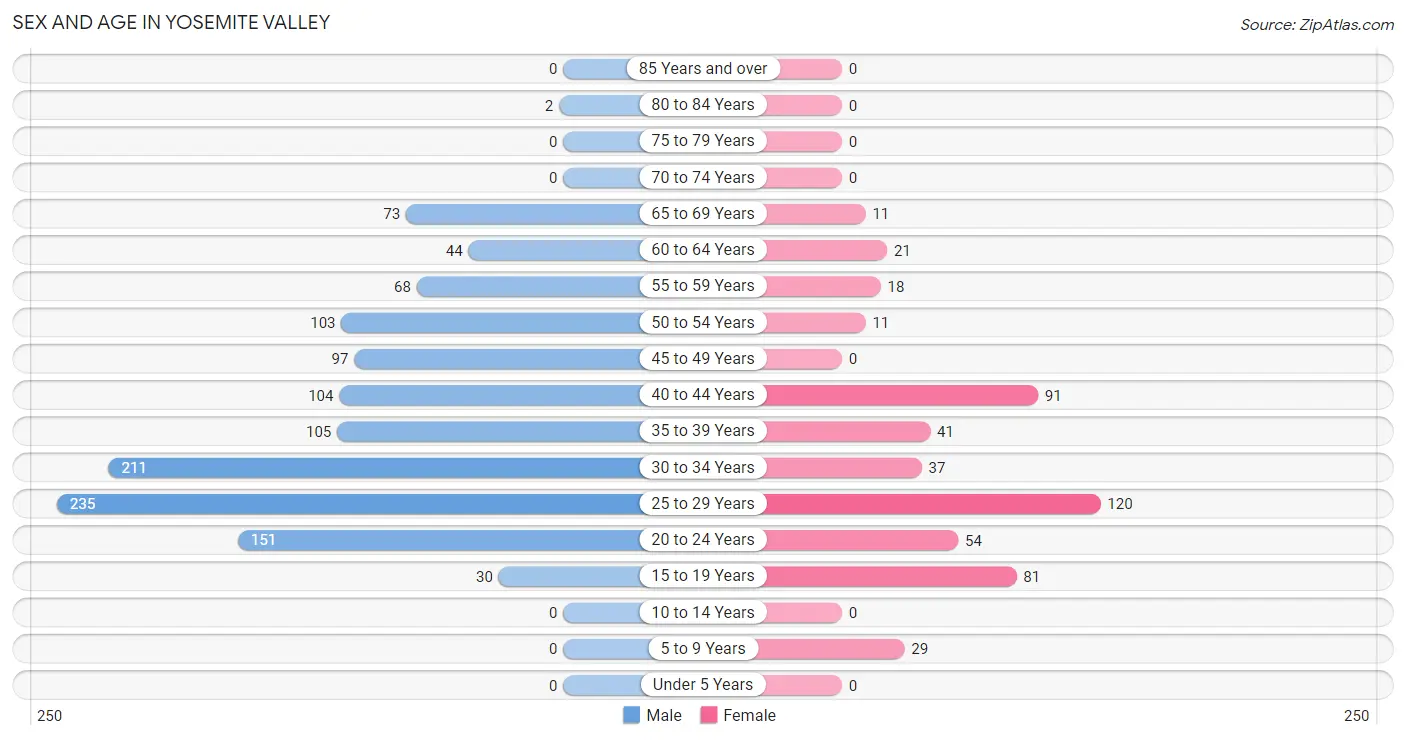
| Age Bracket | Male | Female |
| Under 5 Years | 0 (0.0%) | 0 (0.0%) |
| 5 to 9 Years | 0 (0.0%) | 29 (5.6%) |
| 10 to 14 Years | 0 (0.0%) | 0 (0.0%) |
| 15 to 19 Years | 30 (2.5%) | 81 (15.8%) |
| 20 to 24 Years | 151 (12.3%) | 54 (10.5%) |
| 25 to 29 Years | 235 (19.2%) | 120 (23.4%) |
| 30 to 34 Years | 211 (17.2%) | 37 (7.2%) |
| 35 to 39 Years | 105 (8.6%) | 41 (8.0%) |
| 40 to 44 Years | 104 (8.5%) | 91 (17.7%) |
| 45 to 49 Years | 97 (7.9%) | 0 (0.0%) |
| 50 to 54 Years | 103 (8.4%) | 11 (2.1%) |
| 55 to 59 Years | 68 (5.6%) | 18 (3.5%) |
| 60 to 64 Years | 44 (3.6%) | 21 (4.1%) |
| 65 to 69 Years | 73 (6.0%) | 11 (2.1%) |
| 70 to 74 Years | 0 (0.0%) | 0 (0.0%) |
| 75 to 79 Years | 0 (0.0%) | 0 (0.0%) |
| 80 to 84 Years | 2 (0.2%) | 0 (0.0%) |
| 85 Years and over | 0 (0.0%) | 0 (0.0%) |
| Total | 1,223 (100.0%) | 514 (100.0%) |
Families and Households in Yosemite Valley
Median Family Size in Yosemite Valley
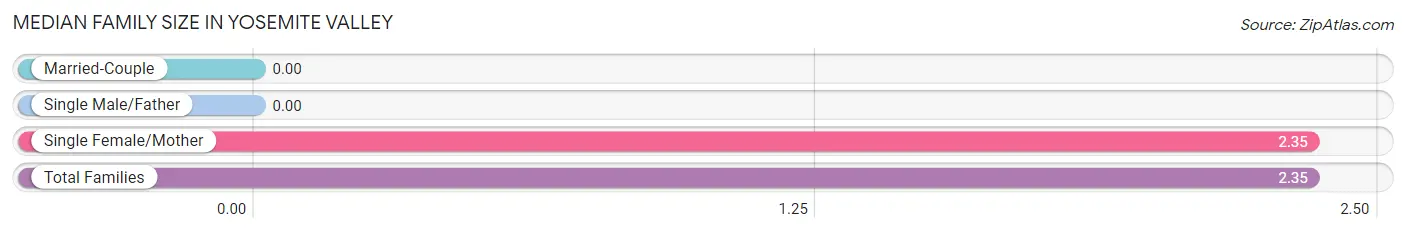
| Family Type | # Families | Family Size |
| Married-Couple | 0 (0.0%) | - |
| Single Male/Father | 0 (0.0%) | - |
| Single Female/Mother | 17 (100.0%) | 2.35 |
| Total Families | 17 (100.0%) | 2.35 |
Median Household Size in Yosemite Valley
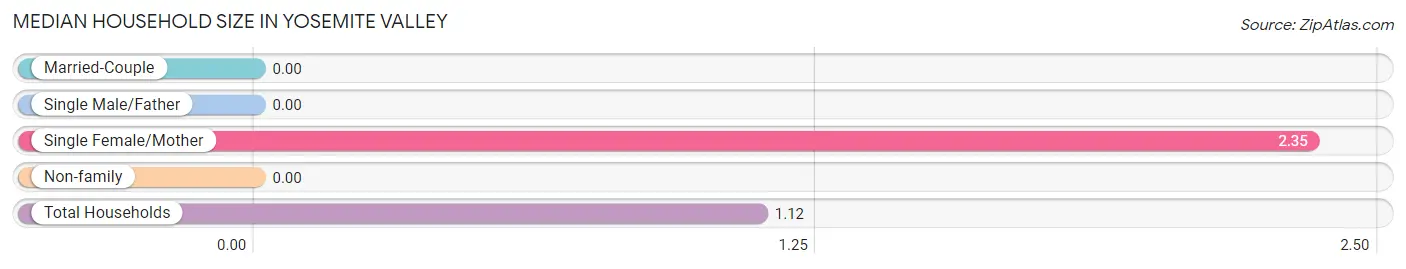
| Household Type | # Households | Household Size |
| Married-Couple | 0 (0.0%) | - |
| Single Male/Father | 0 (0.0%) | - |
| Single Female/Mother | 17 (9.2%) | 2.35 |
| Non-family | 168 (90.8%) | - |
| Total Households | 185 (100.0%) | 1.12 |
Household Size by Marriage Status in Yosemite Valley
Out of a total of 185 households in Yosemite Valley, 17 (9.2%) are family households, while 168 (90.8%) are nonfamily households. The most numerous type of family households are 2-person households, comprising 17, and the most common type of nonfamily households are 1-person households, comprising 168.
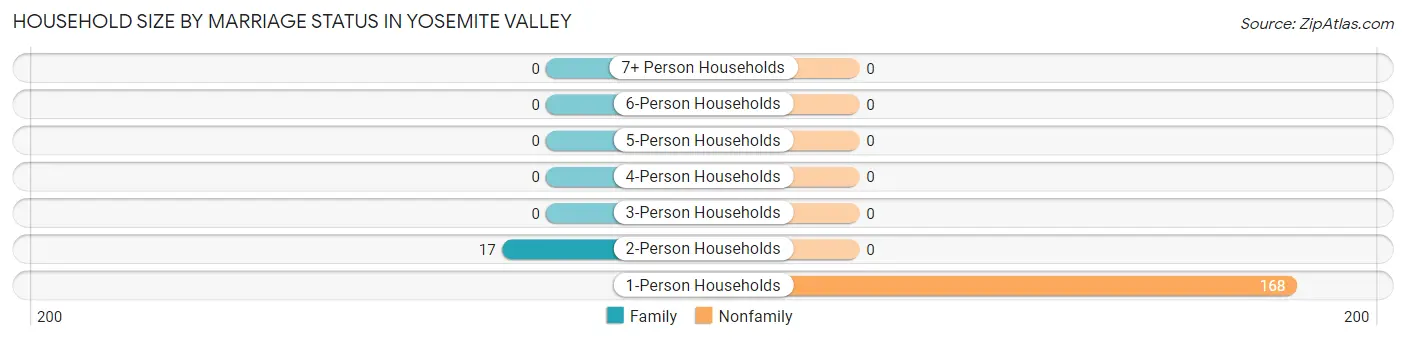
| Household Size | Family Households | Nonfamily Households |
| 1-Person Households | - | 168 (90.8%) |
| 2-Person Households | 17 (9.2%) | 0 (0.0%) |
| 3-Person Households | 0 (0.0%) | 0 (0.0%) |
| 4-Person Households | 0 (0.0%) | 0 (0.0%) |
| 5-Person Households | 0 (0.0%) | 0 (0.0%) |
| 6-Person Households | 0 (0.0%) | 0 (0.0%) |
| 7+ Person Households | 0 (0.0%) | 0 (0.0%) |
| Total | 17 (9.2%) | 168 (90.8%) |
Female Fertility in Yosemite Valley
Fertility by Age in Yosemite Valley
| Age Bracket | Women with Births | Births / 1,000 Women |
| 15 to 19 years | 0 (0.0%) | 0.0 |
| 20 to 34 years | 0 (0.0%) | 0.0 |
| 35 to 50 years | 0 (0.0%) | 0.0 |
| Total | 0 (0.0%) | 0.0 |
Fertility by Age by Marriage Status in Yosemite Valley
| Age Bracket | Married | Unmarried |
| 15 to 19 years | 0 (0.0%) | 0 (0.0%) |
| 20 to 34 years | 0 (0.0%) | 0 (0.0%) |
| 35 to 50 years | 0 (0.0%) | 0 (0.0%) |
| Total | 0 (0.0%) | 0 (0.0%) |
Fertility by Education in Yosemite Valley
| Educational Attainment | Women with Births | Births / 1,000 Women |
| Less than High School | 0 (0.0%) | 0.0 |
| High School Diploma | 0 (0.0%) | 0.0 |
| College or Associate's Degree | 0 (0.0%) | 0.0 |
| Bachelor's Degree | 0 (0.0%) | 0.0 |
| Graduate Degree | 0 (0.0%) | 0.0 |
| Total | 0 (0.0%) | 0.0 |
Fertility by Education by Marriage Status in Yosemite Valley
| Educational Attainment | Married | Unmarried |
| Less than High School | 0 (0.0%) | 0 (0.0%) |
| High School Diploma | 0 (0.0%) | 0 (0.0%) |
| College or Associate's Degree | 0 (0.0%) | 0 (0.0%) |
| Bachelor's Degree | 0 (0.0%) | 0 (0.0%) |
| Graduate Degree | 0 (0.0%) | 0 (0.0%) |
| Total | 0 (0.0%) | 0 (0.0%) |
Employment Characteristics in Yosemite Valley
Employment by Class of Employer in Yosemite Valley
Among the 1,380 employed individuals in Yosemite Valley, private company employees (1,003 | 72.7%), not-for-profit organizations (198 | 14.3%), and state government employees (121 | 8.8%) make up the most common classes of employment.
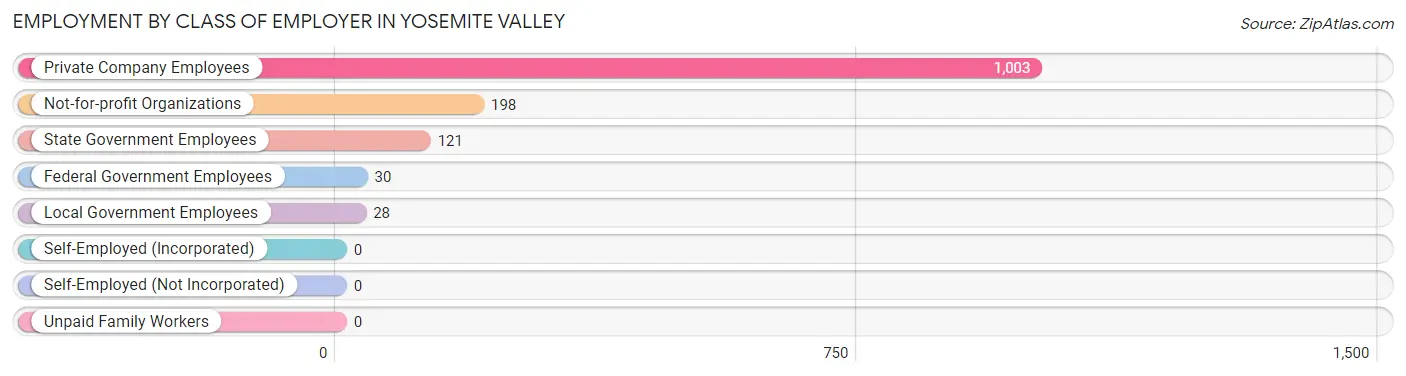
| Employer Class | # Employees | % Employees |
| Private Company Employees | 1,003 | 72.7% |
| Self-Employed (Incorporated) | 0 | 0.0% |
| Self-Employed (Not Incorporated) | 0 | 0.0% |
| Not-for-profit Organizations | 198 | 14.3% |
| Local Government Employees | 28 | 2.0% |
| State Government Employees | 121 | 8.8% |
| Federal Government Employees | 30 | 2.2% |
| Unpaid Family Workers | 0 | 0.0% |
| Total | 1,380 | 100.0% |
Employment Status by Age in Yosemite Valley
According to the labor force statistics for Yosemite Valley, out of the total population over 16 years of age (1,708), 89.9% or 1,535 individuals are in the labor force, with 4.5% or 69 of them unemployed. The age group with the highest labor force participation rate is 16 to 19 years, with 100.0% or 111 individuals in the labor force. Within the labor force, the 45 to 54 years age range has the highest percentage of unemployed individuals, with 25.6% or 54 of them being unemployed.
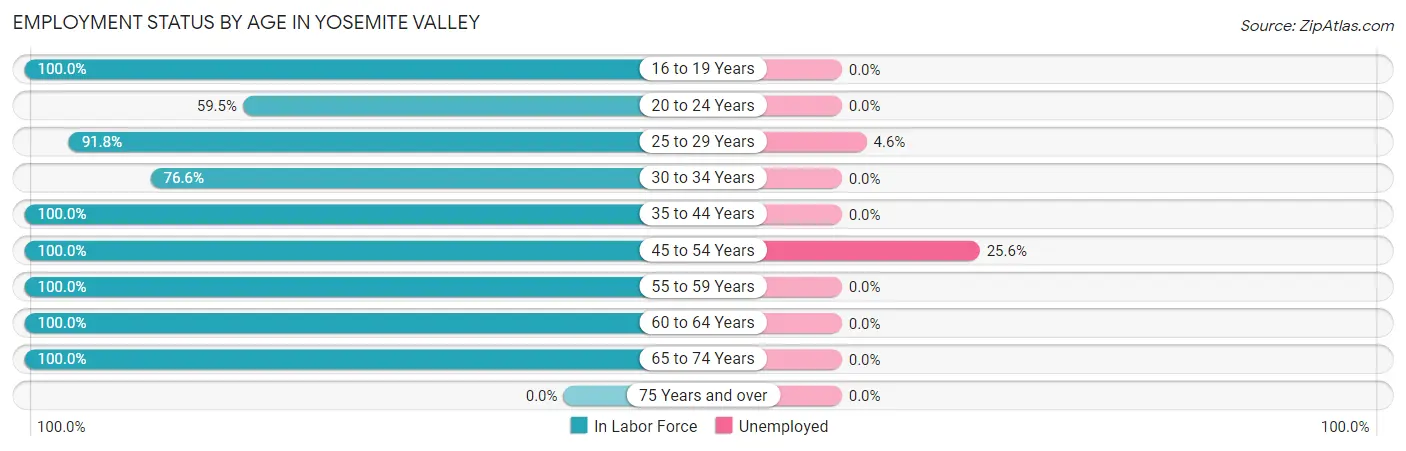
| Age Bracket | In Labor Force | Unemployed |
| 16 to 19 Years | 111 (100.0%) | 0 (0.0%) |
| 20 to 24 Years | 122 (59.5%) | 0 (0.0%) |
| 25 to 29 Years | 326 (91.8%) | 15 (4.6%) |
| 30 to 34 Years | 190 (76.6%) | 0 (0.0%) |
| 35 to 44 Years | 341 (100.0%) | 0 (0.0%) |
| 45 to 54 Years | 211 (100.0%) | 54 (25.6%) |
| 55 to 59 Years | 86 (100.0%) | 0 (0.0%) |
| 60 to 64 Years | 65 (100.0%) | 0 (0.0%) |
| 65 to 74 Years | 84 (100.0%) | 0 (0.0%) |
| 75 Years and over | 0 (0.0%) | 0 (0.0%) |
| Total | 1,535 (89.9%) | 69 (4.5%) |
Employment Status by Educational Attainment in Yosemite Valley
According to labor force statistics for Yosemite Valley, 93.3% of individuals (1,218) out of the total population between 25 and 64 years of age (1,306) are in the labor force, with 5.7% or 69 of them being unemployed. The group with the highest labor force participation rate are those with the educational attainment of less than high school, with 100.0% or 78 individuals in the labor force. Within the labor force, individuals with bachelor's degree or higher education have the highest percentage of unemployment, with 16.0% or 54 of them being unemployed.
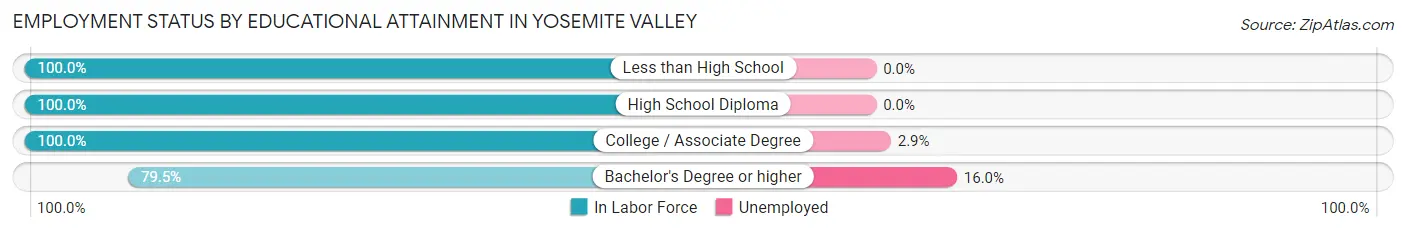
| Educational Attainment | In Labor Force | Unemployed |
| Less than High School | 78 (100.0%) | 0 (0.0%) |
| High School Diploma | 281 (100.0%) | 0 (0.0%) |
| College / Associate Degree | 523 (100.0%) | 15 (2.9%) |
| Bachelor's Degree or higher | 337 (79.5%) | 68 (16.0%) |
| Total | 1,218 (93.3%) | 74 (5.7%) |
Employment Occupations by Sex in Yosemite Valley
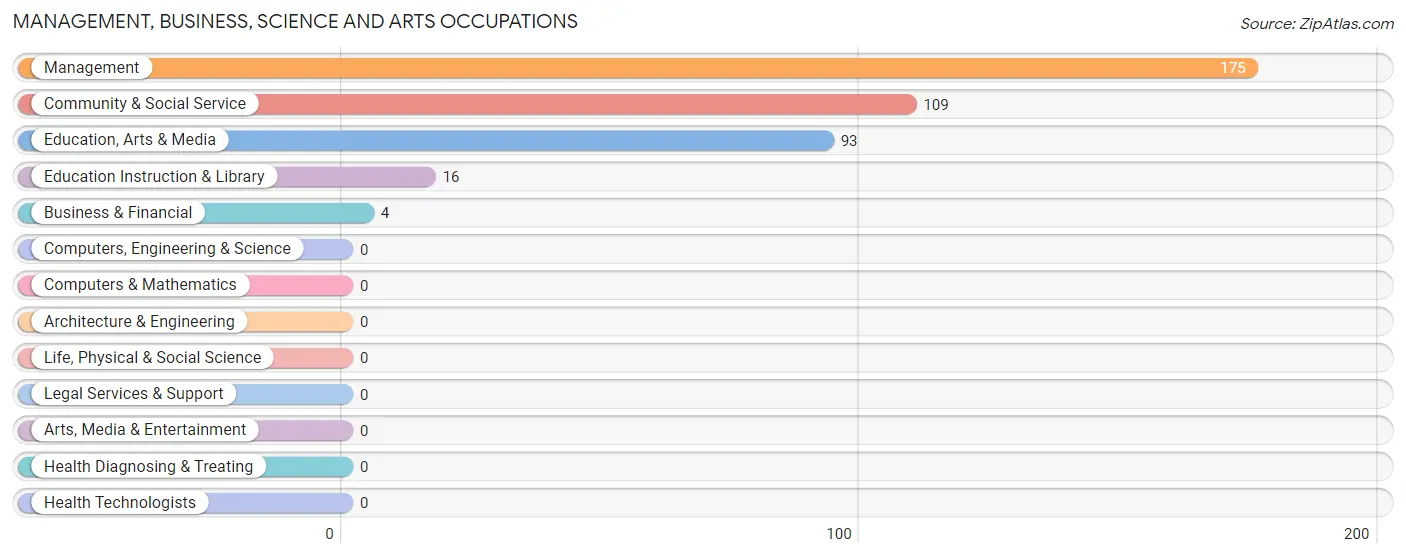
Management, Business, Science and Arts Occupations
The most common Management, Business, Science and Arts occupations in Yosemite Valley are Management (175 | 12.0%), Community & Social Service (109 | 7.4%), Education, Arts & Media (93 | 6.4%), Education Instruction & Library (16 | 1.1%), and Business & Financial (4 | 0.3%).
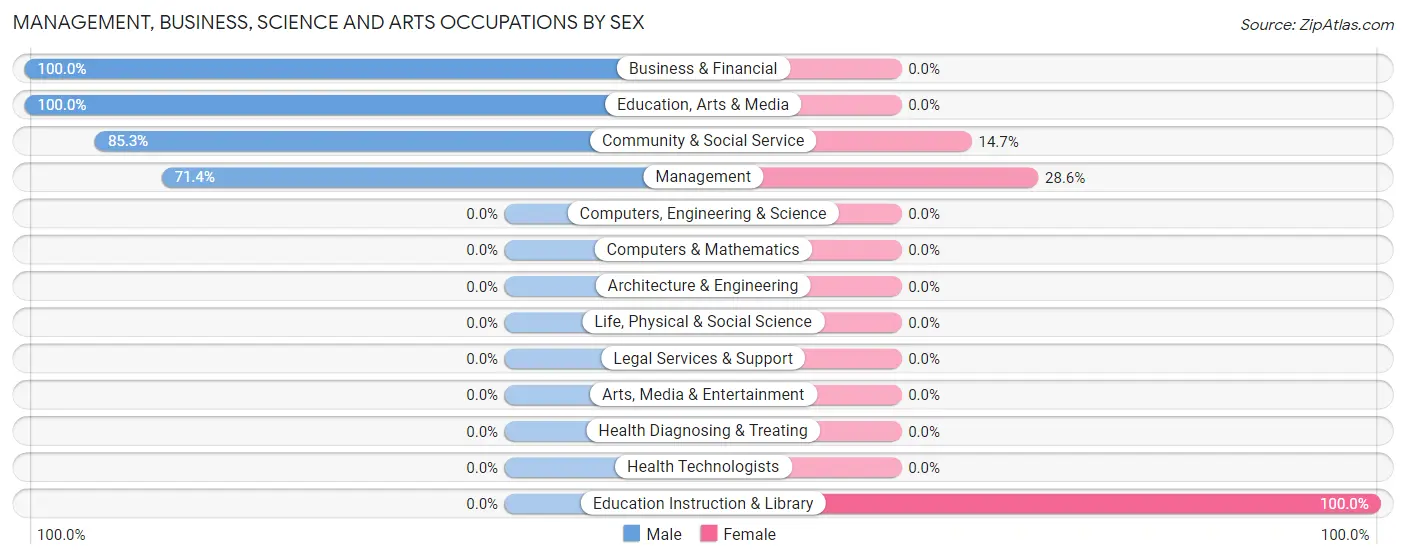
Management, Business, Science and Arts Occupations by Sex
Within the Management, Business, Science and Arts occupations in Yosemite Valley, the most male-oriented occupations are Business & Financial (100.0%), Education, Arts & Media (100.0%), and Community & Social Service (85.3%), while the most female-oriented occupations are Education Instruction & Library (100.0%), Management (28.6%), and Community & Social Service (14.7%).
| Occupation | Male | Female |
| Management | 125 (71.4%) | 50 (28.6%) |
| Business & Financial | 4 (100.0%) | 0 (0.0%) |
| Computers, Engineering & Science | 0 (0.0%) | 0 (0.0%) |
| Computers & Mathematics | 0 (0.0%) | 0 (0.0%) |
| Architecture & Engineering | 0 (0.0%) | 0 (0.0%) |
| Life, Physical & Social Science | 0 (0.0%) | 0 (0.0%) |
| Community & Social Service | 93 (85.3%) | 16 (14.7%) |
| Education, Arts & Media | 93 (100.0%) | 0 (0.0%) |
| Legal Services & Support | 0 (0.0%) | 0 (0.0%) |
| Education Instruction & Library | 0 (0.0%) | 16 (100.0%) |
| Arts, Media & Entertainment | 0 (0.0%) | 0 (0.0%) |
| Health Diagnosing & Treating | 0 (0.0%) | 0 (0.0%) |
| Health Technologists | 0 (0.0%) | 0 (0.0%) |
| Total (Category) | 222 (77.1%) | 66 (22.9%) |
| Total (Overall) | 1,047 (71.6%) | 416 (28.4%) |
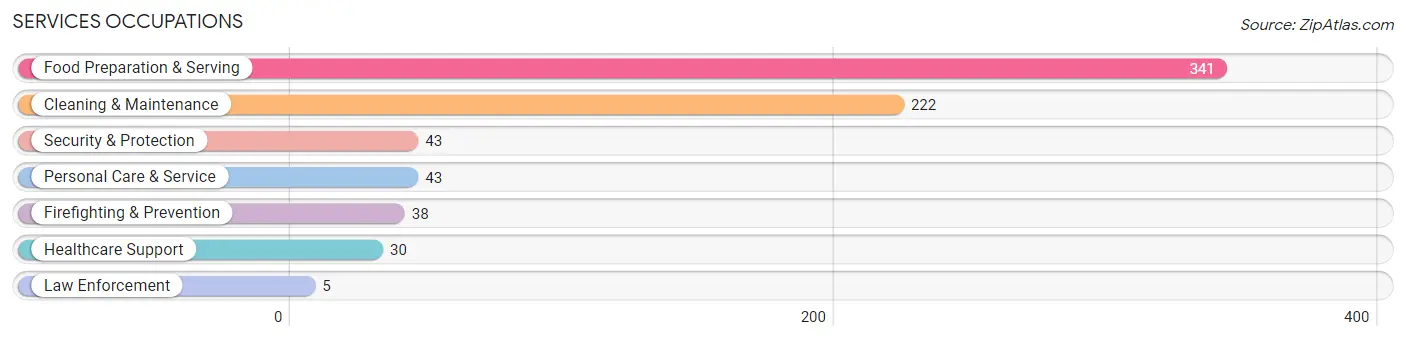
Services Occupations
The most common Services occupations in Yosemite Valley are Food Preparation & Serving (341 | 23.3%), Cleaning & Maintenance (222 | 15.2%), Security & Protection (43 | 2.9%), Personal Care & Service (43 | 2.9%), and Firefighting & Prevention (38 | 2.6%).
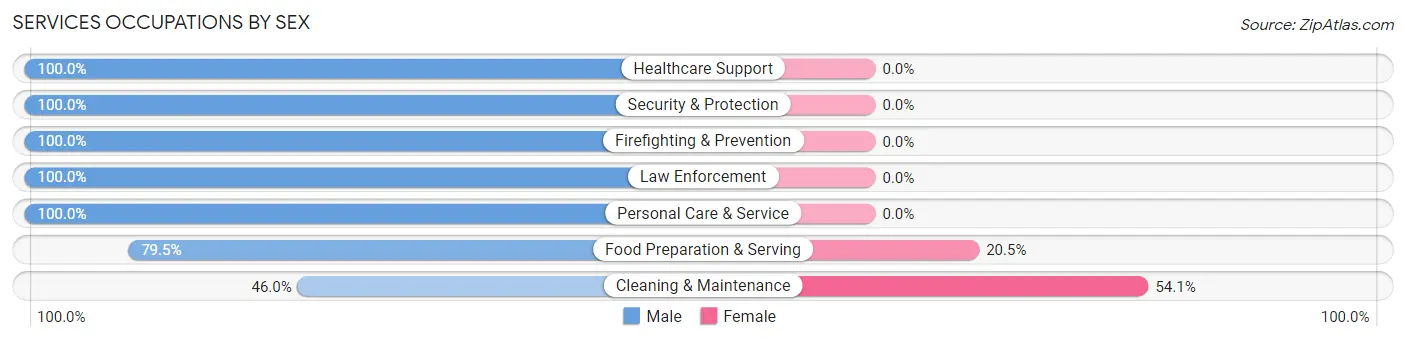
Services Occupations by Sex
Within the Services occupations in Yosemite Valley, the most male-oriented occupations are Healthcare Support (100.0%), Security & Protection (100.0%), and Firefighting & Prevention (100.0%), while the most female-oriented occupations are Cleaning & Maintenance (54.0%), and Food Preparation & Serving (20.5%).
| Occupation | Male | Female |
| Healthcare Support | 30 (100.0%) | 0 (0.0%) |
| Security & Protection | 43 (100.0%) | 0 (0.0%) |
| Firefighting & Prevention | 38 (100.0%) | 0 (0.0%) |
| Law Enforcement | 5 (100.0%) | 0 (0.0%) |
| Food Preparation & Serving | 271 (79.5%) | 70 (20.5%) |
| Cleaning & Maintenance | 102 (46.0%) | 120 (54.0%) |
| Personal Care & Service | 43 (100.0%) | 0 (0.0%) |
| Total (Category) | 489 (72.0%) | 190 (28.0%) |
| Total (Overall) | 1,047 (71.6%) | 416 (28.4%) |
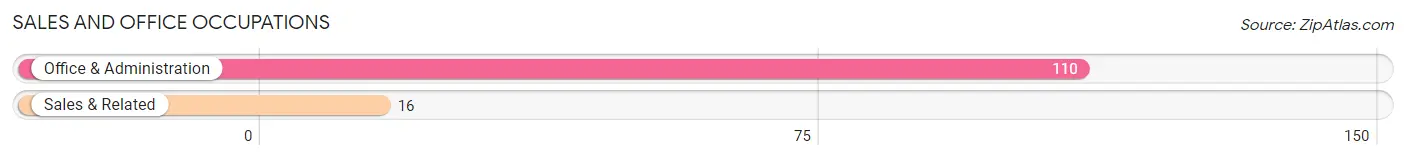
Sales and Office Occupations
The most common Sales and Office occupations in Yosemite Valley are Office & Administration (110 | 7.5%), and Sales & Related (16 | 1.1%).
Sales and Office Occupations by Sex
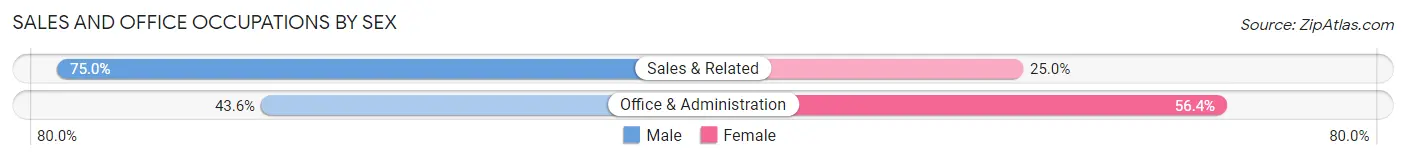
| Occupation | Male | Female |
| Sales & Related | 12 (75.0%) | 4 (25.0%) |
| Office & Administration | 48 (43.6%) | 62 (56.4%) |
| Total (Category) | 60 (47.6%) | 66 (52.4%) |
| Total (Overall) | 1,047 (71.6%) | 416 (28.4%) |
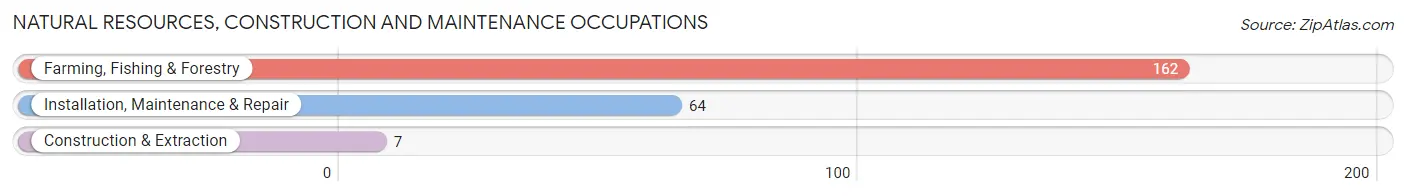
Natural Resources, Construction and Maintenance Occupations
The most common Natural Resources, Construction and Maintenance occupations in Yosemite Valley are Farming, Fishing & Forestry (162 | 11.1%), Installation, Maintenance & Repair (64 | 4.4%), and Construction & Extraction (7 | 0.5%).
Natural Resources, Construction and Maintenance Occupations by Sex
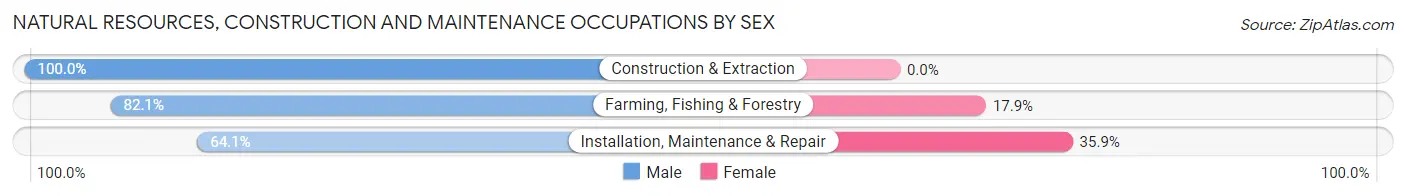
| Occupation | Male | Female |
| Farming, Fishing & Forestry | 133 (82.1%) | 29 (17.9%) |
| Construction & Extraction | 7 (100.0%) | 0 (0.0%) |
| Installation, Maintenance & Repair | 41 (64.1%) | 23 (35.9%) |
| Total (Category) | 181 (77.7%) | 52 (22.3%) |
| Total (Overall) | 1,047 (71.6%) | 416 (28.4%) |
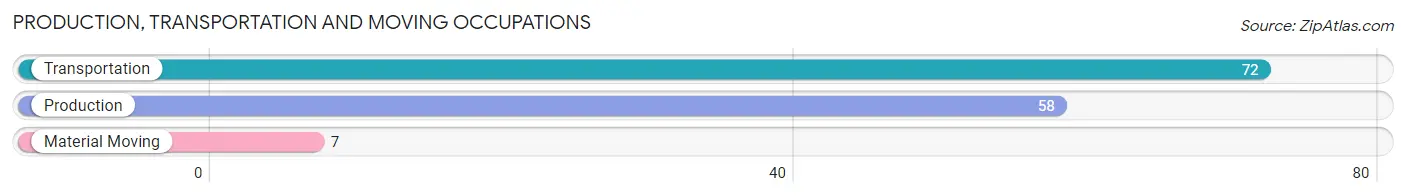
Production, Transportation and Moving Occupations
The most common Production, Transportation and Moving occupations in Yosemite Valley are Transportation (72 | 4.9%), Production (58 | 4.0%), and Material Moving (7 | 0.5%).
Production, Transportation and Moving Occupations by Sex
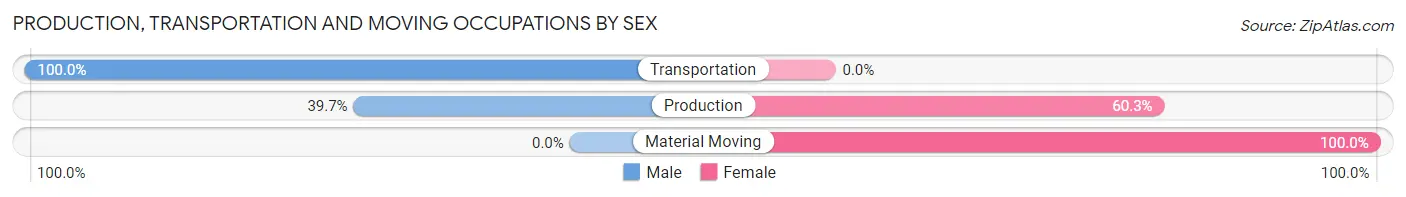
| Occupation | Male | Female |
| Production | 23 (39.7%) | 35 (60.3%) |
| Transportation | 72 (100.0%) | 0 (0.0%) |
| Material Moving | 0 (0.0%) | 7 (100.0%) |
| Total (Category) | 95 (69.3%) | 42 (30.7%) |
| Total (Overall) | 1,047 (71.6%) | 416 (28.4%) |
Employment Industries by Sex in Yosemite Valley
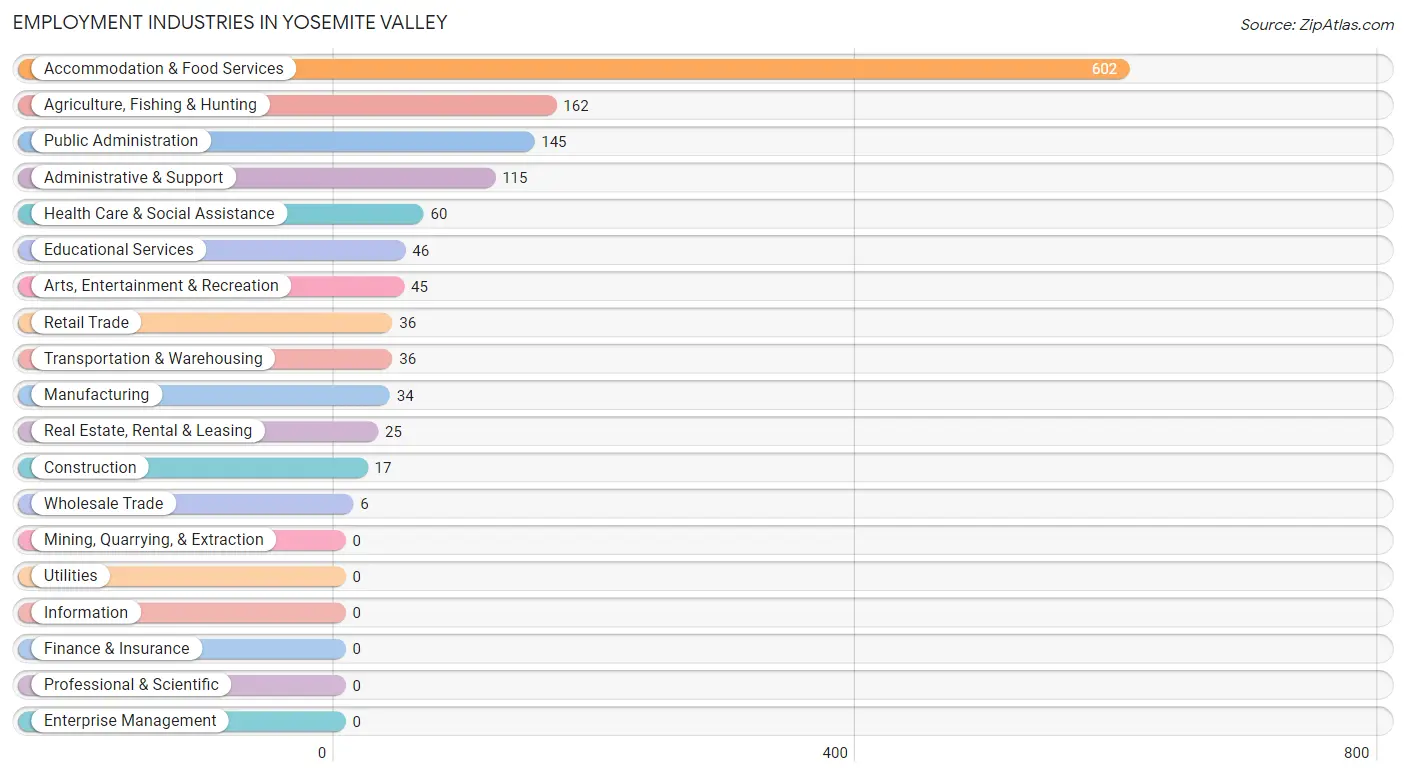
Employment Industries in Yosemite Valley
The major employment industries in Yosemite Valley include Accommodation & Food Services (602 | 41.1%), Agriculture, Fishing & Hunting (162 | 11.1%), Public Administration (145 | 9.9%), Administrative & Support (115 | 7.9%), and Health Care & Social Assistance (60 | 4.1%).
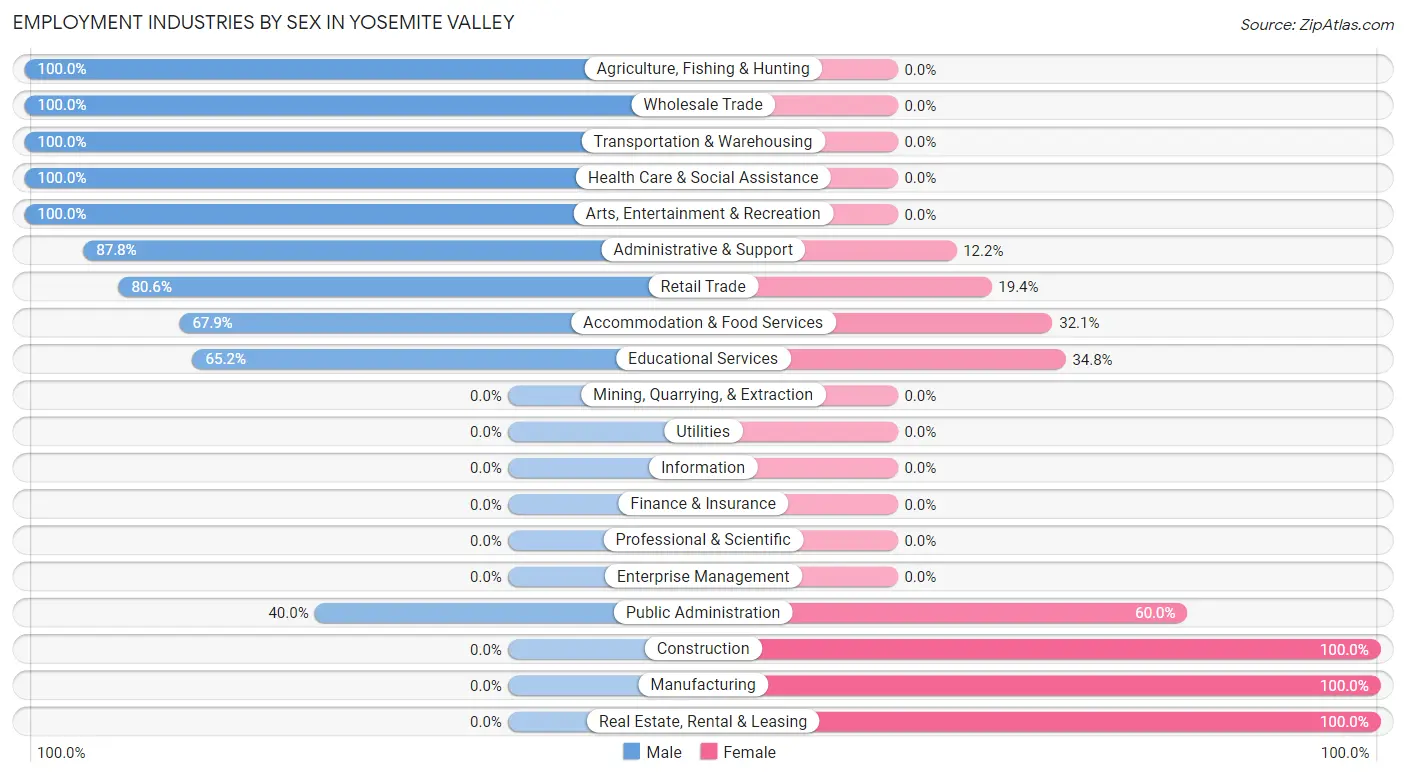
Employment Industries by Sex in Yosemite Valley
The Yosemite Valley industries that see more men than women are Agriculture, Fishing & Hunting (100.0%), Wholesale Trade (100.0%), and Transportation & Warehousing (100.0%), whereas the industries that tend to have a higher number of women are Construction (100.0%), Manufacturing (100.0%), and Real Estate, Rental & Leasing (100.0%).
| Industry | Male | Female |
| Agriculture, Fishing & Hunting | 162 (100.0%) | 0 (0.0%) |
| Mining, Quarrying, & Extraction | 0 (0.0%) | 0 (0.0%) |
| Construction | 0 (0.0%) | 17 (100.0%) |
| Manufacturing | 0 (0.0%) | 34 (100.0%) |
| Wholesale Trade | 6 (100.0%) | 0 (0.0%) |
| Retail Trade | 29 (80.6%) | 7 (19.4%) |
| Transportation & Warehousing | 36 (100.0%) | 0 (0.0%) |
| Utilities | 0 (0.0%) | 0 (0.0%) |
| Information | 0 (0.0%) | 0 (0.0%) |
| Finance & Insurance | 0 (0.0%) | 0 (0.0%) |
| Real Estate, Rental & Leasing | 0 (0.0%) | 25 (100.0%) |
| Professional & Scientific | 0 (0.0%) | 0 (0.0%) |
| Enterprise Management | 0 (0.0%) | 0 (0.0%) |
| Administrative & Support | 101 (87.8%) | 14 (12.2%) |
| Educational Services | 30 (65.2%) | 16 (34.8%) |
| Health Care & Social Assistance | 60 (100.0%) | 0 (0.0%) |
| Arts, Entertainment & Recreation | 45 (100.0%) | 0 (0.0%) |
| Accommodation & Food Services | 409 (67.9%) | 193 (32.1%) |
| Public Administration | 58 (40.0%) | 87 (60.0%) |
| Total | 1,047 (71.6%) | 416 (28.4%) |
Education in Yosemite Valley
School Enrollment in Yosemite Valley
The most common levels of schooling among the 249 students in Yosemite Valley are college / undergraduate (148 | 59.4%), graduate / professional (49 | 19.7%), and elementary school (29 | 11.7%).
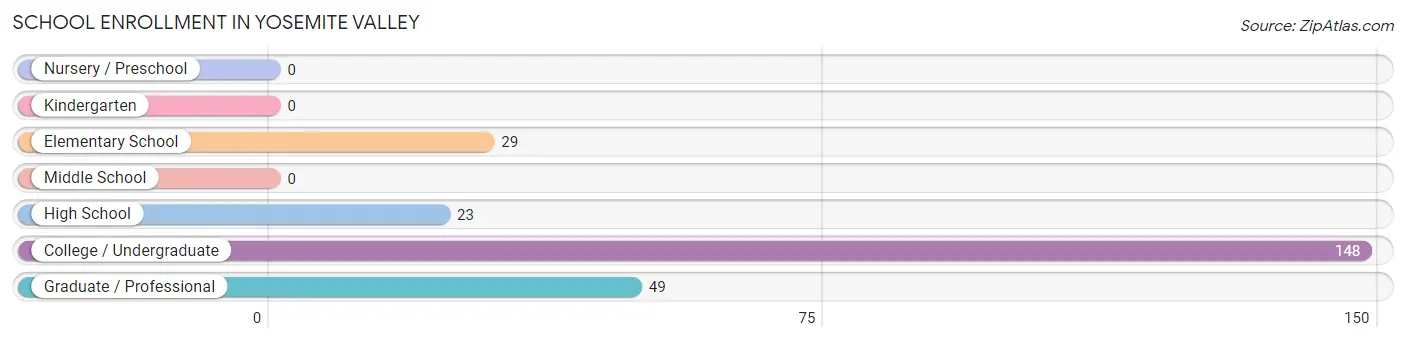
| School Level | # Students | % Students |
| Nursery / Preschool | 0 | 0.0% |
| Kindergarten | 0 | 0.0% |
| Elementary School | 29 | 11.7% |
| Middle School | 0 | 0.0% |
| High School | 23 | 9.2% |
| College / Undergraduate | 148 | 59.4% |
| Graduate / Professional | 49 | 19.7% |
| Total | 249 | 100.0% |
School Enrollment by Age by Funding Source in Yosemite Valley
Out of a total of 249 students who are enrolled in schools in Yosemite Valley, 79 (31.7%) attend a private institution, while the remaining 170 (68.3%) are enrolled in public schools. The age group of 25 to 34 year olds has the highest likelihood of being enrolled in private schools, with 49 (68.1% in the age bracket) enrolled. Conversely, the age group of 5 to 9 year old has the lowest likelihood of being enrolled in a private school, with 29 (100.0% in the age bracket) attending a public institution.
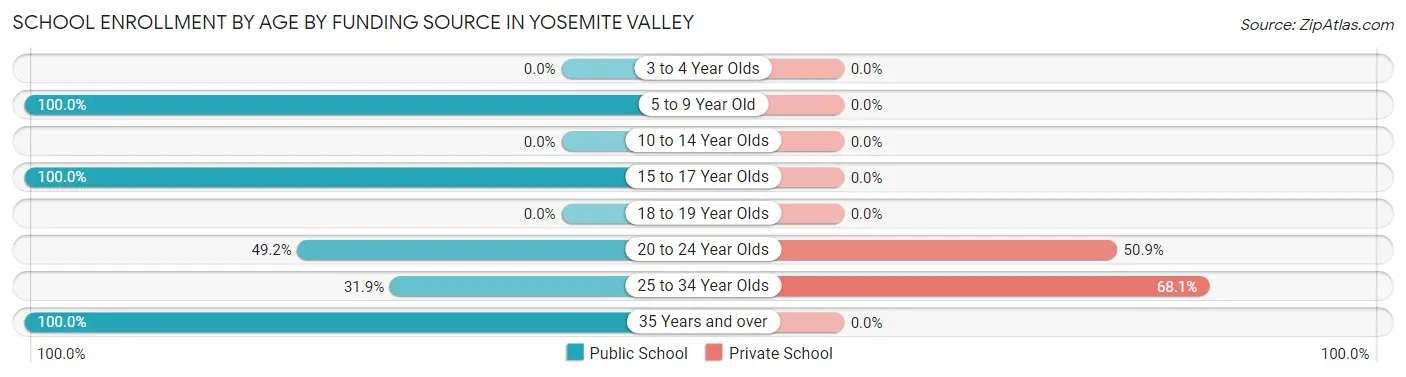
| Age Bracket | Public School | Private School |
| 3 to 4 Year Olds | 0 (0.0%) | 0 (0.0%) |
| 5 to 9 Year Old | 29 (100.0%) | 0 (0.0%) |
| 10 to 14 Year Olds | 0 (0.0%) | 0 (0.0%) |
| 15 to 17 Year Olds | 23 (100.0%) | 0 (0.0%) |
| 18 to 19 Year Olds | 0 (0.0%) | 0 (0.0%) |
| 20 to 24 Year Olds | 29 (49.1%) | 30 (50.8%) |
| 25 to 34 Year Olds | 23 (31.9%) | 49 (68.1%) |
| 35 Years and over | 66 (100.0%) | 0 (0.0%) |
| Total | 170 (68.3%) | 79 (31.7%) |
Educational Attainment by Field of Study in Yosemite Valley
Business (125 | 27.7%), social sciences (98 | 21.7%), science & technology (85 | 18.9%), arts & humanities (54 | 12.0%), and liberal arts & history (38 | 8.4%) are the most common fields of study among 451 individuals in Yosemite Valley who have obtained a bachelor's degree or higher.
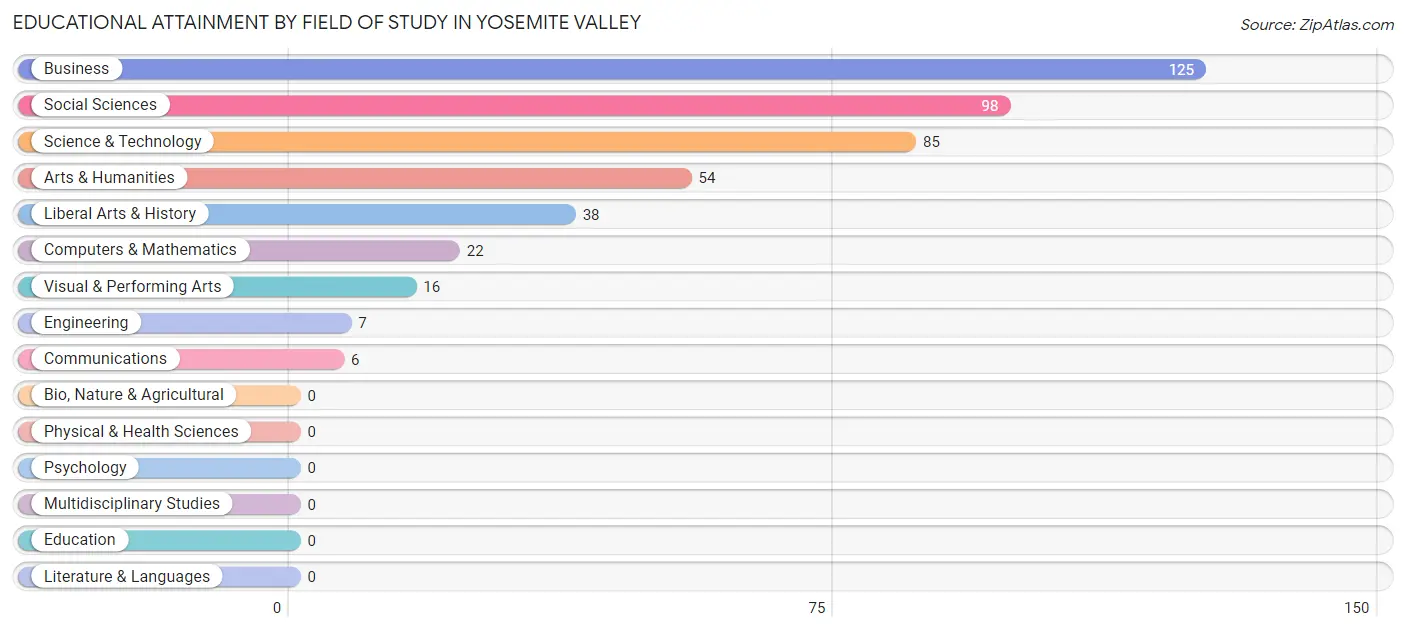
| Field of Study | # Graduates | % Graduates |
| Computers & Mathematics | 22 | 4.9% |
| Bio, Nature & Agricultural | 0 | 0.0% |
| Physical & Health Sciences | 0 | 0.0% |
| Psychology | 0 | 0.0% |
| Social Sciences | 98 | 21.7% |
| Engineering | 7 | 1.5% |
| Multidisciplinary Studies | 0 | 0.0% |
| Science & Technology | 85 | 18.9% |
| Business | 125 | 27.7% |
| Education | 0 | 0.0% |
| Literature & Languages | 0 | 0.0% |
| Liberal Arts & History | 38 | 8.4% |
| Visual & Performing Arts | 16 | 3.5% |
| Communications | 6 | 1.3% |
| Arts & Humanities | 54 | 12.0% |
| Total | 451 | 100.0% |
Transportation & Commute in Yosemite Valley
Vehicle Availability by Sex in Yosemite Valley
The most prevalent vehicle ownership categories in Yosemite Valley are males with 1 vehicle (29, accounting for 34.9%) and females with 1 vehicle (40, making up 51.8%).
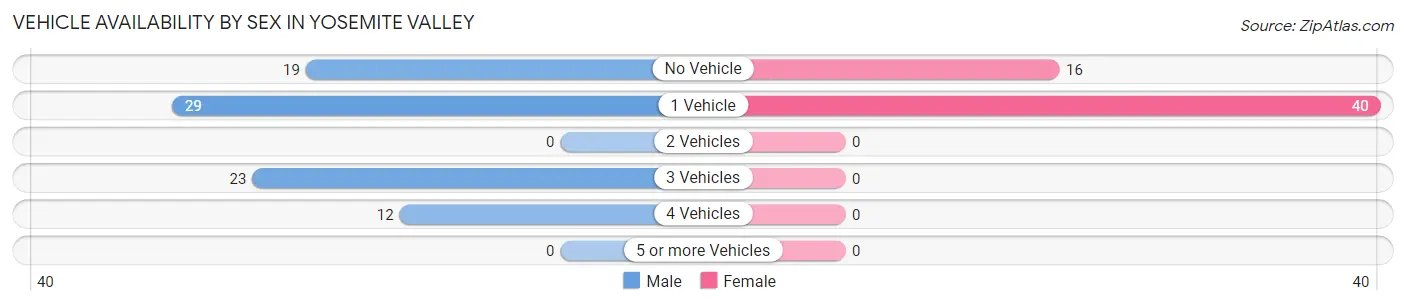
| Vehicles Available | Male | Female |
| No Vehicle | 19 (22.9%) | 16 (28.6%) |
| 1 Vehicle | 29 (34.9%) | 40 (71.4%) |
| 2 Vehicles | 0 (0.0%) | 0 (0.0%) |
| 3 Vehicles | 23 (27.7%) | 0 (0.0%) |
| 4 Vehicles | 12 (14.5%) | 0 (0.0%) |
| 5 or more Vehicles | 0 (0.0%) | 0 (0.0%) |
| Total | 83 (100.0%) | 56 (100.0%) |
Commute Time in Yosemite Valley
The most frequently occuring commute durations in Yosemite Valley are 5 to 9 minutes (254 commuters, 22.3%), 10 to 14 minutes (243 commuters, 21.3%), and 15 to 19 minutes (158 commuters, 13.9%).
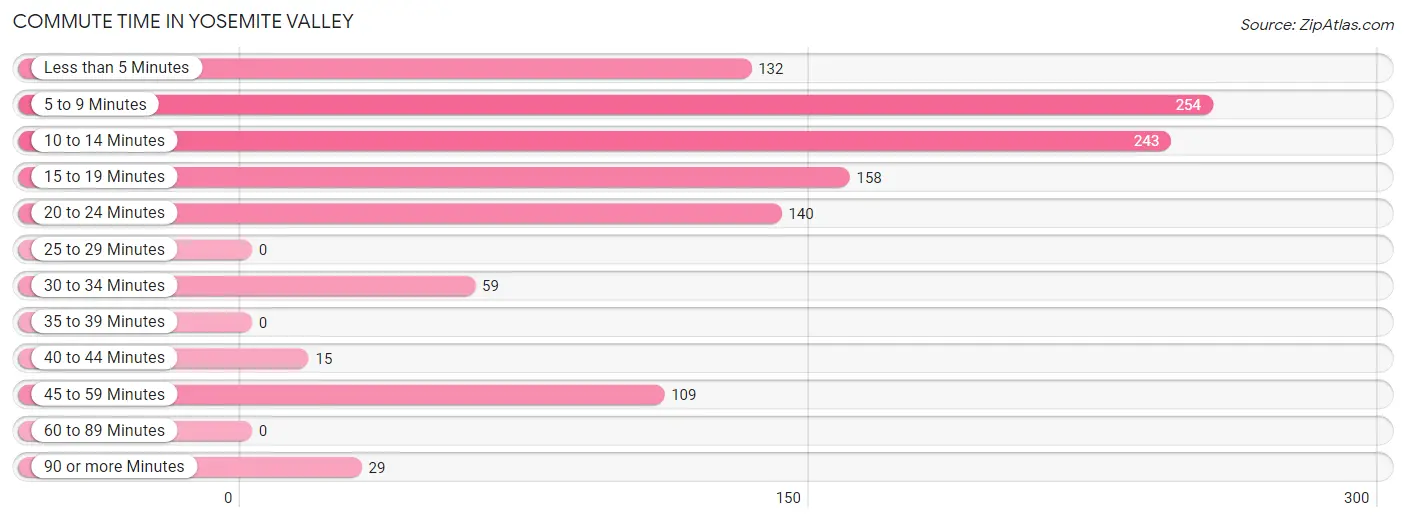
| Commute Time | # Commuters | % Commuters |
| Less than 5 Minutes | 132 | 11.6% |
| 5 to 9 Minutes | 254 | 22.3% |
| 10 to 14 Minutes | 243 | 21.3% |
| 15 to 19 Minutes | 158 | 13.9% |
| 20 to 24 Minutes | 140 | 12.3% |
| 25 to 29 Minutes | 0 | 0.0% |
| 30 to 34 Minutes | 59 | 5.2% |
| 35 to 39 Minutes | 0 | 0.0% |
| 40 to 44 Minutes | 15 | 1.3% |
| 45 to 59 Minutes | 109 | 9.6% |
| 60 to 89 Minutes | 0 | 0.0% |
| 90 or more Minutes | 29 | 2.5% |
Commute Time by Sex in Yosemite Valley
The most common commute times in Yosemite Valley are 10 to 14 minutes (211 commuters, 26.7%) for males and 5 to 9 minutes (103 commuters, 29.4%) for females.
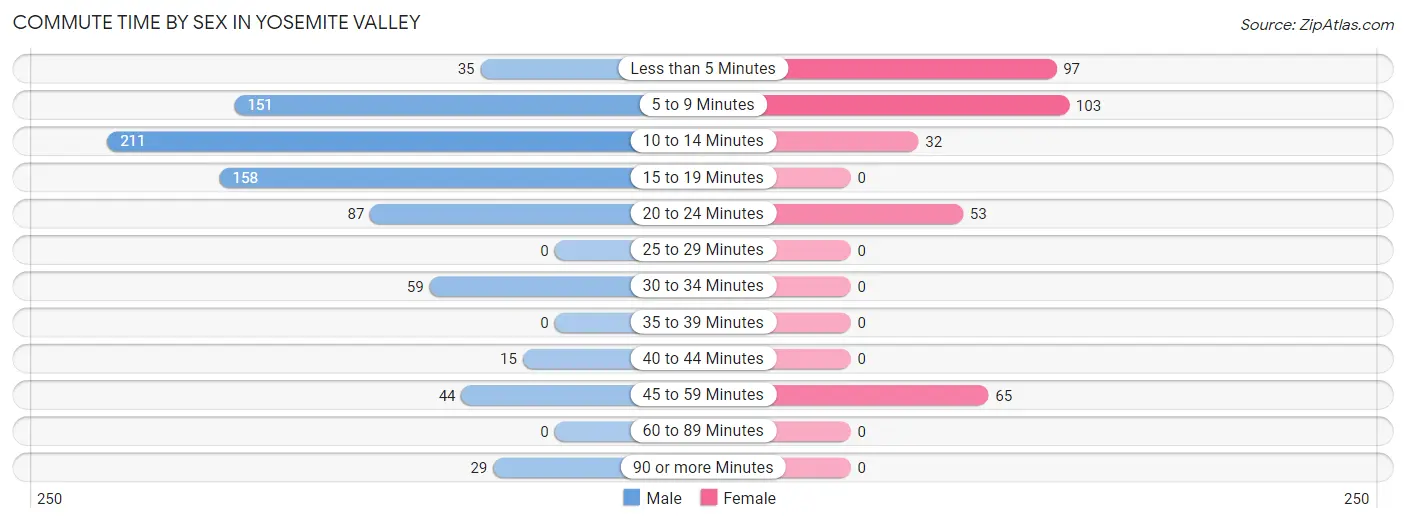
| Commute Time | Male | Female |
| Less than 5 Minutes | 35 (4.4%) | 97 (27.7%) |
| 5 to 9 Minutes | 151 (19.1%) | 103 (29.4%) |
| 10 to 14 Minutes | 211 (26.7%) | 32 (9.1%) |
| 15 to 19 Minutes | 158 (20.0%) | 0 (0.0%) |
| 20 to 24 Minutes | 87 (11.0%) | 53 (15.1%) |
| 25 to 29 Minutes | 0 (0.0%) | 0 (0.0%) |
| 30 to 34 Minutes | 59 (7.5%) | 0 (0.0%) |
| 35 to 39 Minutes | 0 (0.0%) | 0 (0.0%) |
| 40 to 44 Minutes | 15 (1.9%) | 0 (0.0%) |
| 45 to 59 Minutes | 44 (5.6%) | 65 (18.6%) |
| 60 to 89 Minutes | 0 (0.0%) | 0 (0.0%) |
| 90 or more Minutes | 29 (3.7%) | 0 (0.0%) |
Time of Departure to Work by Sex in Yosemite Valley
The most frequent times of departure to work in Yosemite Valley are 7:00 AM to 7:29 AM (127, 16.1%) for males and 7:30 AM to 7:59 AM (77, 22.0%) for females.
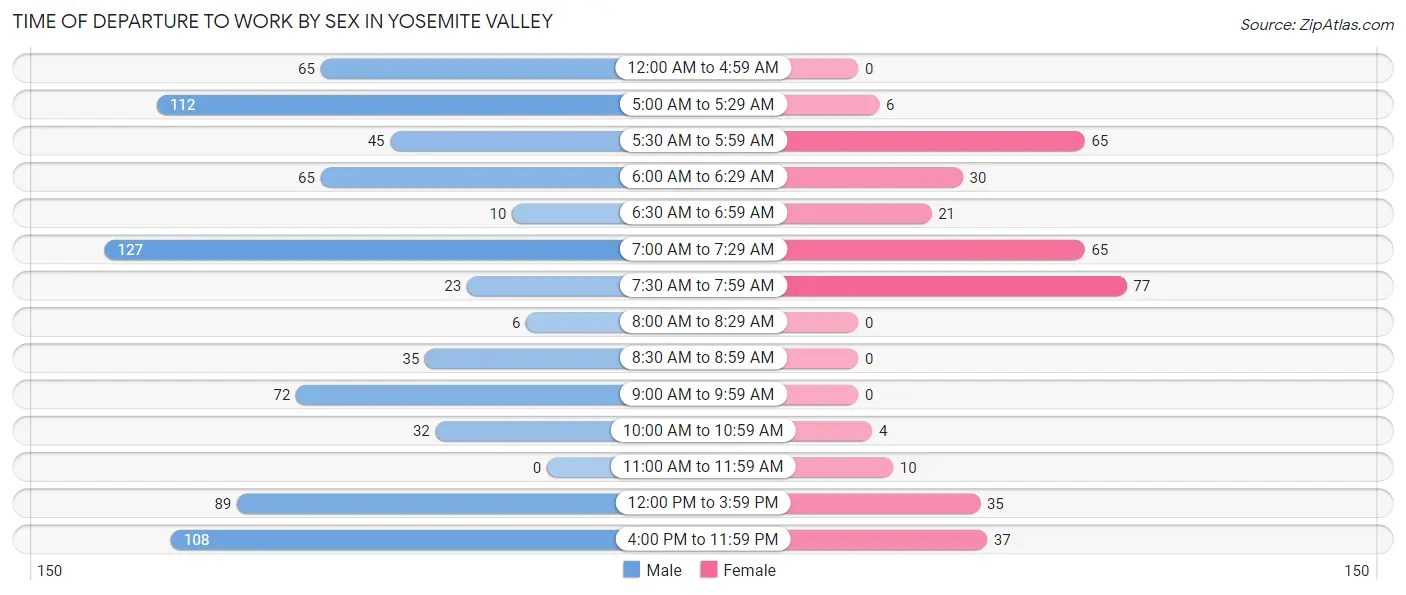
| Time of Departure | Male | Female |
| 12:00 AM to 4:59 AM | 65 (8.2%) | 0 (0.0%) |
| 5:00 AM to 5:29 AM | 112 (14.2%) | 6 (1.7%) |
| 5:30 AM to 5:59 AM | 45 (5.7%) | 65 (18.6%) |
| 6:00 AM to 6:29 AM | 65 (8.2%) | 30 (8.6%) |
| 6:30 AM to 6:59 AM | 10 (1.3%) | 21 (6.0%) |
| 7:00 AM to 7:29 AM | 127 (16.1%) | 65 (18.6%) |
| 7:30 AM to 7:59 AM | 23 (2.9%) | 77 (22.0%) |
| 8:00 AM to 8:29 AM | 6 (0.8%) | 0 (0.0%) |
| 8:30 AM to 8:59 AM | 35 (4.4%) | 0 (0.0%) |
| 9:00 AM to 9:59 AM | 72 (9.1%) | 0 (0.0%) |
| 10:00 AM to 10:59 AM | 32 (4.1%) | 4 (1.1%) |
| 11:00 AM to 11:59 AM | 0 (0.0%) | 10 (2.9%) |
| 12:00 PM to 3:59 PM | 89 (11.3%) | 35 (10.0%) |
| 4:00 PM to 11:59 PM | 108 (13.7%) | 37 (10.6%) |
| Total | 789 (100.0%) | 350 (100.0%) |
Housing Occupancy in Yosemite Valley
Occupancy by Ownership in Yosemite Valley
Of the total 185 dwellings in Yosemite Valley, owner-occupied units account for 0 (0.0%), while renter-occupied units make up 185 (100.0%).
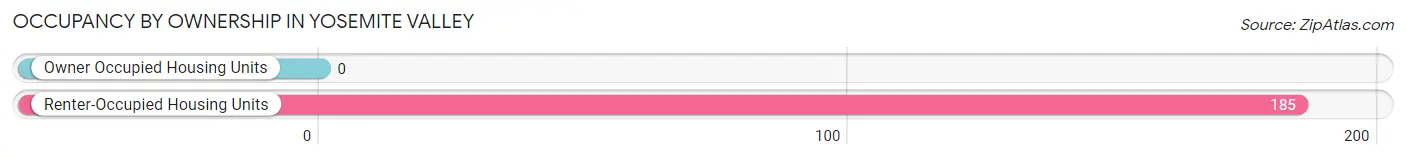
| Occupancy | # Housing Units | % Housing Units |
| Owner Occupied Housing Units | 0 | 0.0% |
| Renter-Occupied Housing Units | 185 | 100.0% |
| Total Occupied Housing Units | 185 | 100.0% |
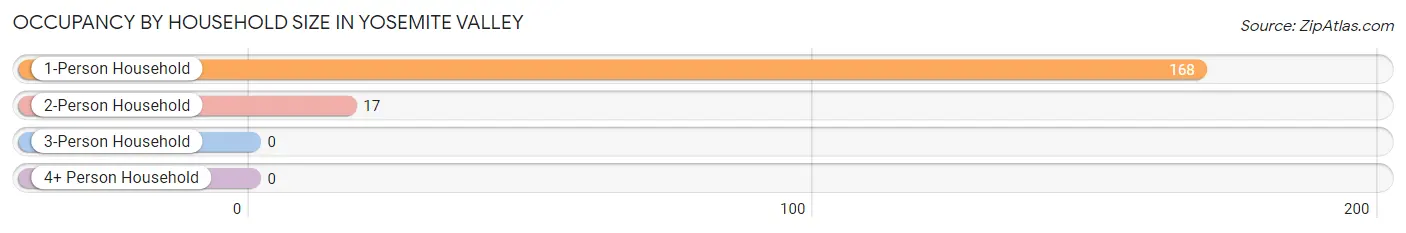
Occupancy by Household Size in Yosemite Valley
| Household Size | # Housing Units | % Housing Units |
| 1-Person Household | 168 | 90.8% |
| 2-Person Household | 17 | 9.2% |
| 3-Person Household | 0 | 0.0% |
| 4+ Person Household | 0 | 0.0% |
| Total Housing Units | 185 | 100.0% |
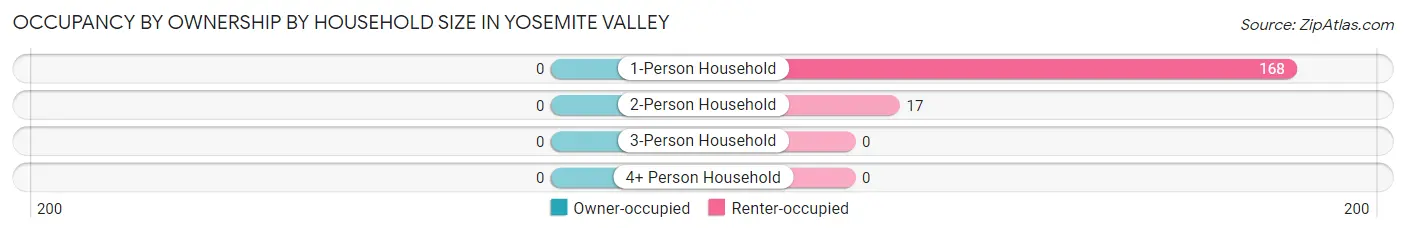
Occupancy by Ownership by Household Size in Yosemite Valley
| Household Size | Owner-occupied | Renter-occupied |
| 1-Person Household | 0 (0.0%) | 168 (100.0%) |
| 2-Person Household | 0 (0.0%) | 17 (100.0%) |
| 3-Person Household | 0 (0.0%) | 0 (0.0%) |
| 4+ Person Household | 0 (0.0%) | 0 (0.0%) |
| Total Housing Units | 0 (0.0%) | 185 (100.0%) |
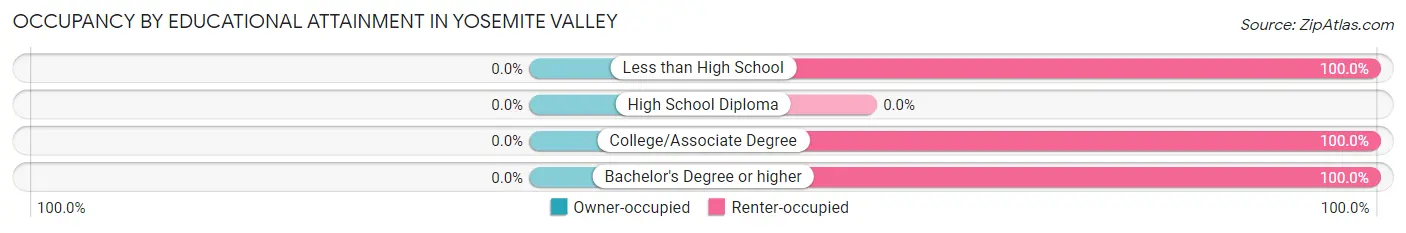
Occupancy by Educational Attainment in Yosemite Valley
| Household Size | Owner-occupied | Renter-occupied |
| Less than High School | 0 (0.0%) | 12 (100.0%) |
| High School Diploma | 0 (0.0%) | 0 (0.0%) |
| College/Associate Degree | 0 (0.0%) | 61 (100.0%) |
| Bachelor's Degree or higher | 0 (0.0%) | 112 (100.0%) |
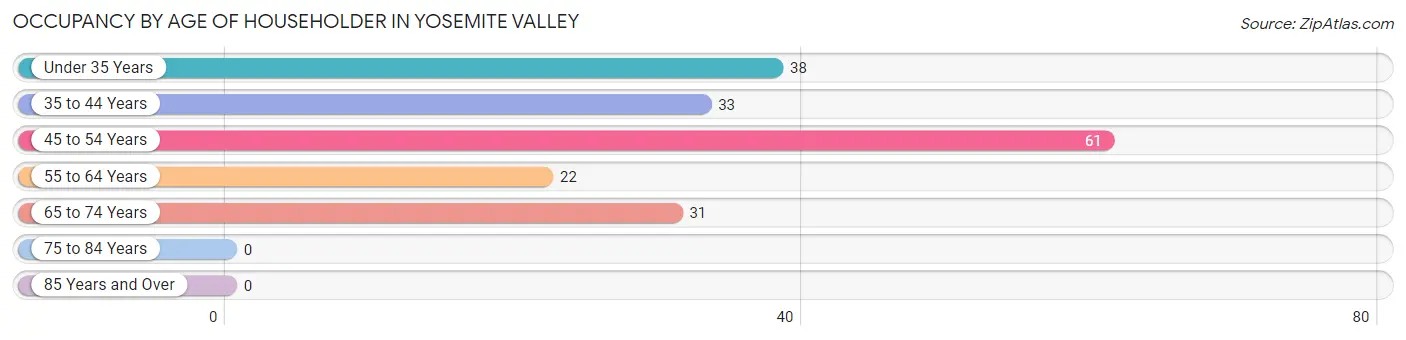
Occupancy by Age of Householder in Yosemite Valley
| Age Bracket | # Households | % Households |
| Under 35 Years | 38 | 20.5% |
| 35 to 44 Years | 33 | 17.8% |
| 45 to 54 Years | 61 | 33.0% |
| 55 to 64 Years | 22 | 11.9% |
| 65 to 74 Years | 31 | 16.8% |
| 75 to 84 Years | 0 | 0.0% |
| 85 Years and Over | 0 | 0.0% |
| Total | 185 | 100.0% |
Housing Finances in Yosemite Valley
Median Income by Occupancy in Yosemite Valley
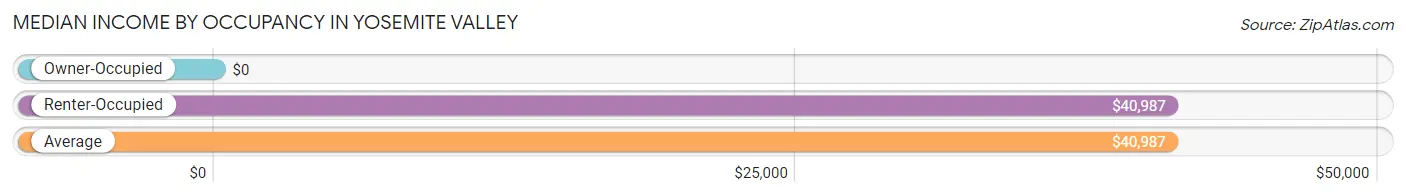
| Occupancy Type | # Households | Median Income |
| Owner-Occupied | 0 (0.0%) | $0 |
| Renter-Occupied | 185 (100.0%) | $40,987 |
| Average | 185 (100.0%) | $40,987 |
Occupancy by Householder Income Bracket in Yosemite Valley
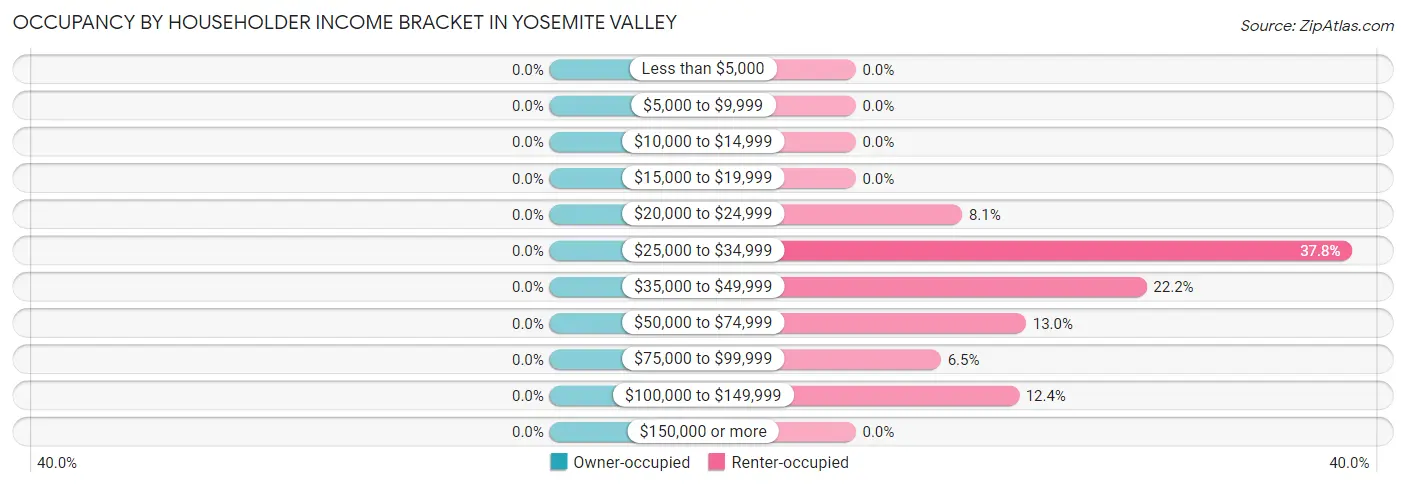
| Income Bracket | Owner-occupied | Renter-occupied |
| Less than $5,000 | 0 (0.0%) | 0 (0.0%) |
| $5,000 to $9,999 | 0 (0.0%) | 0 (0.0%) |
| $10,000 to $14,999 | 0 (0.0%) | 0 (0.0%) |
| $15,000 to $19,999 | 0 (0.0%) | 0 (0.0%) |
| $20,000 to $24,999 | 0 (0.0%) | 15 (8.1%) |
| $25,000 to $34,999 | 0 (0.0%) | 70 (37.8%) |
| $35,000 to $49,999 | 0 (0.0%) | 41 (22.2%) |
| $50,000 to $74,999 | 0 (0.0%) | 24 (13.0%) |
| $75,000 to $99,999 | 0 (0.0%) | 12 (6.5%) |
| $100,000 to $149,999 | 0 (0.0%) | 23 (12.4%) |
| $150,000 or more | 0 (0.0%) | 0 (0.0%) |
| Total | 0 (0.0%) | 185 (100.0%) |
Monthly Housing Cost Tiers in Yosemite Valley
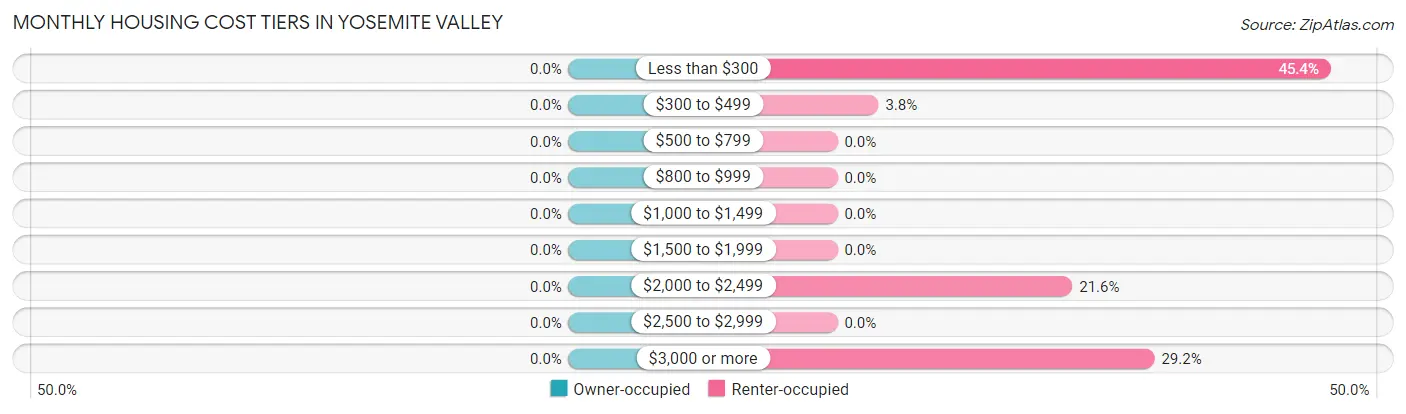
| Monthly Cost | Owner-occupied | Renter-occupied |
| Less than $300 | 0 (0.0%) | 84 (45.4%) |
| $300 to $499 | 0 (0.0%) | 7 (3.8%) |
| $500 to $799 | 0 (0.0%) | 0 (0.0%) |
| $800 to $999 | 0 (0.0%) | 0 (0.0%) |
| $1,000 to $1,499 | 0 (0.0%) | 0 (0.0%) |
| $1,500 to $1,999 | 0 (0.0%) | 0 (0.0%) |
| $2,000 to $2,499 | 0 (0.0%) | 40 (21.6%) |
| $2,500 to $2,999 | 0 (0.0%) | 0 (0.0%) |
| $3,000 or more | 0 (0.0%) | 54 (29.2%) |
| Total | 0 (0.0%) | 185 (100.0%) |
Physical Housing Characteristics in Yosemite Valley
Housing Structures in Yosemite Valley
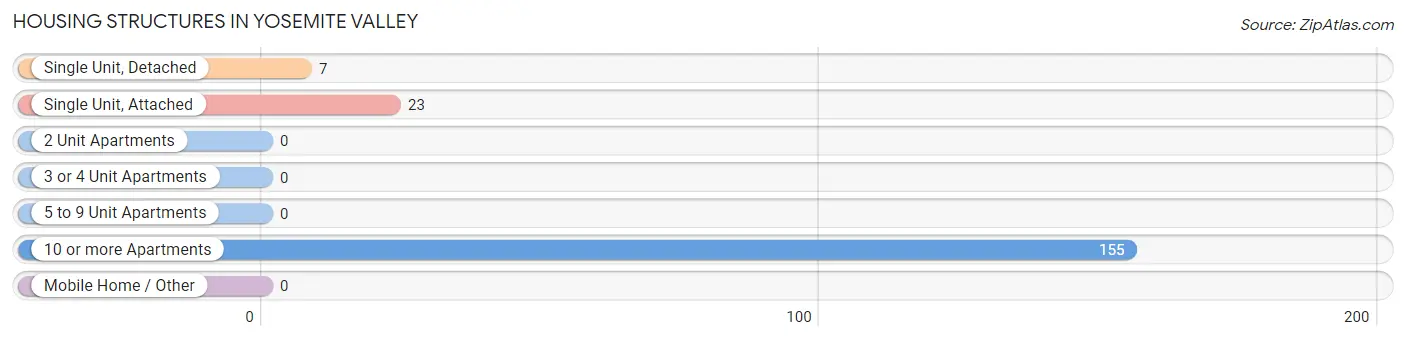
| Structure Type | # Housing Units | % Housing Units |
| Single Unit, Detached | 7 | 3.8% |
| Single Unit, Attached | 23 | 12.4% |
| 2 Unit Apartments | 0 | 0.0% |
| 3 or 4 Unit Apartments | 0 | 0.0% |
| 5 to 9 Unit Apartments | 0 | 0.0% |
| 10 or more Apartments | 155 | 83.8% |
| Mobile Home / Other | 0 | 0.0% |
| Total | 185 | 100.0% |
Housing Structures by Occupancy in Yosemite Valley
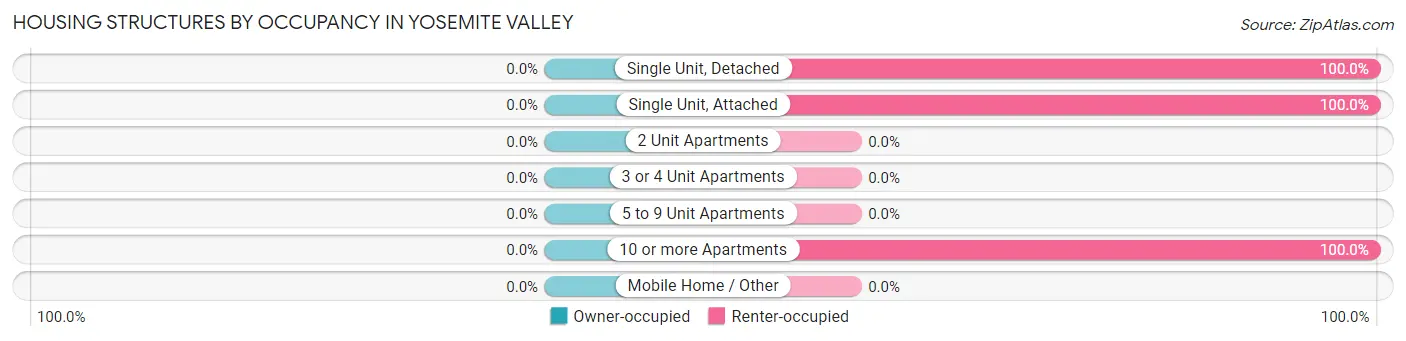
| Structure Type | Owner-occupied | Renter-occupied |
| Single Unit, Detached | 0 (0.0%) | 7 (100.0%) |
| Single Unit, Attached | 0 (0.0%) | 23 (100.0%) |
| 2 Unit Apartments | 0 (0.0%) | 0 (0.0%) |
| 3 or 4 Unit Apartments | 0 (0.0%) | 0 (0.0%) |
| 5 to 9 Unit Apartments | 0 (0.0%) | 0 (0.0%) |
| 10 or more Apartments | 0 (0.0%) | 155 (100.0%) |
| Mobile Home / Other | 0 (0.0%) | 0 (0.0%) |
| Total | 0 (0.0%) | 185 (100.0%) |
Housing Structures by Number of Rooms in Yosemite Valley
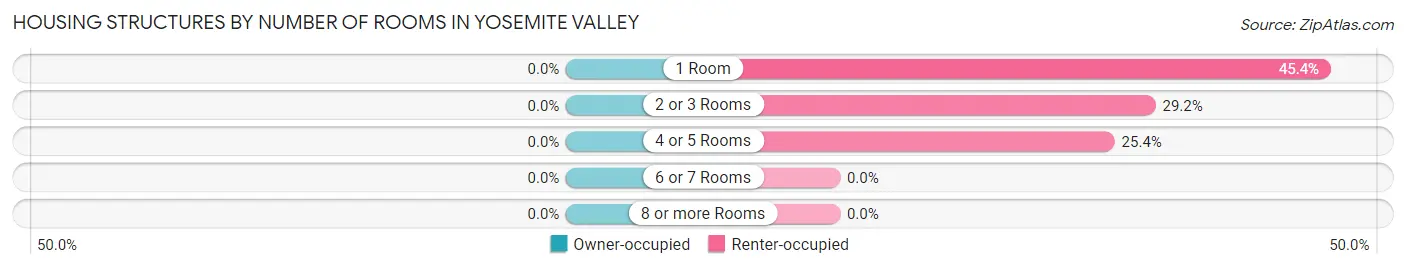
| Number of Rooms | Owner-occupied | Renter-occupied |
| 1 Room | 0 (0.0%) | 84 (45.4%) |
| 2 or 3 Rooms | 0 (0.0%) | 54 (29.2%) |
| 4 or 5 Rooms | 0 (0.0%) | 47 (25.4%) |
| 6 or 7 Rooms | 0 (0.0%) | 0 (0.0%) |
| 8 or more Rooms | 0 (0.0%) | 0 (0.0%) |
| Total | 0 (0.0%) | 185 (100.0%) |
Housing Structure by Heating Type in Yosemite Valley
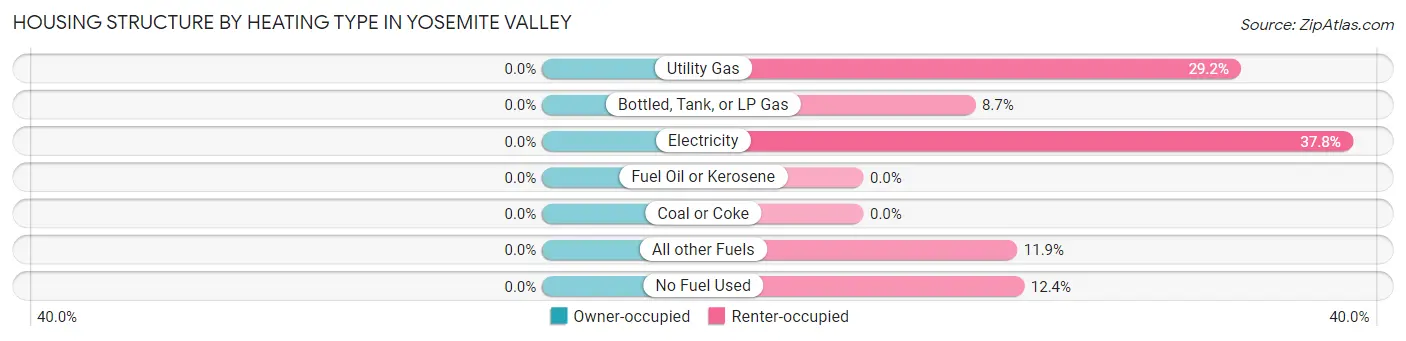
| Heating Type | Owner-occupied | Renter-occupied |
| Utility Gas | 0 (0.0%) | 54 (29.2%) |
| Bottled, Tank, or LP Gas | 0 (0.0%) | 16 (8.6%) |
| Electricity | 0 (0.0%) | 70 (37.8%) |
| Fuel Oil or Kerosene | 0 (0.0%) | 0 (0.0%) |
| Coal or Coke | 0 (0.0%) | 0 (0.0%) |
| All other Fuels | 0 (0.0%) | 22 (11.9%) |
| No Fuel Used | 0 (0.0%) | 23 (12.4%) |
| Total | 0 (0.0%) | 185 (100.0%) |
Household Vehicle Usage in Yosemite Valley
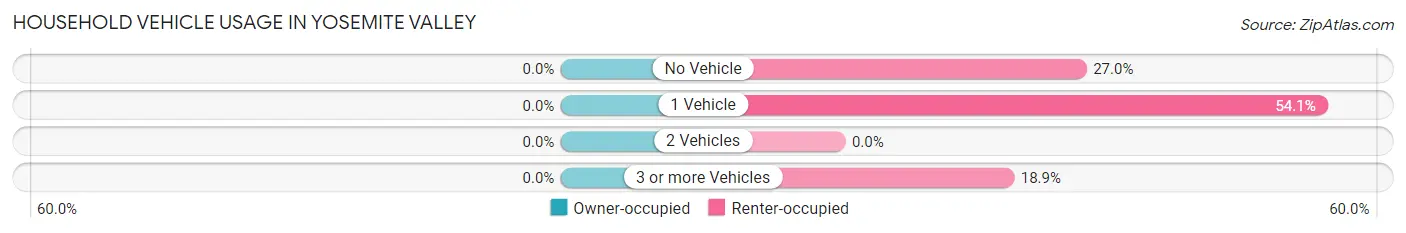
| Vehicles per Household | Owner-occupied | Renter-occupied |
| No Vehicle | 0 (0.0%) | 50 (27.0%) |
| 1 Vehicle | 0 (0.0%) | 100 (54.0%) |
| 2 Vehicles | 0 (0.0%) | 0 (0.0%) |
| 3 or more Vehicles | 0 (0.0%) | 35 (18.9%) |
| Total | 0 (0.0%) | 185 (100.0%) |
Real Estate & Mortgages in Yosemite Valley
Real Estate and Mortgage Overview in Yosemite Valley
| Characteristic | Without Mortgage | With Mortgage |
| Housing Units | 0 | 0 |
| Median Property Value | - | - |
| Median Household Income | - | - |
| Monthly Housing Costs | - | - |
| Real Estate Taxes | - | - |
Property Value by Mortgage Status in Yosemite Valley
| Property Value | Without Mortgage | With Mortgage |
| Less than $50,000 | 0 (0.0%) | 0 (0.0%) |
| $50,000 to $99,999 | 0 (0.0%) | 0 (0.0%) |
| $100,000 to $299,999 | 0 (0.0%) | 0 (0.0%) |
| $300,000 to $499,999 | 0 (0.0%) | 0 (0.0%) |
| $500,000 to $749,999 | 0 (0.0%) | 0 (0.0%) |
| $750,000 to $999,999 | 0 (0.0%) | 0 (0.0%) |
| $1,000,000 or more | 0 (0.0%) | 0 (0.0%) |
| Total | 0 (0.0%) | 0 (0.0%) |
Household Income by Mortgage Status in Yosemite Valley
| Household Income | Without Mortgage | With Mortgage |
| Less than $10,000 | 0 (0.0%) | 0 (0.0%) |
| $10,000 to $24,999 | 0 (0.0%) | 0 (0.0%) |
| $25,000 to $34,999 | 0 (0.0%) | 0 (0.0%) |
| $35,000 to $49,999 | 0 (0.0%) | 0 (0.0%) |
| $50,000 to $74,999 | 0 (0.0%) | 0 (0.0%) |
| $75,000 to $99,999 | 0 (0.0%) | 0 (0.0%) |
| $100,000 to $149,999 | 0 (0.0%) | 0 (0.0%) |
| $150,000 or more | 0 (0.0%) | 0 (0.0%) |
| Total | 0 (0.0%) | 0 (0.0%) |
Property Value to Household Income Ratio in Yosemite Valley
| Value-to-Income Ratio | Without Mortgage | With Mortgage |
| Less than 2.0x | 0 (0.0%) | 0 (0.0%) |
| 2.0x to 2.9x | 0 (0.0%) | 0 (0.0%) |
| 3.0x to 3.9x | 0 (0.0%) | 0 (0.0%) |
| 4.0x or more | 0 (0.0%) | 0 (0.0%) |
| Total | 0 (0.0%) | 0 (0.0%) |
Real Estate Taxes by Mortgage Status in Yosemite Valley
| Property Taxes | Without Mortgage | With Mortgage |
| Less than $800 | 0 (0.0%) | 0 (0.0%) |
| $800 to $1,499 | 0 (0.0%) | 0 (0.0%) |
| $800 to $1,499 | 0 (0.0%) | 0 (0.0%) |
| Total | 0 (0.0%) | 0 (0.0%) |
Health & Disability in Yosemite Valley
Health Insurance Coverage by Age in Yosemite Valley
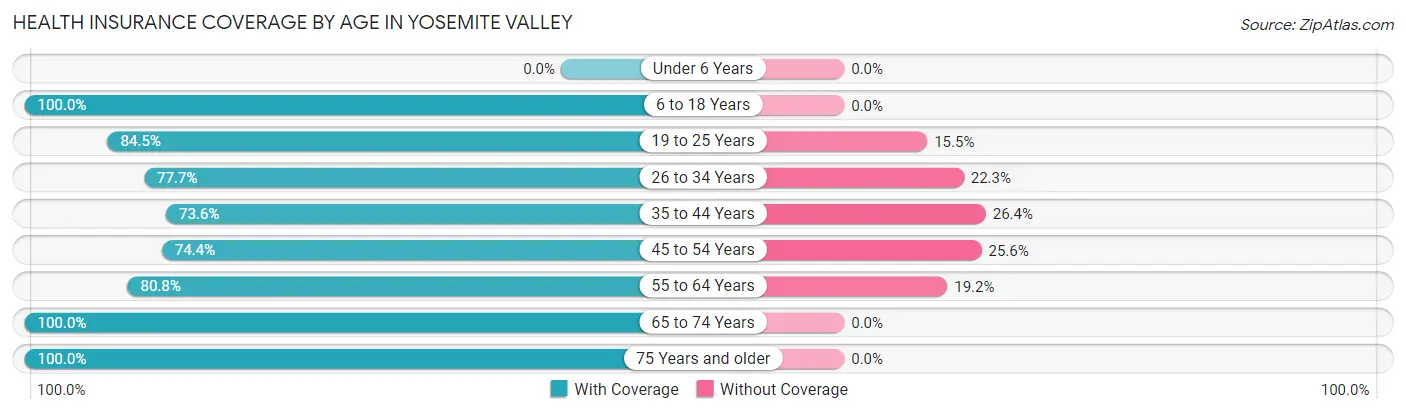
| Age Bracket | With Coverage | Without Coverage |
| Under 6 Years | 0 (0.0%) | 0 (0.0%) |
| 6 to 18 Years | 52 (100.0%) | 0 (0.0%) |
| 19 to 25 Years | 295 (84.5%) | 54 (15.5%) |
| 26 to 34 Years | 422 (77.7%) | 121 (22.3%) |
| 35 to 44 Years | 251 (73.6%) | 90 (26.4%) |
| 45 to 54 Years | 157 (74.4%) | 54 (25.6%) |
| 55 to 64 Years | 122 (80.8%) | 29 (19.2%) |
| 65 to 74 Years | 84 (100.0%) | 0 (0.0%) |
| 75 Years and older | 2 (100.0%) | 0 (0.0%) |
| Total | 1,385 (79.9%) | 348 (20.1%) |
Health Insurance Coverage by Citizenship Status in Yosemite Valley
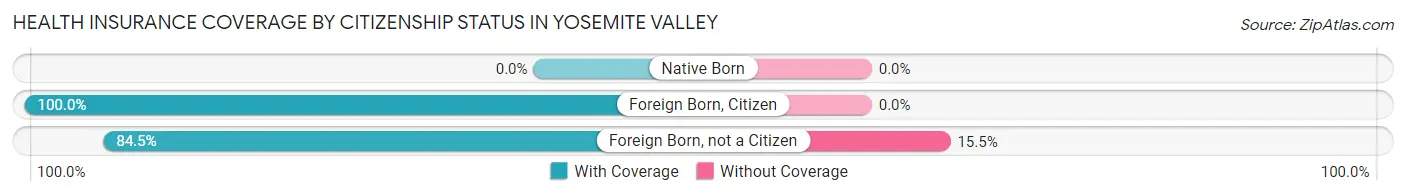
| Citizenship Status | With Coverage | Without Coverage |
| Native Born | 0 (0.0%) | 0 (0.0%) |
| Foreign Born, Citizen | 52 (100.0%) | 0 (0.0%) |
| Foreign Born, not a Citizen | 295 (84.5%) | 54 (15.5%) |
Health Insurance Coverage by Household Income in Yosemite Valley
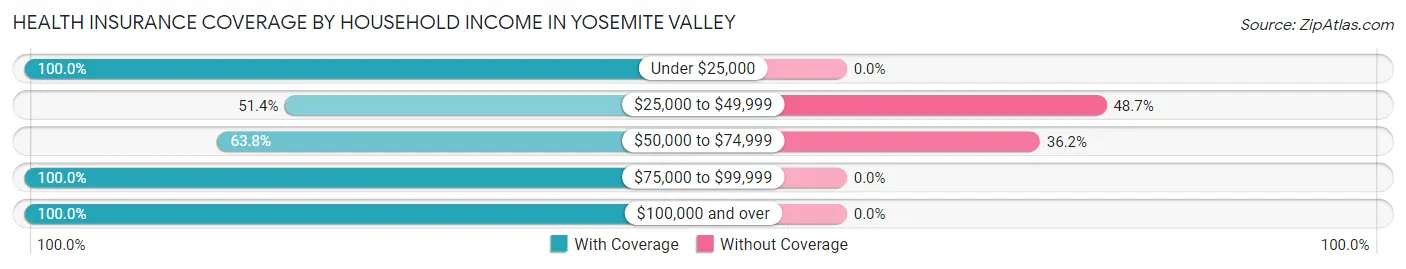
| Household Income | With Coverage | Without Coverage |
| Under $25,000 | 15 (100.0%) | 0 (0.0%) |
| $25,000 to $49,999 | 57 (51.3%) | 54 (48.6%) |
| $50,000 to $74,999 | 30 (63.8%) | 17 (36.2%) |
| $75,000 to $99,999 | 12 (100.0%) | 0 (0.0%) |
| $100,000 and over | 23 (100.0%) | 0 (0.0%) |
Public vs Private Health Insurance Coverage by Age in Yosemite Valley
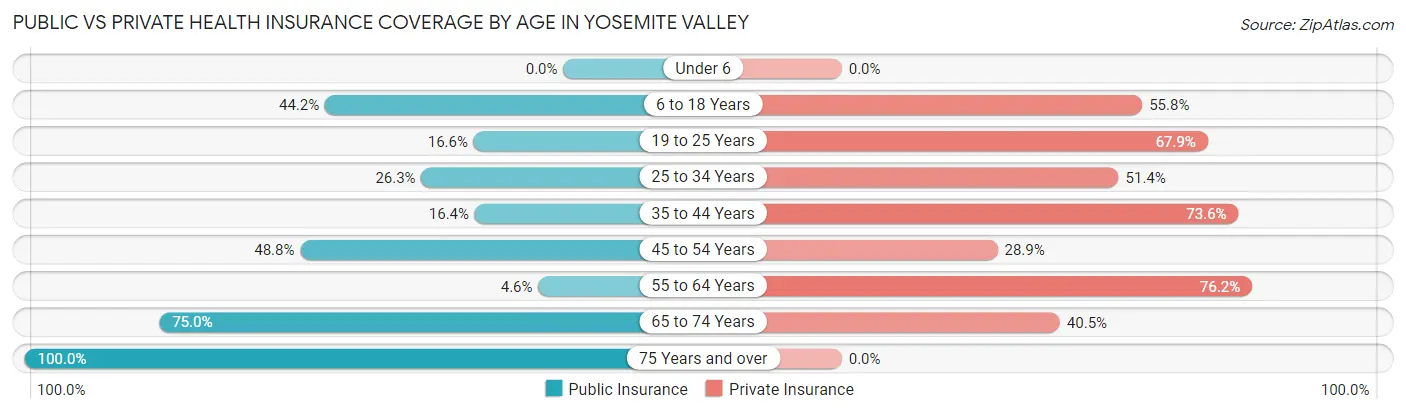
| Age Bracket | Public Insurance | Private Insurance |
| Under 6 | 0 (0.0%) | 0 (0.0%) |
| 6 to 18 Years | 23 (44.2%) | 29 (55.8%) |
| 19 to 25 Years | 58 (16.6%) | 237 (67.9%) |
| 25 to 34 Years | 143 (26.3%) | 279 (51.4%) |
| 35 to 44 Years | 56 (16.4%) | 251 (73.6%) |
| 45 to 54 Years | 103 (48.8%) | 61 (28.9%) |
| 55 to 64 Years | 7 (4.6%) | 115 (76.2%) |
| 65 to 74 Years | 63 (75.0%) | 34 (40.5%) |
| 75 Years and over | 2 (100.0%) | 0 (0.0%) |
| Total | 455 (26.3%) | 1,006 (58.1%) |
Disability Status by Sex by Age in Yosemite Valley
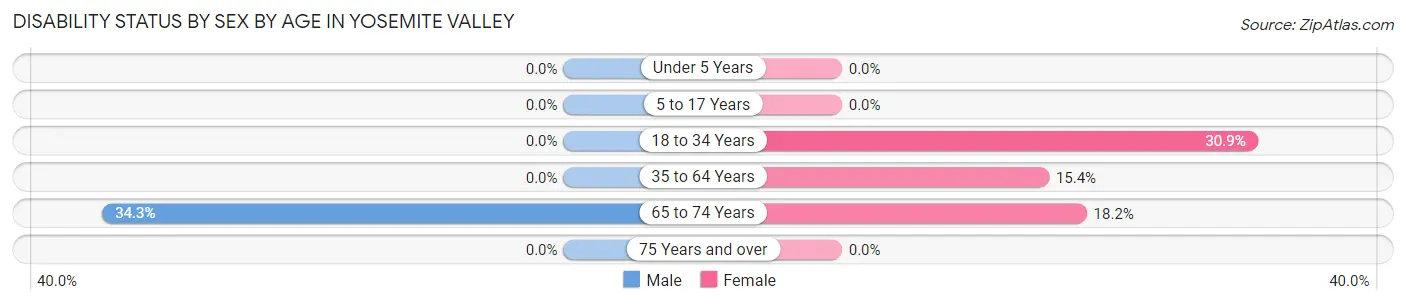
| Age Bracket | Male | Female |
| Under 5 Years | 0 (0.0%) | 0 (0.0%) |
| 5 to 17 Years | 0 (0.0%) | 0 (0.0%) |
| 18 to 34 Years | 0 (0.0%) | 83 (30.9%) |
| 35 to 64 Years | 0 (0.0%) | 28 (15.4%) |
| 65 to 74 Years | 25 (34.3%) | 2 (18.2%) |
| 75 Years and over | 0 (0.0%) | 0 (0.0%) |
Disability Class by Sex by Age in Yosemite Valley
Disability Class: Hearing Difficulty
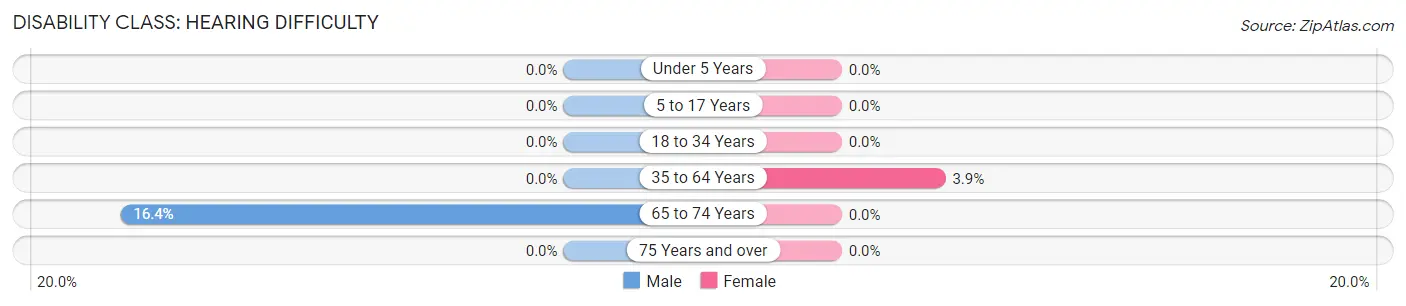
| Age Bracket | Male | Female |
| Under 5 Years | 0 (0.0%) | 0 (0.0%) |
| 5 to 17 Years | 0 (0.0%) | 0 (0.0%) |
| 18 to 34 Years | 0 (0.0%) | 0 (0.0%) |
| 35 to 64 Years | 0 (0.0%) | 7 (3.8%) |
| 65 to 74 Years | 12 (16.4%) | 0 (0.0%) |
| 75 Years and over | 0 (0.0%) | 0 (0.0%) |
Disability Class: Vision Difficulty
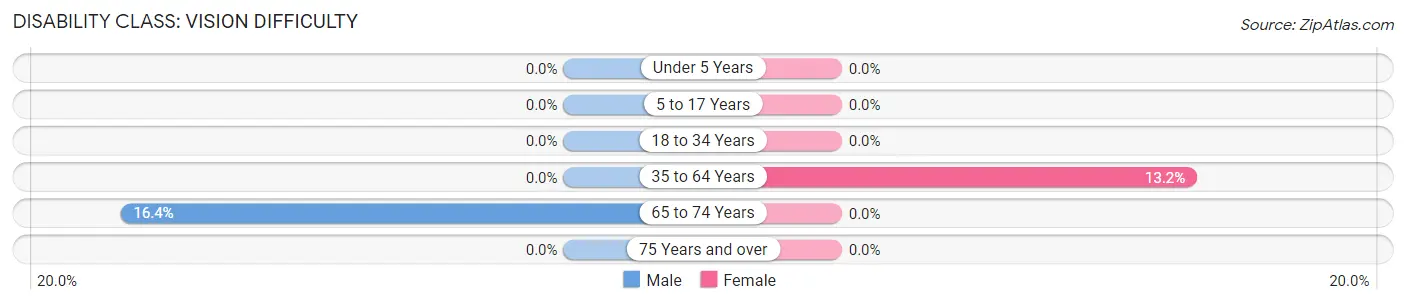
| Age Bracket | Male | Female |
| Under 5 Years | 0 (0.0%) | 0 (0.0%) |
| 5 to 17 Years | 0 (0.0%) | 0 (0.0%) |
| 18 to 34 Years | 0 (0.0%) | 0 (0.0%) |
| 35 to 64 Years | 0 (0.0%) | 24 (13.2%) |
| 65 to 74 Years | 12 (16.4%) | 0 (0.0%) |
| 75 Years and over | 0 (0.0%) | 0 (0.0%) |
Disability Class: Cognitive Difficulty
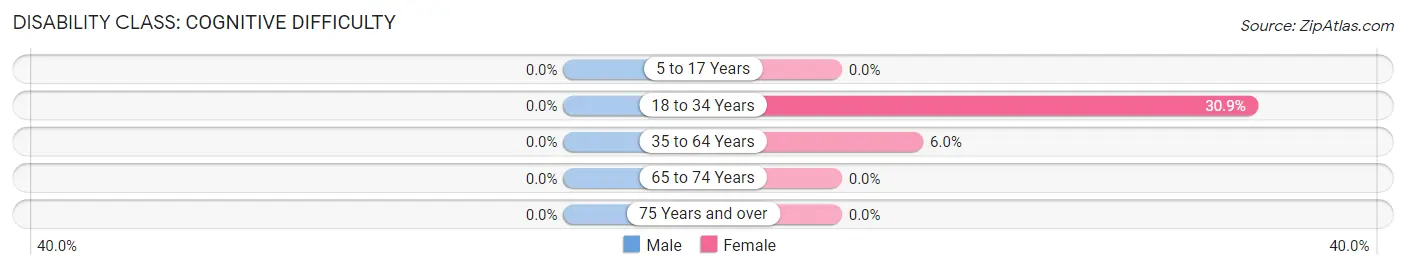
| Age Bracket | Male | Female |
| 5 to 17 Years | 0 (0.0%) | 0 (0.0%) |
| 18 to 34 Years | 0 (0.0%) | 83 (30.9%) |
| 35 to 64 Years | 0 (0.0%) | 11 (6.0%) |
| 65 to 74 Years | 0 (0.0%) | 0 (0.0%) |
| 75 Years and over | 0 (0.0%) | 0 (0.0%) |
Disability Class: Ambulatory Difficulty
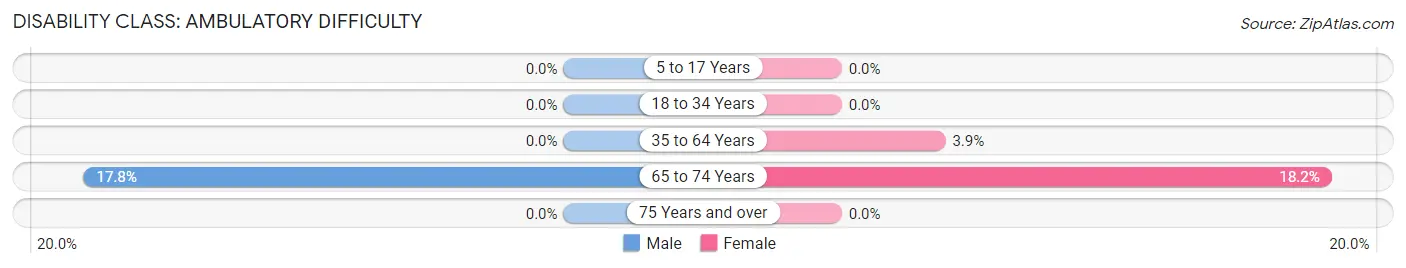
| Age Bracket | Male | Female |
| 5 to 17 Years | 0 (0.0%) | 0 (0.0%) |
| 18 to 34 Years | 0 (0.0%) | 0 (0.0%) |
| 35 to 64 Years | 0 (0.0%) | 7 (3.8%) |
| 65 to 74 Years | 13 (17.8%) | 2 (18.2%) |
| 75 Years and over | 0 (0.0%) | 0 (0.0%) |
Disability Class: Self-Care Difficulty
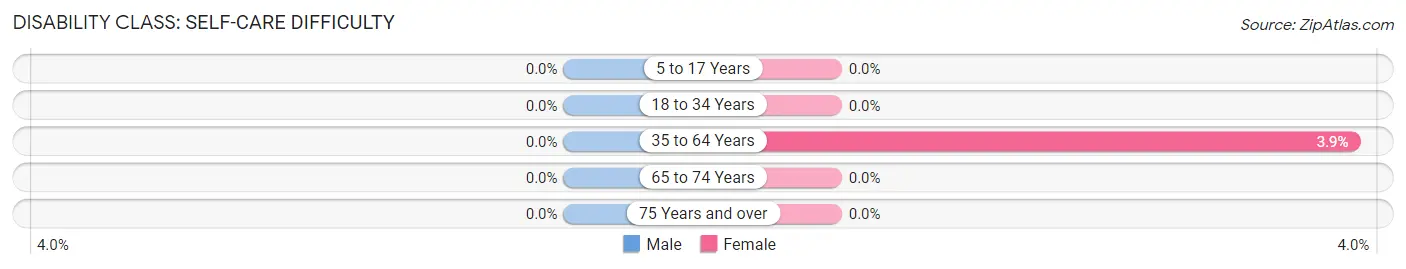
| Age Bracket | Male | Female |
| 5 to 17 Years | 0 (0.0%) | 0 (0.0%) |
| 18 to 34 Years | 0 (0.0%) | 0 (0.0%) |
| 35 to 64 Years | 0 (0.0%) | 7 (3.8%) |
| 65 to 74 Years | 0 (0.0%) | 0 (0.0%) |
| 75 Years and over | 0 (0.0%) | 0 (0.0%) |
Technology Access in Yosemite Valley
Computing Device Access in Yosemite Valley
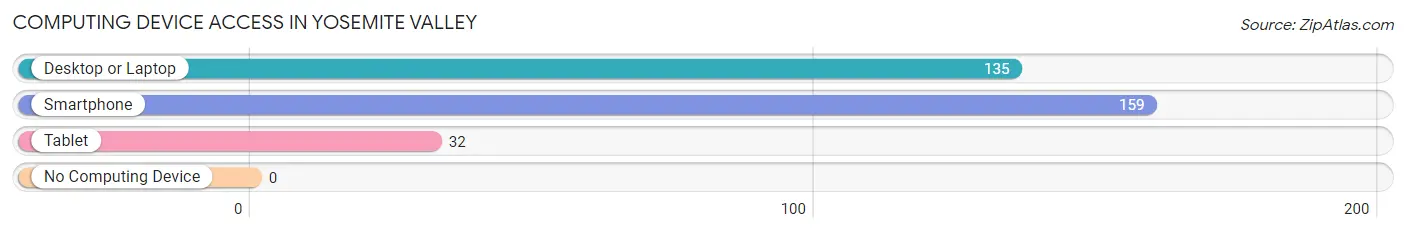
| Device Type | # Households | % Households |
| Desktop or Laptop | 135 | 73.0% |
| Smartphone | 159 | 86.0% |
| Tablet | 32 | 17.3% |
| No Computing Device | 0 | 0.0% |
| Total | 185 | 100.0% |
Internet Access in Yosemite Valley
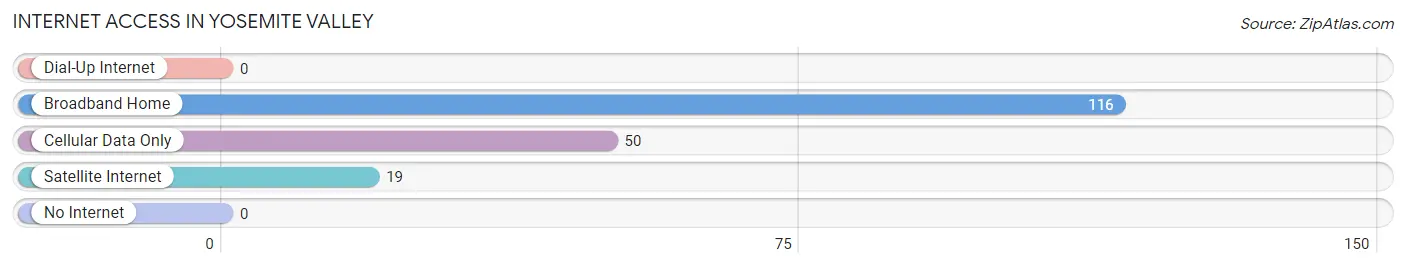
| Internet Type | # Households | % Households |
| Dial-Up Internet | 0 | 0.0% |
| Broadband Home | 116 | 62.7% |
| Cellular Data Only | 50 | 27.0% |
| Satellite Internet | 19 | 10.3% |
| No Internet | 0 | 0.0% |
| Total | 185 | 100.0% |
Yosemite Valley Summary
Yosemite Valley is a stunningly beautiful valley located in the Sierra Nevada mountain range in California. It is one of the most iconic and beloved natural landscapes in the United States, and is a popular destination for hikers, campers, and nature lovers. Yosemite Valley is home to some of the most spectacular scenery in the world, including towering granite cliffs, cascading waterfalls, and lush meadows. The valley is also home to a variety of wildlife, including black bears, mule deer, and numerous species of birds.
History
Yosemite Valley has been inhabited by humans for thousands of years. The Ahwahneechee people were the first to settle in the area, and they lived in the valley for centuries before the arrival of Europeans. The Ahwahneechee were hunter-gatherers who lived in small villages and hunted game in the surrounding mountains.
In 1851, the Mariposa Battalion, a group of American soldiers, entered the valley and began to explore the area. They were the first non-native people to explore the valley, and they named it “Yosemite” after the Ahwahneechee word for “grizzly bear.”
In 1864, President Abraham Lincoln signed the Yosemite Grant, which set aside the valley and the surrounding area as a public trust. This was the first time that the federal government had set aside land for public use and preservation.
In 1890, Yosemite Valley became part of Yosemite National Park, which was the first national park in the United States. The park was created to protect the valley’s unique natural beauty and to provide a place for people to enjoy the outdoors.
Geography
Yosemite Valley is located in the Sierra Nevada mountain range in California. The valley is approximately 7 miles long and 1 mile wide, and is surrounded by towering granite cliffs. The valley is home to several waterfalls, including Yosemite Falls, which is the tallest waterfall in North America.
The valley is located at an elevation of 4,000 feet, and the surrounding mountains reach heights of up to 13,000 feet. The valley is home to a variety of vegetation, including coniferous forests, meadows, and oak woodlands.
Economy
Yosemite Valley is a popular tourist destination, and the local economy is largely dependent on tourism. The valley is home to several hotels, restaurants, and other businesses that cater to visitors. The park also offers a variety of recreational activities, including hiking, camping, and rock climbing.
The park also generates revenue from entrance fees, camping fees, and other fees. In addition, the park receives funding from the federal government and from private donations.
Demographics
Yosemite Valley is home to a small permanent population of approximately 200 people. The majority of the population is employed in the tourism industry, and many of the residents are seasonal workers who come to the valley during the summer months.
The valley is also home to a variety of wildlife, including black bears, mule deer, and numerous species of birds.
Conclusion
Yosemite Valley is one of the most iconic and beloved natural landscapes in the United States. The valley is home to some of the most spectacular scenery in the world, and is a popular destination for hikers, campers, and nature lovers. The valley has a long and rich history, and is home to a variety of wildlife. The local economy is largely dependent on tourism, and the valley is home to a small permanent population of approximately 200 people.
Common Questions
What is Per Capita Income in Yosemite Valley?
Per Capita income in Yosemite Valley is $34,905.
What is the Median Household income in Yosemite Valley?
Median Household Income in Yosemite Valley is $40,987.
What is Income or Wage Gap in Yosemite Valley?
Income or Wage Gap in Yosemite Valley is 4.7%.
Women in Yosemite Valley earn 95.3 cents for every dollar earned by a man.
What is Inequality or Gini Index in Yosemite Valley?
Inequality or Gini Index in Yosemite Valley is 0.29.
What is the Total Population of Yosemite Valley?
Total Population of Yosemite Valley is 1,737.
What is the Total Male Population of Yosemite Valley?
Total Male Population of Yosemite Valley is 1,223.
What is the Total Female Population of Yosemite Valley?
Total Female Population of Yosemite Valley is 514.
What is the Ratio of Males per 100 Females in Yosemite Valley?
There are 237.94 Males per 100 Females in Yosemite Valley.
What is the Ratio of Females per 100 Males in Yosemite Valley?
There are 42.03 Females per 100 Males in Yosemite Valley.
What is the Median Population Age in Yosemite Valley?
Median Population Age in Yosemite Valley is 32.7 Years.
What is the Average Family Size in Yosemite Valley
Average Family Size in Yosemite Valley is 2.4 People.
What is the Average Household Size in Yosemite Valley
Average Household Size in Yosemite Valley is 1.1 People.
How Large is the Labor Force in Yosemite Valley?
There are 1,535 People in the Labor Forcein in Yosemite Valley.
What is the Percentage of People in the Labor Force in Yosemite Valley?
89.9% of People are in the Labor Force in Yosemite Valley.
What is the Unemployment Rate in Yosemite Valley?
Unemployment Rate in Yosemite Valley is 4.5%.