Cities with the Highest Percentage of Population Employed in Food Preparation & Serving in Massachusetts
RELATED REPORTS & OPTIONS
Food Preparation & Serving
Massachusetts
Compare Cities
Map of Cities with the Highest Percentage of Population Employed in Food Preparation & Serving in Massachusetts
0.0%
30.0%
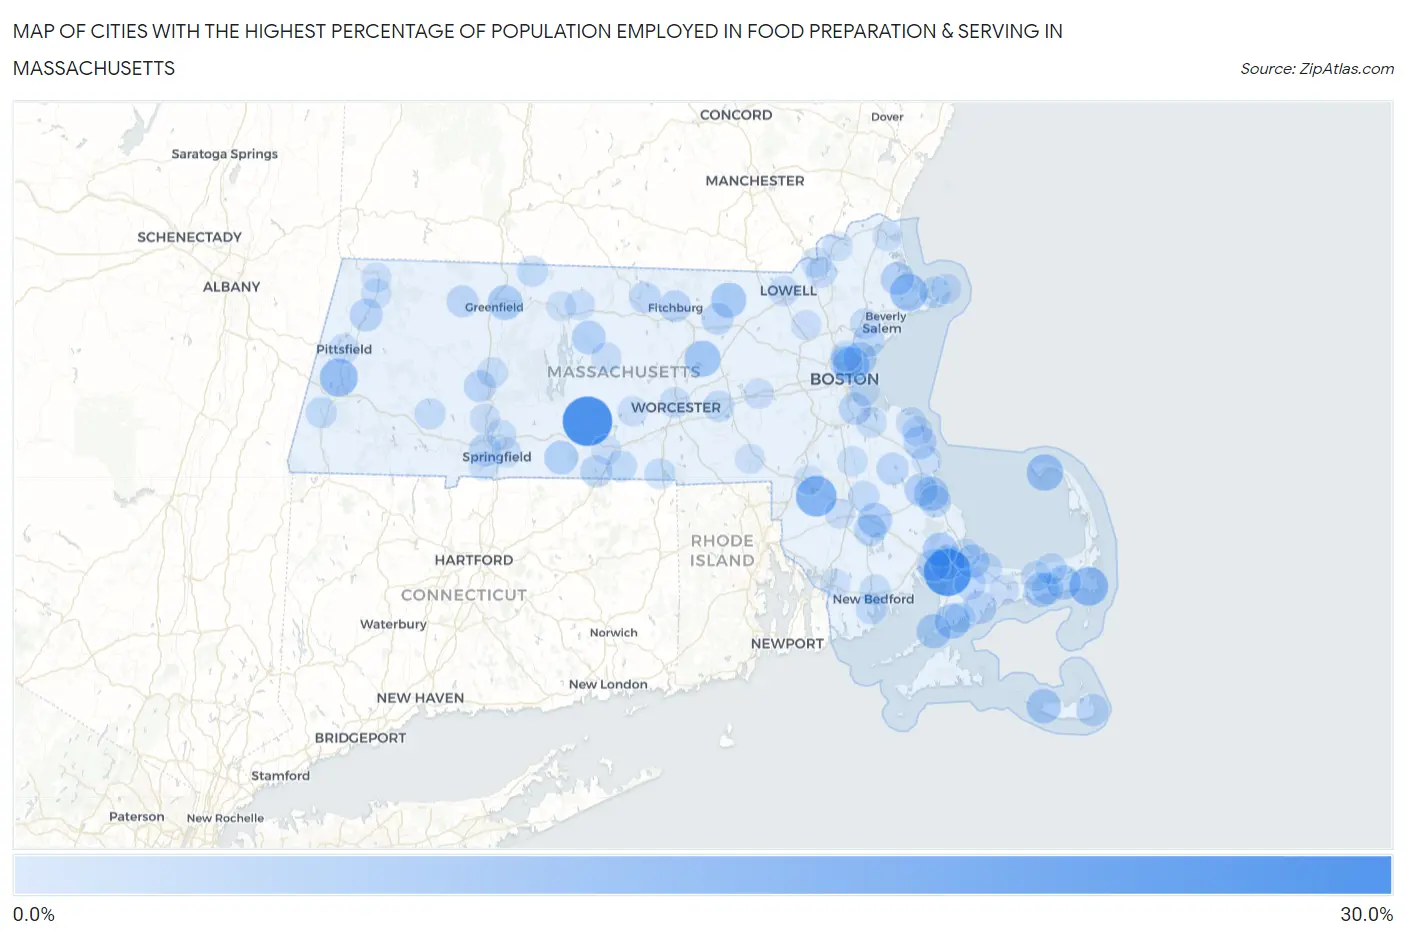
Cities with the Highest Percentage of Population Employed in Food Preparation & Serving in Massachusetts
| City | % Employed | vs State | vs National | |
| 1. | Warren | 26.4% | 4.6%(+21.8)#1 | 5.3%(+21.1)#452 |
| 2. | Monument Beach | 23.9% | 4.6%(+19.3)#2 | 5.3%(+18.7)#552 |
| 3. | Norton Center | 16.4% | 4.6%(+11.8)#3 | 5.3%(+11.2)#1,304 |
| 4. | West Chatham | 14.5% | 4.6%(+9.88)#4 | 5.3%(+9.21)#1,771 |
| 5. | Lenox | 13.5% | 4.6%(+8.89)#5 | 5.3%(+8.21)#2,069 |
| 6. | Amherst | 12.9% | 4.6%(+8.26)#6 | 5.3%(+7.59)#2,314 |
| 7. | Essex | 12.7% | 4.6%(+8.10)#7 | 5.3%(+7.42)#2,399 |
| 8. | Provincetown | 12.2% | 4.6%(+7.55)#8 | 5.3%(+6.88)#2,666 |
| 9. | Chelsea | 11.7% | 4.6%(+7.13)#9 | 5.3%(+6.45)#2,915 |
| 10. | Clinton | 11.4% | 4.6%(+6.75)#10 | 5.3%(+6.07)#3,157 |
| 11. | Groton | 10.5% | 4.6%(+5.92)#11 | 5.3%(+5.24)#3,689 |
| 12. | Teaticket | 10.5% | 4.6%(+5.85)#12 | 5.3%(+5.17)#3,755 |
| 13. | Turners Falls | 10.0% | 4.6%(+5.44)#13 | 5.3%(+4.76)#4,063 |
| 14. | Madaket | 9.9% | 4.6%(+5.29)#14 | 5.3%(+4.61)#4,194 |
| 15. | Woods Hole | 9.9% | 4.6%(+5.27)#15 | 5.3%(+4.59)#4,199 |
| 16. | South Yarmouth | 9.9% | 4.6%(+5.26)#16 | 5.3%(+4.59)#4,211 |
| 17. | Buzzards Bay | 9.8% | 4.6%(+5.20)#17 | 5.3%(+4.52)#4,255 |
| 18. | North Plymouth | 9.8% | 4.6%(+5.15)#18 | 5.3%(+4.48)#4,296 |
| 19. | White Island Shores | 9.7% | 4.6%(+5.13)#19 | 5.3%(+4.45)#4,326 |
| 20. | Northwest Harwich | 9.7% | 4.6%(+5.04)#20 | 5.3%(+4.37)#4,385 |
| 21. | Middleborough Center | 9.4% | 4.6%(+4.76)#21 | 5.3%(+4.09)#4,668 |
| 22. | Monson Center | 9.0% | 4.6%(+4.42)#22 | 5.3%(+3.74)#5,029 |
| 23. | Petersham | 9.0% | 4.6%(+4.35)#23 | 5.3%(+3.68)#5,104 |
| 24. | Sandwich | 8.7% | 4.6%(+4.10)#24 | 5.3%(+3.42)#5,413 |
| 25. | Kingston | 8.5% | 4.6%(+3.93)#25 | 5.3%(+3.25)#5,617 |
| 26. | Revere | 8.5% | 4.6%(+3.91)#26 | 5.3%(+3.23)#5,636 |
| 27. | Ipswich | 8.4% | 4.6%(+3.83)#27 | 5.3%(+3.15)#5,739 |
| 28. | Marshfield Hills | 8.4% | 4.6%(+3.77)#28 | 5.3%(+3.09)#5,813 |
| 29. | Mashpee Neck | 8.3% | 4.6%(+3.67)#29 | 5.3%(+3.00)#5,959 |
| 30. | Everett | 8.2% | 4.6%(+3.60)#30 | 5.3%(+2.92)#6,049 |
| 31. | Onset | 8.1% | 4.6%(+3.46)#31 | 5.3%(+2.78)#6,244 |
| 32. | Cheshire | 8.1% | 4.6%(+3.44)#32 | 5.3%(+2.76)#6,267 |
| 33. | Siasconset | 7.7% | 4.6%(+3.08)#33 | 5.3%(+2.41)#6,849 |
| 34. | North Lakeville | 7.7% | 4.6%(+3.08)#34 | 5.3%(+2.40)#6,865 |
| 35. | Quincy | 7.7% | 4.6%(+3.08)#35 | 5.3%(+2.40)#6,867 |
| 36. | Hanson | 7.4% | 4.6%(+2.77)#36 | 5.3%(+2.10)#7,307 |
| 37. | West Springfield Town | 7.4% | 4.6%(+2.76)#37 | 5.3%(+2.08)#7,336 |
| 38. | Holland | 7.3% | 4.6%(+2.72)#38 | 5.3%(+2.04)#7,404 |
| 39. | Devens | 7.2% | 4.6%(+2.62)#39 | 5.3%(+1.95)#7,560 |
| 40. | Plymouth | 7.2% | 4.6%(+2.62)#40 | 5.3%(+1.94)#7,572 |
| 41. | Northampton | 7.2% | 4.6%(+2.61)#41 | 5.3%(+1.94)#7,581 |
| 42. | West Dennis | 7.2% | 4.6%(+2.56)#42 | 5.3%(+1.88)#7,672 |
| 43. | Fitchburg | 7.1% | 4.6%(+2.48)#43 | 5.3%(+1.80)#7,841 |
| 44. | Shelburne Falls | 7.1% | 4.6%(+2.45)#44 | 5.3%(+1.78)#7,893 |
| 45. | Forestdale | 7.0% | 4.6%(+2.37)#45 | 5.3%(+1.69)#8,050 |
| 46. | Lynn | 7.0% | 4.6%(+2.34)#46 | 5.3%(+1.66)#8,097 |
| 47. | South Ashburnham | 6.9% | 4.6%(+2.25)#47 | 5.3%(+1.58)#8,265 |
| 48. | Gloucester | 6.7% | 4.6%(+2.14)#48 | 5.3%(+1.46)#8,509 |
| 49. | Bliss Corner | 6.5% | 4.6%(+1.90)#49 | 5.3%(+1.23)#9,054 |
| 50. | Southbridge Town | 6.5% | 4.6%(+1.88)#50 | 5.3%(+1.20)#9,130 |
| 51. | East Sandwich | 6.5% | 4.6%(+1.86)#51 | 5.3%(+1.18)#9,171 |
| 52. | Housatonic | 6.5% | 4.6%(+1.85)#52 | 5.3%(+1.18)#9,177 |
| 53. | Westborough | 6.5% | 4.6%(+1.85)#53 | 5.3%(+1.17)#9,194 |
| 54. | Northfield | 6.5% | 4.6%(+1.85)#54 | 5.3%(+1.17)#9,196 |
| 55. | East Dennis | 6.4% | 4.6%(+1.82)#55 | 5.3%(+1.14)#9,267 |
| 56. | Malden | 6.3% | 4.6%(+1.71)#56 | 5.3%(+1.04)#9,504 |
| 57. | New Bedford | 6.3% | 4.6%(+1.67)#57 | 5.3%(+0.998)#9,581 |
| 58. | Bridgewater Town | 6.2% | 4.6%(+1.62)#58 | 5.3%(+0.949)#9,715 |
| 59. | Huntington | 6.1% | 4.6%(+1.50)#59 | 5.3%(+0.823)#10,053 |
| 60. | Webster | 6.0% | 4.6%(+1.44)#60 | 5.3%(+0.762)#10,203 |
| 61. | East Falmouth | 6.0% | 4.6%(+1.38)#61 | 5.3%(+0.703)#10,362 |
| 62. | Lawrence | 6.0% | 4.6%(+1.37)#62 | 5.3%(+0.695)#10,378 |
| 63. | Peabody | 6.0% | 4.6%(+1.35)#63 | 5.3%(+0.672)#10,443 |
| 64. | Hatfield | 5.9% | 4.6%(+1.32)#64 | 5.3%(+0.644)#10,501 |
| 65. | Worcester | 5.9% | 4.6%(+1.27)#65 | 5.3%(+0.596)#10,622 |
| 66. | Methuen Town | 5.9% | 4.6%(+1.25)#66 | 5.3%(+0.574)#10,658 |
| 67. | Chicopee | 5.8% | 4.6%(+1.15)#67 | 5.3%(+0.479)#10,899 |
| 68. | Weymouth Town | 5.8% | 4.6%(+1.15)#68 | 5.3%(+0.476)#10,910 |
| 69. | Lowell | 5.7% | 4.6%(+1.13)#69 | 5.3%(+0.457)#10,956 |
| 70. | North Scituate | 5.7% | 4.6%(+1.08)#70 | 5.3%(+0.405)#11,116 |
| 71. | Yarmouth Port | 5.7% | 4.6%(+1.07)#71 | 5.3%(+0.393)#11,152 |
| 72. | Scituate | 5.7% | 4.6%(+1.07)#72 | 5.3%(+0.391)#11,158 |
| 73. | Barre | 5.6% | 4.6%(+1.02)#73 | 5.3%(+0.344)#11,278 |
| 74. | Barnstable Town | 5.6% | 4.6%(+0.952)#74 | 5.3%(+0.276)#11,461 |
| 75. | North Attleborough | 5.5% | 4.6%(+0.939)#75 | 5.3%(+0.264)#11,520 |
| 76. | Sagamore | 5.5% | 4.6%(+0.939)#76 | 5.3%(+0.263)#11,522 |
| 77. | Rockport | 5.5% | 4.6%(+0.936)#77 | 5.3%(+0.260)#11,528 |
| 78. | Framingham | 5.5% | 4.6%(+0.918)#78 | 5.3%(+0.243)#11,570 |
| 79. | Pittsfield | 5.5% | 4.6%(+0.901)#79 | 5.3%(+0.226)#11,601 |
| 80. | Spencer | 5.4% | 4.6%(+0.781)#80 | 5.3%(+0.105)#11,905 |
| 81. | Springfield | 5.4% | 4.6%(+0.770)#81 | 5.3%(+0.095)#11,931 |
| 82. | Holyoke | 5.4% | 4.6%(+0.745)#82 | 5.3%(+0.070)#12,005 |
| 83. | Athol | 5.3% | 4.6%(+0.721)#83 | 5.3%(+0.045)#12,084 |
| 84. | Adams | 5.3% | 4.6%(+0.711)#84 | 5.3%(+0.036)#12,100 |
| 85. | Green Harbor | 5.3% | 4.6%(+0.677)#85 | 5.3%(+0.001)#12,186 |
| 86. | Brockton | 5.3% | 4.6%(+0.669)#86 | 5.3%(-0.007)#12,205 |
| 87. | Pinehurst | 5.3% | 4.6%(+0.668)#87 | 5.3%(-0.008)#12,209 |
| 88. | Taunton | 5.3% | 4.6%(+0.663)#88 | 5.3%(-0.013)#12,225 |
| 89. | Marshfield | 5.3% | 4.6%(+0.640)#89 | 5.3%(-0.036)#12,306 |
| 90. | Greenfield | 5.2% | 4.6%(+0.636)#90 | 5.3%(-0.039)#12,316 |
| 91. | Bellingham | 5.2% | 4.6%(+0.635)#91 | 5.3%(-0.040)#12,322 |
| 92. | Fiskdale | 5.2% | 4.6%(+0.615)#92 | 5.3%(-0.060)#12,370 |
| 93. | Boston | 5.2% | 4.6%(+0.610)#93 | 5.3%(-0.065)#12,381 |
| 94. | North Adams | 5.2% | 4.6%(+0.608)#94 | 5.3%(-0.068)#12,386 |
| 95. | Mansfield Center | 5.2% | 4.6%(+0.564)#95 | 5.3%(-0.111)#12,505 |
| 96. | Newburyport | 5.2% | 4.6%(+0.551)#96 | 5.3%(-0.124)#12,539 |
| 97. | Fall River | 5.1% | 4.6%(+0.530)#97 | 5.3%(-0.146)#12,604 |
| 98. | Haverhill | 5.1% | 4.6%(+0.524)#98 | 5.3%(-0.151)#12,623 |
| 99. | Agawam Town | 5.1% | 4.6%(+0.498)#99 | 5.3%(-0.177)#12,704 |
| 100. | Orange | 5.1% | 4.6%(+0.477)#100 | 5.3%(-0.198)#12,768 |
Common Questions
What are the Top 10 Cities with the Highest Percentage of Population Employed in Food Preparation & Serving in Massachusetts?
Top 10 Cities with the Highest Percentage of Population Employed in Food Preparation & Serving in Massachusetts are:
#1
26.4%
#2
23.9%
#3
16.4%
#4
14.5%
#5
13.5%
#6
12.7%
#7
12.2%
#8
11.7%
#9
11.4%
#10
10.5%
What city has the Highest Percentage of Population Employed in Food Preparation & Serving in Massachusetts?
Warren has the Highest Percentage of Population Employed in Food Preparation & Serving in Massachusetts with 26.4%.
What is the Percentage of Population Employed in Food Preparation & Serving in the State of Massachusetts?
Percentage of Population Employed in Food Preparation & Serving in Massachusetts is 4.6%.
What is the Percentage of Population Employed in Food Preparation & Serving in the United States?
Percentage of Population Employed in Food Preparation & Serving in the United States is 5.3%.