Alondra Park, CA Map & Demographics
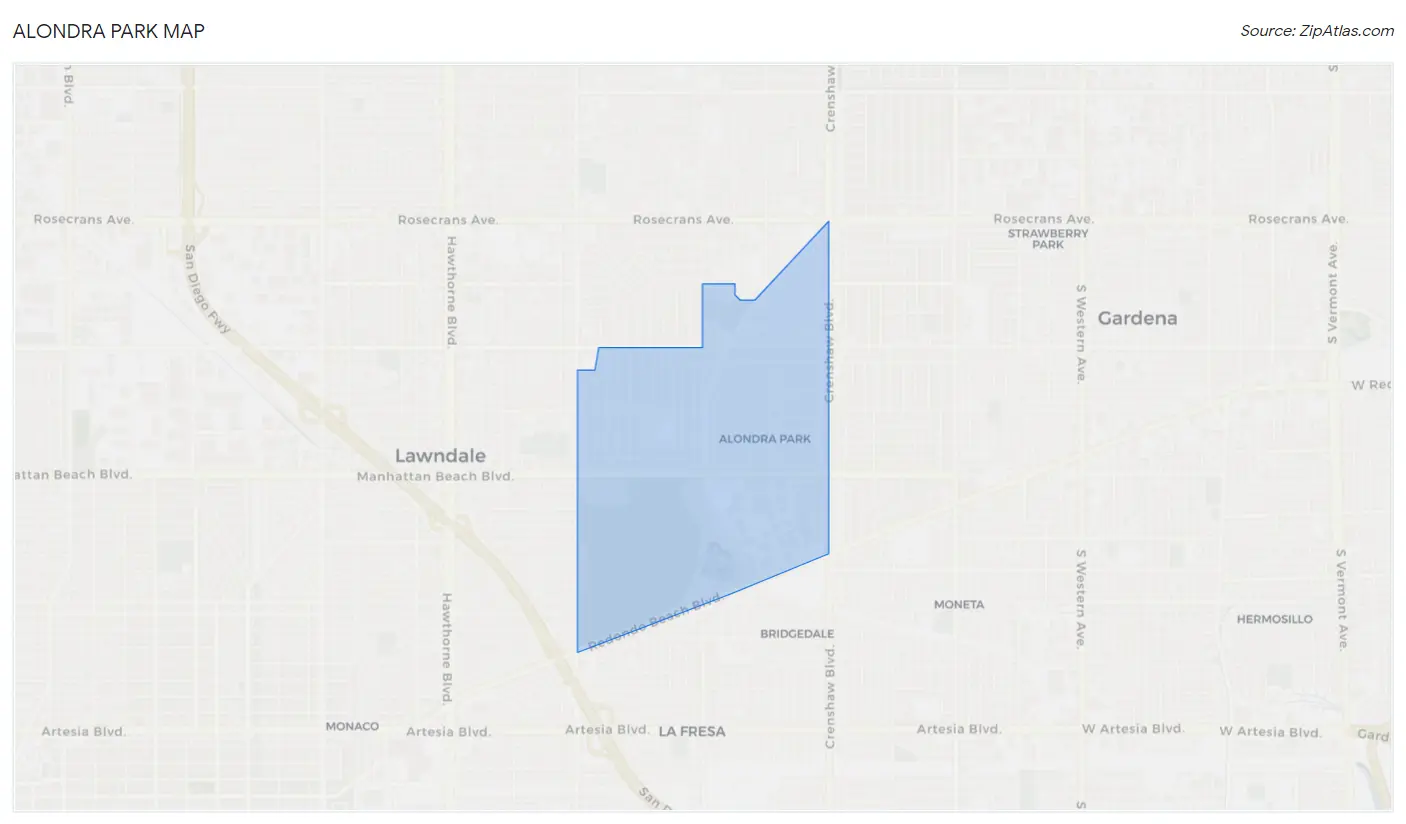
Alondra Park Map
Alondra Park Overview
$34,357
PER CAPITA INCOME
$91,991
AVG FAMILY INCOME
$79,974
AVG HOUSEHOLD INCOME
15.8%
WAGE / INCOME GAP [ % ]
84.2¢/ $1
WAGE / INCOME GAP [ $ ]
0.38
INEQUALITY / GINI INDEX
8,314
TOTAL POPULATION
4,050
MALE POPULATION
4,264
FEMALE POPULATION
94.98
MALES / 100 FEMALES
105.28
FEMALES / 100 MALES
39.5
MEDIAN AGE
3.5
AVG FAMILY SIZE
3.0
AVG HOUSEHOLD SIZE
4,318
LABOR FORCE [ PEOPLE ]
62.9%
PERCENT IN LABOR FORCE
4.0%
UNEMPLOYMENT RATE
Income in Alondra Park
Income Overview in Alondra Park
Per Capita Income in Alondra Park is $34,357, while median incomes of families and households are $91,991 and $79,974 respectively.
| Characteristic | Number | Measure |
| Per Capita Income | 8,314 | $34,357 |
| Median Family Income | 2,012 | $91,991 |
| Mean Family Income | 2,012 | $107,071 |
| Median Household Income | 2,764 | $79,974 |
| Mean Household Income | 2,764 | $100,950 |
| Income Deficit | 2,012 | $0 |
| Wage / Income Gap (%) | 8,314 | 15.80% |
| Wage / Income Gap ($) | 8,314 | 84.20¢ per $1 |
| Gini / Inequality Index | 8,314 | 0.38 |
Earnings by Sex in Alondra Park
Average Earnings in Alondra Park are $40,825, $42,419 for men and $35,716 for women, a difference of 15.8%.
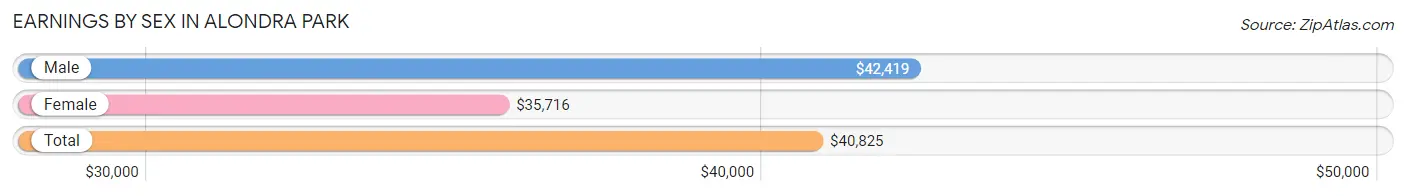
| Sex | Number | Average Earnings |
| Male | 2,486 (57.1%) | $42,419 |
| Female | 1,869 (42.9%) | $35,716 |
| Total | 4,355 (100.0%) | $40,825 |
Earnings by Sex by Income Bracket in Alondra Park
The most common earnings brackets in Alondra Park are $40,000 to $44,999 for men (331 | 13.3%) and $100,000+ for women (253 | 13.5%).
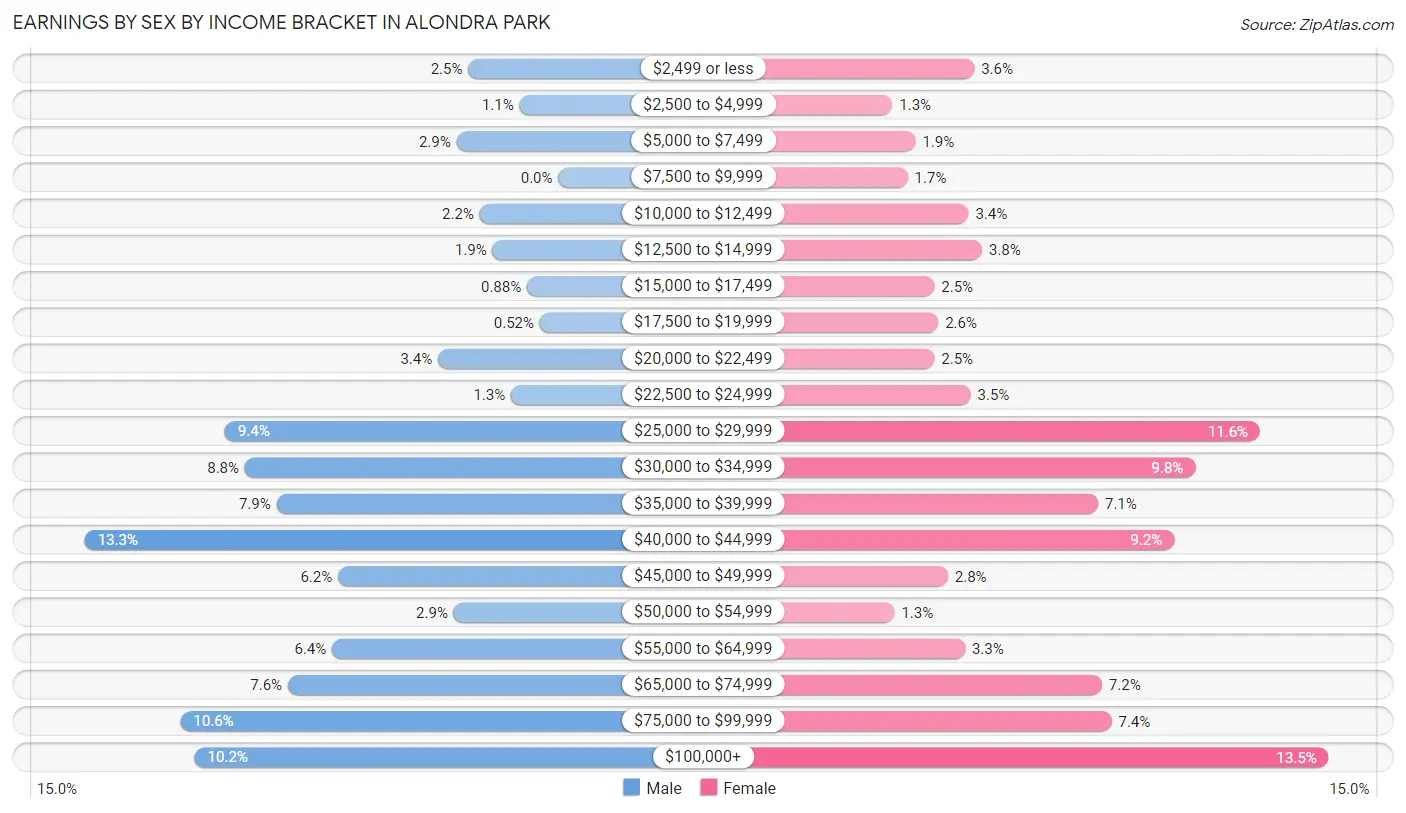
| Income | Male | Female |
| $2,499 or less | 63 (2.5%) | 67 (3.6%) |
| $2,500 to $4,999 | 27 (1.1%) | 24 (1.3%) |
| $5,000 to $7,499 | 71 (2.9%) | 36 (1.9%) |
| $7,500 to $9,999 | 0 (0.0%) | 32 (1.7%) |
| $10,000 to $12,499 | 55 (2.2%) | 64 (3.4%) |
| $12,500 to $14,999 | 46 (1.8%) | 71 (3.8%) |
| $15,000 to $17,499 | 22 (0.9%) | 46 (2.5%) |
| $17,500 to $19,999 | 13 (0.5%) | 48 (2.6%) |
| $20,000 to $22,499 | 84 (3.4%) | 46 (2.5%) |
| $22,500 to $24,999 | 33 (1.3%) | 65 (3.5%) |
| $25,000 to $29,999 | 233 (9.4%) | 217 (11.6%) |
| $30,000 to $34,999 | 219 (8.8%) | 183 (9.8%) |
| $35,000 to $39,999 | 197 (7.9%) | 132 (7.1%) |
| $40,000 to $44,999 | 331 (13.3%) | 172 (9.2%) |
| $45,000 to $49,999 | 154 (6.2%) | 53 (2.8%) |
| $50,000 to $54,999 | 73 (2.9%) | 25 (1.3%) |
| $55,000 to $64,999 | 158 (6.4%) | 62 (3.3%) |
| $65,000 to $74,999 | 189 (7.6%) | 134 (7.2%) |
| $75,000 to $99,999 | 264 (10.6%) | 139 (7.4%) |
| $100,000+ | 254 (10.2%) | 253 (13.5%) |
| Total | 2,486 (100.0%) | 1,869 (100.0%) |
Earnings by Sex by Educational Attainment in Alondra Park
Average earnings in Alondra Park are $43,940 for men and $40,368 for women, a difference of 8.1%. Men with an educational attainment of graduate degree enjoy the highest average annual earnings of $81,354, while those with less than high school education earn the least with $34,918. Women with an educational attainment of graduate degree earn the most with the average annual earnings of $101,591, while those with less than high school education have the smallest earnings of $27,944.
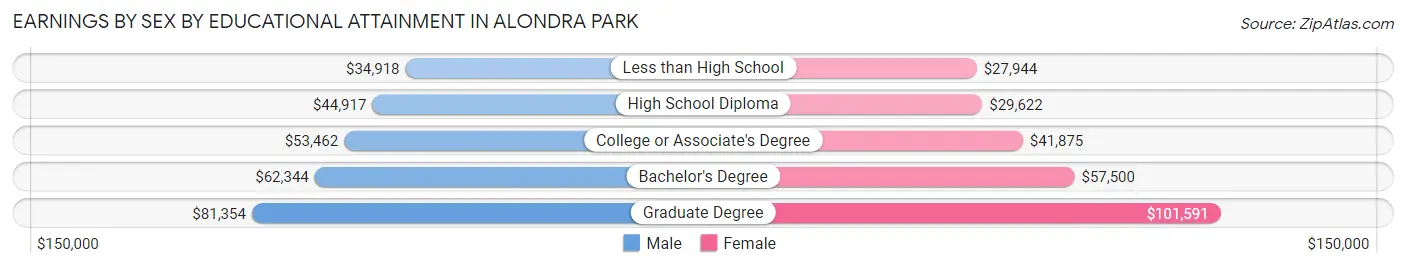
| Educational Attainment | Male Income | Female Income |
| Less than High School | $34,918 | $27,944 |
| High School Diploma | $44,917 | $29,622 |
| College or Associate's Degree | $53,462 | $41,875 |
| Bachelor's Degree | $62,344 | $57,500 |
| Graduate Degree | $81,354 | $101,591 |
| Total | $43,940 | $40,368 |
Family Income in Alondra Park
Family Income Brackets in Alondra Park
According to the Alondra Park family income data, there are 509 families falling into the $100,000 to $149,999 income range, which is the most common income bracket and makes up 25.3% of all families.
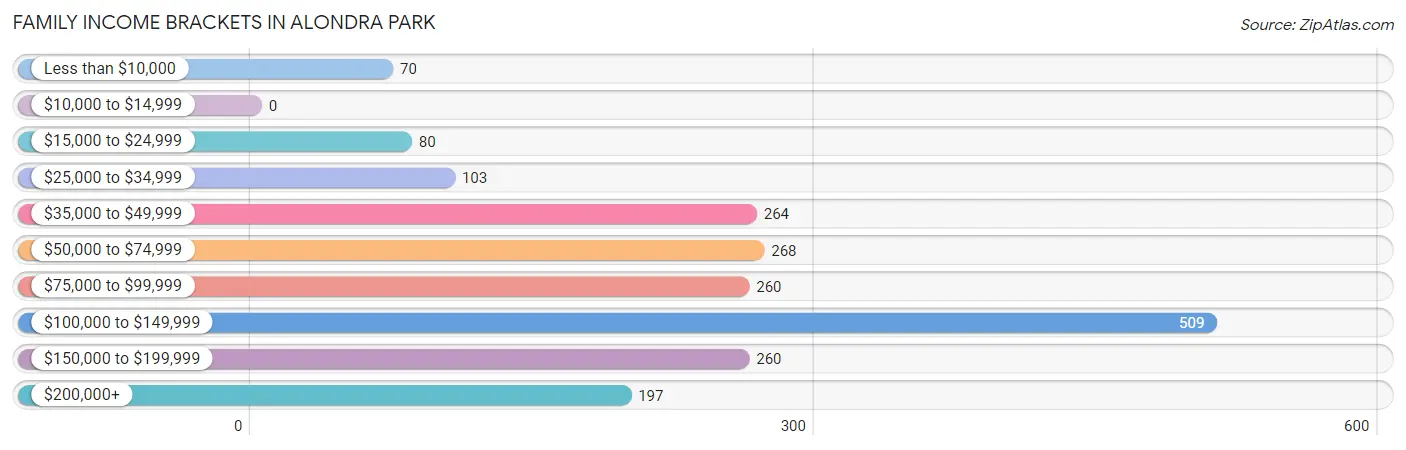
| Income Bracket | # Families | % Families |
| Less than $10,000 | 70 | 3.5% |
| $10,000 to $14,999 | 0 | 0.0% |
| $15,000 to $24,999 | 80 | 4.0% |
| $25,000 to $34,999 | 103 | 5.1% |
| $35,000 to $49,999 | 264 | 13.1% |
| $50,000 to $74,999 | 268 | 13.3% |
| $75,000 to $99,999 | 260 | 12.9% |
| $100,000 to $149,999 | 509 | 25.3% |
| $150,000 to $199,999 | 260 | 12.9% |
| $200,000+ | 197 | 9.8% |
Family Income by Famaliy Size in Alondra Park
6-person families (150 | 7.5%) account for the highest median family income in Alondra Park with $106,923 per family, while 2-person families (782 | 38.9%) have the highest median income of $43,482 per family member.
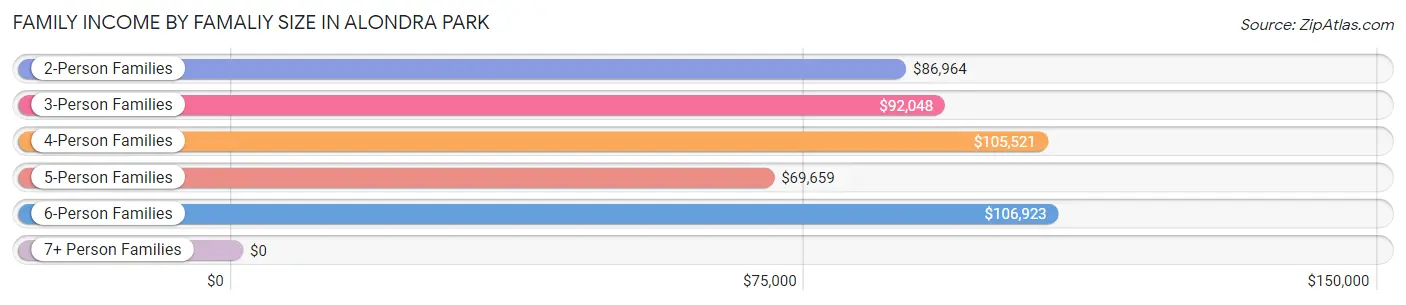
| Income Bracket | # Families | Median Income |
| 2-Person Families | 782 (38.9%) | $86,964 |
| 3-Person Families | 413 (20.5%) | $92,048 |
| 4-Person Families | 405 (20.1%) | $105,521 |
| 5-Person Families | 202 (10.0%) | $69,659 |
| 6-Person Families | 150 (7.5%) | $106,923 |
| 7+ Person Families | 60 (3.0%) | $0 |
| Total | 2,012 (100.0%) | $91,991 |
Family Income by Number of Earners in Alondra Park
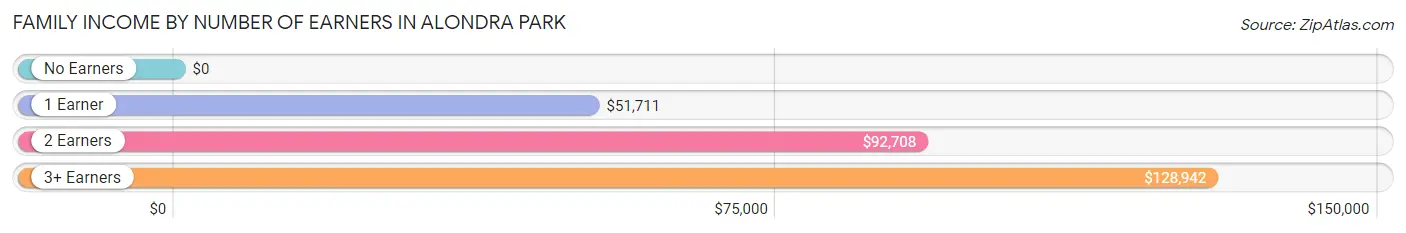
| Number of Earners | # Families | Median Income |
| No Earners | 353 (17.5%) | $0 |
| 1 Earner | 638 (31.7%) | $51,711 |
| 2 Earners | 590 (29.3%) | $92,708 |
| 3+ Earners | 431 (21.4%) | $128,942 |
| Total | 2,012 (100.0%) | $91,991 |
Household Income in Alondra Park
Household Income Brackets in Alondra Park
With 594 households falling in the category, the $100,000 to $149,999 income range is the most frequent in Alondra Park, accounting for 21.5% of all households.
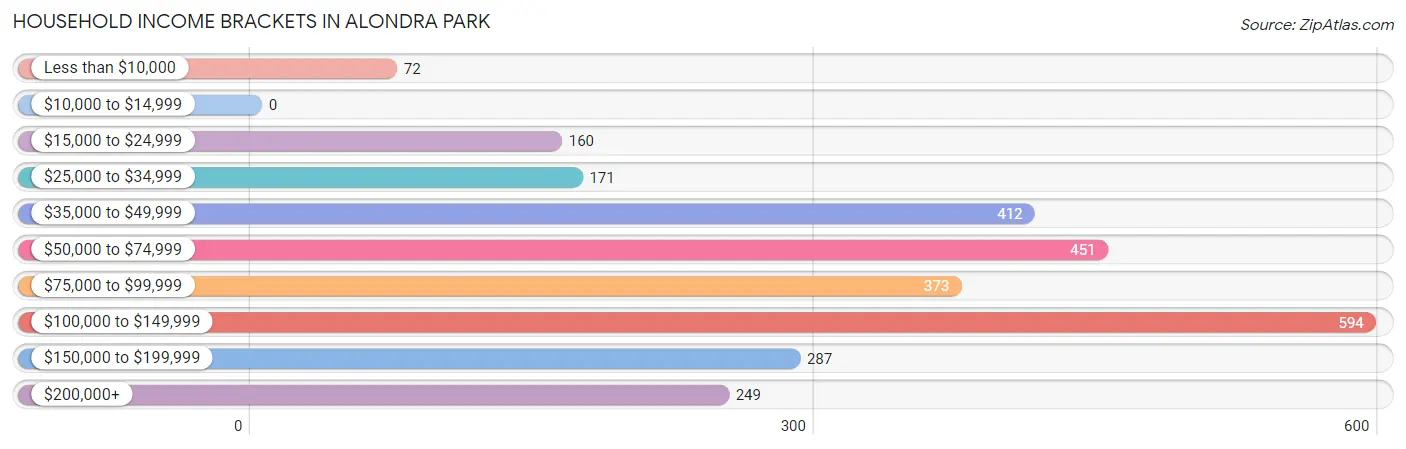
| Income Bracket | # Households | % Households |
| Less than $10,000 | 72 | 2.6% |
| $10,000 to $14,999 | 0 | 0.0% |
| $15,000 to $24,999 | 160 | 5.8% |
| $25,000 to $34,999 | 171 | 6.2% |
| $35,000 to $49,999 | 412 | 14.9% |
| $50,000 to $74,999 | 451 | 16.3% |
| $75,000 to $99,999 | 373 | 13.5% |
| $100,000 to $149,999 | 594 | 21.5% |
| $150,000 to $199,999 | 287 | 10.4% |
| $200,000+ | 249 | 9.0% |
Household Income by Householder Age in Alondra Park
The median household income in Alondra Park is $79,974, with the highest median household income of $105,238 found in the 45 to 64 years age bracket for the primary householder. A total of 1,008 households (36.5%) fall into this category. Meanwhile, the 25 to 44 years age bracket for the primary householder has the lowest median household income of $70,084, with 793 households (28.7%) in this group.
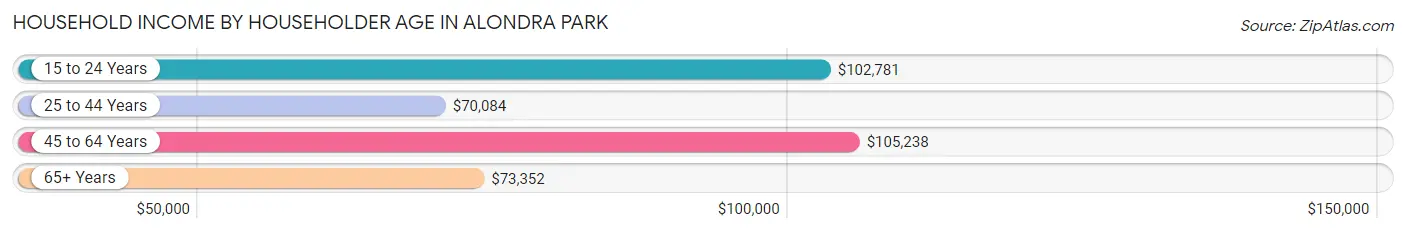
| Income Bracket | # Households | Median Income |
| 15 to 24 Years | 87 (3.2%) | $102,781 |
| 25 to 44 Years | 793 (28.7%) | $70,084 |
| 45 to 64 Years | 1,008 (36.5%) | $105,238 |
| 65+ Years | 876 (31.7%) | $73,352 |
| Total | 2,764 (100.0%) | $79,974 |
Poverty in Alondra Park
Income Below Poverty by Sex and Age in Alondra Park
With 8.6% poverty level for males and 5.9% for females among the residents of Alondra Park, 15 year old males and 65 to 74 year old females are the most vulnerable to poverty, with 44 males (81.5%) and 70 females (15.6%) in their respective age groups living below the poverty level.
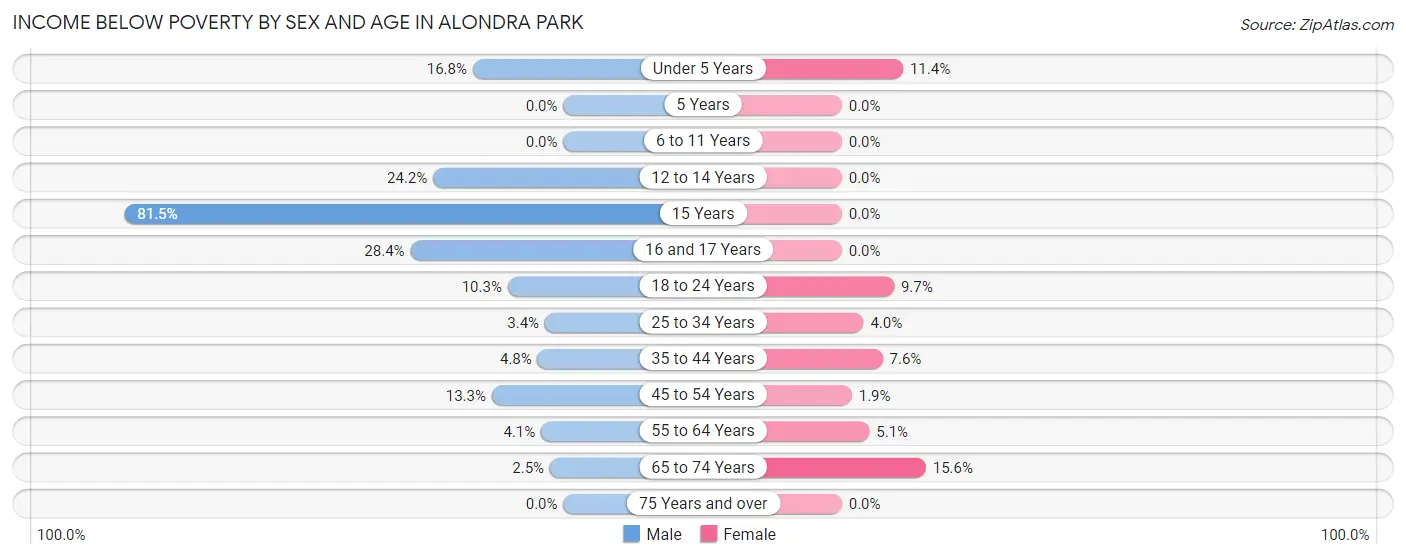
| Age Bracket | Male | Female |
| Under 5 Years | 40 (16.8%) | 40 (11.4%) |
| 5 Years | 0 (0.0%) | 0 (0.0%) |
| 6 to 11 Years | 0 (0.0%) | 0 (0.0%) |
| 12 to 14 Years | 37 (24.2%) | 0 (0.0%) |
| 15 Years | 44 (81.5%) | 0 (0.0%) |
| 16 and 17 Years | 44 (28.4%) | 0 (0.0%) |
| 18 to 24 Years | 35 (10.3%) | 44 (9.7%) |
| 25 to 34 Years | 18 (3.4%) | 23 (4.0%) |
| 35 to 44 Years | 36 (4.8%) | 33 (7.6%) |
| 45 to 54 Years | 59 (13.3%) | 10 (1.8%) |
| 55 to 64 Years | 25 (4.1%) | 31 (5.1%) |
| 65 to 74 Years | 10 (2.5%) | 70 (15.6%) |
| 75 Years and over | 0 (0.0%) | 0 (0.0%) |
| Total | 348 (8.6%) | 251 (5.9%) |
Income Above Poverty by Sex and Age in Alondra Park
According to the poverty statistics in Alondra Park, males aged 5 years and females aged 5 years are the age groups that are most secure financially, with 100.0% of males and 100.0% of females in these age groups living above the poverty line.
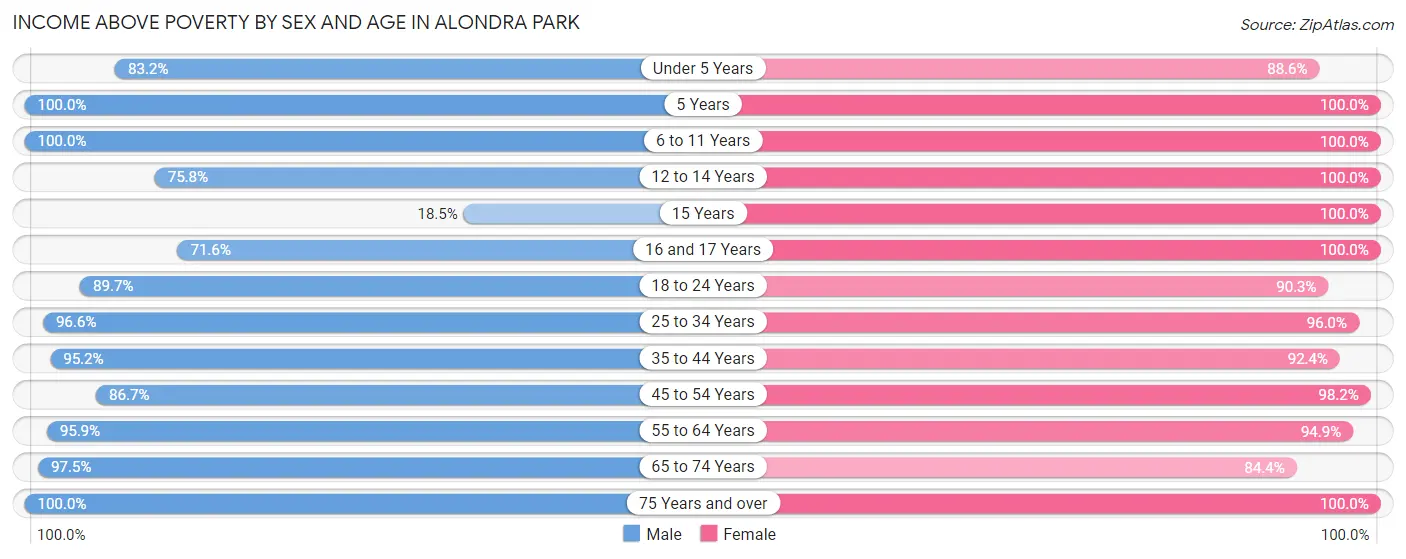
| Age Bracket | Male | Female |
| Under 5 Years | 198 (83.2%) | 312 (88.6%) |
| 5 Years | 13 (100.0%) | 48 (100.0%) |
| 6 to 11 Years | 177 (100.0%) | 277 (100.0%) |
| 12 to 14 Years | 116 (75.8%) | 110 (100.0%) |
| 15 Years | 10 (18.5%) | 18 (100.0%) |
| 16 and 17 Years | 111 (71.6%) | 57 (100.0%) |
| 18 to 24 Years | 304 (89.7%) | 410 (90.3%) |
| 25 to 34 Years | 508 (96.6%) | 548 (96.0%) |
| 35 to 44 Years | 717 (95.2%) | 403 (92.4%) |
| 45 to 54 Years | 385 (86.7%) | 530 (98.2%) |
| 55 to 64 Years | 579 (95.9%) | 575 (94.9%) |
| 65 to 74 Years | 391 (97.5%) | 379 (84.4%) |
| 75 Years and over | 184 (100.0%) | 346 (100.0%) |
| Total | 3,693 (91.4%) | 4,013 (94.1%) |
Income Below Poverty Among Married-Couple Families in Alondra Park
The poverty statistics for married-couple families in Alondra Park show that 3.0% or 42 of the total 1,419 families live below the poverty line. Families with 3 or 4 children have the highest poverty rate of 17.2%, comprising of 33 families. On the other hand, families with 1 or 2 children have the lowest poverty rate of 0.0%, which includes 0 families.
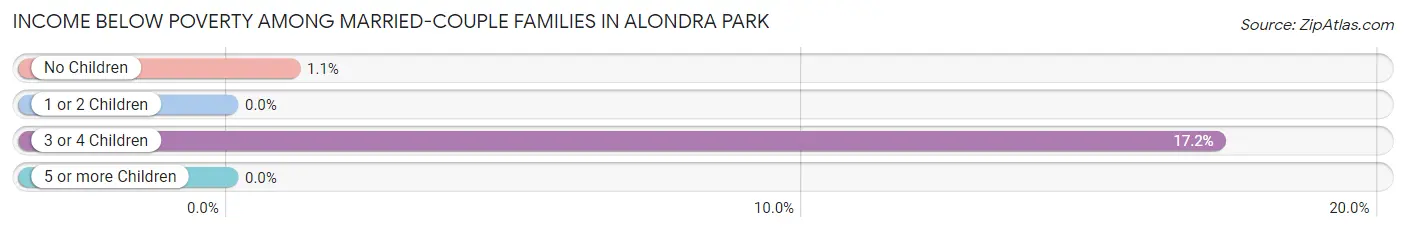
| Children | Above Poverty | Below Poverty |
| No Children | 824 (98.9%) | 9 (1.1%) |
| 1 or 2 Children | 394 (100.0%) | 0 (0.0%) |
| 3 or 4 Children | 159 (82.8%) | 33 (17.2%) |
| 5 or more Children | 0 (0.0%) | 0 (0.0%) |
| Total | 1,377 (97.0%) | 42 (3.0%) |
Income Below Poverty Among Single-Parent Households in Alondra Park
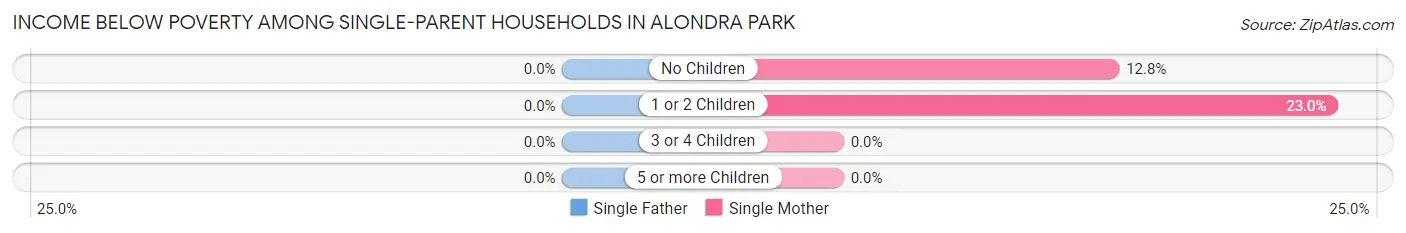
| Children | Single Father | Single Mother |
| No Children | 0 (0.0%) | 29 (12.8%) |
| 1 or 2 Children | 0 (0.0%) | 41 (23.0%) |
| 3 or 4 Children | 0 (0.0%) | 0 (0.0%) |
| 5 or more Children | 0 (0.0%) | 0 (0.0%) |
| Total | 0 (0.0%) | 70 (17.3%) |
Income Below Poverty Among Married-Couple vs Single-Parent Households in Alondra Park
The poverty data for Alondra Park shows that 42 of the married-couple family households (3.0%) and 70 of the single-parent households (11.8%) are living below the poverty level. Within the married-couple family households, those with 3 or 4 children have the highest poverty rate, with 33 households (17.2%) falling below the poverty line. Among the single-parent households, those with 1 or 2 children have the highest poverty rate, with 41 household (18.2%) living below poverty.
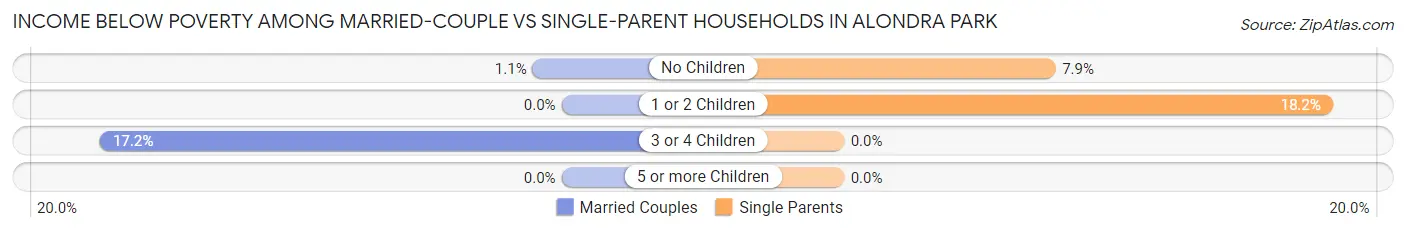
| Children | Married-Couple Families | Single-Parent Households |
| No Children | 9 (1.1%) | 29 (7.9%) |
| 1 or 2 Children | 0 (0.0%) | 41 (18.2%) |
| 3 or 4 Children | 33 (17.2%) | 0 (0.0%) |
| 5 or more Children | 0 (0.0%) | 0 (0.0%) |
| Total | 42 (3.0%) | 70 (11.8%) |
Race in Alondra Park
The most populous races in Alondra Park are Hispanic or Latino (4,495 | 54.1%), White / Caucasian (2,989 | 35.9%), and Some other Race (1,953 | 23.5%).
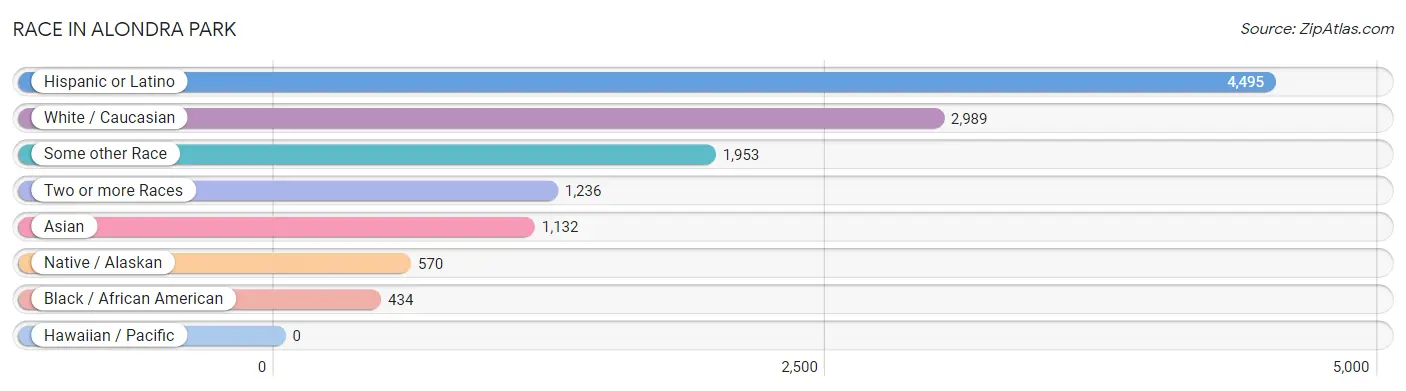
| Race | # Population | % Population |
| Asian | 1,132 | 13.6% |
| Black / African American | 434 | 5.2% |
| Hawaiian / Pacific | 0 | 0.0% |
| Hispanic or Latino | 4,495 | 54.1% |
| Native / Alaskan | 570 | 6.9% |
| White / Caucasian | 2,989 | 35.9% |
| Two or more Races | 1,236 | 14.9% |
| Some other Race | 1,953 | 23.5% |
| Total | 8,314 | 100.0% |
Ancestry in Alondra Park
The most populous ancestries reported in Alondra Park are Mexican (3,229 | 38.8%), American (1,061 | 12.8%), Central American (974 | 11.7%), Guatemalan (549 | 6.6%), and German (528 | 6.4%), together accounting for 76.3% of all Alondra Park residents.
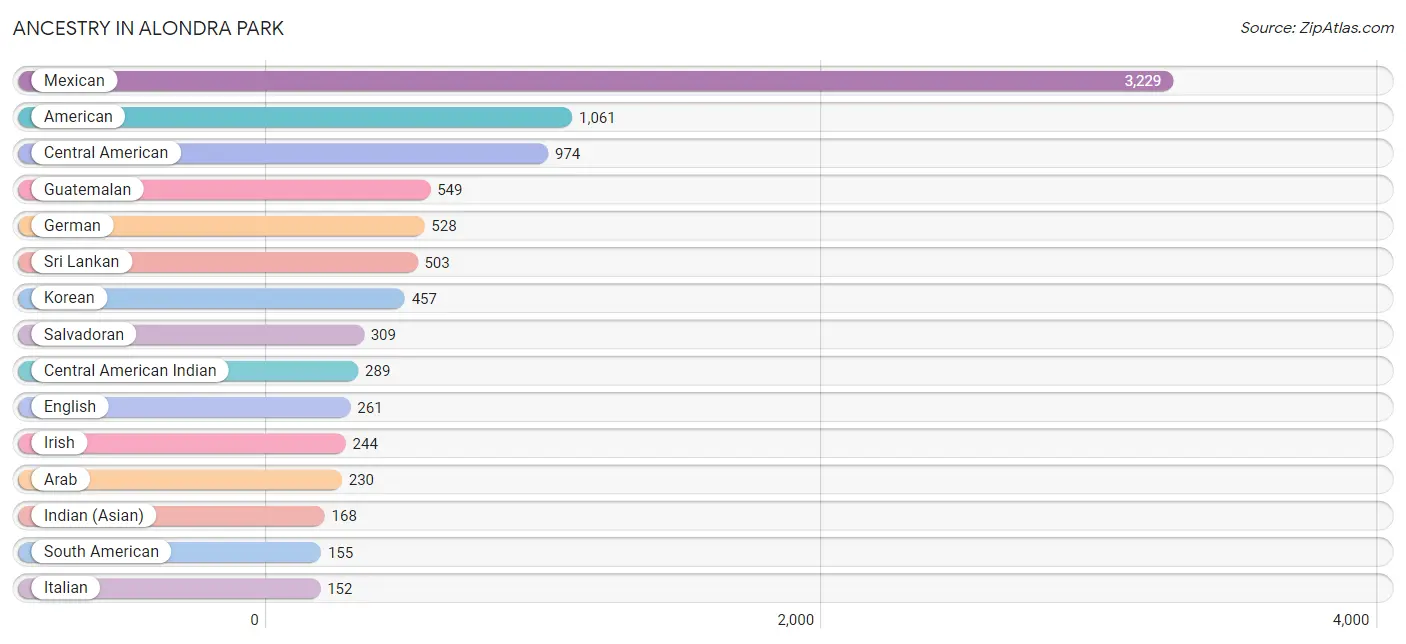
| Ancestry | # Population | % Population |
| African | 58 | 0.7% |
| American | 1,061 | 12.8% |
| Arab | 230 | 2.8% |
| Armenian | 6 | 0.1% |
| Austrian | 10 | 0.1% |
| Belgian | 8 | 0.1% |
| Bhutanese | 83 | 1.0% |
| British | 12 | 0.1% |
| Burmese | 27 | 0.3% |
| Central American | 974 | 11.7% |
| Central American Indian | 289 | 3.5% |
| Costa Rican | 116 | 1.4% |
| Czech | 9 | 0.1% |
| Danish | 23 | 0.3% |
| Dutch | 34 | 0.4% |
| Eastern European | 33 | 0.4% |
| Egyptian | 79 | 0.9% |
| English | 261 | 3.1% |
| European | 62 | 0.7% |
| French | 32 | 0.4% |
| German | 528 | 6.4% |
| Greek | 16 | 0.2% |
| Guatemalan | 549 | 6.6% |
| Hungarian | 1 | 0.0% |
| Indian (Asian) | 168 | 2.0% |
| Irish | 244 | 2.9% |
| Italian | 152 | 1.8% |
| Jordanian | 90 | 1.1% |
| Korean | 457 | 5.5% |
| Lithuanian | 3 | 0.0% |
| Mexican | 3,229 | 38.8% |
| Nigerian | 32 | 0.4% |
| Norwegian | 112 | 1.3% |
| Pakistani | 48 | 0.6% |
| Peruvian | 128 | 1.5% |
| Polish | 42 | 0.5% |
| Portuguese | 35 | 0.4% |
| Pueblo | 8 | 0.1% |
| Puerto Rican | 59 | 0.7% |
| Russian | 12 | 0.1% |
| Salvadoran | 309 | 3.7% |
| Scotch-Irish | 37 | 0.4% |
| Scottish | 45 | 0.5% |
| Serbian | 21 | 0.3% |
| South American | 155 | 1.9% |
| Spanish | 53 | 0.6% |
| Sri Lankan | 503 | 6.0% |
| Subsaharan African | 90 | 1.1% |
| Swedish | 35 | 0.4% |
| Swiss | 6 | 0.1% |
| Ukrainian | 28 | 0.3% |
| Venezuelan | 27 | 0.3% |
| Yugoslavian | 9 | 0.1% | View All 53 Rows |
Immigrants in Alondra Park
The most numerous immigrant groups reported in Alondra Park came from Latin America (2,096 | 25.2%), Central America (1,983 | 23.8%), Mexico (1,447 | 17.4%), Asia (878 | 10.6%), and South Eastern Asia (718 | 8.6%), together accounting for 85.7% of all Alondra Park residents.
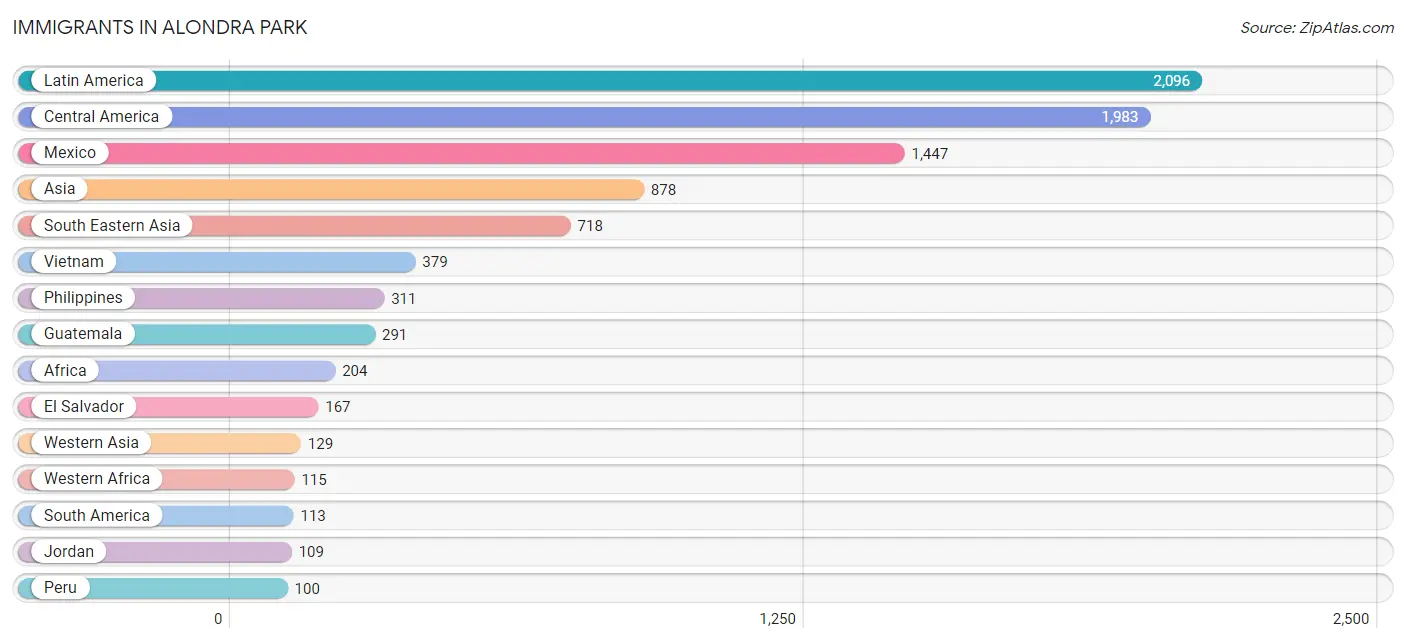
| Immigration Origin | # Population | % Population |
| Africa | 204 | 2.5% |
| Asia | 878 | 10.6% |
| Australia | 39 | 0.5% |
| Azores | 15 | 0.2% |
| Central America | 1,983 | 23.8% |
| China | 11 | 0.1% |
| Costa Rica | 26 | 0.3% |
| Eastern Asia | 31 | 0.4% |
| Egypt | 79 | 0.9% |
| El Salvador | 167 | 2.0% |
| England | 12 | 0.1% |
| Europe | 94 | 1.1% |
| Germany | 8 | 0.1% |
| Guatemala | 291 | 3.5% |
| Italy | 17 | 0.2% |
| Japan | 2 | 0.0% |
| Jordan | 109 | 1.3% |
| Korea | 18 | 0.2% |
| Latin America | 2,096 | 25.2% |
| Lebanon | 6 | 0.1% |
| Mexico | 1,447 | 17.4% |
| Nicaragua | 52 | 0.6% |
| Nigeria | 32 | 0.4% |
| Northern Africa | 79 | 0.9% |
| Northern Europe | 12 | 0.1% |
| Oceania | 39 | 0.5% |
| Peru | 100 | 1.2% |
| Philippines | 311 | 3.7% |
| Portugal | 15 | 0.2% |
| Sierra Leone | 83 | 1.0% |
| South America | 113 | 1.4% |
| South Eastern Asia | 718 | 8.6% |
| Southern Europe | 32 | 0.4% |
| Syria | 14 | 0.2% |
| Thailand | 28 | 0.3% |
| Venezuela | 13 | 0.2% |
| Vietnam | 379 | 4.6% |
| Western Africa | 115 | 1.4% |
| Western Asia | 129 | 1.5% |
| Western Europe | 8 | 0.1% | View All 40 Rows |
Sex and Age in Alondra Park
Sex and Age in Alondra Park
The most populous age groups in Alondra Park are 35 to 39 Years (450 | 11.1%) for men and Under 5 Years (352 | 8.3%) for women.
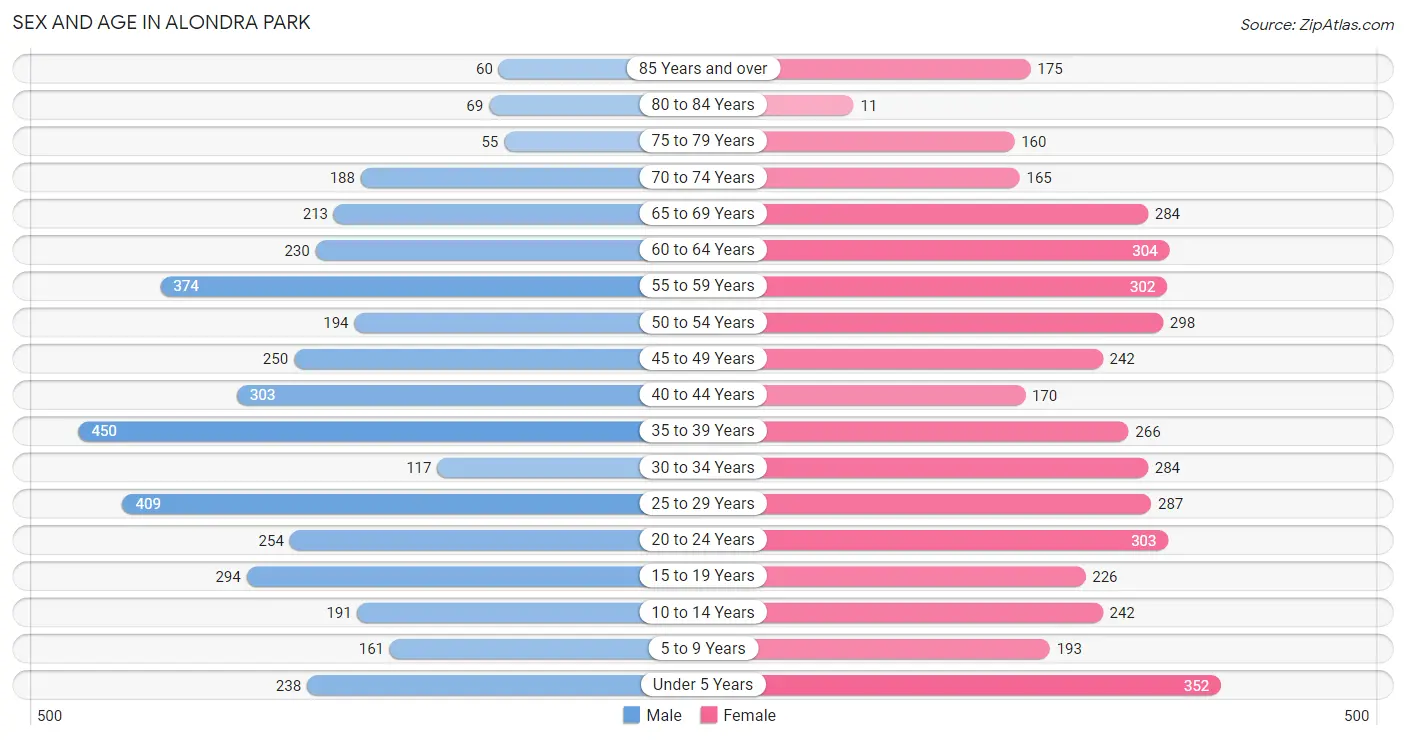
| Age Bracket | Male | Female |
| Under 5 Years | 238 (5.9%) | 352 (8.3%) |
| 5 to 9 Years | 161 (4.0%) | 193 (4.5%) |
| 10 to 14 Years | 191 (4.7%) | 242 (5.7%) |
| 15 to 19 Years | 294 (7.3%) | 226 (5.3%) |
| 20 to 24 Years | 254 (6.3%) | 303 (7.1%) |
| 25 to 29 Years | 409 (10.1%) | 287 (6.7%) |
| 30 to 34 Years | 117 (2.9%) | 284 (6.7%) |
| 35 to 39 Years | 450 (11.1%) | 266 (6.2%) |
| 40 to 44 Years | 303 (7.5%) | 170 (4.0%) |
| 45 to 49 Years | 250 (6.2%) | 242 (5.7%) |
| 50 to 54 Years | 194 (4.8%) | 298 (7.0%) |
| 55 to 59 Years | 374 (9.2%) | 302 (7.1%) |
| 60 to 64 Years | 230 (5.7%) | 304 (7.1%) |
| 65 to 69 Years | 213 (5.3%) | 284 (6.7%) |
| 70 to 74 Years | 188 (4.6%) | 165 (3.9%) |
| 75 to 79 Years | 55 (1.4%) | 160 (3.7%) |
| 80 to 84 Years | 69 (1.7%) | 11 (0.3%) |
| 85 Years and over | 60 (1.5%) | 175 (4.1%) |
| Total | 4,050 (100.0%) | 4,264 (100.0%) |
Families and Households in Alondra Park
Median Family Size in Alondra Park
The median family size in Alondra Park is 3.52 persons per family, with married-couple families (1,419 | 70.5%) accounting for the largest median family size of 3.67 persons per family. On the other hand, single female/mother families (404 | 20.1%) represent the smallest median family size with 3.14 persons per family.
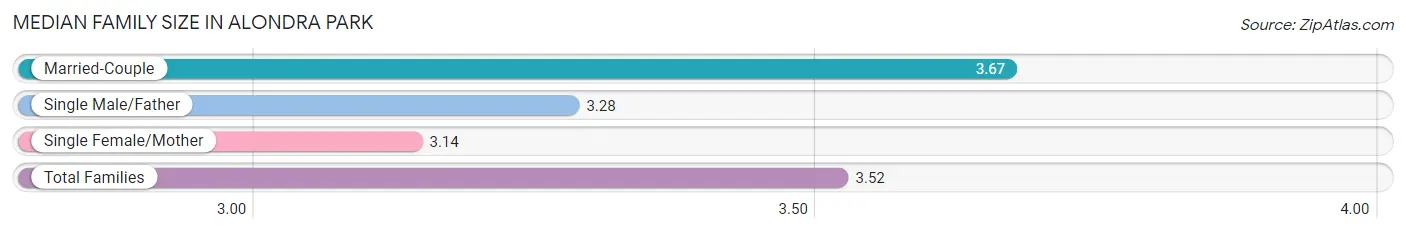
| Family Type | # Families | Family Size |
| Married-Couple | 1,419 (70.5%) | 3.67 |
| Single Male/Father | 189 (9.4%) | 3.28 |
| Single Female/Mother | 404 (20.1%) | 3.14 |
| Total Families | 2,012 (100.0%) | 3.52 |
Median Household Size in Alondra Park
The median household size in Alondra Park is 2.99 persons per household, with married-couple households (1,419 | 51.3%) accounting for the largest median household size of 3.73 persons per household. non-family households (752 | 27.2%) represent the smallest median household size with 1.23 persons per household.
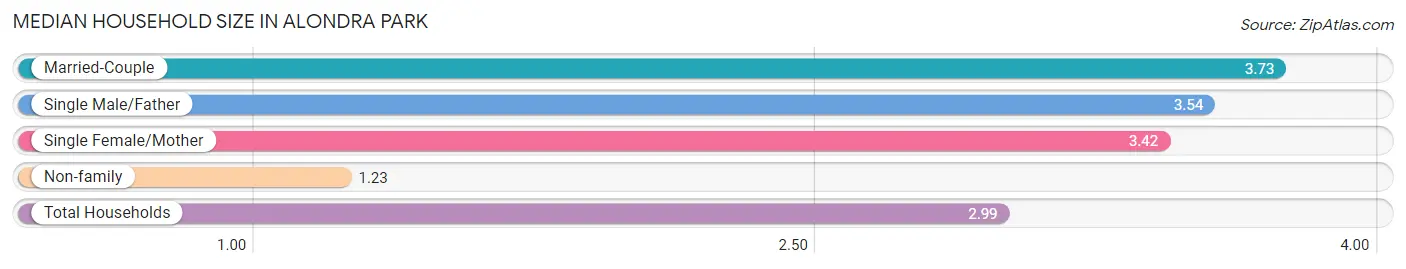
| Household Type | # Households | Household Size |
| Married-Couple | 1,419 (51.3%) | 3.73 |
| Single Male/Father | 189 (6.8%) | 3.54 |
| Single Female/Mother | 404 (14.6%) | 3.42 |
| Non-family | 752 (27.2%) | 1.23 |
| Total Households | 2,764 (100.0%) | 2.99 |
Household Size by Marriage Status in Alondra Park
Out of a total of 2,764 households in Alondra Park, 2,012 (72.8%) are family households, while 752 (27.2%) are nonfamily households. The most numerous type of family households are 2-person households, comprising 717, and the most common type of nonfamily households are 1-person households, comprising 593.
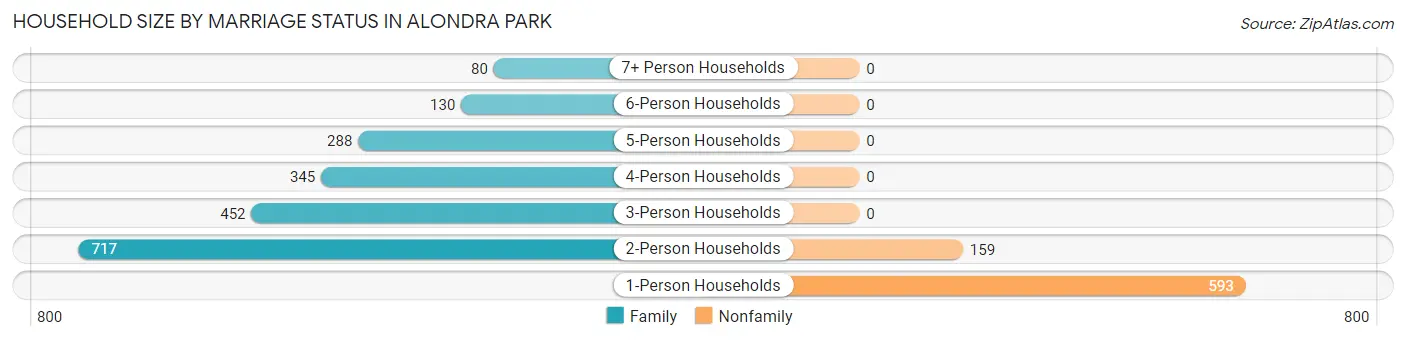
| Household Size | Family Households | Nonfamily Households |
| 1-Person Households | - | 593 (21.4%) |
| 2-Person Households | 717 (25.9%) | 159 (5.8%) |
| 3-Person Households | 452 (16.4%) | 0 (0.0%) |
| 4-Person Households | 345 (12.5%) | 0 (0.0%) |
| 5-Person Households | 288 (10.4%) | 0 (0.0%) |
| 6-Person Households | 130 (4.7%) | 0 (0.0%) |
| 7+ Person Households | 80 (2.9%) | 0 (0.0%) |
| Total | 2,012 (72.8%) | 752 (27.2%) |
Female Fertility in Alondra Park
Fertility by Age in Alondra Park
Average fertility rate in Alondra Park is 93.0 births per 1,000 women. Women in the age bracket of 35 to 50 years have the highest fertility rate with 176.0 births per 1,000 women. Women in the age bracket of 35 to 50 years acount for 76.0% of all women with births.
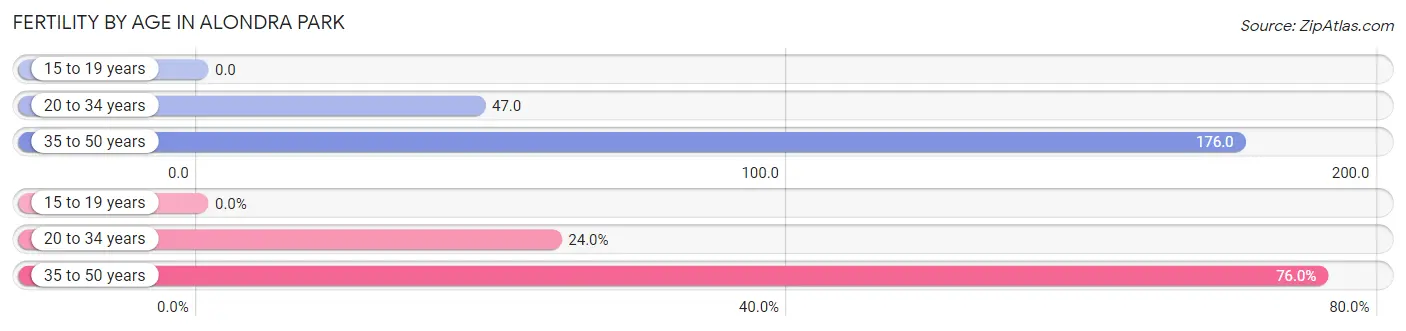
| Age Bracket | Women with Births | Births / 1,000 Women |
| 15 to 19 years | 0 (0.0%) | 0.0 |
| 20 to 34 years | 41 (24.0%) | 47.0 |
| 35 to 50 years | 130 (76.0%) | 176.0 |
| Total | 171 (100.0%) | 93.0 |
Fertility by Age by Marriage Status in Alondra Park
83.6% of women with births (171) in Alondra Park are married. The highest percentage of unmarried women with births falls into 20 to 34 years age bracket with 68.3% of them unmarried at the time of birth, while the lowest percentage of unmarried women with births belong to 35 to 50 years age bracket with 0.0% of them unmarried.
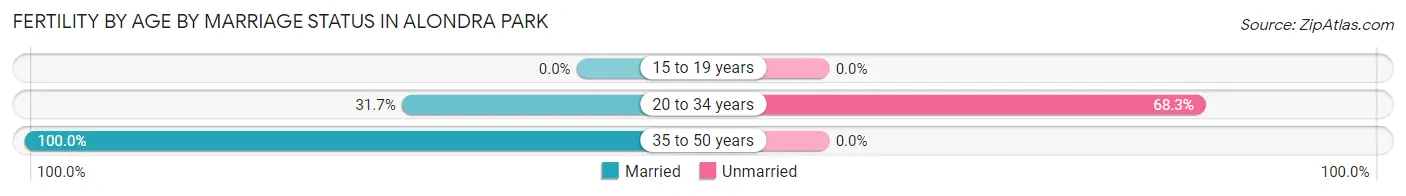
| Age Bracket | Married | Unmarried |
| 15 to 19 years | 0 (0.0%) | 0 (0.0%) |
| 20 to 34 years | 13 (31.7%) | 28 (68.3%) |
| 35 to 50 years | 130 (100.0%) | 0 (0.0%) |
| Total | 143 (83.6%) | 28 (16.4%) |
Fertility by Education in Alondra Park
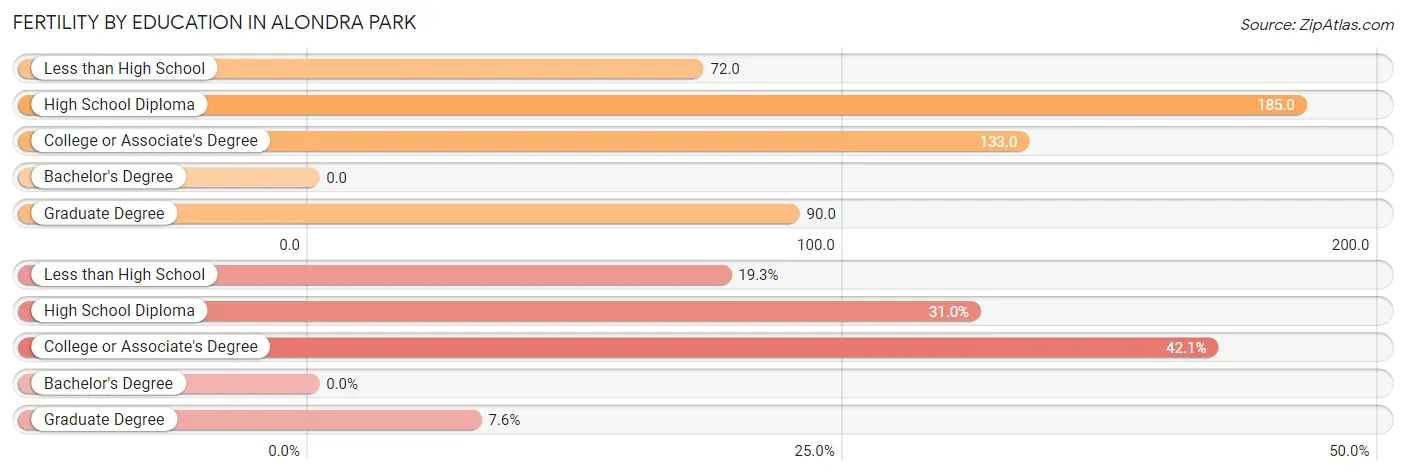
| Educational Attainment | Women with Births | Births / 1,000 Women |
| Less than High School | 33 (19.3%) | 72.0 |
| High School Diploma | 53 (31.0%) | 185.0 |
| College or Associate's Degree | 72 (42.1%) | 133.0 |
| Bachelor's Degree | 0 (0.0%) | 0.0 |
| Graduate Degree | 13 (7.6%) | 90.0 |
| Total | 171 (100.0%) | 93.0 |
Fertility by Education by Marriage Status in Alondra Park
16.4% of women with births in Alondra Park are unmarried. Women with the educational attainment of less than high school are most likely to be married with 100.0% of them married at childbirth, while women with the educational attainment of college or associate's degree are least likely to be married with 38.9% of them unmarried at childbirth.
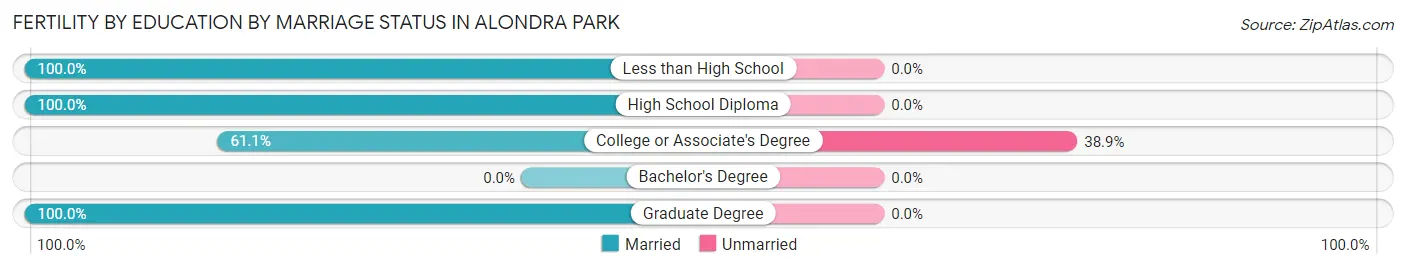
| Educational Attainment | Married | Unmarried |
| Less than High School | 33 (100.0%) | 0 (0.0%) |
| High School Diploma | 53 (100.0%) | 0 (0.0%) |
| College or Associate's Degree | 44 (61.1%) | 28 (38.9%) |
| Bachelor's Degree | 0 (0.0%) | 0 (0.0%) |
| Graduate Degree | 13 (100.0%) | 0 (0.0%) |
| Total | 143 (83.6%) | 28 (16.4%) |
Employment Characteristics in Alondra Park
Employment by Class of Employer in Alondra Park
Among the 4,084 employed individuals in Alondra Park, private company employees (3,056 | 74.8%), local government employees (302 | 7.4%), and self-employed (not incorporated) (277 | 6.8%) make up the most common classes of employment.
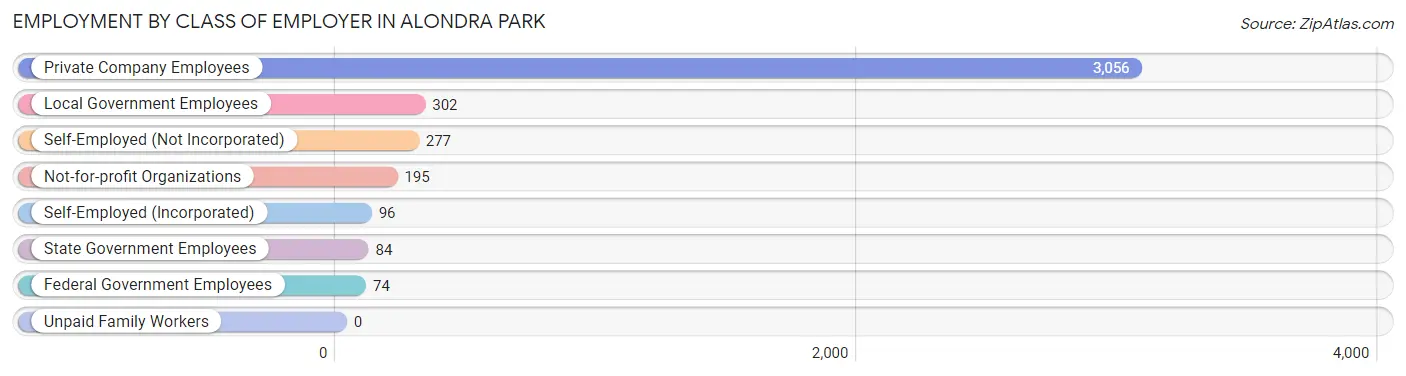
| Employer Class | # Employees | % Employees |
| Private Company Employees | 3,056 | 74.8% |
| Self-Employed (Incorporated) | 96 | 2.4% |
| Self-Employed (Not Incorporated) | 277 | 6.8% |
| Not-for-profit Organizations | 195 | 4.8% |
| Local Government Employees | 302 | 7.4% |
| State Government Employees | 84 | 2.1% |
| Federal Government Employees | 74 | 1.8% |
| Unpaid Family Workers | 0 | 0.0% |
| Total | 4,084 | 100.0% |
Employment Status by Age in Alondra Park
According to the labor force statistics for Alondra Park, out of the total population over 16 years of age (6,865), 62.9% or 4,318 individuals are in the labor force, with 4.0% or 173 of them unemployed. The age group with the highest labor force participation rate is 25 to 29 years, with 98.1% or 683 individuals in the labor force. Within the labor force, the 16 to 19 years age range has the highest percentage of unemployed individuals, with 21.6% or 24 of them being unemployed.
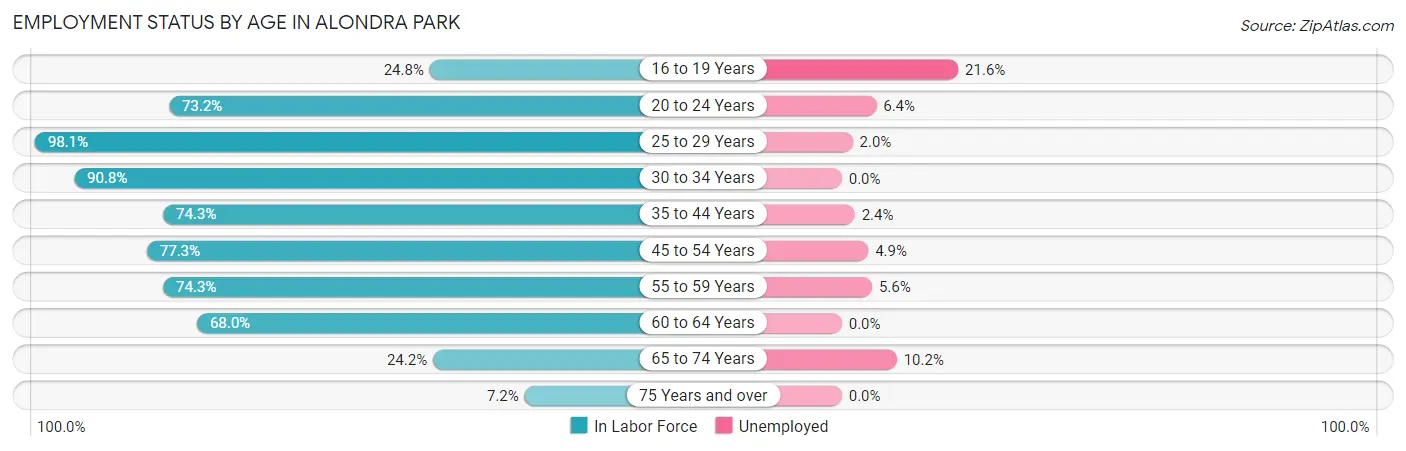
| Age Bracket | In Labor Force | Unemployed |
| 16 to 19 Years | 111 (24.8%) | 24 (21.6%) |
| 20 to 24 Years | 408 (73.2%) | 26 (6.4%) |
| 25 to 29 Years | 683 (98.1%) | 14 (2.0%) |
| 30 to 34 Years | 364 (90.8%) | 0 (0.0%) |
| 35 to 44 Years | 883 (74.3%) | 21 (2.4%) |
| 45 to 54 Years | 761 (77.3%) | 37 (4.9%) |
| 55 to 59 Years | 502 (74.3%) | 28 (5.6%) |
| 60 to 64 Years | 363 (68.0%) | 0 (0.0%) |
| 65 to 74 Years | 206 (24.2%) | 21 (10.2%) |
| 75 Years and over | 38 (7.2%) | 0 (0.0%) |
| Total | 4,318 (62.9%) | 173 (4.0%) |
Employment Status by Educational Attainment in Alondra Park
According to labor force statistics for Alondra Park, 79.4% of individuals (3,557) out of the total population between 25 and 64 years of age (4,480) are in the labor force, with 2.8% or 100 of them being unemployed. The group with the highest labor force participation rate are those with the educational attainment of bachelor's degree or higher, with 86.8% or 1,062 individuals in the labor force. Within the labor force, individuals with bachelor's degree or higher education have the highest percentage of unemployment, with 4.0% or 42 of them being unemployed.
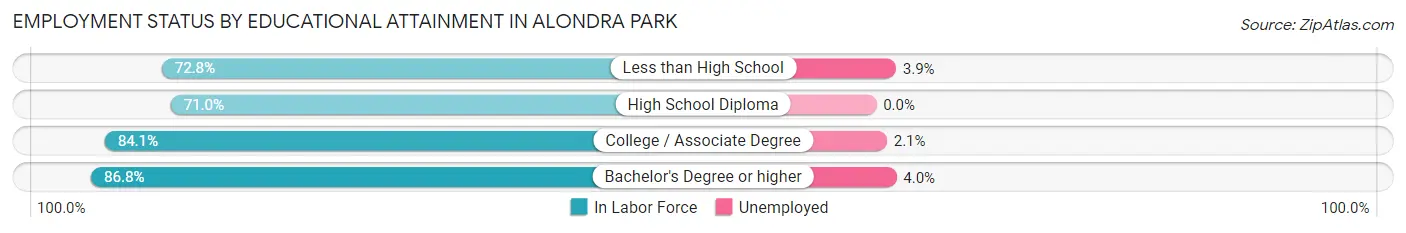
| Educational Attainment | In Labor Force | Unemployed |
| Less than High School | 955 (72.8%) | 51 (3.9%) |
| High School Diploma | 525 (71.0%) | 0 (0.0%) |
| College / Associate Degree | 1,013 (84.1%) | 25 (2.1%) |
| Bachelor's Degree or higher | 1,062 (86.8%) | 49 (4.0%) |
| Total | 3,557 (79.4%) | 125 (2.8%) |
Employment Occupations by Sex in Alondra Park
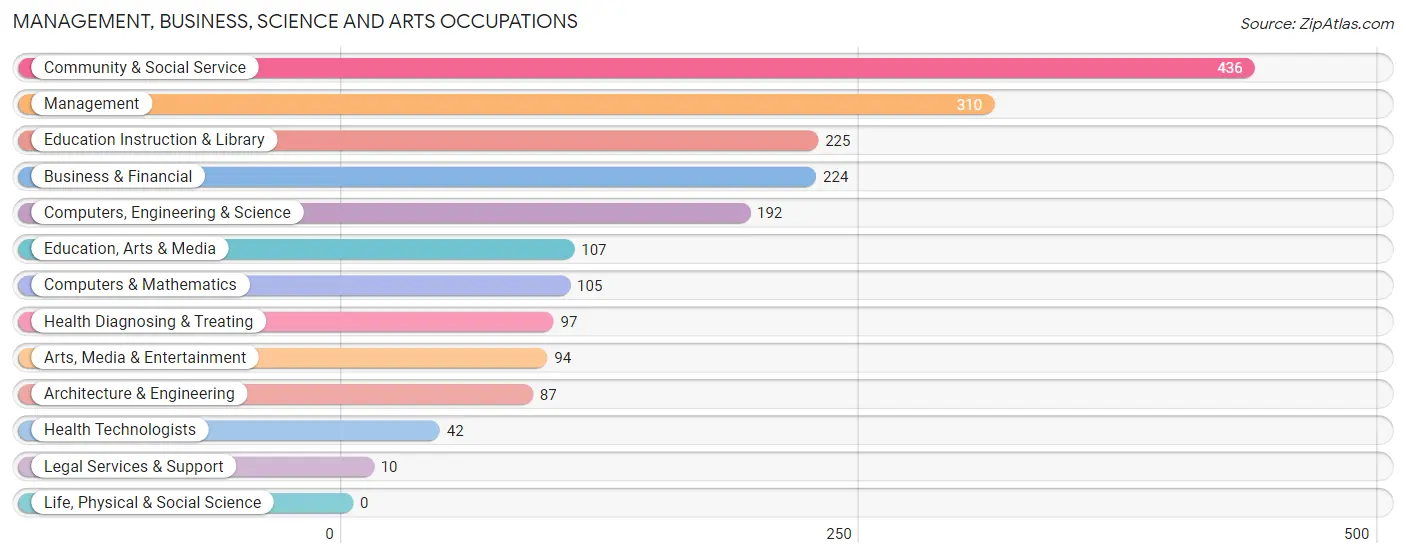
Management, Business, Science and Arts Occupations
The most common Management, Business, Science and Arts occupations in Alondra Park are Community & Social Service (436 | 10.5%), Management (310 | 7.5%), Education Instruction & Library (225 | 5.4%), Business & Financial (224 | 5.4%), and Computers, Engineering & Science (192 | 4.6%).
Management, Business, Science and Arts Occupations by Sex
Within the Management, Business, Science and Arts occupations in Alondra Park, the most male-oriented occupations are Legal Services & Support (100.0%), Arts, Media & Entertainment (90.4%), and Architecture & Engineering (89.7%), while the most female-oriented occupations are Education, Arts & Media (100.0%), Health Technologists (100.0%), and Health Diagnosing & Treating (90.7%).
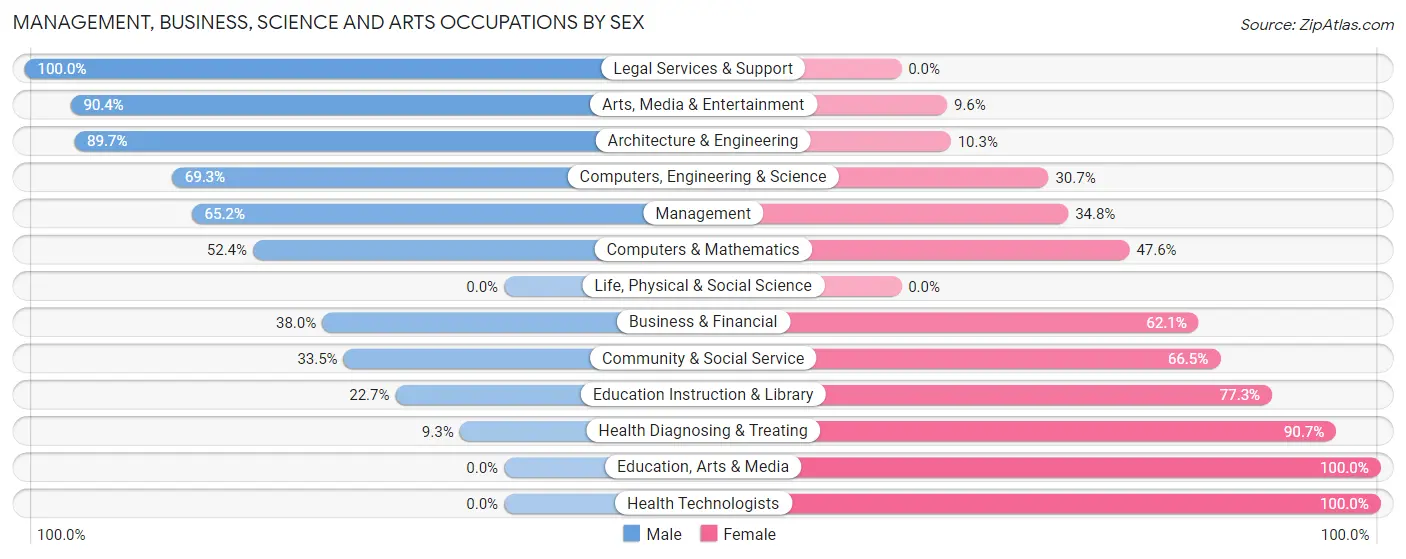
| Occupation | Male | Female |
| Management | 202 (65.2%) | 108 (34.8%) |
| Business & Financial | 85 (38.0%) | 139 (62.1%) |
| Computers, Engineering & Science | 133 (69.3%) | 59 (30.7%) |
| Computers & Mathematics | 55 (52.4%) | 50 (47.6%) |
| Architecture & Engineering | 78 (89.7%) | 9 (10.3%) |
| Life, Physical & Social Science | 0 (0.0%) | 0 (0.0%) |
| Community & Social Service | 146 (33.5%) | 290 (66.5%) |
| Education, Arts & Media | 0 (0.0%) | 107 (100.0%) |
| Legal Services & Support | 10 (100.0%) | 0 (0.0%) |
| Education Instruction & Library | 51 (22.7%) | 174 (77.3%) |
| Arts, Media & Entertainment | 85 (90.4%) | 9 (9.6%) |
| Health Diagnosing & Treating | 9 (9.3%) | 88 (90.7%) |
| Health Technologists | 0 (0.0%) | 42 (100.0%) |
| Total (Category) | 575 (45.7%) | 684 (54.3%) |
| Total (Overall) | 2,407 (58.0%) | 1,742 (42.0%) |
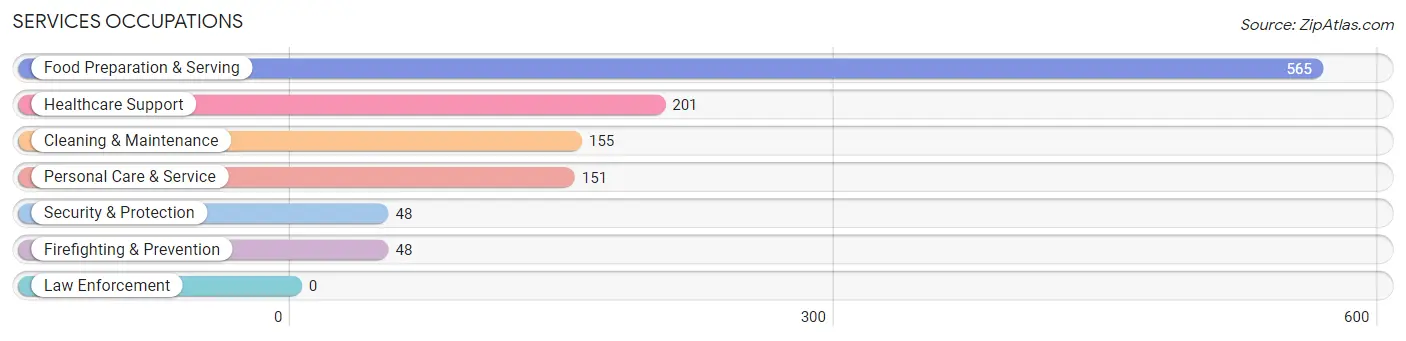
Services Occupations
The most common Services occupations in Alondra Park are Food Preparation & Serving (565 | 13.6%), Healthcare Support (201 | 4.8%), Cleaning & Maintenance (155 | 3.7%), Personal Care & Service (151 | 3.6%), and Security & Protection (48 | 1.2%).
Services Occupations by Sex
Within the Services occupations in Alondra Park, the most male-oriented occupations are Security & Protection (100.0%), Firefighting & Prevention (100.0%), and Food Preparation & Serving (80.5%), while the most female-oriented occupations are Personal Care & Service (94.0%), Healthcare Support (89.0%), and Cleaning & Maintenance (64.5%).
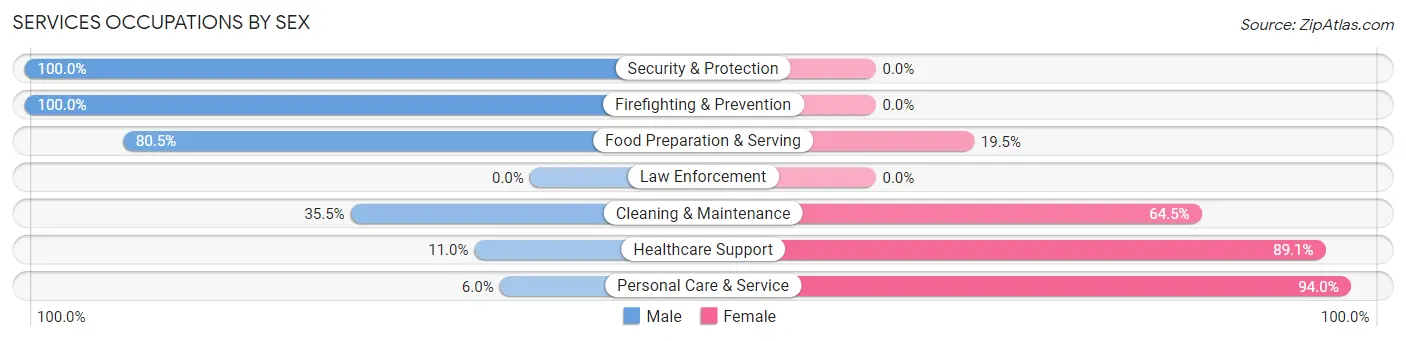
| Occupation | Male | Female |
| Healthcare Support | 22 (11.0%) | 179 (89.0%) |
| Security & Protection | 48 (100.0%) | 0 (0.0%) |
| Firefighting & Prevention | 48 (100.0%) | 0 (0.0%) |
| Law Enforcement | 0 (0.0%) | 0 (0.0%) |
| Food Preparation & Serving | 455 (80.5%) | 110 (19.5%) |
| Cleaning & Maintenance | 55 (35.5%) | 100 (64.5%) |
| Personal Care & Service | 9 (6.0%) | 142 (94.0%) |
| Total (Category) | 589 (52.6%) | 531 (47.4%) |
| Total (Overall) | 2,407 (58.0%) | 1,742 (42.0%) |
Sales and Office Occupations
The most common Sales and Office occupations in Alondra Park are Office & Administration (521 | 12.6%), and Sales & Related (491 | 11.8%).
Sales and Office Occupations by Sex
| Occupation | Male | Female |
| Sales & Related | 269 (54.8%) | 222 (45.2%) |
| Office & Administration | 241 (46.3%) | 280 (53.7%) |
| Total (Category) | 510 (50.4%) | 502 (49.6%) |
| Total (Overall) | 2,407 (58.0%) | 1,742 (42.0%) |
Natural Resources, Construction and Maintenance Occupations
The most common Natural Resources, Construction and Maintenance occupations in Alondra Park are Construction & Extraction (216 | 5.2%), Farming, Fishing & Forestry (50 | 1.2%), and Installation, Maintenance & Repair (43 | 1.0%).
Natural Resources, Construction and Maintenance Occupations by Sex
| Occupation | Male | Female |
| Farming, Fishing & Forestry | 50 (100.0%) | 0 (0.0%) |
| Construction & Extraction | 216 (100.0%) | 0 (0.0%) |
| Installation, Maintenance & Repair | 43 (100.0%) | 0 (0.0%) |
| Total (Category) | 309 (100.0%) | 0 (0.0%) |
| Total (Overall) | 2,407 (58.0%) | 1,742 (42.0%) |
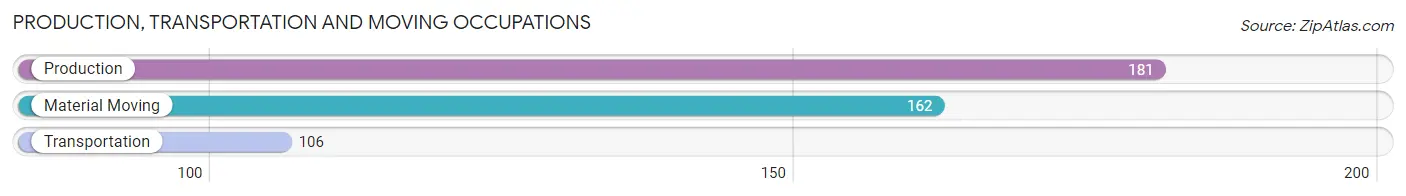
Production, Transportation and Moving Occupations
The most common Production, Transportation and Moving occupations in Alondra Park are Production (181 | 4.4%), Material Moving (162 | 3.9%), and Transportation (106 | 2.5%).
Production, Transportation and Moving Occupations by Sex
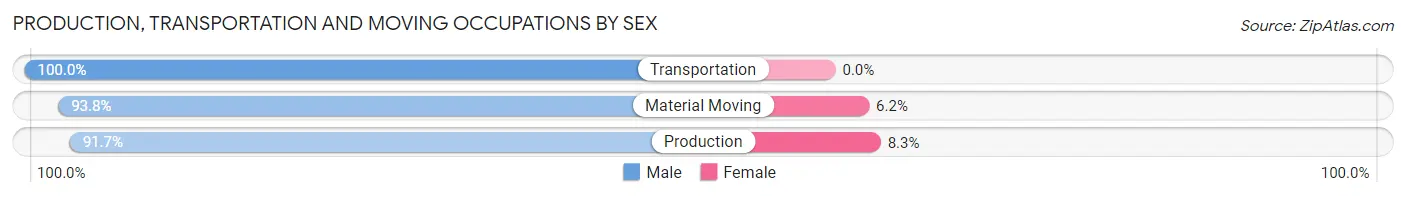
| Occupation | Male | Female |
| Production | 166 (91.7%) | 15 (8.3%) |
| Transportation | 106 (100.0%) | 0 (0.0%) |
| Material Moving | 152 (93.8%) | 10 (6.2%) |
| Total (Category) | 424 (94.4%) | 25 (5.6%) |
| Total (Overall) | 2,407 (58.0%) | 1,742 (42.0%) |
Employment Industries by Sex in Alondra Park
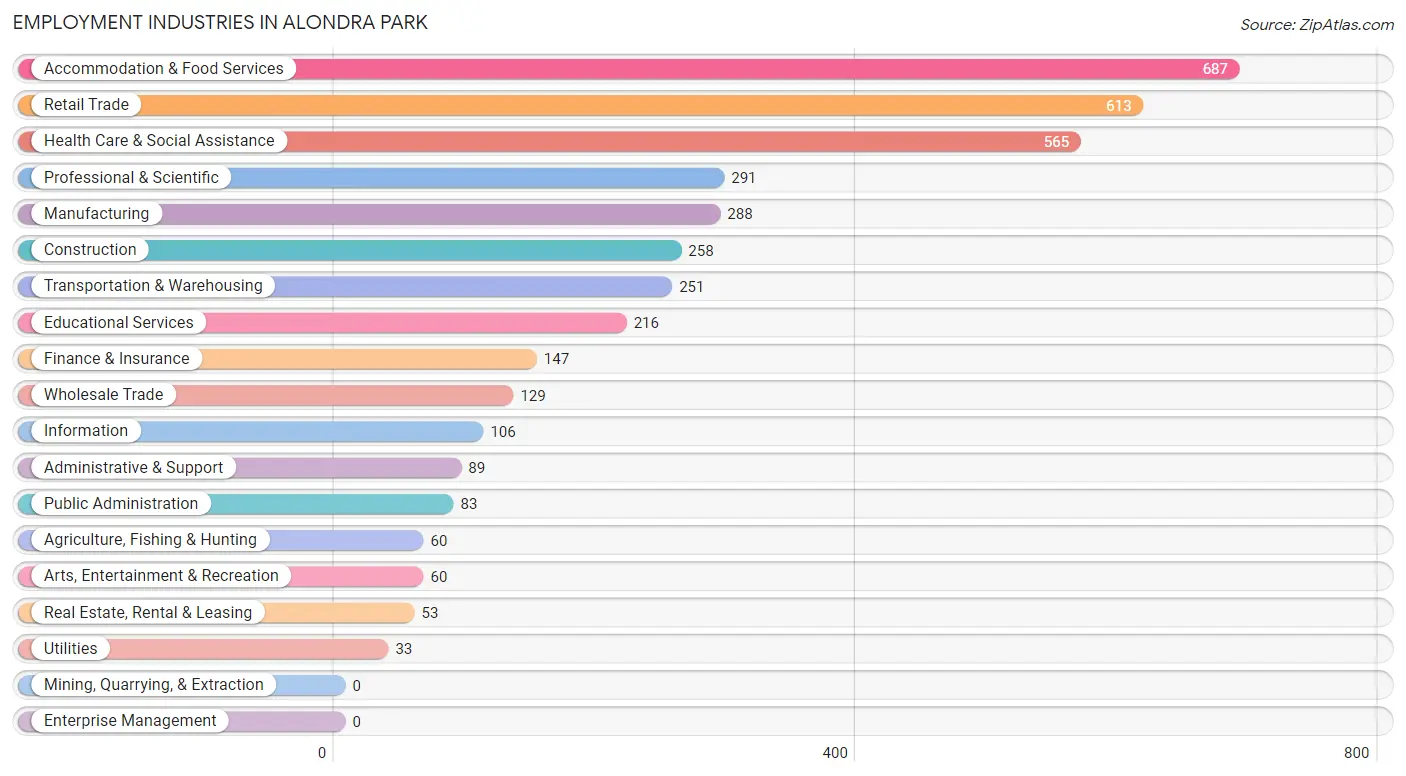
Employment Industries in Alondra Park
The major employment industries in Alondra Park include Accommodation & Food Services (687 | 16.6%), Retail Trade (613 | 14.8%), Health Care & Social Assistance (565 | 13.6%), Professional & Scientific (291 | 7.0%), and Manufacturing (288 | 6.9%).
Employment Industries by Sex in Alondra Park
The Alondra Park industries that see more men than women are Agriculture, Fishing & Hunting (100.0%), Construction (86.4%), and Manufacturing (84.0%), whereas the industries that tend to have a higher number of women are Health Care & Social Assistance (90.6%), Utilities (72.7%), and Finance & Insurance (64.6%).
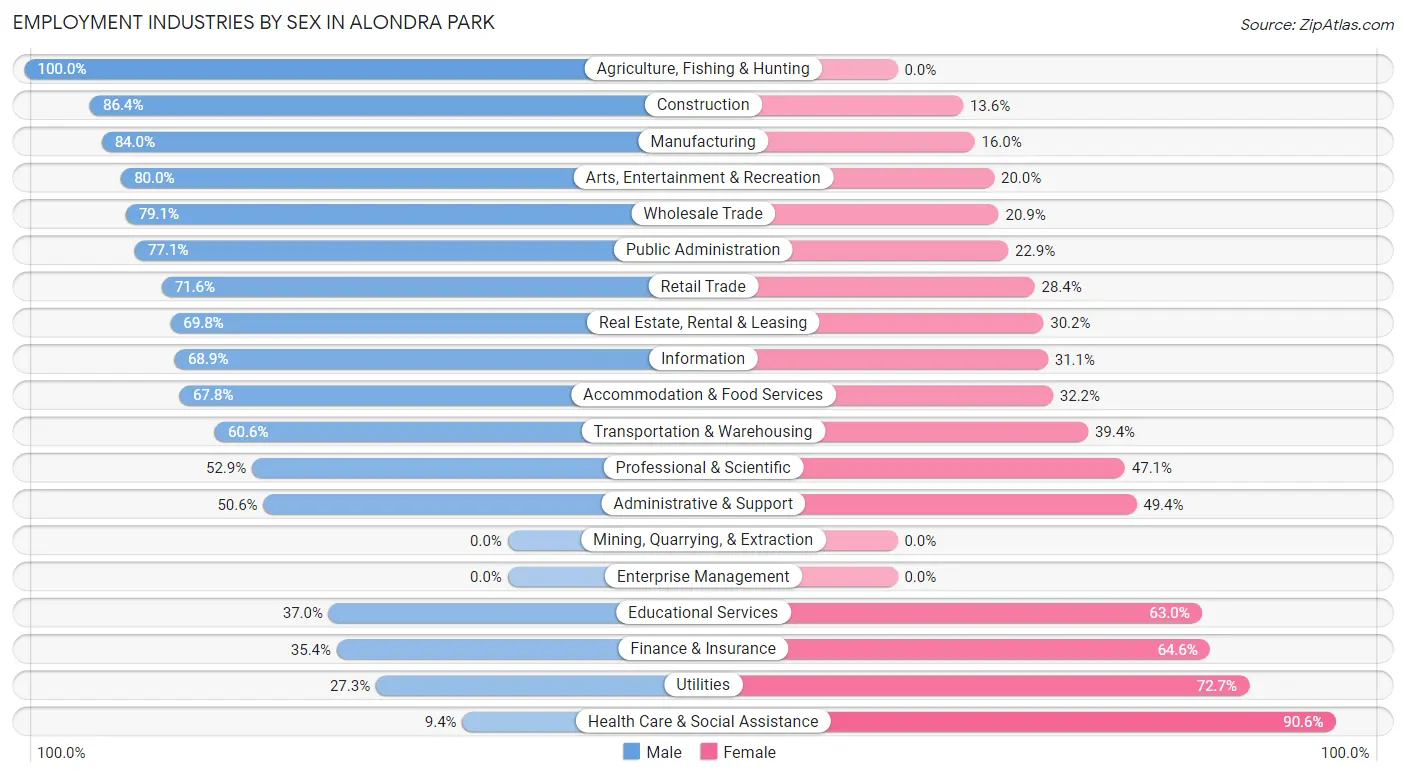
| Industry | Male | Female |
| Agriculture, Fishing & Hunting | 60 (100.0%) | 0 (0.0%) |
| Mining, Quarrying, & Extraction | 0 (0.0%) | 0 (0.0%) |
| Construction | 223 (86.4%) | 35 (13.6%) |
| Manufacturing | 242 (84.0%) | 46 (16.0%) |
| Wholesale Trade | 102 (79.1%) | 27 (20.9%) |
| Retail Trade | 439 (71.6%) | 174 (28.4%) |
| Transportation & Warehousing | 152 (60.6%) | 99 (39.4%) |
| Utilities | 9 (27.3%) | 24 (72.7%) |
| Information | 73 (68.9%) | 33 (31.1%) |
| Finance & Insurance | 52 (35.4%) | 95 (64.6%) |
| Real Estate, Rental & Leasing | 37 (69.8%) | 16 (30.2%) |
| Professional & Scientific | 154 (52.9%) | 137 (47.1%) |
| Enterprise Management | 0 (0.0%) | 0 (0.0%) |
| Administrative & Support | 45 (50.6%) | 44 (49.4%) |
| Educational Services | 80 (37.0%) | 136 (63.0%) |
| Health Care & Social Assistance | 53 (9.4%) | 512 (90.6%) |
| Arts, Entertainment & Recreation | 48 (80.0%) | 12 (20.0%) |
| Accommodation & Food Services | 466 (67.8%) | 221 (32.2%) |
| Public Administration | 64 (77.1%) | 19 (22.9%) |
| Total | 2,407 (58.0%) | 1,742 (42.0%) |
Education in Alondra Park
School Enrollment in Alondra Park
The most common levels of schooling among the 1,811 students in Alondra Park are college / undergraduate (496 | 27.4%), high school (410 | 22.6%), and middle school (387 | 21.4%).
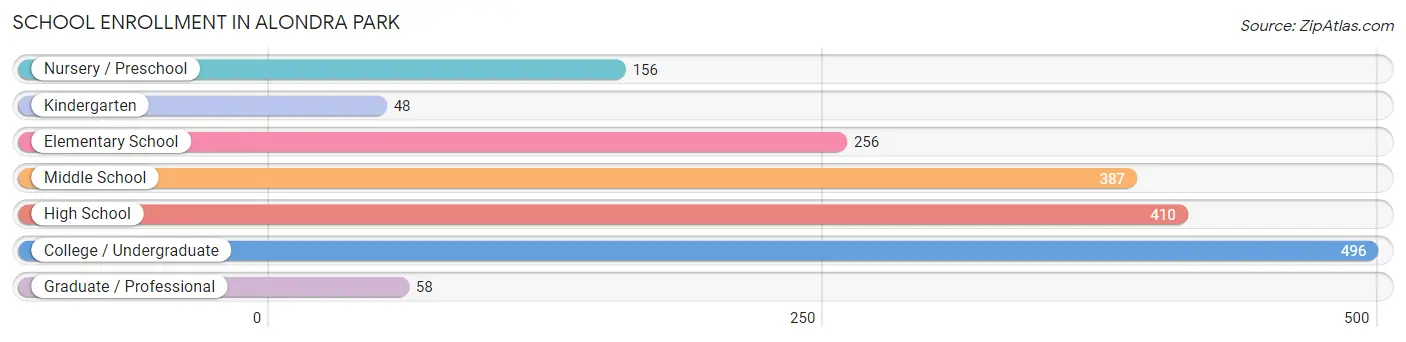
| School Level | # Students | % Students |
| Nursery / Preschool | 156 | 8.6% |
| Kindergarten | 48 | 2.6% |
| Elementary School | 256 | 14.1% |
| Middle School | 387 | 21.4% |
| High School | 410 | 22.6% |
| College / Undergraduate | 496 | 27.4% |
| Graduate / Professional | 58 | 3.2% |
| Total | 1,811 | 100.0% |
School Enrollment by Age by Funding Source in Alondra Park
Out of a total of 1,811 students who are enrolled in schools in Alondra Park, 107 (5.9%) attend a private institution, while the remaining 1,704 (94.1%) are enrolled in public schools. The age group of 35 years and over has the highest likelihood of being enrolled in private schools, with 12 (13.8% in the age bracket) enrolled. Conversely, the age group of 15 to 17 year olds has the lowest likelihood of being enrolled in a private school, with 284 (100.0% in the age bracket) attending a public institution.
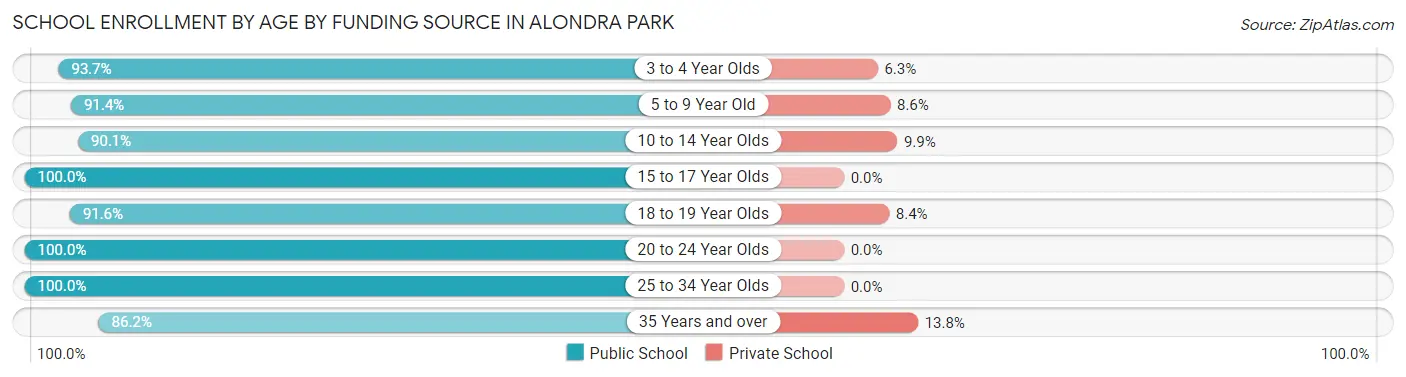
| Age Bracket | Public School | Private School |
| 3 to 4 Year Olds | 134 (93.7%) | 9 (6.3%) |
| 5 to 9 Year Old | 275 (91.4%) | 26 (8.6%) |
| 10 to 14 Year Olds | 390 (90.1%) | 43 (9.9%) |
| 15 to 17 Year Olds | 284 (100.0%) | 0 (0.0%) |
| 18 to 19 Year Olds | 174 (91.6%) | 16 (8.4%) |
| 20 to 24 Year Olds | 170 (100.0%) | 0 (0.0%) |
| 25 to 34 Year Olds | 203 (100.0%) | 0 (0.0%) |
| 35 Years and over | 75 (86.2%) | 12 (13.8%) |
| Total | 1,704 (94.1%) | 107 (5.9%) |
Educational Attainment by Field of Study in Alondra Park
Business (339 | 20.6%), education (184 | 11.2%), liberal arts & history (183 | 11.1%), arts & humanities (175 | 10.6%), and engineering (118 | 7.2%) are the most common fields of study among 1,646 individuals in Alondra Park who have obtained a bachelor's degree or higher.
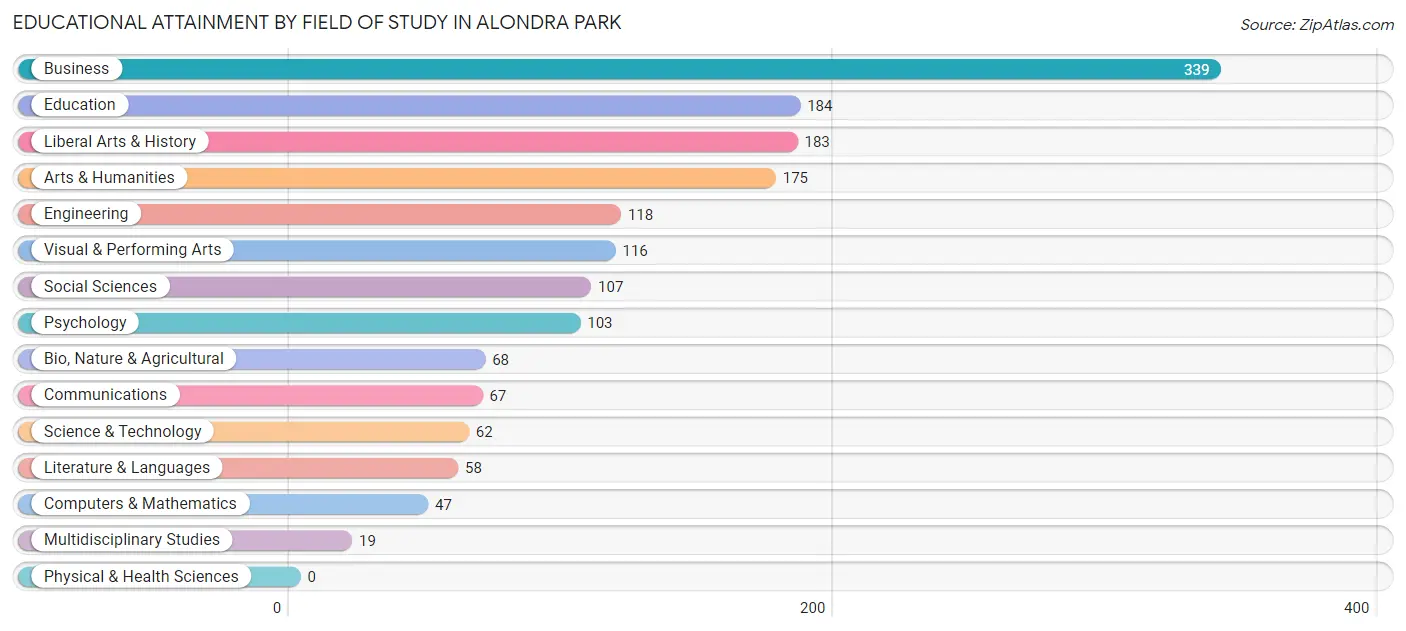
| Field of Study | # Graduates | % Graduates |
| Computers & Mathematics | 47 | 2.9% |
| Bio, Nature & Agricultural | 68 | 4.1% |
| Physical & Health Sciences | 0 | 0.0% |
| Psychology | 103 | 6.3% |
| Social Sciences | 107 | 6.5% |
| Engineering | 118 | 7.2% |
| Multidisciplinary Studies | 19 | 1.1% |
| Science & Technology | 62 | 3.8% |
| Business | 339 | 20.6% |
| Education | 184 | 11.2% |
| Literature & Languages | 58 | 3.5% |
| Liberal Arts & History | 183 | 11.1% |
| Visual & Performing Arts | 116 | 7.0% |
| Communications | 67 | 4.1% |
| Arts & Humanities | 175 | 10.6% |
| Total | 1,646 | 100.0% |
Transportation & Commute in Alondra Park
Vehicle Availability by Sex in Alondra Park
The most prevalent vehicle ownership categories in Alondra Park are males with 2 vehicles (749, accounting for 31.7%) and females with 2 vehicles (560, making up 43.6%).
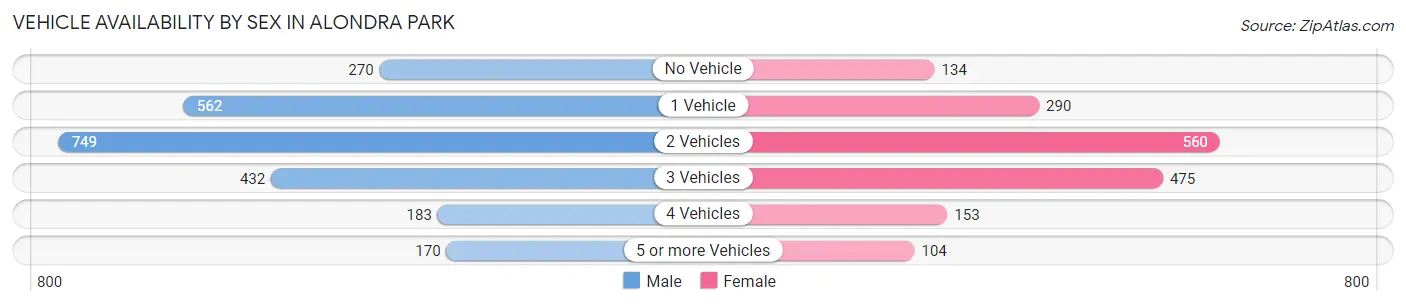
| Vehicles Available | Male | Female |
| No Vehicle | 270 (11.4%) | 134 (7.8%) |
| 1 Vehicle | 562 (23.7%) | 290 (16.9%) |
| 2 Vehicles | 749 (31.7%) | 560 (32.6%) |
| 3 Vehicles | 432 (18.3%) | 475 (27.7%) |
| 4 Vehicles | 183 (7.7%) | 153 (8.9%) |
| 5 or more Vehicles | 170 (7.2%) | 104 (6.1%) |
| Total | 2,366 (100.0%) | 1,716 (100.0%) |
Commute Time in Alondra Park
The most frequently occuring commute durations in Alondra Park are 15 to 19 minutes (885 commuters, 22.8%), 10 to 14 minutes (628 commuters, 16.2%), and 20 to 24 minutes (538 commuters, 13.9%).
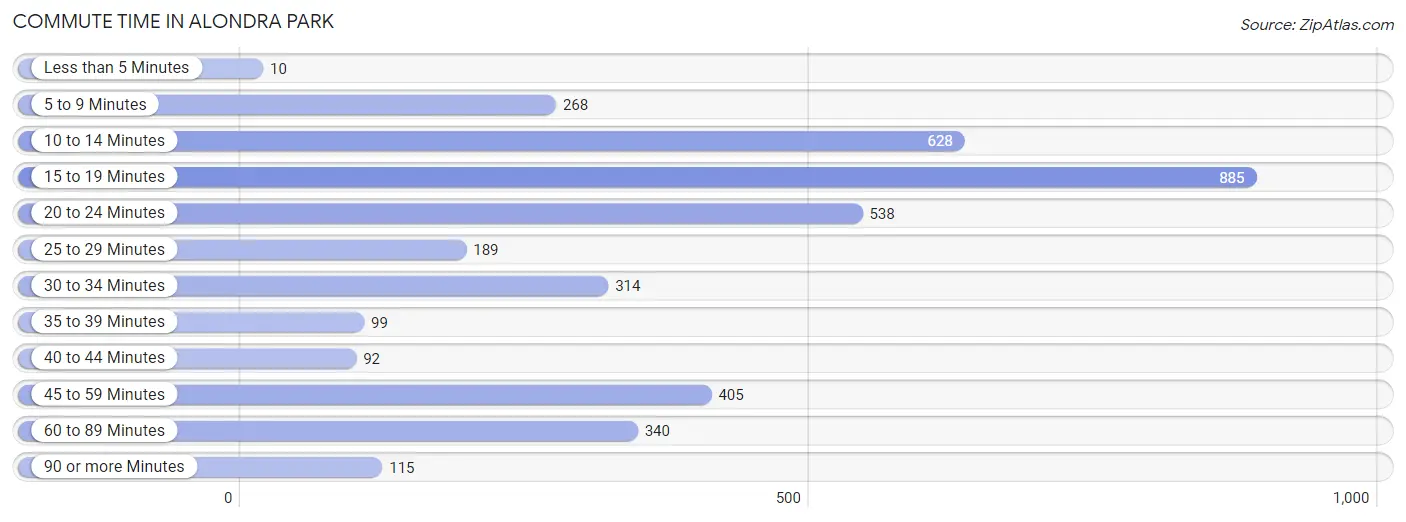
| Commute Time | # Commuters | % Commuters |
| Less than 5 Minutes | 10 | 0.3% |
| 5 to 9 Minutes | 268 | 6.9% |
| 10 to 14 Minutes | 628 | 16.2% |
| 15 to 19 Minutes | 885 | 22.8% |
| 20 to 24 Minutes | 538 | 13.9% |
| 25 to 29 Minutes | 189 | 4.9% |
| 30 to 34 Minutes | 314 | 8.1% |
| 35 to 39 Minutes | 99 | 2.5% |
| 40 to 44 Minutes | 92 | 2.4% |
| 45 to 59 Minutes | 405 | 10.4% |
| 60 to 89 Minutes | 340 | 8.8% |
| 90 or more Minutes | 115 | 3.0% |
Commute Time by Sex in Alondra Park
The most common commute times in Alondra Park are 15 to 19 minutes (548 commuters, 24.4%) for males and 15 to 19 minutes (337 commuters, 20.5%) for females.
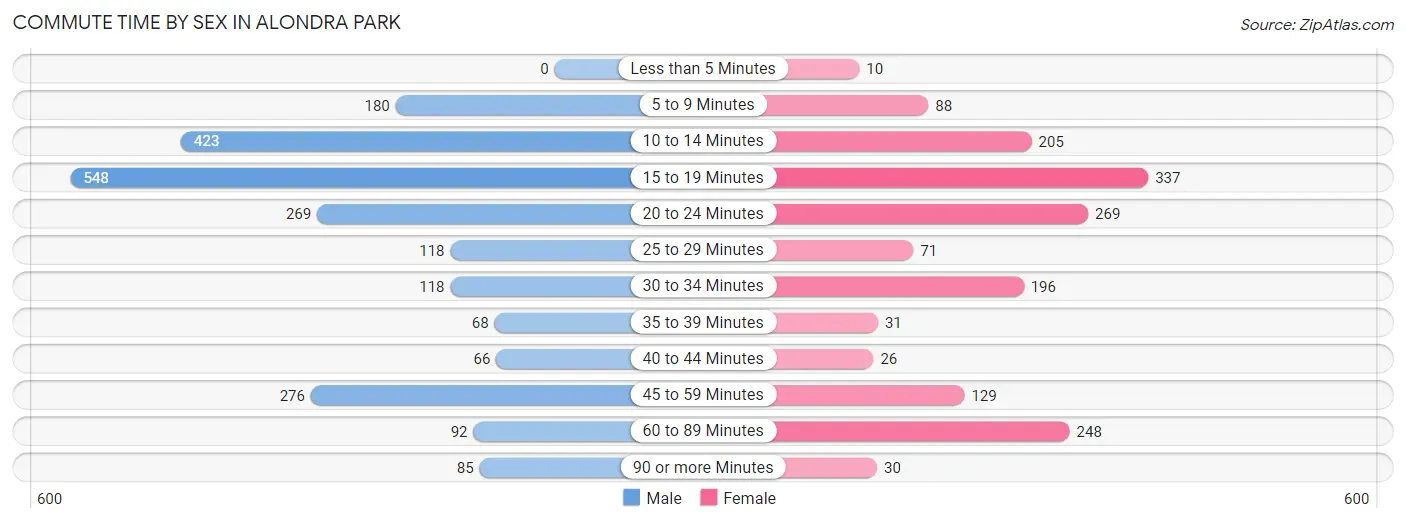
| Commute Time | Male | Female |
| Less than 5 Minutes | 0 (0.0%) | 10 (0.6%) |
| 5 to 9 Minutes | 180 (8.0%) | 88 (5.4%) |
| 10 to 14 Minutes | 423 (18.9%) | 205 (12.5%) |
| 15 to 19 Minutes | 548 (24.4%) | 337 (20.5%) |
| 20 to 24 Minutes | 269 (12.0%) | 269 (16.4%) |
| 25 to 29 Minutes | 118 (5.3%) | 71 (4.3%) |
| 30 to 34 Minutes | 118 (5.3%) | 196 (11.9%) |
| 35 to 39 Minutes | 68 (3.0%) | 31 (1.9%) |
| 40 to 44 Minutes | 66 (2.9%) | 26 (1.6%) |
| 45 to 59 Minutes | 276 (12.3%) | 129 (7.9%) |
| 60 to 89 Minutes | 92 (4.1%) | 248 (15.1%) |
| 90 or more Minutes | 85 (3.8%) | 30 (1.8%) |
Time of Departure to Work by Sex in Alondra Park
The most frequent times of departure to work in Alondra Park are 7:00 AM to 7:29 AM (263, 11.7%) for males and 7:30 AM to 7:59 AM (301, 18.3%) for females.
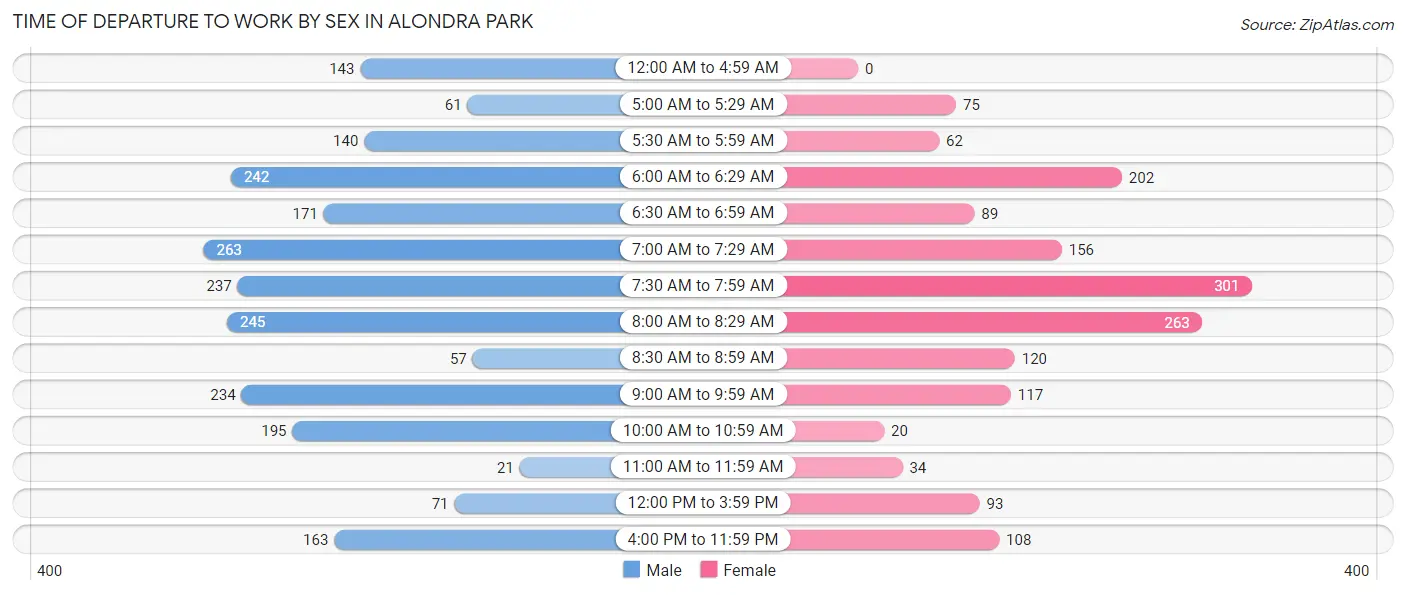
| Time of Departure | Male | Female |
| 12:00 AM to 4:59 AM | 143 (6.4%) | 0 (0.0%) |
| 5:00 AM to 5:29 AM | 61 (2.7%) | 75 (4.6%) |
| 5:30 AM to 5:59 AM | 140 (6.2%) | 62 (3.8%) |
| 6:00 AM to 6:29 AM | 242 (10.8%) | 202 (12.3%) |
| 6:30 AM to 6:59 AM | 171 (7.6%) | 89 (5.4%) |
| 7:00 AM to 7:29 AM | 263 (11.7%) | 156 (9.5%) |
| 7:30 AM to 7:59 AM | 237 (10.6%) | 301 (18.3%) |
| 8:00 AM to 8:29 AM | 245 (10.9%) | 263 (16.0%) |
| 8:30 AM to 8:59 AM | 57 (2.5%) | 120 (7.3%) |
| 9:00 AM to 9:59 AM | 234 (10.4%) | 117 (7.1%) |
| 10:00 AM to 10:59 AM | 195 (8.7%) | 20 (1.2%) |
| 11:00 AM to 11:59 AM | 21 (0.9%) | 34 (2.1%) |
| 12:00 PM to 3:59 PM | 71 (3.2%) | 93 (5.7%) |
| 4:00 PM to 11:59 PM | 163 (7.3%) | 108 (6.6%) |
| Total | 2,243 (100.0%) | 1,640 (100.0%) |
Housing Occupancy in Alondra Park
Occupancy by Ownership in Alondra Park
Of the total 2,764 dwellings in Alondra Park, owner-occupied units account for 1,559 (56.4%), while renter-occupied units make up 1,205 (43.6%).
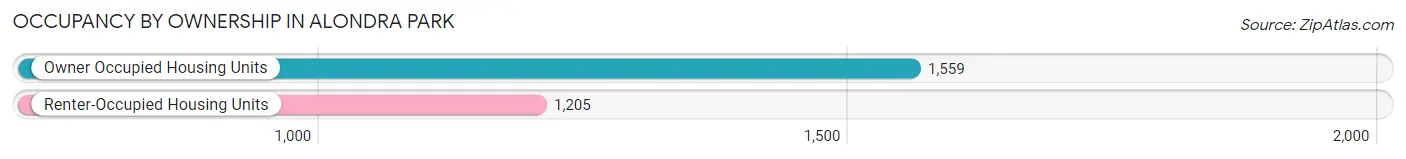
| Occupancy | # Housing Units | % Housing Units |
| Owner Occupied Housing Units | 1,559 | 56.4% |
| Renter-Occupied Housing Units | 1,205 | 43.6% |
| Total Occupied Housing Units | 2,764 | 100.0% |
Occupancy by Household Size in Alondra Park
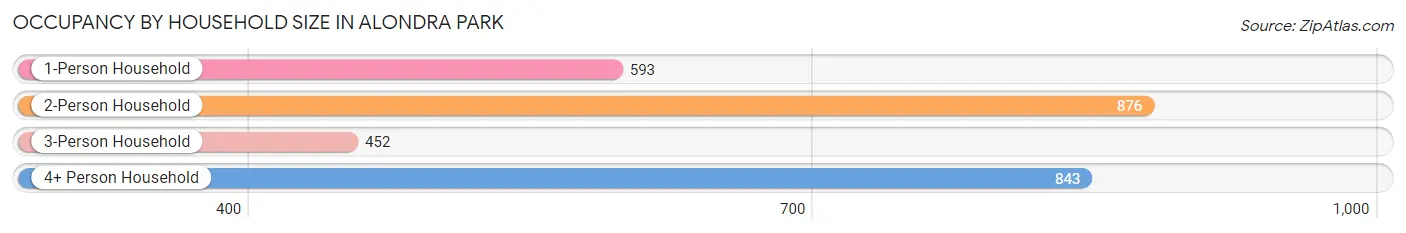
| Household Size | # Housing Units | % Housing Units |
| 1-Person Household | 593 | 21.4% |
| 2-Person Household | 876 | 31.7% |
| 3-Person Household | 452 | 16.4% |
| 4+ Person Household | 843 | 30.5% |
| Total Housing Units | 2,764 | 100.0% |
Occupancy by Ownership by Household Size in Alondra Park
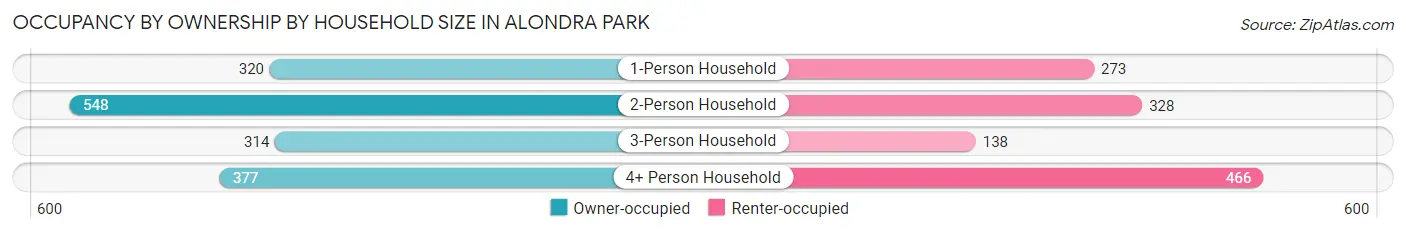
| Household Size | Owner-occupied | Renter-occupied |
| 1-Person Household | 320 (54.0%) | 273 (46.0%) |
| 2-Person Household | 548 (62.6%) | 328 (37.4%) |
| 3-Person Household | 314 (69.5%) | 138 (30.5%) |
| 4+ Person Household | 377 (44.7%) | 466 (55.3%) |
| Total Housing Units | 1,559 (56.4%) | 1,205 (43.6%) |
Occupancy by Educational Attainment in Alondra Park
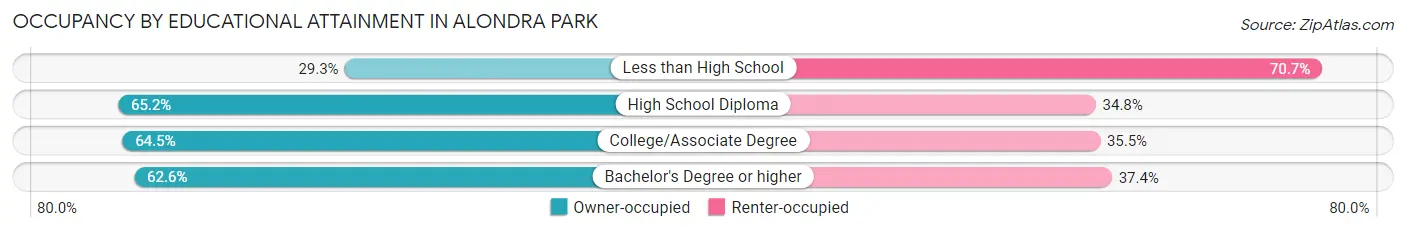
| Household Size | Owner-occupied | Renter-occupied |
| Less than High School | 173 (29.3%) | 418 (70.7%) |
| High School Diploma | 206 (65.2%) | 110 (34.8%) |
| College/Associate Degree | 578 (64.5%) | 318 (35.5%) |
| Bachelor's Degree or higher | 602 (62.6%) | 359 (37.4%) |
Occupancy by Age of Householder in Alondra Park

| Age Bracket | # Households | % Households |
| Under 35 Years | 340 | 12.3% |
| 35 to 44 Years | 540 | 19.5% |
| 45 to 54 Years | 430 | 15.6% |
| 55 to 64 Years | 578 | 20.9% |
| 65 to 74 Years | 532 | 19.3% |
| 75 to 84 Years | 139 | 5.0% |
| 85 Years and Over | 205 | 7.4% |
| Total | 2,764 | 100.0% |
Housing Finances in Alondra Park
Median Income by Occupancy in Alondra Park
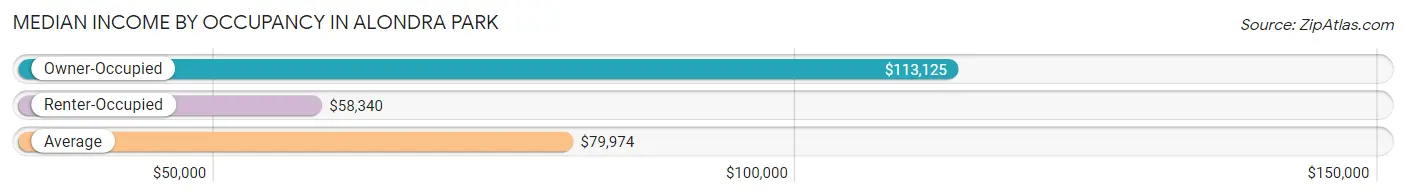
| Occupancy Type | # Households | Median Income |
| Owner-Occupied | 1,559 (56.4%) | $113,125 |
| Renter-Occupied | 1,205 (43.6%) | $58,340 |
| Average | 2,764 (100.0%) | $79,974 |
Occupancy by Householder Income Bracket in Alondra Park
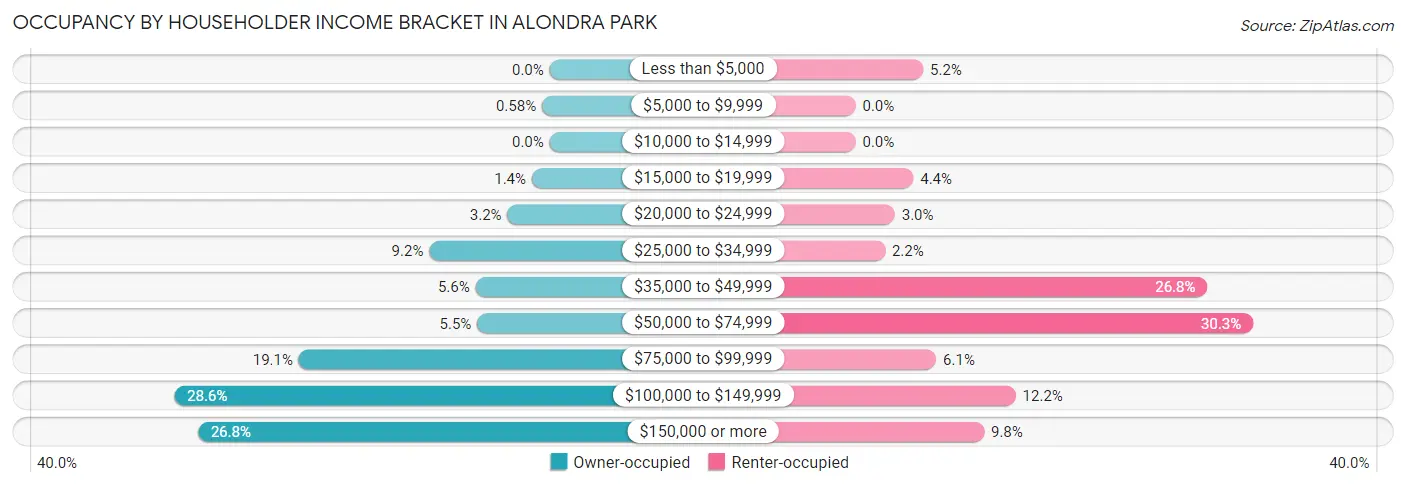
| Income Bracket | Owner-occupied | Renter-occupied |
| Less than $5,000 | 0 (0.0%) | 62 (5.1%) |
| $5,000 to $9,999 | 9 (0.6%) | 0 (0.0%) |
| $10,000 to $14,999 | 0 (0.0%) | 0 (0.0%) |
| $15,000 to $19,999 | 21 (1.3%) | 53 (4.4%) |
| $20,000 to $24,999 | 50 (3.2%) | 36 (3.0%) |
| $25,000 to $34,999 | 143 (9.2%) | 27 (2.2%) |
| $35,000 to $49,999 | 88 (5.6%) | 323 (26.8%) |
| $50,000 to $74,999 | 86 (5.5%) | 365 (30.3%) |
| $75,000 to $99,999 | 298 (19.1%) | 74 (6.1%) |
| $100,000 to $149,999 | 446 (28.6%) | 147 (12.2%) |
| $150,000 or more | 418 (26.8%) | 118 (9.8%) |
| Total | 1,559 (100.0%) | 1,205 (100.0%) |
Monthly Housing Cost Tiers in Alondra Park
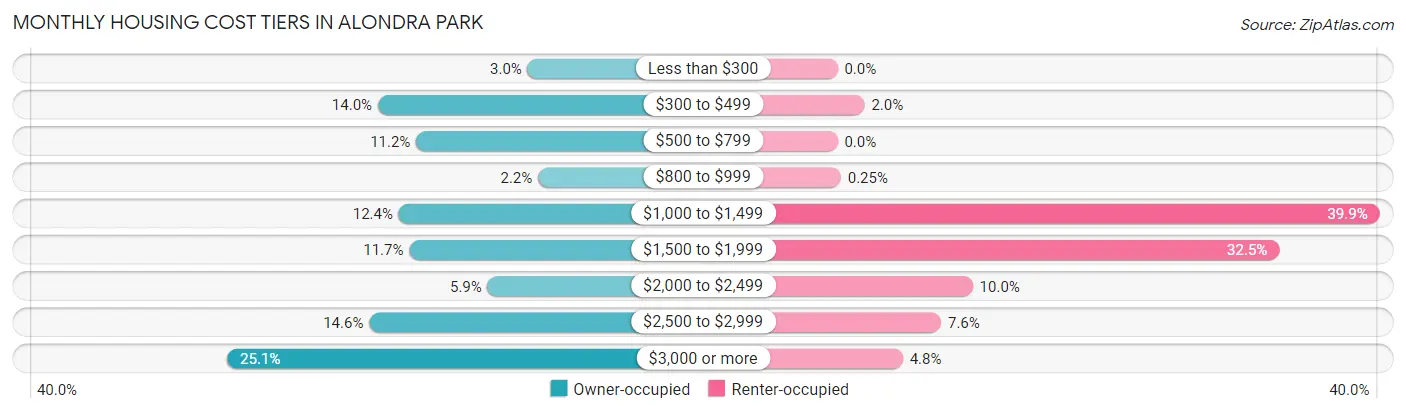
| Monthly Cost | Owner-occupied | Renter-occupied |
| Less than $300 | 46 (2.9%) | 0 (0.0%) |
| $300 to $499 | 218 (14.0%) | 24 (2.0%) |
| $500 to $799 | 174 (11.2%) | 0 (0.0%) |
| $800 to $999 | 34 (2.2%) | 3 (0.3%) |
| $1,000 to $1,499 | 194 (12.4%) | 481 (39.9%) |
| $1,500 to $1,999 | 182 (11.7%) | 392 (32.5%) |
| $2,000 to $2,499 | 92 (5.9%) | 120 (10.0%) |
| $2,500 to $2,999 | 228 (14.6%) | 92 (7.6%) |
| $3,000 or more | 391 (25.1%) | 58 (4.8%) |
| Total | 1,559 (100.0%) | 1,205 (100.0%) |
Physical Housing Characteristics in Alondra Park
Housing Structures in Alondra Park
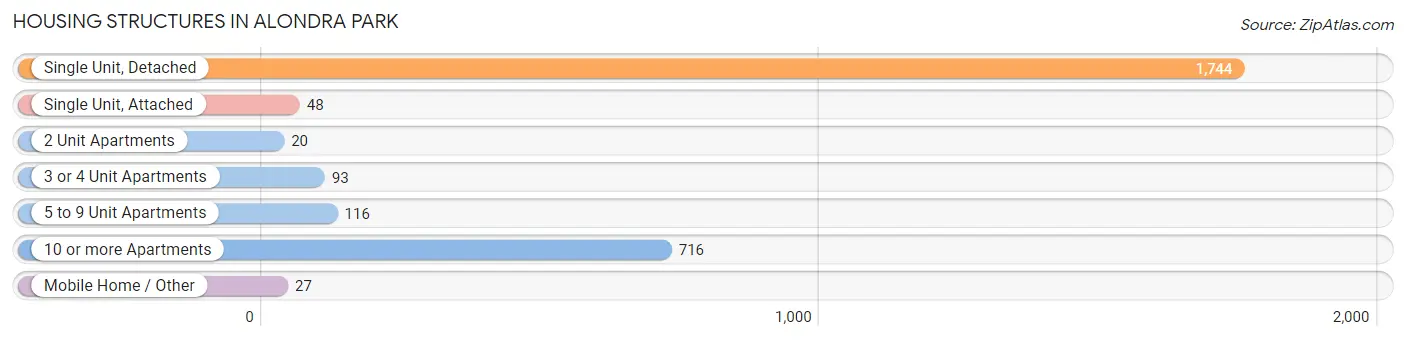
| Structure Type | # Housing Units | % Housing Units |
| Single Unit, Detached | 1,744 | 63.1% |
| Single Unit, Attached | 48 | 1.7% |
| 2 Unit Apartments | 20 | 0.7% |
| 3 or 4 Unit Apartments | 93 | 3.4% |
| 5 to 9 Unit Apartments | 116 | 4.2% |
| 10 or more Apartments | 716 | 25.9% |
| Mobile Home / Other | 27 | 1.0% |
| Total | 2,764 | 100.0% |
Housing Structures by Occupancy in Alondra Park
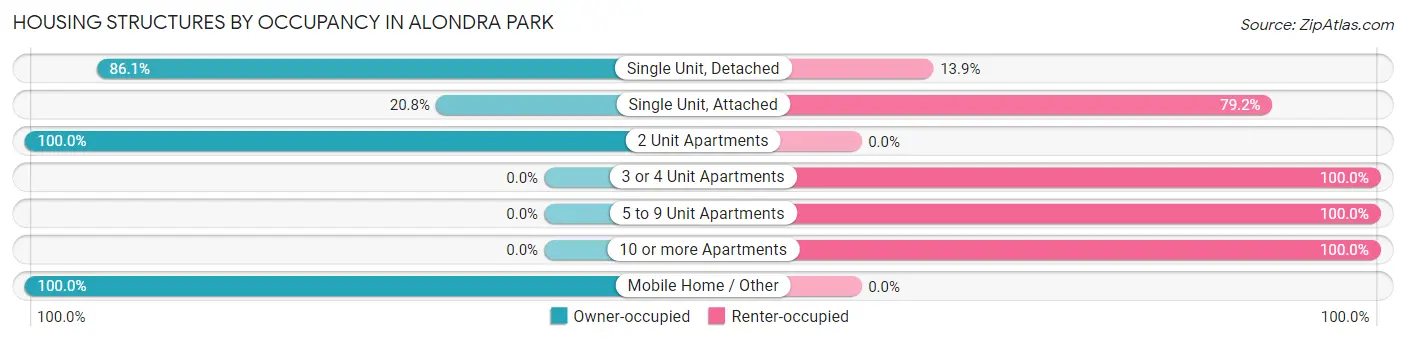
| Structure Type | Owner-occupied | Renter-occupied |
| Single Unit, Detached | 1,502 (86.1%) | 242 (13.9%) |
| Single Unit, Attached | 10 (20.8%) | 38 (79.2%) |
| 2 Unit Apartments | 20 (100.0%) | 0 (0.0%) |
| 3 or 4 Unit Apartments | 0 (0.0%) | 93 (100.0%) |
| 5 to 9 Unit Apartments | 0 (0.0%) | 116 (100.0%) |
| 10 or more Apartments | 0 (0.0%) | 716 (100.0%) |
| Mobile Home / Other | 27 (100.0%) | 0 (0.0%) |
| Total | 1,559 (56.4%) | 1,205 (43.6%) |
Housing Structures by Number of Rooms in Alondra Park
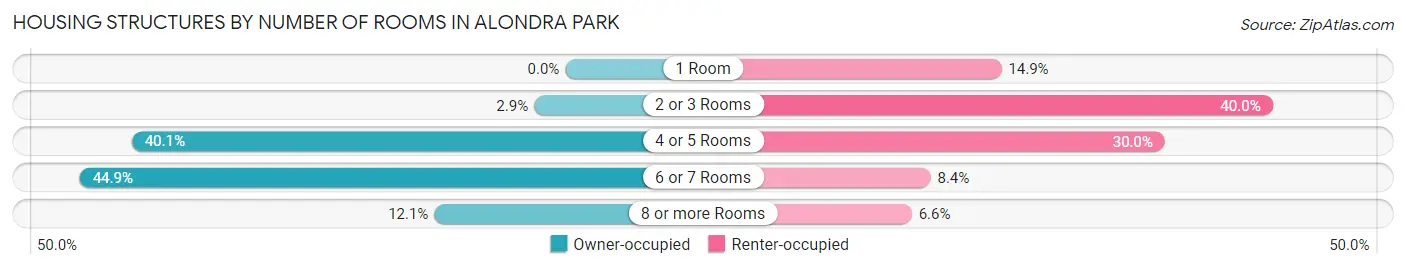
| Number of Rooms | Owner-occupied | Renter-occupied |
| 1 Room | 0 (0.0%) | 180 (14.9%) |
| 2 or 3 Rooms | 45 (2.9%) | 482 (40.0%) |
| 4 or 5 Rooms | 625 (40.1%) | 362 (30.0%) |
| 6 or 7 Rooms | 700 (44.9%) | 101 (8.4%) |
| 8 or more Rooms | 189 (12.1%) | 80 (6.6%) |
| Total | 1,559 (100.0%) | 1,205 (100.0%) |
Housing Structure by Heating Type in Alondra Park
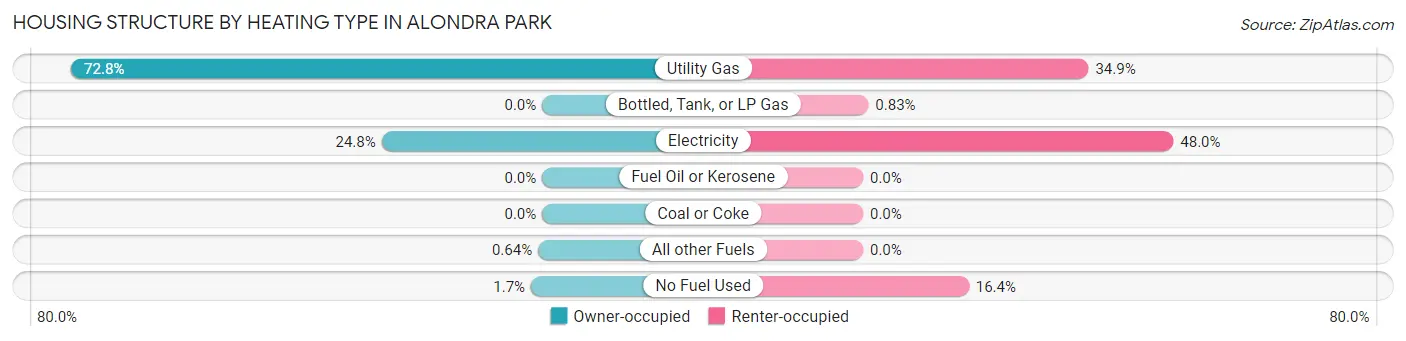
| Heating Type | Owner-occupied | Renter-occupied |
| Utility Gas | 1,135 (72.8%) | 420 (34.8%) |
| Bottled, Tank, or LP Gas | 0 (0.0%) | 10 (0.8%) |
| Electricity | 387 (24.8%) | 578 (48.0%) |
| Fuel Oil or Kerosene | 0 (0.0%) | 0 (0.0%) |
| Coal or Coke | 0 (0.0%) | 0 (0.0%) |
| All other Fuels | 10 (0.6%) | 0 (0.0%) |
| No Fuel Used | 27 (1.7%) | 197 (16.4%) |
| Total | 1,559 (100.0%) | 1,205 (100.0%) |
Household Vehicle Usage in Alondra Park
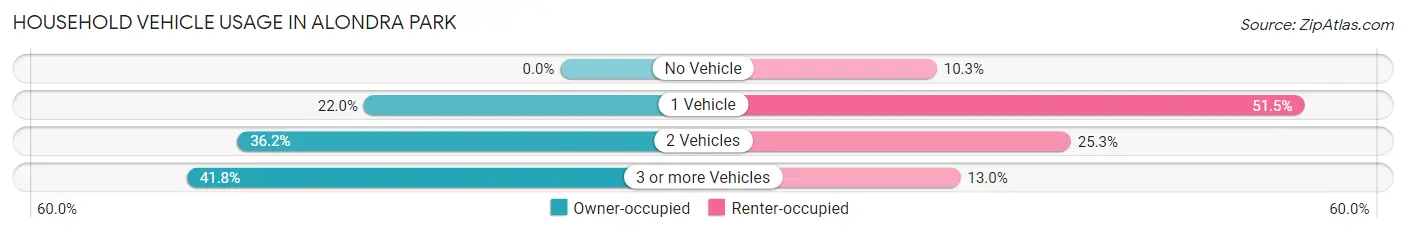
| Vehicles per Household | Owner-occupied | Renter-occupied |
| No Vehicle | 0 (0.0%) | 124 (10.3%) |
| 1 Vehicle | 343 (22.0%) | 620 (51.4%) |
| 2 Vehicles | 564 (36.2%) | 305 (25.3%) |
| 3 or more Vehicles | 652 (41.8%) | 156 (13.0%) |
| Total | 1,559 (100.0%) | 1,205 (100.0%) |
Real Estate & Mortgages in Alondra Park
Real Estate and Mortgage Overview in Alondra Park
| Characteristic | Without Mortgage | With Mortgage |
| Housing Units | 465 | 1,094 |
| Median Property Value | $649,900 | $714,500 |
| Median Household Income | $112,649 | $382 |
| Monthly Housing Costs | $469 | $391 |
| Real Estate Taxes | $1,956 | $8 |
Property Value by Mortgage Status in Alondra Park
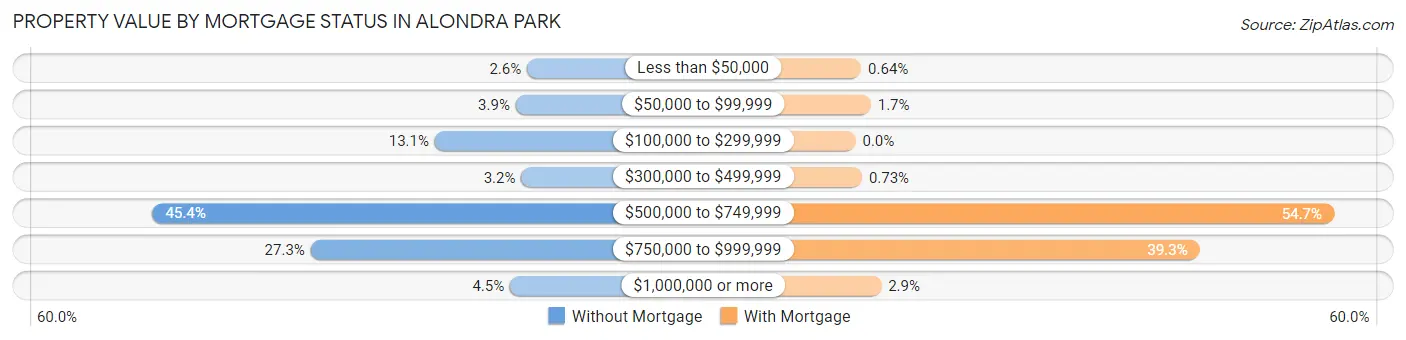
| Property Value | Without Mortgage | With Mortgage |
| Less than $50,000 | 12 (2.6%) | 7 (0.6%) |
| $50,000 to $99,999 | 18 (3.9%) | 19 (1.7%) |
| $100,000 to $299,999 | 61 (13.1%) | 0 (0.0%) |
| $300,000 to $499,999 | 15 (3.2%) | 8 (0.7%) |
| $500,000 to $749,999 | 211 (45.4%) | 598 (54.7%) |
| $750,000 to $999,999 | 127 (27.3%) | 430 (39.3%) |
| $1,000,000 or more | 21 (4.5%) | 32 (2.9%) |
| Total | 465 (100.0%) | 1,094 (100.0%) |
Household Income by Mortgage Status in Alondra Park
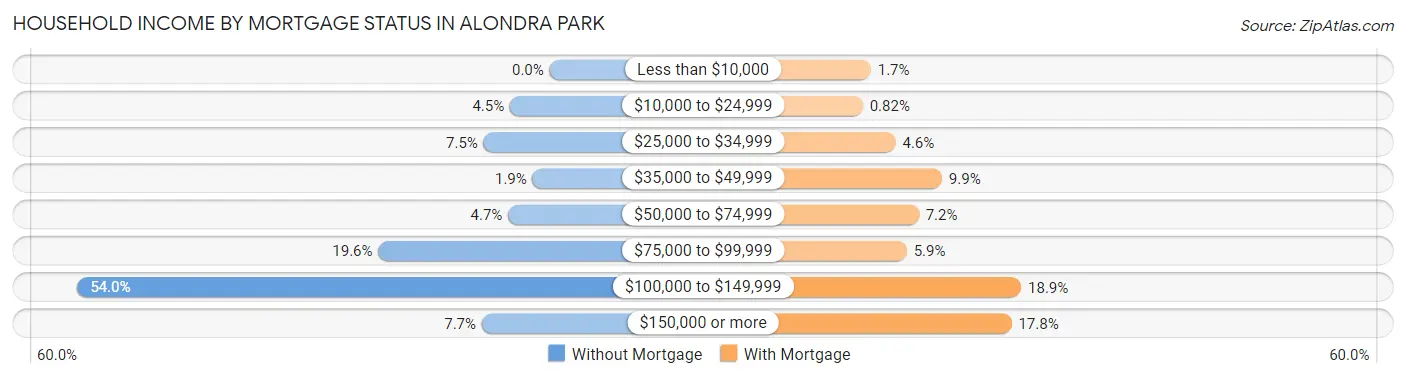
| Household Income | Without Mortgage | With Mortgage |
| Less than $10,000 | 0 (0.0%) | 19 (1.7%) |
| $10,000 to $24,999 | 21 (4.5%) | 9 (0.8%) |
| $25,000 to $34,999 | 35 (7.5%) | 50 (4.6%) |
| $35,000 to $49,999 | 9 (1.9%) | 108 (9.9%) |
| $50,000 to $74,999 | 22 (4.7%) | 79 (7.2%) |
| $75,000 to $99,999 | 91 (19.6%) | 64 (5.9%) |
| $100,000 to $149,999 | 251 (54.0%) | 207 (18.9%) |
| $150,000 or more | 36 (7.7%) | 195 (17.8%) |
| Total | 465 (100.0%) | 1,094 (100.0%) |
Property Value to Household Income Ratio in Alondra Park
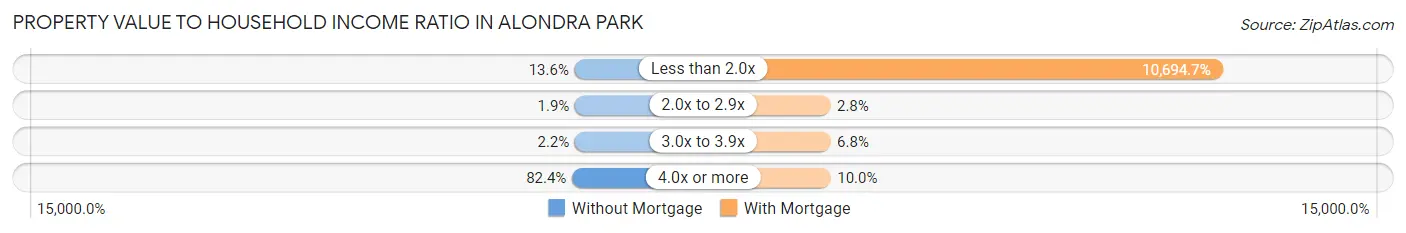
| Value-to-Income Ratio | Without Mortgage | With Mortgage |
| Less than 2.0x | 63 (13.6%) | 117,000 (10,694.7%) |
| 2.0x to 2.9x | 9 (1.9%) | 31 (2.8%) |
| 3.0x to 3.9x | 10 (2.1%) | 74 (6.8%) |
| 4.0x or more | 383 (82.4%) | 109 (10.0%) |
| Total | 465 (100.0%) | 1,094 (100.0%) |
Real Estate Taxes by Mortgage Status in Alondra Park
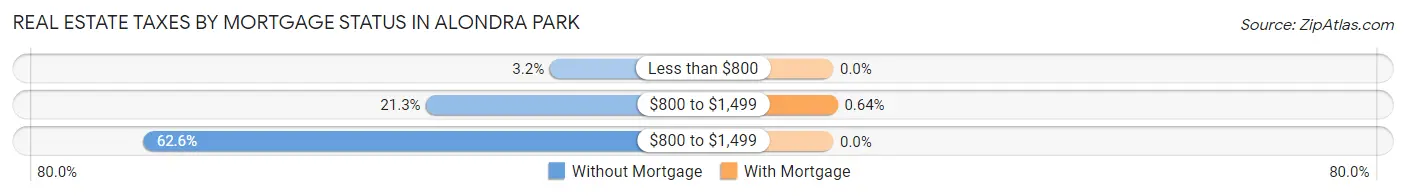
| Property Taxes | Without Mortgage | With Mortgage |
| Less than $800 | 15 (3.2%) | 0 (0.0%) |
| $800 to $1,499 | 99 (21.3%) | 7 (0.6%) |
| $800 to $1,499 | 291 (62.6%) | 0 (0.0%) |
| Total | 465 (100.0%) | 1,094 (100.0%) |
Health & Disability in Alondra Park
Health Insurance Coverage by Age in Alondra Park
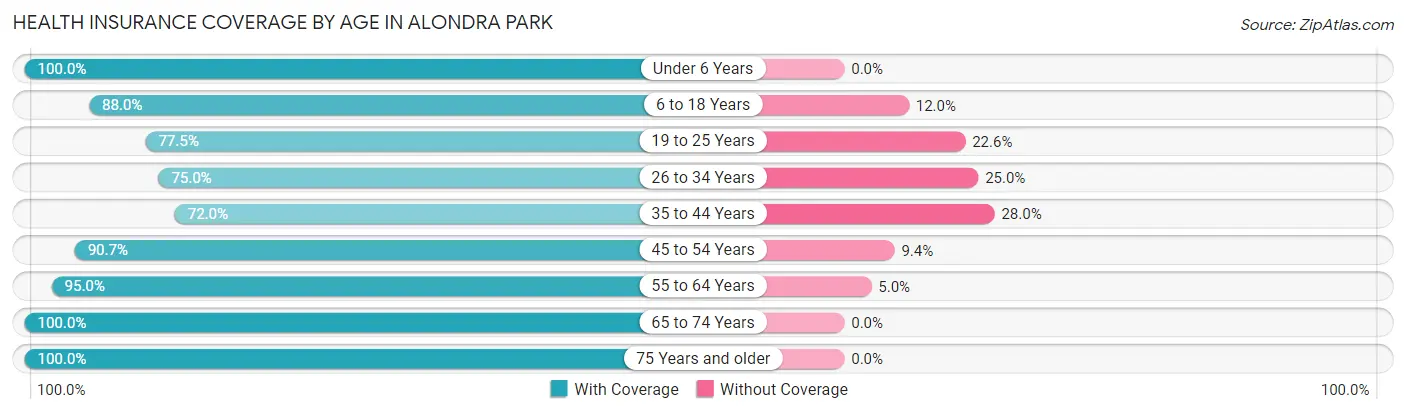
| Age Bracket | With Coverage | Without Coverage |
| Under 6 Years | 651 (100.0%) | 0 (0.0%) |
| 6 to 18 Years | 966 (88.0%) | 132 (12.0%) |
| 19 to 25 Years | 735 (77.4%) | 214 (22.6%) |
| 26 to 34 Years | 640 (75.0%) | 213 (25.0%) |
| 35 to 44 Years | 856 (72.0%) | 333 (28.0%) |
| 45 to 54 Years | 892 (90.6%) | 92 (9.3%) |
| 55 to 64 Years | 1,149 (95.0%) | 61 (5.0%) |
| 65 to 74 Years | 850 (100.0%) | 0 (0.0%) |
| 75 Years and older | 530 (100.0%) | 0 (0.0%) |
| Total | 7,269 (87.4%) | 1,045 (12.6%) |
Health Insurance Coverage by Citizenship Status in Alondra Park
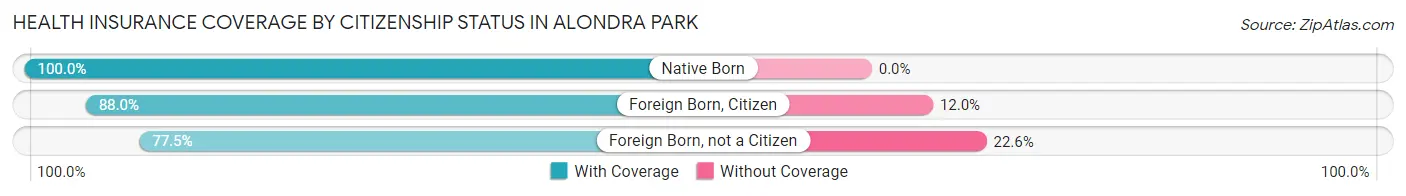
| Citizenship Status | With Coverage | Without Coverage |
| Native Born | 651 (100.0%) | 0 (0.0%) |
| Foreign Born, Citizen | 966 (88.0%) | 132 (12.0%) |
| Foreign Born, not a Citizen | 735 (77.4%) | 214 (22.6%) |
Health Insurance Coverage by Household Income in Alondra Park
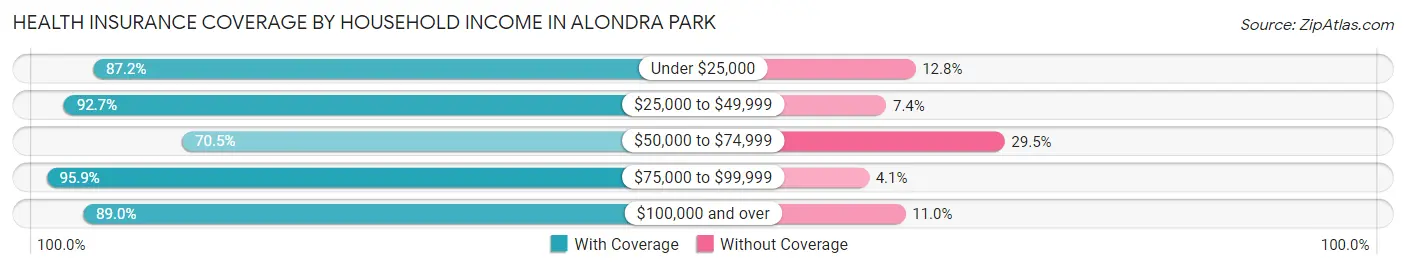
| Household Income | With Coverage | Without Coverage |
| Under $25,000 | 483 (87.2%) | 71 (12.8%) |
| $25,000 to $49,999 | 1,248 (92.6%) | 99 (7.3%) |
| $50,000 to $74,999 | 969 (70.5%) | 406 (29.5%) |
| $75,000 to $99,999 | 1,099 (95.9%) | 47 (4.1%) |
| $100,000 and over | 3,429 (89.0%) | 422 (11.0%) |
Public vs Private Health Insurance Coverage by Age in Alondra Park
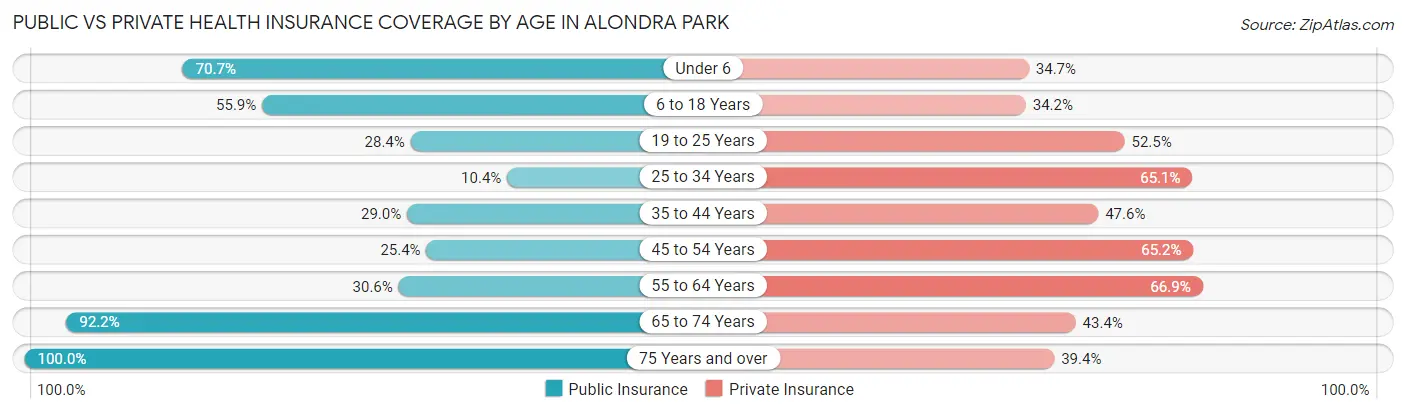
| Age Bracket | Public Insurance | Private Insurance |
| Under 6 | 460 (70.7%) | 226 (34.7%) |
| 6 to 18 Years | 614 (55.9%) | 375 (34.2%) |
| 19 to 25 Years | 269 (28.3%) | 498 (52.5%) |
| 25 to 34 Years | 89 (10.4%) | 555 (65.1%) |
| 35 to 44 Years | 345 (29.0%) | 566 (47.6%) |
| 45 to 54 Years | 250 (25.4%) | 642 (65.2%) |
| 55 to 64 Years | 370 (30.6%) | 810 (66.9%) |
| 65 to 74 Years | 784 (92.2%) | 369 (43.4%) |
| 75 Years and over | 530 (100.0%) | 209 (39.4%) |
| Total | 3,711 (44.6%) | 4,250 (51.1%) |
Disability Status by Sex by Age in Alondra Park
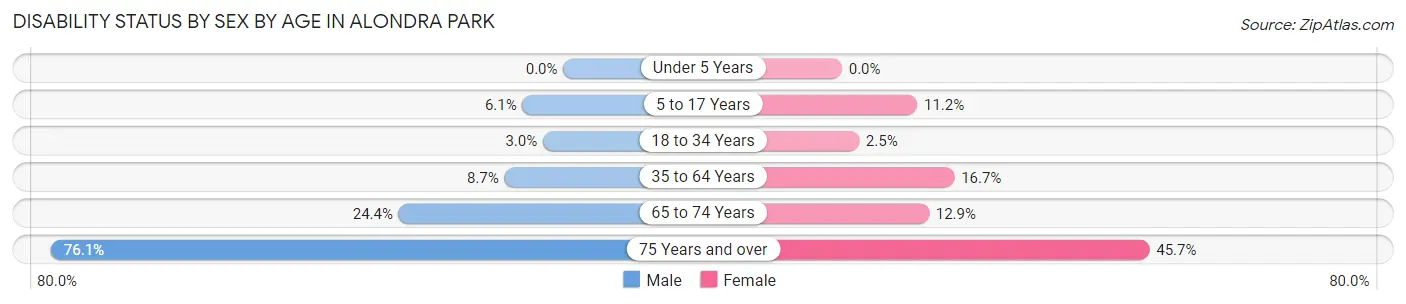
| Age Bracket | Male | Female |
| Under 5 Years | 0 (0.0%) | 0 (0.0%) |
| 5 to 17 Years | 34 (6.1%) | 57 (11.2%) |
| 18 to 34 Years | 26 (3.0%) | 26 (2.5%) |
| 35 to 64 Years | 157 (8.7%) | 264 (16.7%) |
| 65 to 74 Years | 98 (24.4%) | 58 (12.9%) |
| 75 Years and over | 140 (76.1%) | 158 (45.7%) |
Disability Class by Sex by Age in Alondra Park
Disability Class: Hearing Difficulty
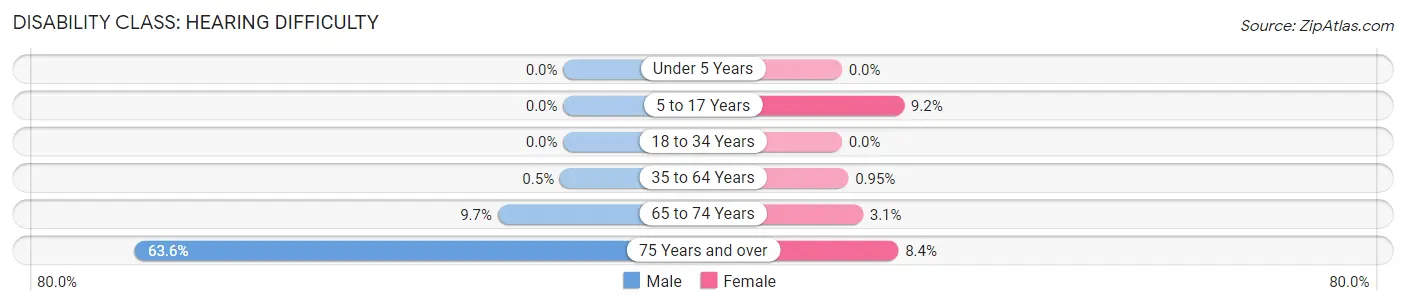
| Age Bracket | Male | Female |
| Under 5 Years | 0 (0.0%) | 0 (0.0%) |
| 5 to 17 Years | 0 (0.0%) | 47 (9.2%) |
| 18 to 34 Years | 0 (0.0%) | 0 (0.0%) |
| 35 to 64 Years | 9 (0.5%) | 15 (0.9%) |
| 65 to 74 Years | 39 (9.7%) | 14 (3.1%) |
| 75 Years and over | 117 (63.6%) | 29 (8.4%) |
Disability Class: Vision Difficulty
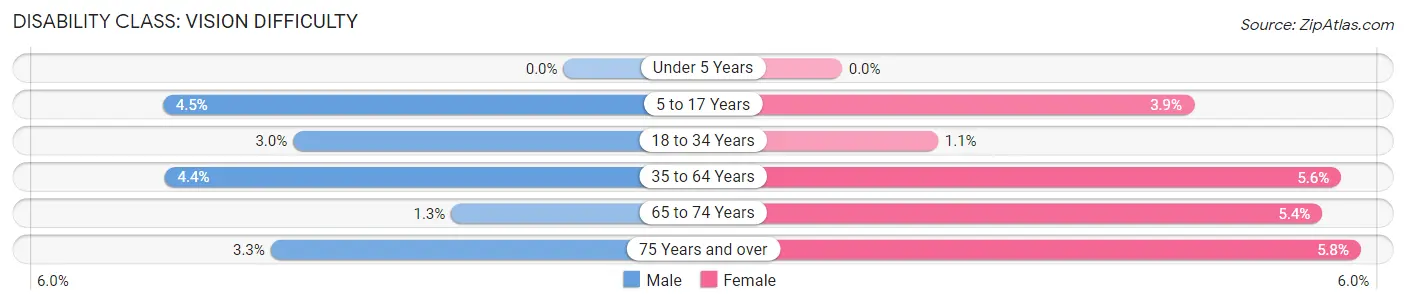
| Age Bracket | Male | Female |
| Under 5 Years | 0 (0.0%) | 0 (0.0%) |
| 5 to 17 Years | 25 (4.5%) | 20 (3.9%) |
| 18 to 34 Years | 26 (3.0%) | 11 (1.1%) |
| 35 to 64 Years | 80 (4.4%) | 88 (5.6%) |
| 65 to 74 Years | 5 (1.3%) | 24 (5.3%) |
| 75 Years and over | 6 (3.3%) | 20 (5.8%) |
Disability Class: Cognitive Difficulty
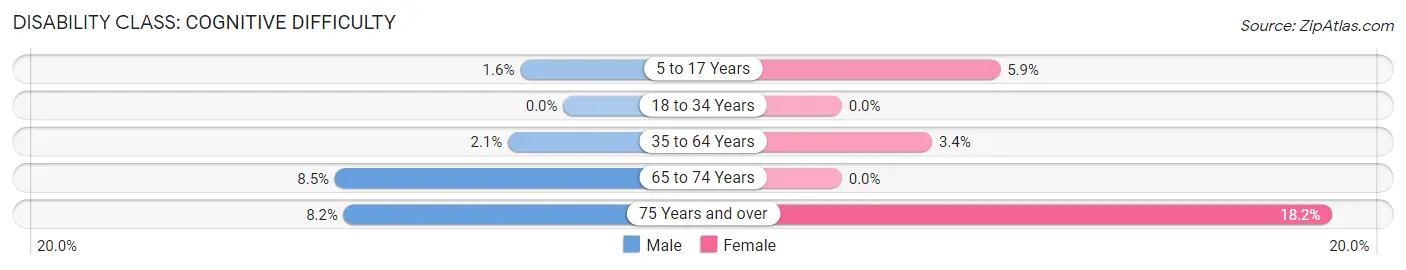
| Age Bracket | Male | Female |
| 5 to 17 Years | 9 (1.6%) | 30 (5.9%) |
| 18 to 34 Years | 0 (0.0%) | 0 (0.0%) |
| 35 to 64 Years | 37 (2.1%) | 53 (3.4%) |
| 65 to 74 Years | 34 (8.5%) | 0 (0.0%) |
| 75 Years and over | 15 (8.2%) | 63 (18.2%) |
Disability Class: Ambulatory Difficulty
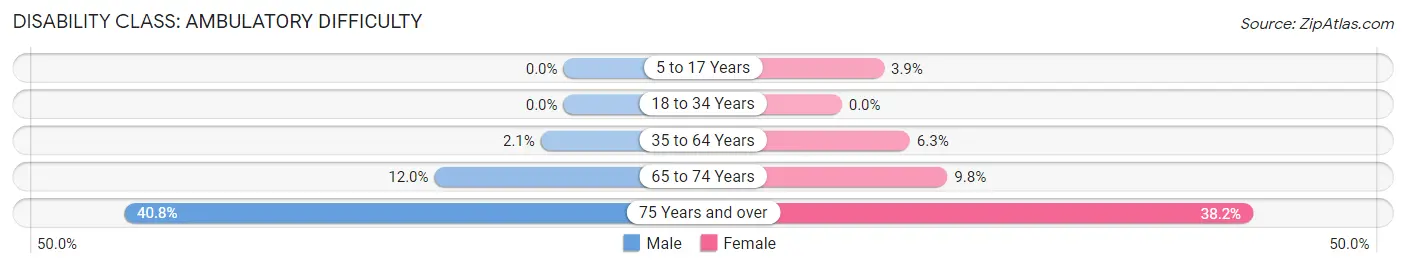
| Age Bracket | Male | Female |
| 5 to 17 Years | 0 (0.0%) | 20 (3.9%) |
| 18 to 34 Years | 0 (0.0%) | 0 (0.0%) |
| 35 to 64 Years | 38 (2.1%) | 100 (6.3%) |
| 65 to 74 Years | 48 (12.0%) | 44 (9.8%) |
| 75 Years and over | 75 (40.8%) | 132 (38.2%) |
Disability Class: Self-Care Difficulty
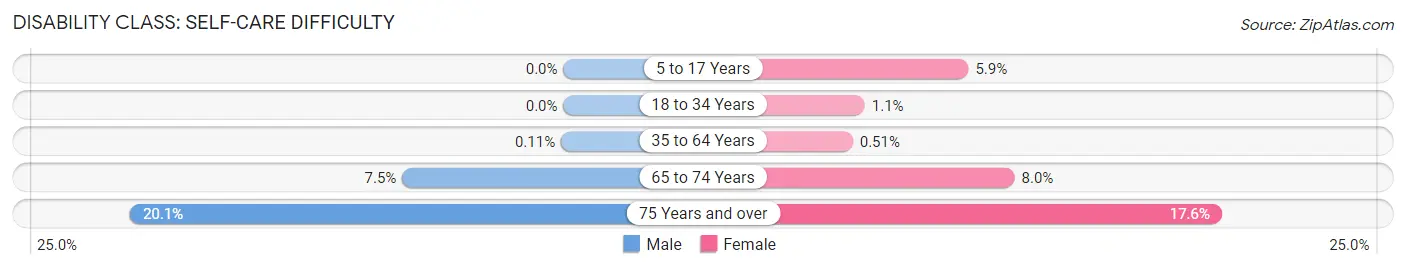
| Age Bracket | Male | Female |
| 5 to 17 Years | 0 (0.0%) | 30 (5.9%) |
| 18 to 34 Years | 0 (0.0%) | 11 (1.1%) |
| 35 to 64 Years | 2 (0.1%) | 8 (0.5%) |
| 65 to 74 Years | 30 (7.5%) | 36 (8.0%) |
| 75 Years and over | 37 (20.1%) | 61 (17.6%) |
Technology Access in Alondra Park
Computing Device Access in Alondra Park
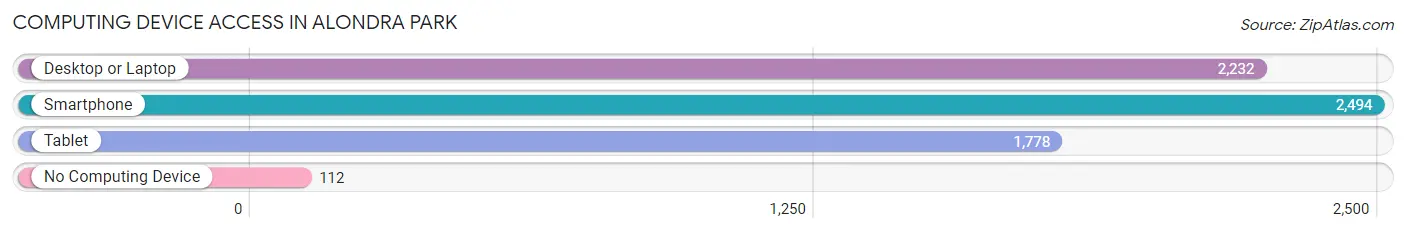
| Device Type | # Households | % Households |
| Desktop or Laptop | 2,232 | 80.7% |
| Smartphone | 2,494 | 90.2% |
| Tablet | 1,778 | 64.3% |
| No Computing Device | 112 | 4.1% |
| Total | 2,764 | 100.0% |
Internet Access in Alondra Park
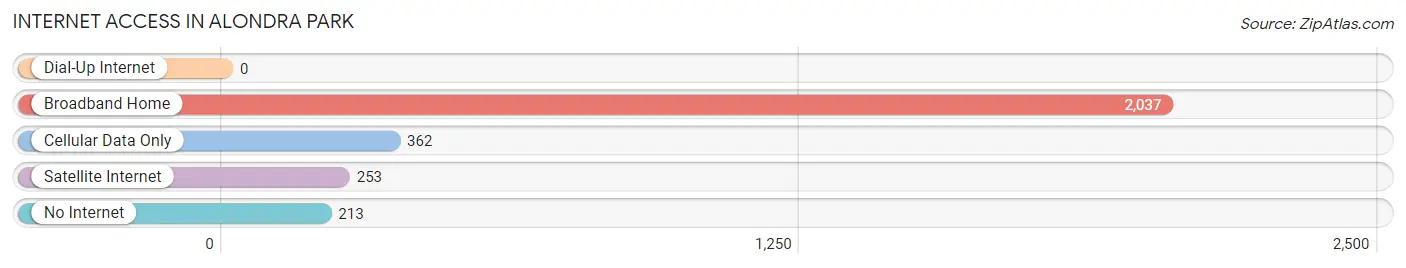
| Internet Type | # Households | % Households |
| Dial-Up Internet | 0 | 0.0% |
| Broadband Home | 2,037 | 73.7% |
| Cellular Data Only | 362 | 13.1% |
| Satellite Internet | 253 | 9.1% |
| No Internet | 213 | 7.7% |
| Total | 2,764 | 100.0% |
Alondra Park Summary
Alondra Park is a census-designated place (CDP) located in Los Angeles County, California. It is located in the South Bay region of the Greater Los Angeles Area and is bordered by the cities of Lawndale, Hawthorne, and Gardena. The population of Alondra Park was 8,592 at the 2010 census.
Geography
Alondra Park is located at 33°53'25" North, 118°19'45" West (33.890278, -118.329167). It has an area of 1.2 square miles (3.2 km2).
The terrain of Alondra Park is mostly flat, with some rolling hills. The area is mostly residential, with some commercial and industrial areas. The Los Angeles River is located to the east of Alondra Park.
History
Alondra Park was originally part of the Rancho San Pedro land grant, which was granted to Juan Jose Dominguez in 1784. The area was later developed as an agricultural community in the late 19th century.
In the early 20th century, the area was developed as a residential community. The Alondra Park subdivision was developed in the 1950s. The area was officially designated as a census-designated place in 1980.
Economy
Alondra Park has a diverse economy. The largest employers in the area are the Los Angeles Unified School District, the City of Lawndale, and the Los Angeles County Sheriff's Department. Other major employers include the Los Angeles County Fire Department, the Los Angeles County Department of Public Works, and the Los Angeles County Department of Health Services.
Demographics
As of the 2010 census, Alondra Park had a population of 8,592. The racial makeup of Alondra Park was 4,945 (57.7%) White, 1,845 (21.5%) African American, 545 (6.3%) Asian, and 1,207 (14.0%) Hispanic or Latino.
The median household income in Alondra Park was $50,945 in 2010. The median age was 33.7 years. The median home value was $521,000.
Conclusion
Alondra Park is a census-designated place located in Los Angeles County, California. It is located in the South Bay region of the Greater Los Angeles Area and is bordered by the cities of Lawndale, Hawthorne, and Gardena. The population of Alondra Park was 8,592 at the 2010 census. The area is mostly residential, with some commercial and industrial areas. The economy of Alondra Park is diverse, with the largest employers being the Los Angeles Unified School District, the City of Lawndale, and the Los Angeles County Sheriff's Department. The racial makeup of Alondra Park was 57.7% White, 21.5% African American, 6.3% Asian, and 14.0% Hispanic or Latino. The median household income in Alondra Park was $50,945 in 2010. The median age was 33.7 years. The median home value was $521,000.
Common Questions
What is Per Capita Income in Alondra Park?
Per Capita income in Alondra Park is $34,357.
What is the Median Family Income in Alondra Park?
Median Family Income in Alondra Park is $91,991.
What is the Median Household income in Alondra Park?
Median Household Income in Alondra Park is $79,974.
What is Income or Wage Gap in Alondra Park?
Income or Wage Gap in Alondra Park is 15.8%.
Women in Alondra Park earn 84.2 cents for every dollar earned by a man.
What is Inequality or Gini Index in Alondra Park?
Inequality or Gini Index in Alondra Park is 0.38.
What is the Total Population of Alondra Park?
Total Population of Alondra Park is 8,314.
What is the Total Male Population of Alondra Park?
Total Male Population of Alondra Park is 4,050.
What is the Total Female Population of Alondra Park?
Total Female Population of Alondra Park is 4,264.
What is the Ratio of Males per 100 Females in Alondra Park?
There are 94.98 Males per 100 Females in Alondra Park.
What is the Ratio of Females per 100 Males in Alondra Park?
There are 105.28 Females per 100 Males in Alondra Park.
What is the Median Population Age in Alondra Park?
Median Population Age in Alondra Park is 39.5 Years.
What is the Average Family Size in Alondra Park
Average Family Size in Alondra Park is 3.5 People.
What is the Average Household Size in Alondra Park
Average Household Size in Alondra Park is 3.0 People.
How Large is the Labor Force in Alondra Park?
There are 4,318 People in the Labor Forcein in Alondra Park.
What is the Percentage of People in the Labor Force in Alondra Park?
62.9% of People are in the Labor Force in Alondra Park.
What is the Unemployment Rate in Alondra Park?
Unemployment Rate in Alondra Park is 4.0%.