Cities with the Highest Percentage of Population Employed in Food Preparation & Serving in North Carolina
RELATED REPORTS & OPTIONS
Food Preparation & Serving
North Carolina
Compare Cities
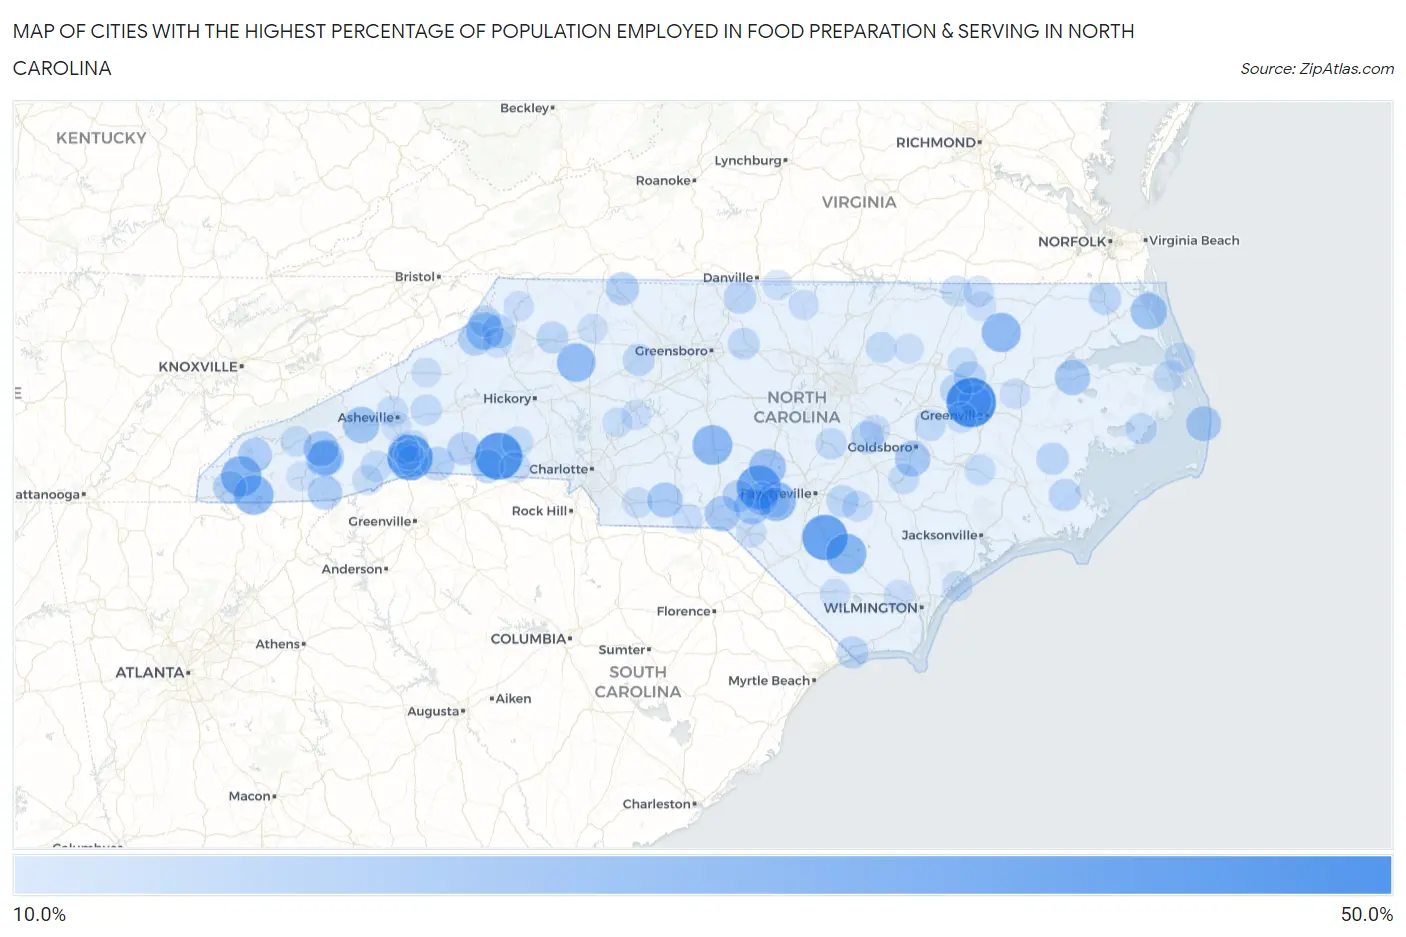
Map of Cities with the Highest Percentage of Population Employed in Food Preparation & Serving in North Carolina
0.0%
50.0%
Cities with the Highest Percentage of Population Employed in Food Preparation & Serving in North Carolina
| City | % Employed | vs State | vs National | |
| 1. | Falkland | 44.5% | 5.3%(+39.3)#1 | 5.3%(+39.3)#139 |
| 2. | Lattimore | 40.1% | 5.3%(+34.8)#2 | 5.3%(+34.9)#187 |
| 3. | Barker Heights | 37.1% | 5.3%(+31.8)#3 | 5.3%(+31.8)#217 |
| 4. | Tar Heel | 37.0% | 5.3%(+31.7)#4 | 5.3%(+31.8)#218 |
| 5. | Ashley Heights | 34.9% | 5.3%(+29.6)#5 | 5.3%(+29.6)#257 |
| 6. | Marble | 28.8% | 5.3%(+23.5)#6 | 5.3%(+23.5)#374 |
| 7. | Elizabethtown | 28.6% | 5.3%(+23.3)#7 | 5.3%(+23.3)#377 |
| 8. | Star | 27.4% | 5.3%(+22.1)#8 | 5.3%(+22.1)#416 |
| 9. | Hayesville | 27.3% | 5.3%(+22.0)#9 | 5.3%(+22.0)#419 |
| 10. | Silver City | 26.8% | 5.3%(+21.5)#10 | 5.3%(+21.6)#438 |
| 11. | Roxobel | 26.5% | 5.3%(+21.2)#11 | 5.3%(+21.2)#450 |
| 12. | Love Valley | 25.6% | 5.3%(+20.3)#12 | 5.3%(+20.3)#483 |
| 13. | Valle Crucis | 23.1% | 5.3%(+17.8)#13 | 5.3%(+17.8)#609 |
| 14. | Vass | 22.8% | 5.3%(+17.5)#14 | 5.3%(+17.5)#627 |
| 15. | Coinjock | 21.8% | 5.3%(+16.5)#15 | 5.3%(+16.5)#691 |
| 16. | West Canton | 21.7% | 5.3%(+16.4)#16 | 5.3%(+16.4)#700 |
| 17. | Bowdens | 21.4% | 5.3%(+16.1)#17 | 5.3%(+16.1)#716 |
| 18. | Deercroft | 21.1% | 5.3%(+15.8)#18 | 5.3%(+15.8)#728 |
| 19. | Cullowhee | 20.5% | 5.3%(+15.3)#19 | 5.3%(+15.3)#780 |
| 20. | Forest Hills | 20.5% | 5.3%(+15.2)#20 | 5.3%(+15.2)#791 |
| 21. | Brogden | 20.3% | 5.3%(+15.0)#21 | 5.3%(+15.0)#804 |
| 22. | Sylva | 20.2% | 5.3%(+14.9)#22 | 5.3%(+14.9)#818 |
| 23. | Dobbins Heights | 20.0% | 5.3%(+14.7)#23 | 5.3%(+14.7)#834 |
| 24. | Roper | 20.0% | 5.3%(+14.7)#24 | 5.3%(+14.7)#835 |
| 25. | Polkton | 19.6% | 5.3%(+14.3)#25 | 5.3%(+14.3)#881 |
| 26. | Salvo | 19.3% | 5.3%(+14.0)#26 | 5.3%(+14.0)#915 |
| 27. | Farmington | 18.8% | 5.3%(+13.5)#27 | 5.3%(+13.5)#971 |
| 28. | Highlands | 18.2% | 5.3%(+12.9)#28 | 5.3%(+12.9)#1,037 |
| 29. | Robbinsville | 17.9% | 5.3%(+12.6)#29 | 5.3%(+12.6)#1,084 |
| 30. | Columbus | 17.5% | 5.3%(+12.2)#30 | 5.3%(+12.2)#1,130 |
| 31. | Banner Elk | 17.5% | 5.3%(+12.2)#31 | 5.3%(+12.2)#1,142 |
| 32. | Cliffside | 17.2% | 5.3%(+12.0)#32 | 5.3%(+12.0)#1,172 |
| 33. | Boone | 17.2% | 5.3%(+11.9)#33 | 5.3%(+11.9)#1,175 |
| 34. | Murphy | 16.6% | 5.3%(+11.3)#34 | 5.3%(+11.3)#1,284 |
| 35. | Flat Rock | 16.5% | 5.3%(+11.2)#35 | 5.3%(+11.2)#1,297 |
| 36. | Five Points | 16.4% | 5.3%(+11.1)#36 | 5.3%(+11.1)#1,309 |
| 37. | Rutherfordton | 16.2% | 5.3%(+10.9)#37 | 5.3%(+10.9)#1,352 |
| 38. | Four Oaks | 16.0% | 5.3%(+10.7)#38 | 5.3%(+10.7)#1,400 |
| 39. | Belvoir | 15.9% | 5.3%(+10.6)#39 | 5.3%(+10.6)#1,423 |
| 40. | Barnardsville | 15.7% | 5.3%(+10.4)#40 | 5.3%(+10.4)#1,480 |
| 41. | Hoffman | 15.5% | 5.3%(+10.2)#41 | 5.3%(+10.2)#1,507 |
| 42. | Ruffin | 15.3% | 5.3%(+10.00)#42 | 5.3%(+10.0)#1,560 |
| 43. | Pinetops | 15.3% | 5.3%(+9.98)#43 | 5.3%(+9.99)#1,565 |
| 44. | Autryville | 15.2% | 5.3%(+9.93)#44 | 5.3%(+9.93)#1,575 |
| 45. | Oriental | 15.2% | 5.3%(+9.90)#45 | 5.3%(+9.90)#1,580 |
| 46. | Aurora | 15.1% | 5.3%(+9.83)#46 | 5.3%(+9.84)#1,592 |
| 47. | South Mills | 15.0% | 5.3%(+9.72)#47 | 5.3%(+9.73)#1,623 |
| 48. | Princeville | 14.9% | 5.3%(+9.65)#48 | 5.3%(+9.66)#1,654 |
| 49. | Valley Hill | 14.9% | 5.3%(+9.65)#49 | 5.3%(+9.65)#1,657 |
| 50. | Calabash | 14.9% | 5.3%(+9.57)#50 | 5.3%(+9.58)#1,673 |
| 51. | Cove Creek | 14.7% | 5.3%(+9.43)#51 | 5.3%(+9.43)#1,707 |
| 52. | Emma | 14.6% | 5.3%(+9.33)#52 | 5.3%(+9.34)#1,726 |
| 53. | Cricket | 14.6% | 5.3%(+9.29)#53 | 5.3%(+9.30)#1,739 |
| 54. | Bermuda Run | 14.4% | 5.3%(+9.11)#54 | 5.3%(+9.11)#1,794 |
| 55. | Fruitland | 14.2% | 5.3%(+8.92)#55 | 5.3%(+8.92)#1,858 |
| 56. | Elon | 14.2% | 5.3%(+8.90)#56 | 5.3%(+8.90)#1,862 |
| 57. | Buies Creek | 14.0% | 5.3%(+8.69)#57 | 5.3%(+8.69)#1,924 |
| 58. | Eureka | 13.8% | 5.3%(+8.54)#58 | 5.3%(+8.54)#1,964 |
| 59. | East Flat Rock | 13.7% | 5.3%(+8.42)#59 | 5.3%(+8.42)#2,003 |
| 60. | Brevard | 13.6% | 5.3%(+8.35)#60 | 5.3%(+8.36)#2,022 |
| 61. | Engelhard | 13.6% | 5.3%(+8.31)#61 | 5.3%(+8.31)#2,037 |
| 62. | Fallston | 13.6% | 5.3%(+8.29)#62 | 5.3%(+8.29)#2,041 |
| 63. | Montreat | 13.5% | 5.3%(+8.21)#63 | 5.3%(+8.22)#2,065 |
| 64. | Louisburg | 13.2% | 5.3%(+7.94)#64 | 5.3%(+7.94)#2,169 |
| 65. | Dover | 13.0% | 5.3%(+7.66)#65 | 5.3%(+7.67)#2,274 |
| 66. | Roseboro | 12.9% | 5.3%(+7.60)#66 | 5.3%(+7.61)#2,302 |
| 67. | Woodfin | 12.8% | 5.3%(+7.56)#67 | 5.3%(+7.56)#2,321 |
| 68. | Bryson City | 12.8% | 5.3%(+7.51)#68 | 5.3%(+7.51)#2,348 |
| 69. | Patterson Springs | 12.7% | 5.3%(+7.44)#69 | 5.3%(+7.45)#2,385 |
| 70. | Gaston | 12.7% | 5.3%(+7.43)#70 | 5.3%(+7.43)#2,393 |
| 71. | Calypso | 12.7% | 5.3%(+7.41)#71 | 5.3%(+7.41)#2,403 |
| 72. | Farmville | 12.7% | 5.3%(+7.37)#72 | 5.3%(+7.38)#2,421 |
| 73. | Manns Harbor | 12.6% | 5.3%(+7.35)#73 | 5.3%(+7.35)#2,426 |
| 74. | Wingate | 12.5% | 5.3%(+7.20)#74 | 5.3%(+7.20)#2,531 |
| 75. | Rosman | 12.4% | 5.3%(+7.07)#75 | 5.3%(+7.07)#2,581 |
| 76. | Seaboard | 12.2% | 5.3%(+6.95)#76 | 5.3%(+6.96)#2,619 |
| 77. | Mountain Home | 12.1% | 5.3%(+6.85)#77 | 5.3%(+6.85)#2,681 |
| 78. | Granite Quarry | 12.0% | 5.3%(+6.72)#78 | 5.3%(+6.72)#2,752 |
| 79. | Bear Grass | 12.0% | 5.3%(+6.71)#79 | 5.3%(+6.71)#2,762 |
| 80. | Topsail Beach | 12.0% | 5.3%(+6.69)#80 | 5.3%(+6.69)#2,776 |
| 81. | West Jefferson | 11.9% | 5.3%(+6.63)#81 | 5.3%(+6.64)#2,813 |
| 82. | Whiteville | 11.9% | 5.3%(+6.60)#82 | 5.3%(+6.60)#2,831 |
| 83. | Northwest | 11.8% | 5.3%(+6.54)#83 | 5.3%(+6.55)#2,859 |
| 84. | Morven | 11.8% | 5.3%(+6.54)#84 | 5.3%(+6.54)#2,864 |
| 85. | East Laurinburg | 11.8% | 5.3%(+6.54)#85 | 5.3%(+6.54)#2,865 |
| 86. | Leggett | 11.8% | 5.3%(+6.47)#86 | 5.3%(+6.48)#2,901 |
| 87. | Smithfield | 11.7% | 5.3%(+6.39)#87 | 5.3%(+6.40)#2,956 |
| 88. | Kill Devil Hills | 11.7% | 5.3%(+6.39)#88 | 5.3%(+6.39)#2,957 |
| 89. | Raeford | 11.7% | 5.3%(+6.37)#89 | 5.3%(+6.37)#2,967 |
| 90. | Roxboro | 11.6% | 5.3%(+6.28)#90 | 5.3%(+6.29)#3,025 |
| 91. | Landis | 11.6% | 5.3%(+6.26)#91 | 5.3%(+6.26)#3,036 |
| 92. | Milton | 11.5% | 5.3%(+6.18)#92 | 5.3%(+6.19)#3,084 |
| 93. | Jackson | 11.4% | 5.3%(+6.12)#93 | 5.3%(+6.12)#3,117 |
| 94. | Jonesville | 11.4% | 5.3%(+6.12)#94 | 5.3%(+6.12)#3,120 |
| 95. | Asheville | 11.4% | 5.3%(+6.11)#95 | 5.3%(+6.12)#3,129 |
| 96. | Blowing Rock | 11.2% | 5.3%(+5.95)#96 | 5.3%(+5.95)#3,236 |
| 97. | Castalia | 11.2% | 5.3%(+5.95)#97 | 5.3%(+5.95)#3,242 |
| 98. | Franklin | 11.2% | 5.3%(+5.94)#98 | 5.3%(+5.95)#3,245 |
| 99. | Burnsville | 11.2% | 5.3%(+5.92)#99 | 5.3%(+5.92)#3,255 |
| 100. | Hendersonville | 11.2% | 5.3%(+5.91)#100 | 5.3%(+5.91)#3,266 |
Common Questions
What are the Top 10 Cities with the Highest Percentage of Population Employed in Food Preparation & Serving in North Carolina?
Top 10 Cities with the Highest Percentage of Population Employed in Food Preparation & Serving in North Carolina are:
#1
44.5%
#2
40.1%
#3
37.1%
#4
37.0%
#5
34.9%
#6
28.8%
#7
28.6%
#8
27.4%
#9
27.3%
#10
26.8%
What city has the Highest Percentage of Population Employed in Food Preparation & Serving in North Carolina?
Falkland has the Highest Percentage of Population Employed in Food Preparation & Serving in North Carolina with 44.5%.
What is the Percentage of Population Employed in Food Preparation & Serving in the State of North Carolina?
Percentage of Population Employed in Food Preparation & Serving in North Carolina is 5.3%.
What is the Percentage of Population Employed in Food Preparation & Serving in the United States?
Percentage of Population Employed in Food Preparation & Serving in the United States is 5.3%.