Waterloo, CA Map & Demographics
Waterloo Map
Waterloo Overview
$68,579
PER CAPITA INCOME
$250,001
AVG FAMILY INCOME
$250,001
AVG HOUSEHOLD INCOME
0.36
INEQUALITY / GINI INDEX
840
TOTAL POPULATION
394
MALE POPULATION
446
FEMALE POPULATION
88.34
MALES / 100 FEMALES
113.20
FEMALES / 100 MALES
53.1
MEDIAN AGE
2.6
AVG FAMILY SIZE
2.6
AVG HOUSEHOLD SIZE
566
LABOR FORCE [ PEOPLE ]
78.6%
PERCENT IN LABOR FORCE
Income in Waterloo
Income Overview in Waterloo
Per Capita Income in Waterloo is $68,579, while median incomes of families and households are $250,001 and $250,001 respectively.
| Characteristic | Number | Measure |
| Per Capita Income | 840 | $68,579 |
| Median Family Income | 296 | $250,001 |
| Mean Family Income | 296 | $194,392 |
| Median Household Income | 321 | $250,001 |
| Mean Household Income | 321 | $183,752 |
| Income Deficit | 296 | $0 |
| Wage / Income Gap (%) | 840 | 0.00% |
| Wage / Income Gap ($) | 840 | 100.00¢ per $1 |
| Gini / Inequality Index | 840 | 0.36 |
Earnings by Sex in Waterloo
| Sex | Number | Average Earnings |
| Male | 295 (49.4%) | $0 |
| Female | 302 (50.6%) | $0 |
| Total | 597 (100.0%) | $0 |
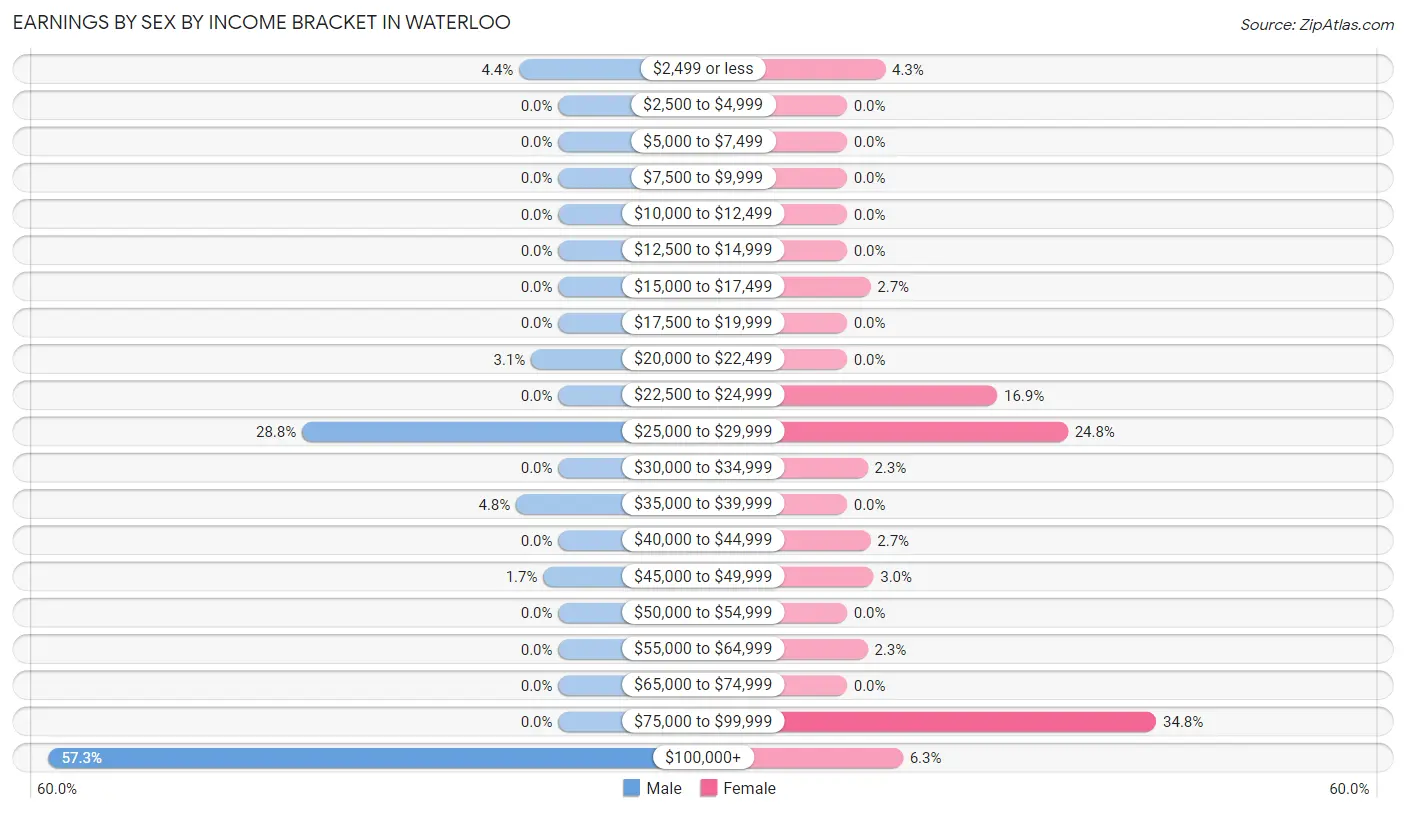
Earnings by Sex by Income Bracket in Waterloo
The most common earnings brackets in Waterloo are $100,000+ for men (169 | 57.3%) and $75,000 to $99,999 for women (105 | 34.8%).
| Income | Male | Female |
| $2,499 or less | 13 (4.4%) | 13 (4.3%) |
| $2,500 to $4,999 | 0 (0.0%) | 0 (0.0%) |
| $5,000 to $7,499 | 0 (0.0%) | 0 (0.0%) |
| $7,500 to $9,999 | 0 (0.0%) | 0 (0.0%) |
| $10,000 to $12,499 | 0 (0.0%) | 0 (0.0%) |
| $12,500 to $14,999 | 0 (0.0%) | 0 (0.0%) |
| $15,000 to $17,499 | 0 (0.0%) | 8 (2.6%) |
| $17,500 to $19,999 | 0 (0.0%) | 0 (0.0%) |
| $20,000 to $22,499 | 9 (3.0%) | 0 (0.0%) |
| $22,500 to $24,999 | 0 (0.0%) | 51 (16.9%) |
| $25,000 to $29,999 | 85 (28.8%) | 75 (24.8%) |
| $30,000 to $34,999 | 0 (0.0%) | 7 (2.3%) |
| $35,000 to $39,999 | 14 (4.8%) | 0 (0.0%) |
| $40,000 to $44,999 | 0 (0.0%) | 8 (2.6%) |
| $45,000 to $49,999 | 5 (1.7%) | 9 (3.0%) |
| $50,000 to $54,999 | 0 (0.0%) | 0 (0.0%) |
| $55,000 to $64,999 | 0 (0.0%) | 7 (2.3%) |
| $65,000 to $74,999 | 0 (0.0%) | 0 (0.0%) |
| $75,000 to $99,999 | 0 (0.0%) | 105 (34.8%) |
| $100,000+ | 169 (57.3%) | 19 (6.3%) |
| Total | 295 (100.0%) | 302 (100.0%) |
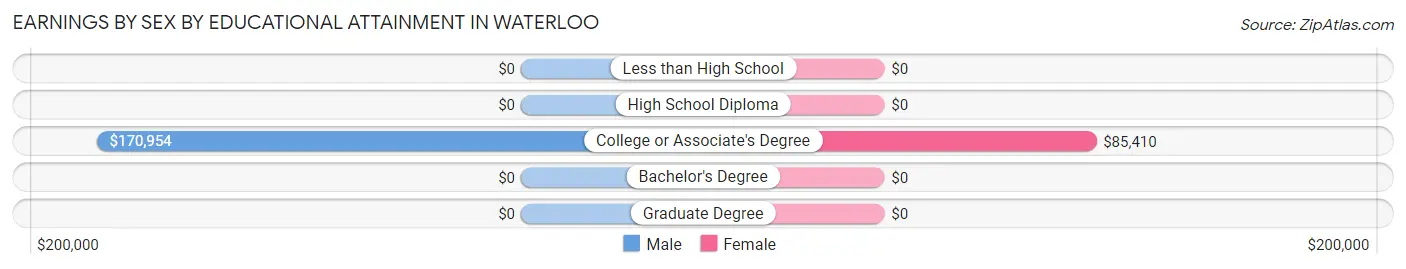
Earnings by Sex by Educational Attainment in Waterloo
| Educational Attainment | Male Income | Female Income |
| Less than High School | - | - |
| High School Diploma | - | - |
| College or Associate's Degree | $170,954 | $85,410 |
| Bachelor's Degree | - | - |
| Graduate Degree | - | - |
| Total | - | - |
Family Income in Waterloo
Family Income Brackets in Waterloo
According to the Waterloo family income data, there are 184 families falling into the $200,000+ income range, which is the most common income bracket and makes up 62.2% of all families.
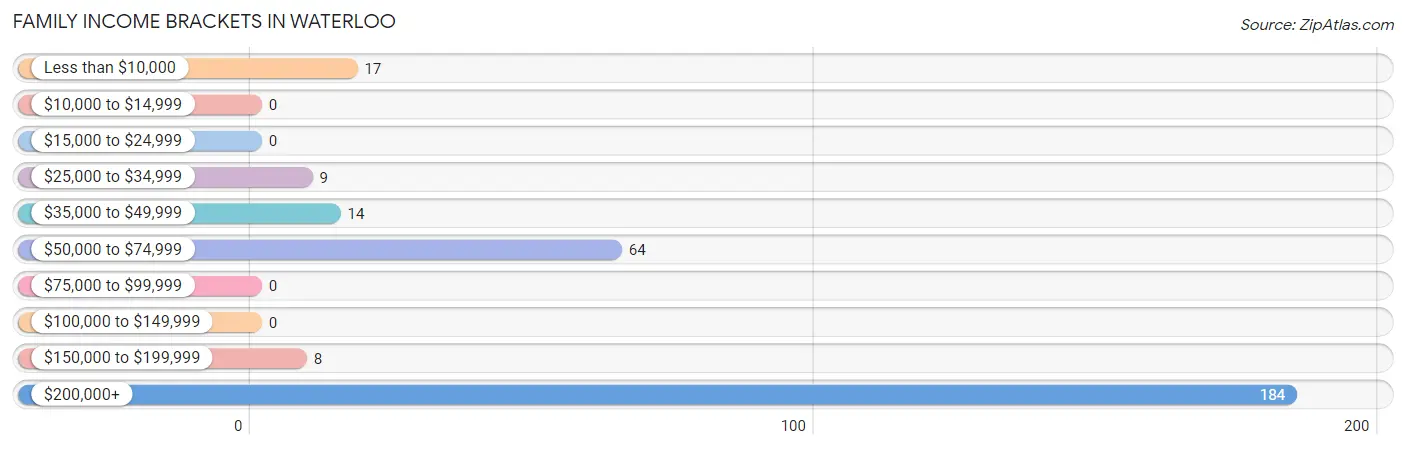
| Income Bracket | # Families | % Families |
| Less than $10,000 | 17 | 5.7% |
| $10,000 to $14,999 | 0 | 0.0% |
| $15,000 to $24,999 | 0 | 0.0% |
| $25,000 to $34,999 | 9 | 3.0% |
| $35,000 to $49,999 | 14 | 4.7% |
| $50,000 to $74,999 | 64 | 21.6% |
| $75,000 to $99,999 | 0 | 0.0% |
| $100,000 to $149,999 | 0 | 0.0% |
| $150,000 to $199,999 | 8 | 2.7% |
| $200,000+ | 184 | 62.2% |
Family Income by Famaliy Size in Waterloo
2-person families (138 | 46.6%) account for the highest median family income in Waterloo with $250,001 per family, while 2-person families (138 | 46.6%) have the highest median income of $125,000 per family member.
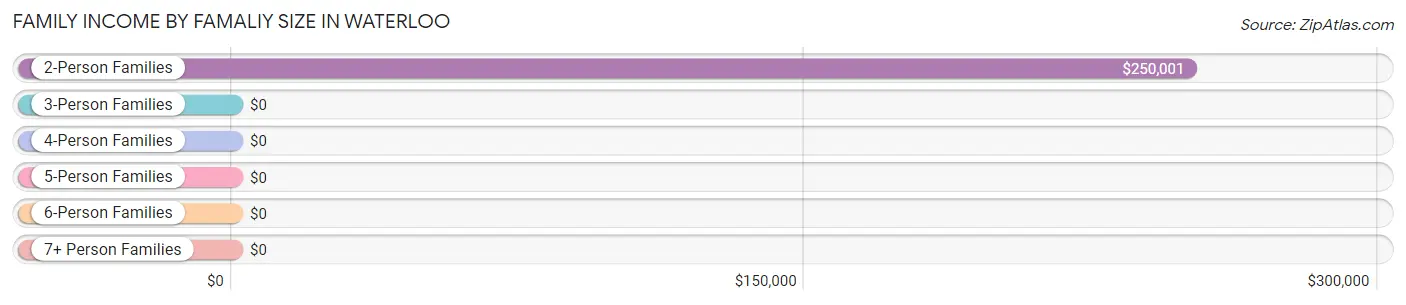
| Income Bracket | # Families | Median Income |
| 2-Person Families | 138 (46.6%) | $250,001 |
| 3-Person Families | 149 (50.3%) | $0 |
| 4-Person Families | 0 (0.0%) | $0 |
| 5-Person Families | 0 (0.0%) | $0 |
| 6-Person Families | 0 (0.0%) | $0 |
| 7+ Person Families | 9 (3.0%) | $0 |
| Total | 296 (100.0%) | $250,001 |
Family Income by Number of Earners in Waterloo
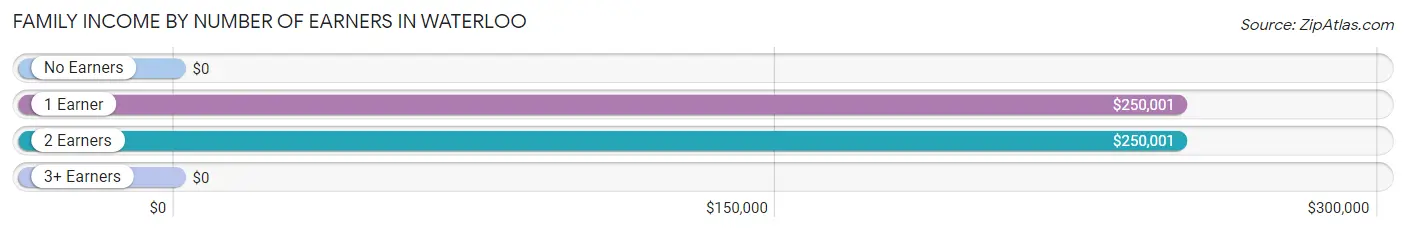
| Number of Earners | # Families | Median Income |
| No Earners | 17 (5.7%) | $0 |
| 1 Earner | 42 (14.2%) | $250,001 |
| 2 Earners | 189 (63.8%) | $250,001 |
| 3+ Earners | 48 (16.2%) | $0 |
| Total | 296 (100.0%) | $250,001 |
Household Income in Waterloo
Household Income Brackets in Waterloo
With 184 households falling in the category, the $200,000+ income range is the most frequent in Waterloo, accounting for 57.3% of all households.
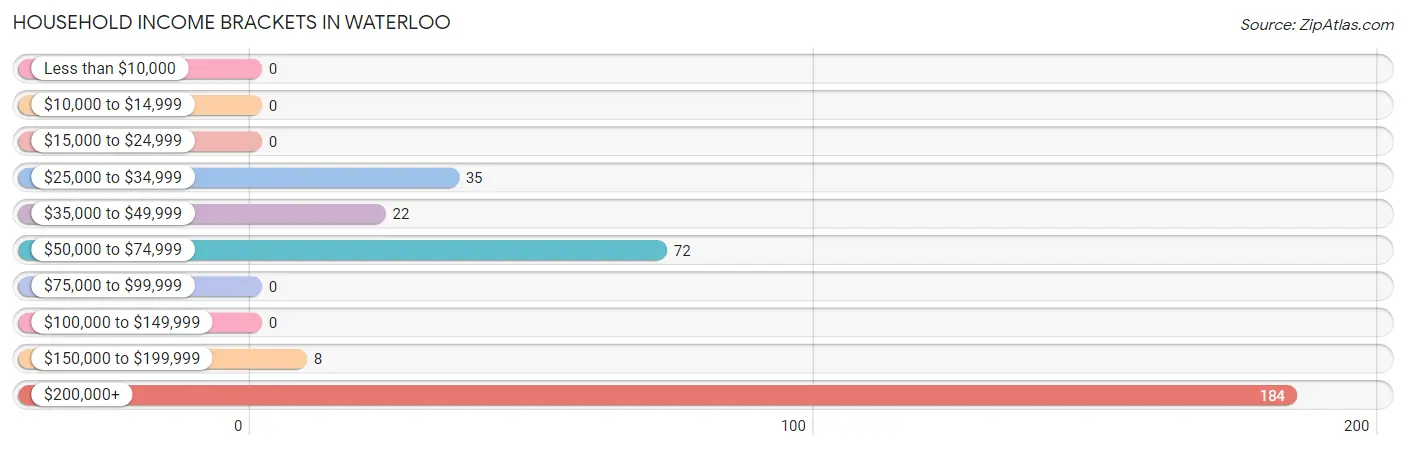
| Income Bracket | # Households | % Households |
| Less than $10,000 | 0 | 0.0% |
| $10,000 to $14,999 | 0 | 0.0% |
| $15,000 to $24,999 | 0 | 0.0% |
| $25,000 to $34,999 | 35 | 10.9% |
| $35,000 to $49,999 | 22 | 6.9% |
| $50,000 to $74,999 | 72 | 22.4% |
| $75,000 to $99,999 | 0 | 0.0% |
| $100,000 to $149,999 | 0 | 0.0% |
| $150,000 to $199,999 | 8 | 2.5% |
| $200,000+ | 184 | 57.3% |
Household Income by Householder Age in Waterloo
The median household income in Waterloo is $250,001, with the highest median household income of $250,001 found in the 45 to 64 years age bracket for the primary householder. A total of 157 households (48.9%) fall into this category.
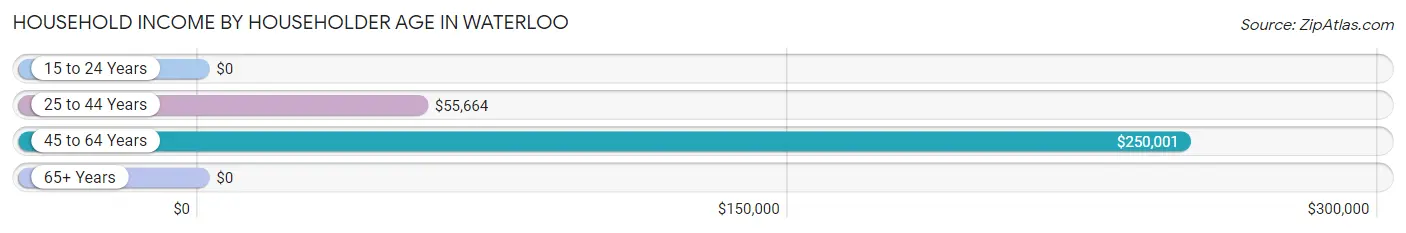
| Income Bracket | # Households | Median Income |
| 15 to 24 Years | 0 (0.0%) | $0 |
| 25 to 44 Years | 114 (35.5%) | $55,664 |
| 45 to 64 Years | 157 (48.9%) | $250,001 |
| 65+ Years | 50 (15.6%) | $0 |
| Total | 321 (100.0%) | $250,001 |
Poverty in Waterloo
Income Below Poverty by Sex and Age in Waterloo
With 10.7% poverty level for males and 3.8% for females among the residents of Waterloo, under 5 year old males and 35 to 44 year old females are the most vulnerable to poverty, with 12 males (100.0%) and 17 females (65.4%) in their respective age groups living below the poverty level.
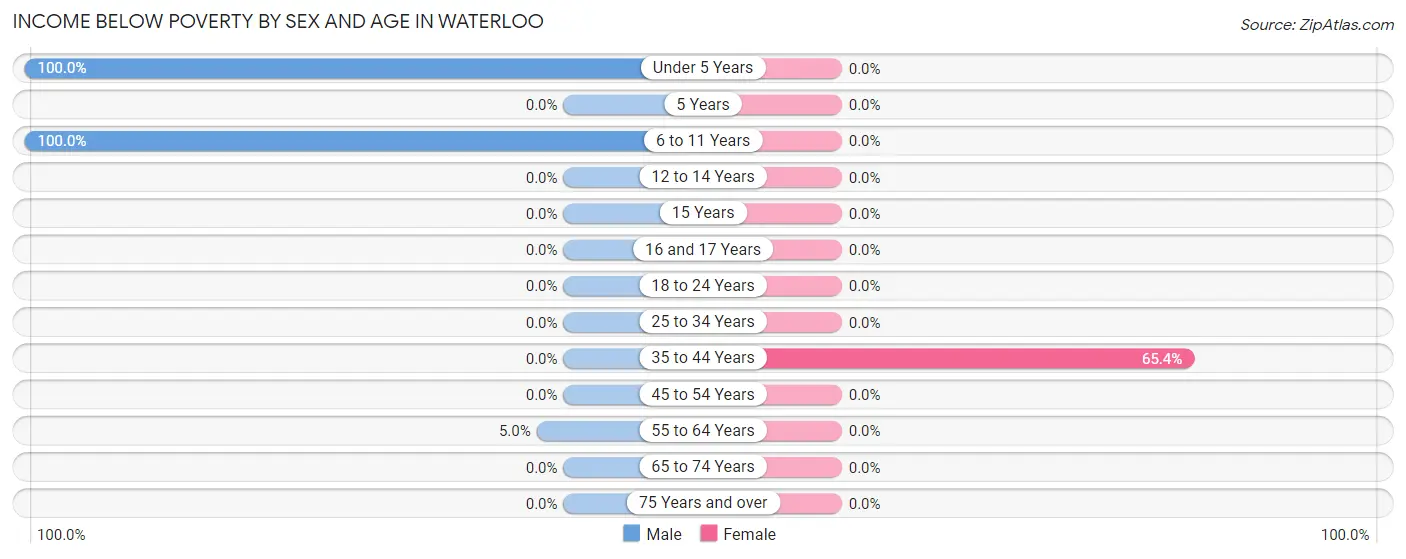
| Age Bracket | Male | Female |
| Under 5 Years | 12 (100.0%) | 0 (0.0%) |
| 5 Years | 0 (0.0%) | 0 (0.0%) |
| 6 to 11 Years | 21 (100.0%) | 0 (0.0%) |
| 12 to 14 Years | 0 (0.0%) | 0 (0.0%) |
| 15 Years | 0 (0.0%) | 0 (0.0%) |
| 16 and 17 Years | 0 (0.0%) | 0 (0.0%) |
| 18 to 24 Years | 0 (0.0%) | 0 (0.0%) |
| 25 to 34 Years | 0 (0.0%) | 0 (0.0%) |
| 35 to 44 Years | 0 (0.0%) | 17 (65.4%) |
| 45 to 54 Years | 0 (0.0%) | 0 (0.0%) |
| 55 to 64 Years | 9 (5.0%) | 0 (0.0%) |
| 65 to 74 Years | 0 (0.0%) | 0 (0.0%) |
| 75 Years and over | 0 (0.0%) | 0 (0.0%) |
| Total | 42 (10.7%) | 17 (3.8%) |
Income Above Poverty by Sex and Age in Waterloo
According to the poverty statistics in Waterloo, males aged 15 years and females aged under 5 years are the age groups that are most secure financially, with 100.0% of males and 100.0% of females in these age groups living above the poverty line.
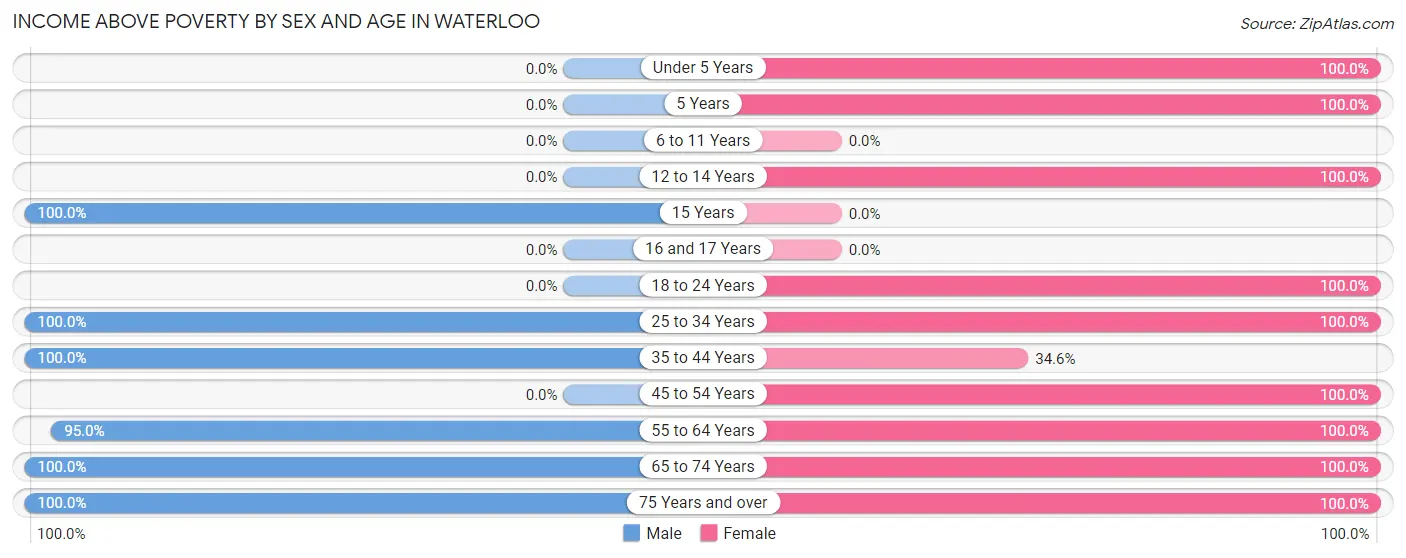
| Age Bracket | Male | Female |
| Under 5 Years | 0 (0.0%) | 47 (100.0%) |
| 5 Years | 0 (0.0%) | 14 (100.0%) |
| 6 to 11 Years | 0 (0.0%) | 0 (0.0%) |
| 12 to 14 Years | 0 (0.0%) | 14 (100.0%) |
| 15 Years | 12 (100.0%) | 0 (0.0%) |
| 16 and 17 Years | 0 (0.0%) | 0 (0.0%) |
| 18 to 24 Years | 0 (0.0%) | 126 (100.0%) |
| 25 to 34 Years | 78 (100.0%) | 21 (100.0%) |
| 35 to 44 Years | 40 (100.0%) | 9 (34.6%) |
| 45 to 54 Years | 0 (0.0%) | 45 (100.0%) |
| 55 to 64 Years | 172 (95.0%) | 76 (100.0%) |
| 65 to 74 Years | 36 (100.0%) | 41 (100.0%) |
| 75 Years and over | 14 (100.0%) | 36 (100.0%) |
| Total | 352 (89.3%) | 429 (96.2%) |
Income Below Poverty Among Married-Couple Families in Waterloo
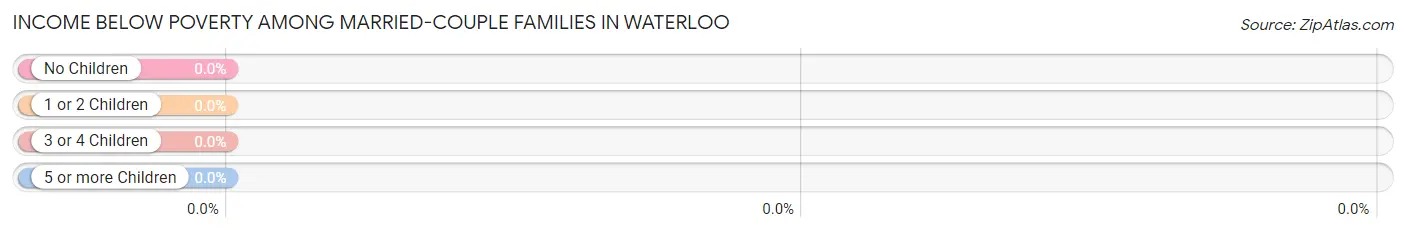
| Children | Above Poverty | Below Poverty |
| No Children | 206 (100.0%) | 0 (0.0%) |
| 1 or 2 Children | 0 (0.0%) | 0 (0.0%) |
| 3 or 4 Children | 9 (100.0%) | 0 (0.0%) |
| 5 or more Children | 0 (0.0%) | 0 (0.0%) |
| Total | 215 (100.0%) | 0 (0.0%) |
Income Below Poverty Among Single-Parent Households in Waterloo
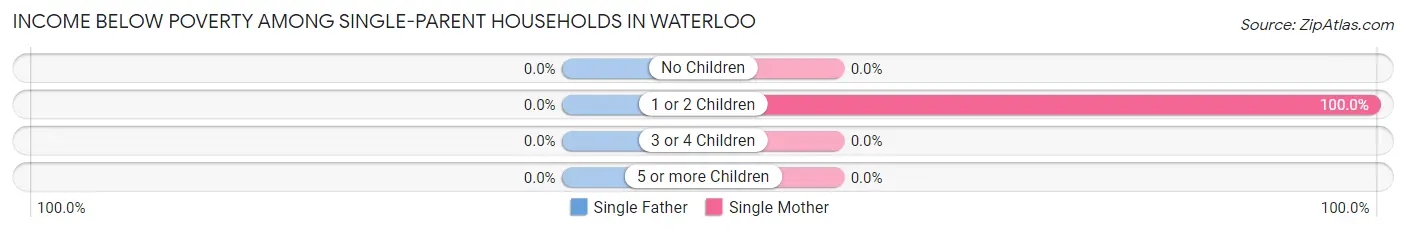
| Children | Single Father | Single Mother |
| No Children | 0 (0.0%) | 0 (0.0%) |
| 1 or 2 Children | 0 (0.0%) | 17 (100.0%) |
| 3 or 4 Children | 0 (0.0%) | 0 (0.0%) |
| 5 or more Children | 0 (0.0%) | 0 (0.0%) |
| Total | 0 (0.0%) | 17 (100.0%) |
Income Below Poverty Among Married-Couple vs Single-Parent Households in Waterloo
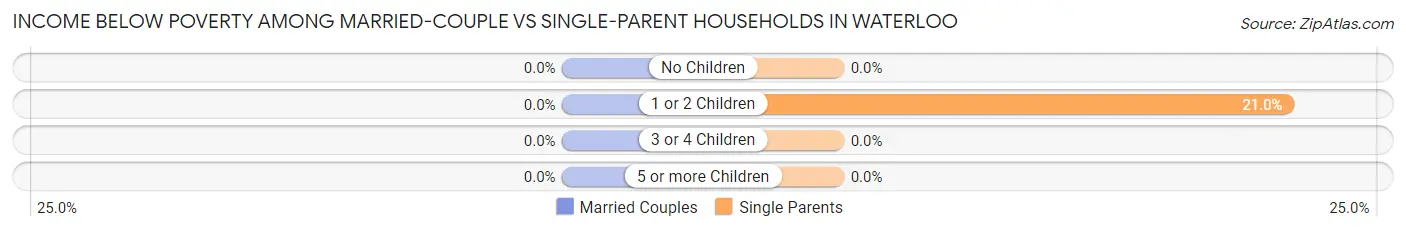
| Children | Married-Couple Families | Single-Parent Households |
| No Children | 0 (0.0%) | 0 (0.0%) |
| 1 or 2 Children | 0 (0.0%) | 17 (21.0%) |
| 3 or 4 Children | 0 (0.0%) | 0 (0.0%) |
| 5 or more Children | 0 (0.0%) | 0 (0.0%) |
| Total | 0 (0.0%) | 17 (21.0%) |
Race in Waterloo
The most populous races in Waterloo are White / Caucasian (718 | 85.5%), Two or more Races (96 | 11.4%), and Hispanic or Latino (88 | 10.5%).
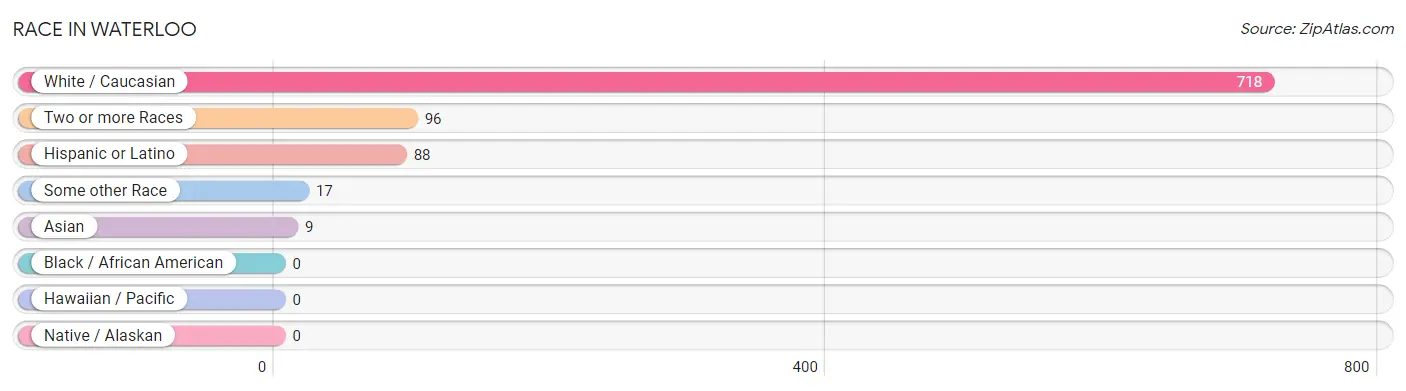
| Race | # Population | % Population |
| Asian | 9 | 1.1% |
| Black / African American | 0 | 0.0% |
| Hawaiian / Pacific | 0 | 0.0% |
| Hispanic or Latino | 88 | 10.5% |
| Native / Alaskan | 0 | 0.0% |
| White / Caucasian | 718 | 85.5% |
| Two or more Races | 96 | 11.4% |
| Some other Race | 17 | 2.0% |
| Total | 840 | 100.0% |
Ancestry in Waterloo
The most populous ancestries reported in Waterloo are German (270 | 32.1%), English (251 | 29.9%), Italian (120 | 14.3%), French (86 | 10.2%), and Mexican (79 | 9.4%), together accounting for 96.0% of all Waterloo residents.
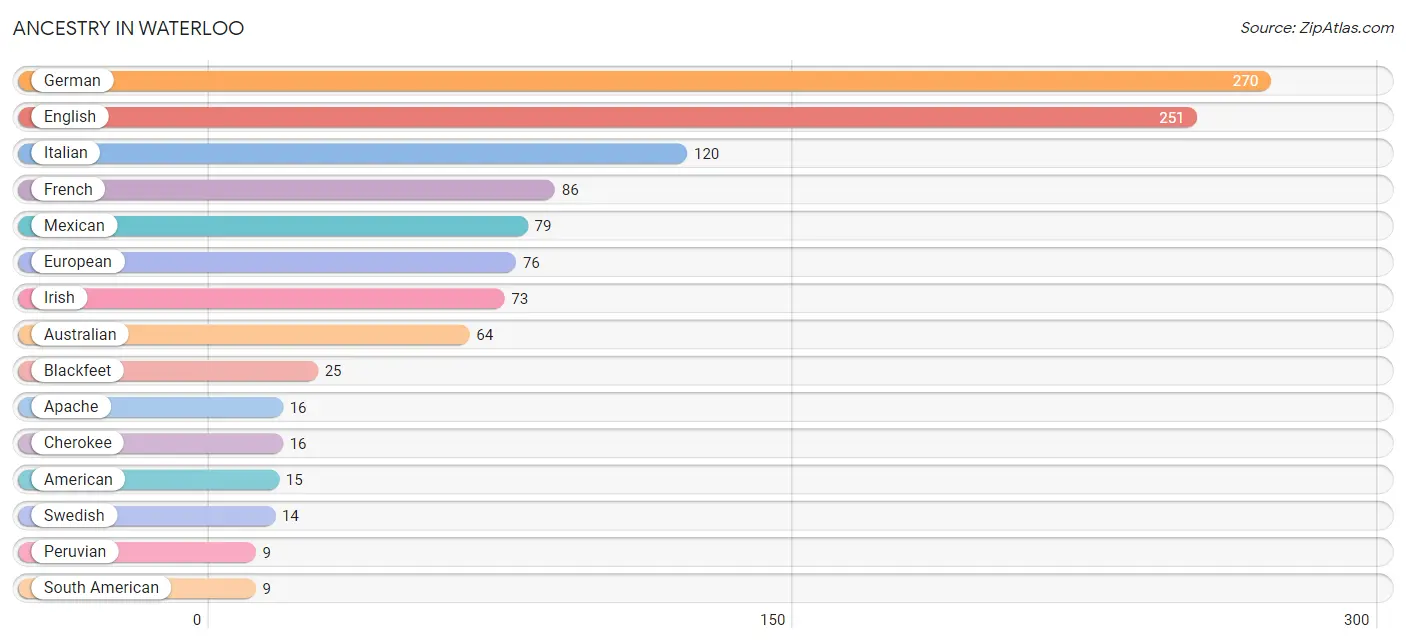
| Ancestry | # Population | % Population |
| American | 15 | 1.8% |
| Apache | 16 | 1.9% |
| Australian | 64 | 7.6% |
| Blackfeet | 25 | 3.0% |
| Cherokee | 16 | 1.9% |
| English | 251 | 29.9% |
| European | 76 | 9.0% |
| French | 86 | 10.2% |
| German | 270 | 32.1% |
| Irish | 73 | 8.7% |
| Italian | 120 | 14.3% |
| Mexican | 79 | 9.4% |
| Northern European | 6 | 0.7% |
| Peruvian | 9 | 1.1% |
| South American | 9 | 1.1% |
| Swedish | 14 | 1.7% |
| Thai | 9 | 1.1% |
| Ukrainian | 7 | 0.8% | View All 18 Rows |
Immigrants in Waterloo
The most numerous immigrant groups reported in Waterloo came from Latin America (47 | 5.6%), Central America (38 | 4.5%), Mexico (38 | 4.5%), Asia (9 | 1.1%), and Eastern Asia (9 | 1.1%), together accounting for 16.8% of all Waterloo residents.
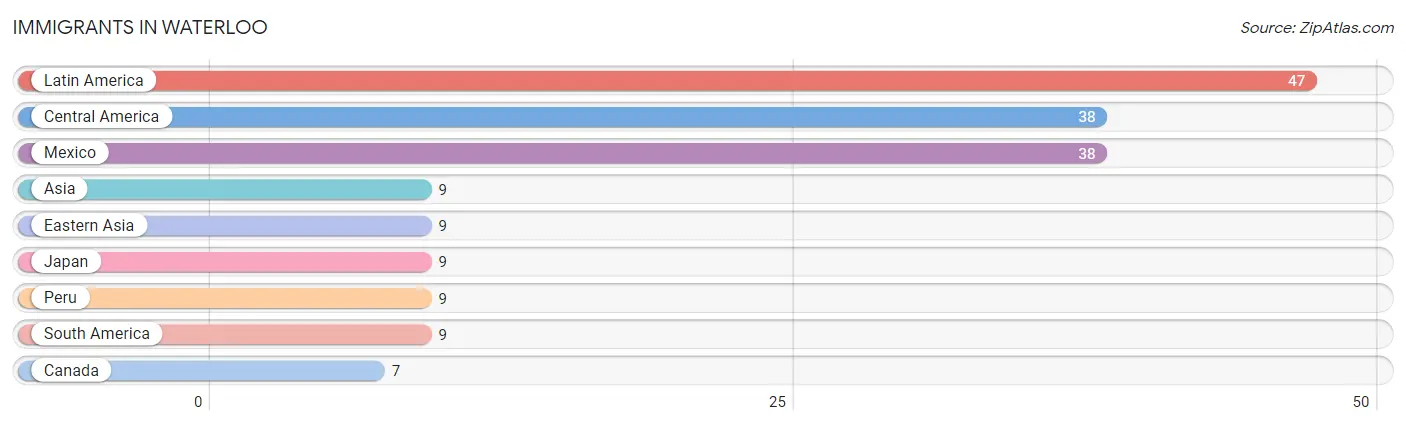
| Immigration Origin | # Population | % Population |
| Asia | 9 | 1.1% |
| Canada | 7 | 0.8% |
| Central America | 38 | 4.5% |
| Eastern Asia | 9 | 1.1% |
| Japan | 9 | 1.1% |
| Latin America | 47 | 5.6% |
| Mexico | 38 | 4.5% |
| Peru | 9 | 1.1% |
| South America | 9 | 1.1% | View All 9 Rows |
Sex and Age in Waterloo
Sex and Age in Waterloo
The most populous age groups in Waterloo are 60 to 64 Years (118 | 29.9%) for men and 15 to 19 Years (75 | 16.8%) for women.
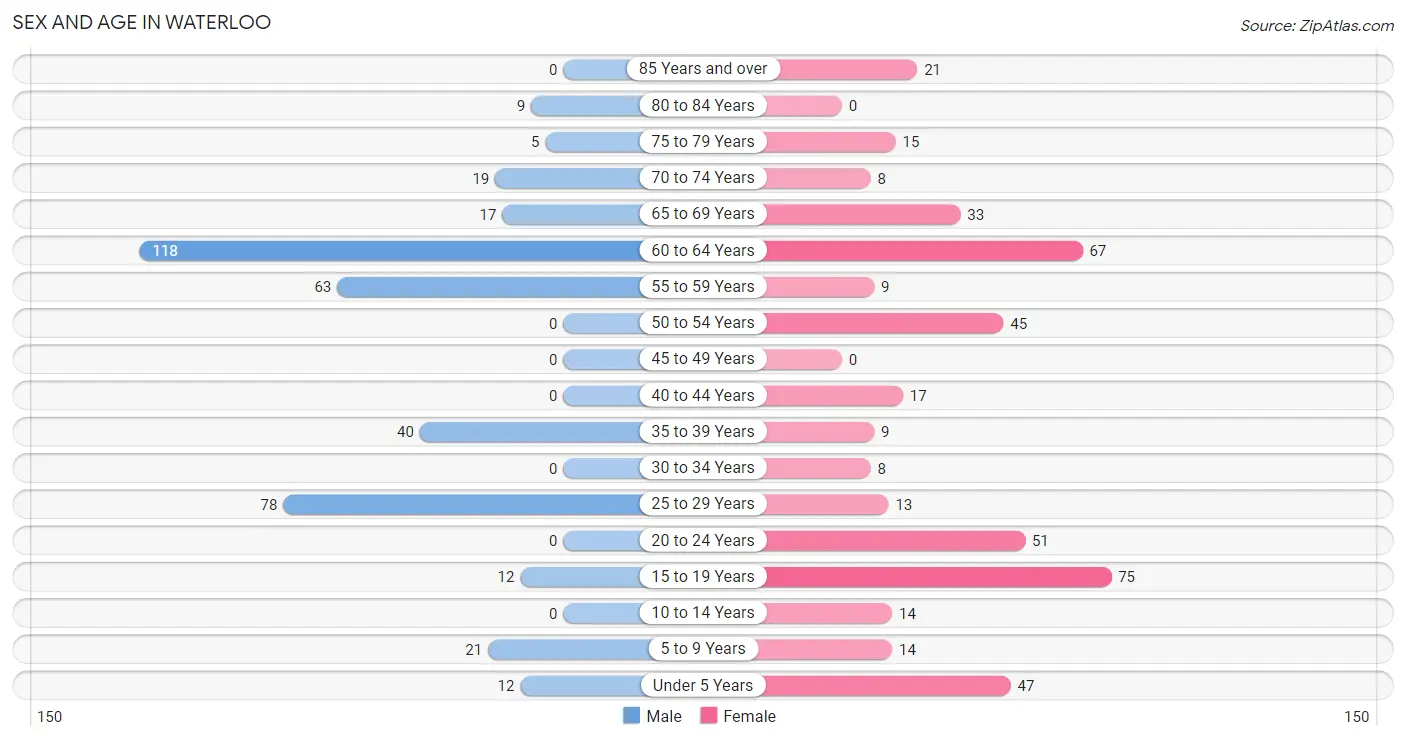
| Age Bracket | Male | Female |
| Under 5 Years | 12 (3.0%) | 47 (10.5%) |
| 5 to 9 Years | 21 (5.3%) | 14 (3.1%) |
| 10 to 14 Years | 0 (0.0%) | 14 (3.1%) |
| 15 to 19 Years | 12 (3.0%) | 75 (16.8%) |
| 20 to 24 Years | 0 (0.0%) | 51 (11.4%) |
| 25 to 29 Years | 78 (19.8%) | 13 (2.9%) |
| 30 to 34 Years | 0 (0.0%) | 8 (1.8%) |
| 35 to 39 Years | 40 (10.2%) | 9 (2.0%) |
| 40 to 44 Years | 0 (0.0%) | 17 (3.8%) |
| 45 to 49 Years | 0 (0.0%) | 0 (0.0%) |
| 50 to 54 Years | 0 (0.0%) | 45 (10.1%) |
| 55 to 59 Years | 63 (16.0%) | 9 (2.0%) |
| 60 to 64 Years | 118 (29.9%) | 67 (15.0%) |
| 65 to 69 Years | 17 (4.3%) | 33 (7.4%) |
| 70 to 74 Years | 19 (4.8%) | 8 (1.8%) |
| 75 to 79 Years | 5 (1.3%) | 15 (3.4%) |
| 80 to 84 Years | 9 (2.3%) | 0 (0.0%) |
| 85 Years and over | 0 (0.0%) | 21 (4.7%) |
| Total | 394 (100.0%) | 446 (100.0%) |
Families and Households in Waterloo
Median Family Size in Waterloo
The median family size in Waterloo is 2.65 persons per family, with single female/mother families (17 | 5.7%) accounting for the largest median family size of 2.94 persons per family. On the other hand, married-couple families (215 | 72.6%) represent the smallest median family size with 2.55 persons per family.
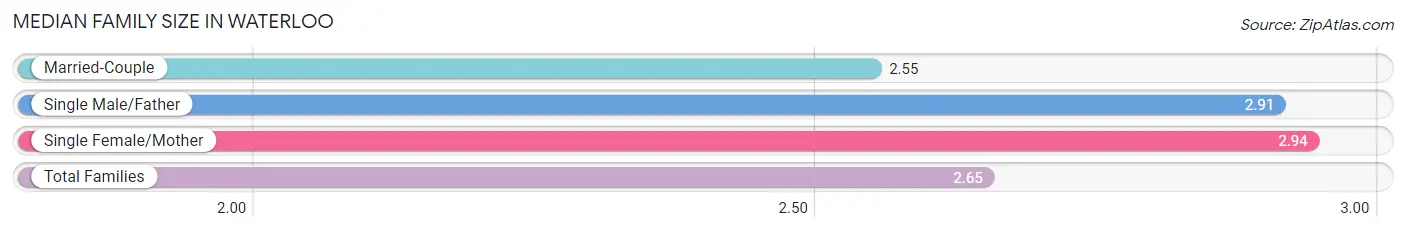
| Family Type | # Families | Family Size |
| Married-Couple | 215 (72.6%) | 2.55 |
| Single Male/Father | 64 (21.6%) | 2.91 |
| Single Female/Mother | 17 (5.7%) | 2.94 |
| Total Families | 296 (100.0%) | 2.65 |
Median Household Size in Waterloo
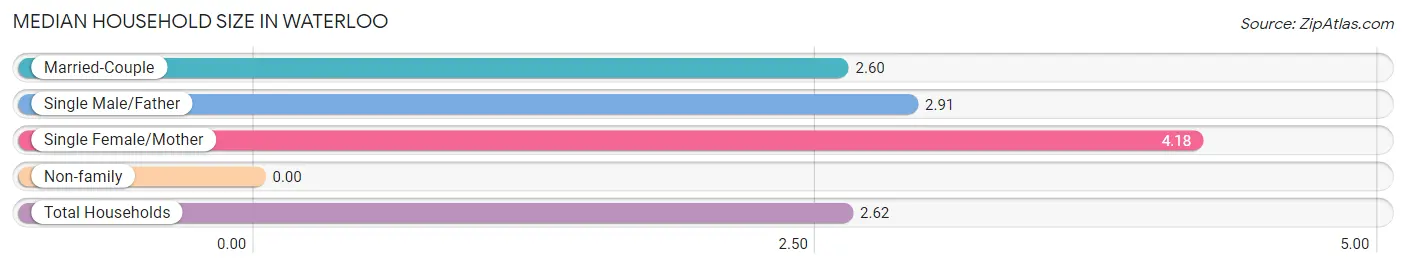
| Household Type | # Households | Household Size |
| Married-Couple | 215 (67.0%) | 2.60 |
| Single Male/Father | 64 (19.9%) | 2.91 |
| Single Female/Mother | 17 (5.3%) | 4.18 |
| Non-family | 25 (7.8%) | - |
| Total Households | 321 (100.0%) | 2.62 |
Household Size by Marriage Status in Waterloo
Out of a total of 321 households in Waterloo, 296 (92.2%) are family households, while 25 (7.8%) are nonfamily households. The most numerous type of family households are 3-person households, comprising 140, and the most common type of nonfamily households are 1-person households, comprising 25.
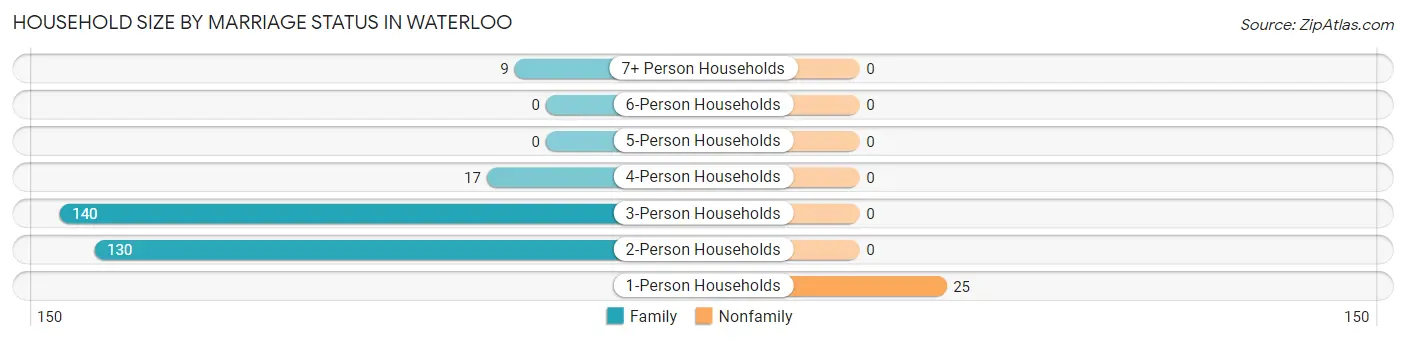
| Household Size | Family Households | Nonfamily Households |
| 1-Person Households | - | 25 (7.8%) |
| 2-Person Households | 130 (40.5%) | 0 (0.0%) |
| 3-Person Households | 140 (43.6%) | 0 (0.0%) |
| 4-Person Households | 17 (5.3%) | 0 (0.0%) |
| 5-Person Households | 0 (0.0%) | 0 (0.0%) |
| 6-Person Households | 0 (0.0%) | 0 (0.0%) |
| 7+ Person Households | 9 (2.8%) | 0 (0.0%) |
| Total | 296 (92.2%) | 25 (7.8%) |
Female Fertility in Waterloo
Fertility by Age in Waterloo
| Age Bracket | Women with Births | Births / 1,000 Women |
| 15 to 19 years | 0 (0.0%) | 0.0 |
| 20 to 34 years | 0 (0.0%) | 0.0 |
| 35 to 50 years | 0 (0.0%) | 0.0 |
| Total | 0 (0.0%) | 0.0 |
Fertility by Age by Marriage Status in Waterloo
| Age Bracket | Married | Unmarried |
| 15 to 19 years | 0 (0.0%) | 0 (0.0%) |
| 20 to 34 years | 0 (0.0%) | 0 (0.0%) |
| 35 to 50 years | 0 (0.0%) | 0 (0.0%) |
| Total | 0 (0.0%) | 0 (0.0%) |
Fertility by Education in Waterloo
| Educational Attainment | Women with Births | Births / 1,000 Women |
| Less than High School | 0 (0.0%) | 0.0 |
| High School Diploma | 0 (0.0%) | 0.0 |
| College or Associate's Degree | 0 (0.0%) | 0.0 |
| Bachelor's Degree | 0 (0.0%) | 0.0 |
| Graduate Degree | 0 (0.0%) | 0.0 |
| Total | 0 (0.0%) | 0.0 |
Fertility by Education by Marriage Status in Waterloo
| Educational Attainment | Married | Unmarried |
| Less than High School | 0 (0.0%) | 0 (0.0%) |
| High School Diploma | 0 (0.0%) | 0 (0.0%) |
| College or Associate's Degree | 0 (0.0%) | 0 (0.0%) |
| Bachelor's Degree | 0 (0.0%) | 0 (0.0%) |
| Graduate Degree | 0 (0.0%) | 0 (0.0%) |
| Total | 0 (0.0%) | 0 (0.0%) |
Employment Characteristics in Waterloo
Employment by Class of Employer in Waterloo
Among the 559 employed individuals in Waterloo, private company employees (393 | 70.3%), self-employed (not incorporated) (106 | 19.0%), and local government employees (38 | 6.8%) make up the most common classes of employment.
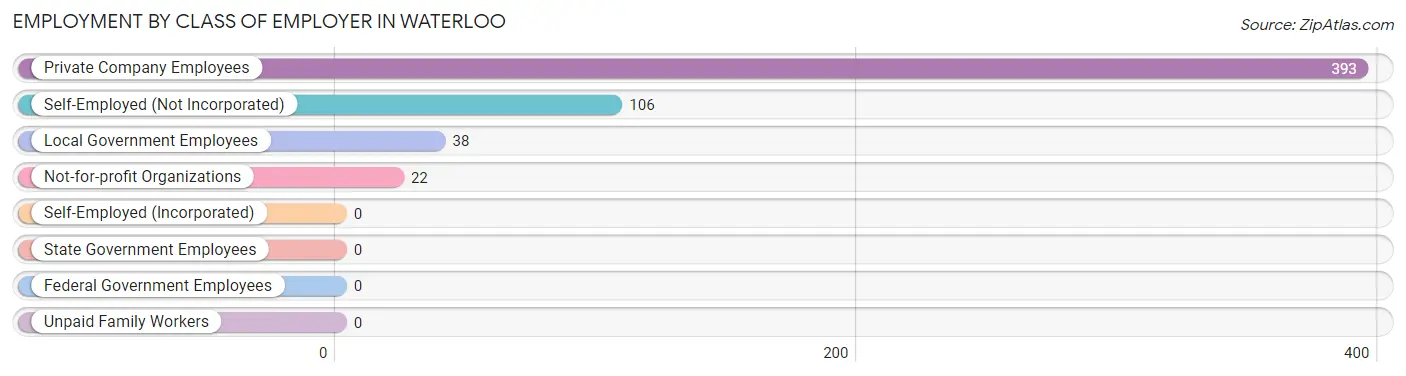
| Employer Class | # Employees | % Employees |
| Private Company Employees | 393 | 70.3% |
| Self-Employed (Incorporated) | 0 | 0.0% |
| Self-Employed (Not Incorporated) | 106 | 19.0% |
| Not-for-profit Organizations | 22 | 3.9% |
| Local Government Employees | 38 | 6.8% |
| State Government Employees | 0 | 0.0% |
| Federal Government Employees | 0 | 0.0% |
| Unpaid Family Workers | 0 | 0.0% |
| Total | 559 | 100.0% |
Employment Status by Age in Waterloo
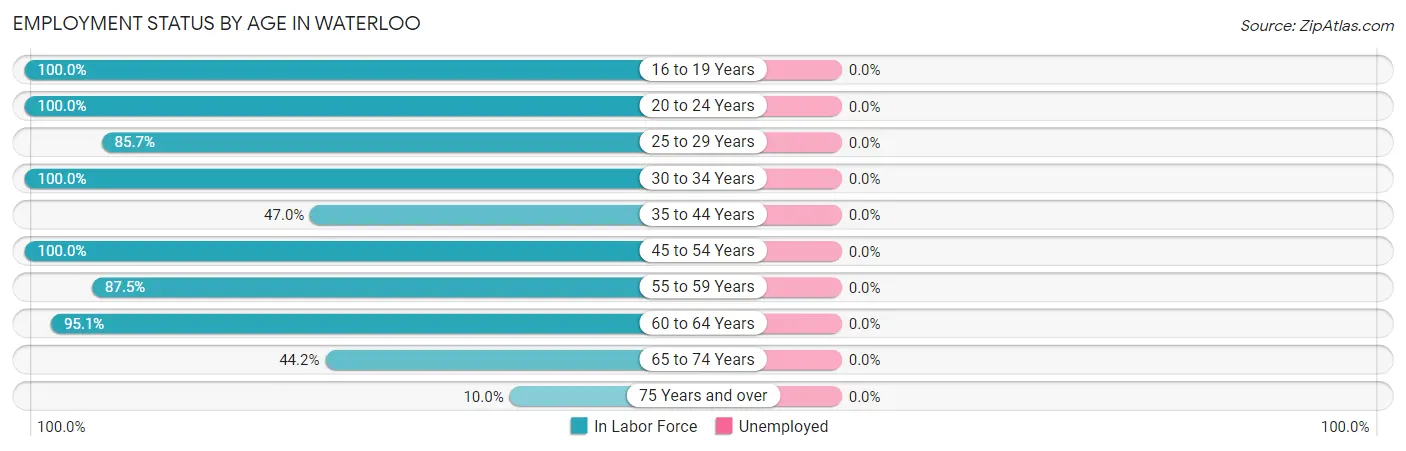
| Age Bracket | In Labor Force | Unemployed |
| 16 to 19 Years | 75 (100.0%) | 0 (0.0%) |
| 20 to 24 Years | 51 (100.0%) | 0 (0.0%) |
| 25 to 29 Years | 78 (85.7%) | 0 (0.0%) |
| 30 to 34 Years | 8 (100.0%) | 0 (0.0%) |
| 35 to 44 Years | 31 (47.0%) | 0 (0.0%) |
| 45 to 54 Years | 45 (100.0%) | 0 (0.0%) |
| 55 to 59 Years | 63 (87.5%) | 0 (0.0%) |
| 60 to 64 Years | 176 (95.1%) | 0 (0.0%) |
| 65 to 74 Years | 34 (44.2%) | 0 (0.0%) |
| 75 Years and over | 5 (10.0%) | 0 (0.0%) |
| Total | 566 (78.6%) | 0 (0.0%) |
Employment Status by Educational Attainment in Waterloo
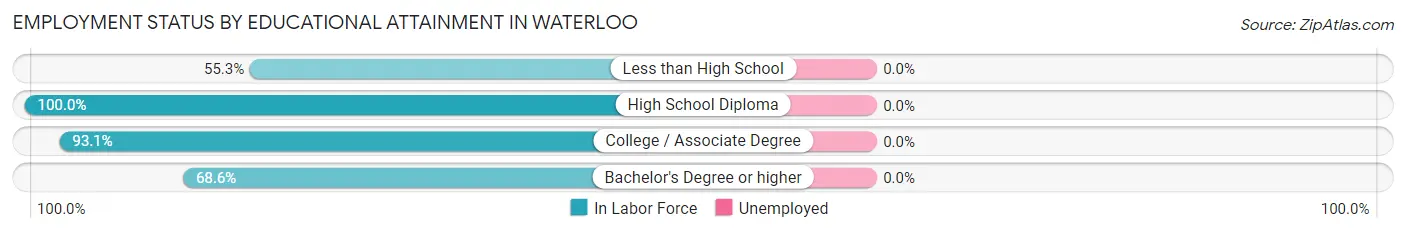
| Educational Attainment | In Labor Force | Unemployed |
| Less than High School | 21 (55.3%) | 0 (0.0%) |
| High School Diploma | 24 (100.0%) | 0 (0.0%) |
| College / Associate Degree | 297 (93.1%) | 0 (0.0%) |
| Bachelor's Degree or higher | 59 (68.6%) | 0 (0.0%) |
| Total | 401 (85.9%) | 0 (0.0%) |
Employment Occupations by Sex in Waterloo
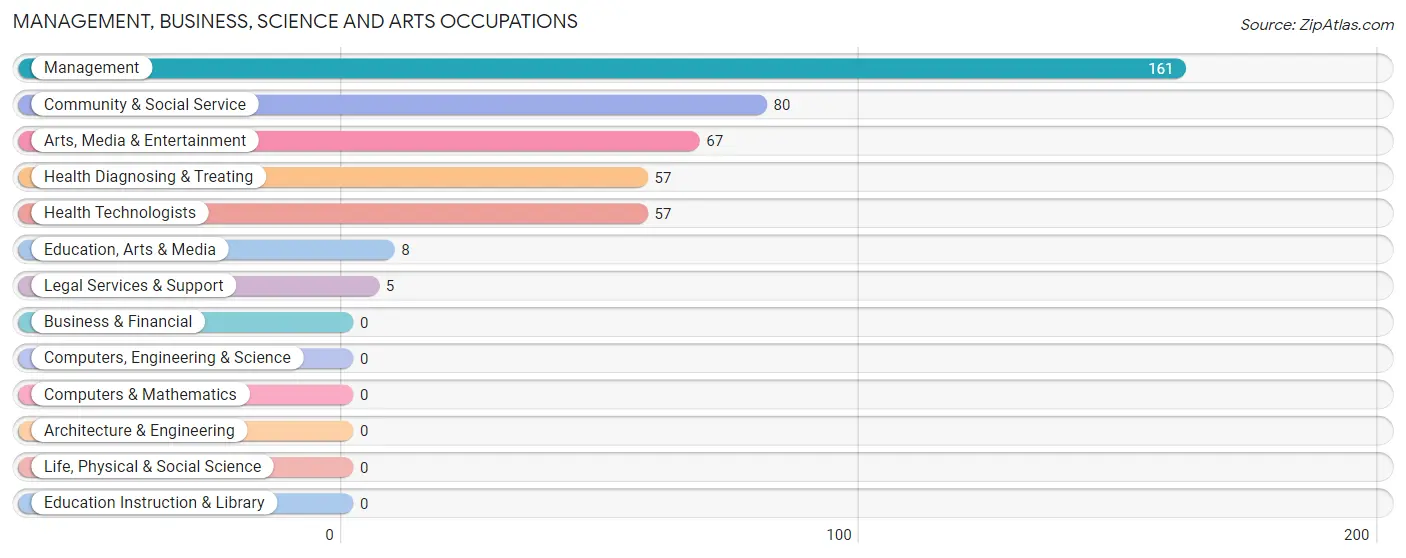
Management, Business, Science and Arts Occupations
The most common Management, Business, Science and Arts occupations in Waterloo are Management (161 | 28.4%), Community & Social Service (80 | 14.1%), Arts, Media & Entertainment (67 | 11.8%), Health Diagnosing & Treating (57 | 10.1%), and Health Technologists (57 | 10.1%).
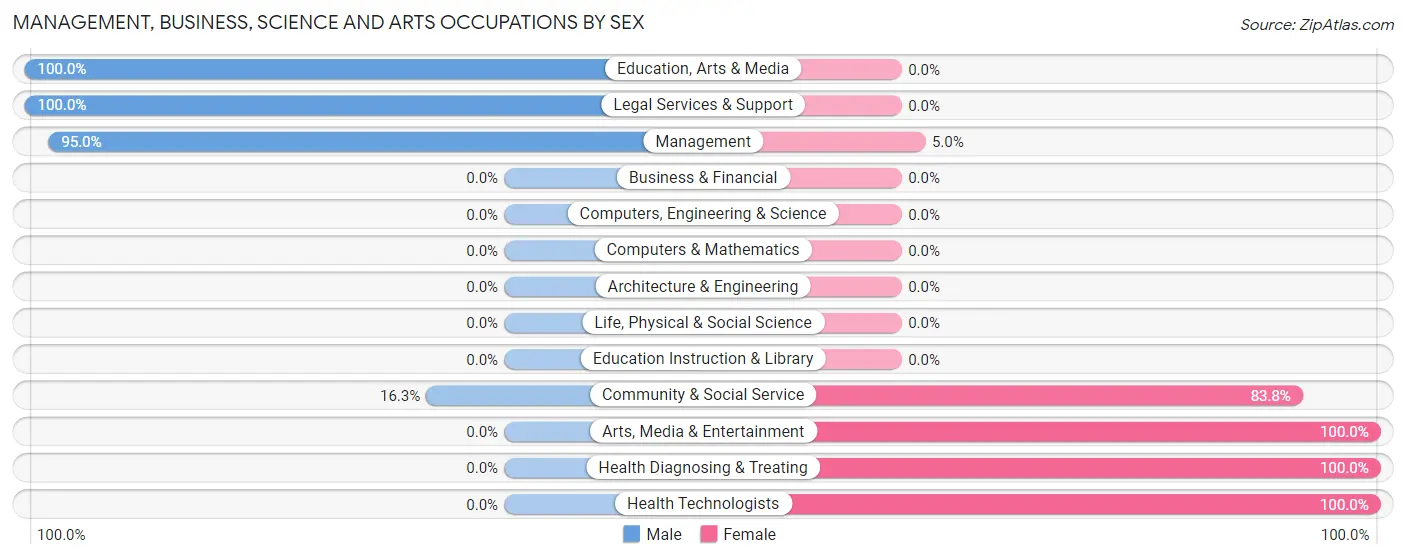
Management, Business, Science and Arts Occupations by Sex
Within the Management, Business, Science and Arts occupations in Waterloo, the most male-oriented occupations are Education, Arts & Media (100.0%), Legal Services & Support (100.0%), and Management (95.0%), while the most female-oriented occupations are Arts, Media & Entertainment (100.0%), Health Diagnosing & Treating (100.0%), and Health Technologists (100.0%).
| Occupation | Male | Female |
| Management | 153 (95.0%) | 8 (5.0%) |
| Business & Financial | 0 (0.0%) | 0 (0.0%) |
| Computers, Engineering & Science | 0 (0.0%) | 0 (0.0%) |
| Computers & Mathematics | 0 (0.0%) | 0 (0.0%) |
| Architecture & Engineering | 0 (0.0%) | 0 (0.0%) |
| Life, Physical & Social Science | 0 (0.0%) | 0 (0.0%) |
| Community & Social Service | 13 (16.3%) | 67 (83.8%) |
| Education, Arts & Media | 8 (100.0%) | 0 (0.0%) |
| Legal Services & Support | 5 (100.0%) | 0 (0.0%) |
| Education Instruction & Library | 0 (0.0%) | 0 (0.0%) |
| Arts, Media & Entertainment | 0 (0.0%) | 67 (100.0%) |
| Health Diagnosing & Treating | 0 (0.0%) | 57 (100.0%) |
| Health Technologists | 0 (0.0%) | 57 (100.0%) |
| Total (Category) | 166 (55.7%) | 132 (44.3%) |
| Total (Overall) | 286 (50.5%) | 280 (49.5%) |
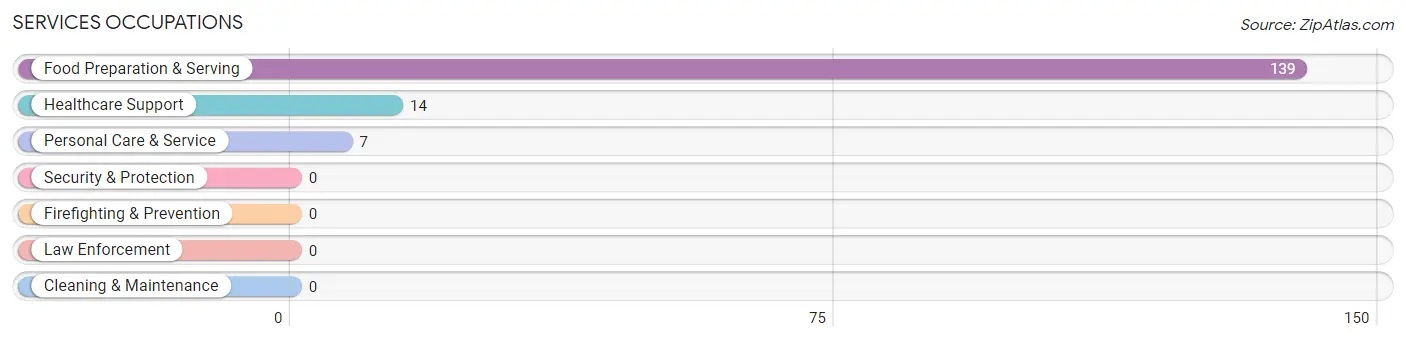
Services Occupations
The most common Services occupations in Waterloo are Food Preparation & Serving (139 | 24.6%), Healthcare Support (14 | 2.5%), and Personal Care & Service (7 | 1.2%).
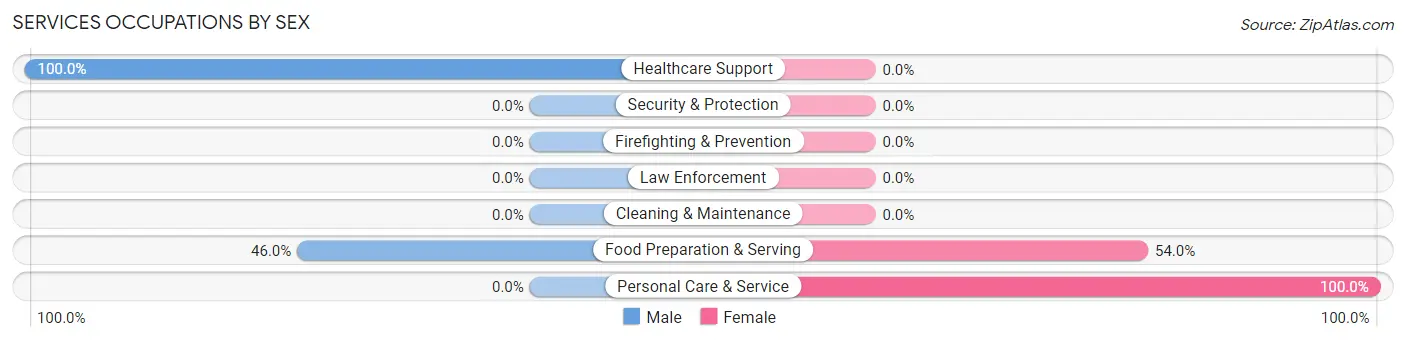
Services Occupations by Sex
Within the Services occupations in Waterloo, the most male-oriented occupations are Healthcare Support (100.0%), and Food Preparation & Serving (46.0%), while the most female-oriented occupations are Personal Care & Service (100.0%), and Food Preparation & Serving (54.0%).
| Occupation | Male | Female |
| Healthcare Support | 14 (100.0%) | 0 (0.0%) |
| Security & Protection | 0 (0.0%) | 0 (0.0%) |
| Firefighting & Prevention | 0 (0.0%) | 0 (0.0%) |
| Law Enforcement | 0 (0.0%) | 0 (0.0%) |
| Food Preparation & Serving | 64 (46.0%) | 75 (54.0%) |
| Cleaning & Maintenance | 0 (0.0%) | 0 (0.0%) |
| Personal Care & Service | 0 (0.0%) | 7 (100.0%) |
| Total (Category) | 78 (48.7%) | 82 (51.2%) |
| Total (Overall) | 286 (50.5%) | 280 (49.5%) |
Sales and Office Occupations
The most common Sales and Office occupations in Waterloo are Office & Administration (39 | 6.9%), and Sales & Related (8 | 1.4%).
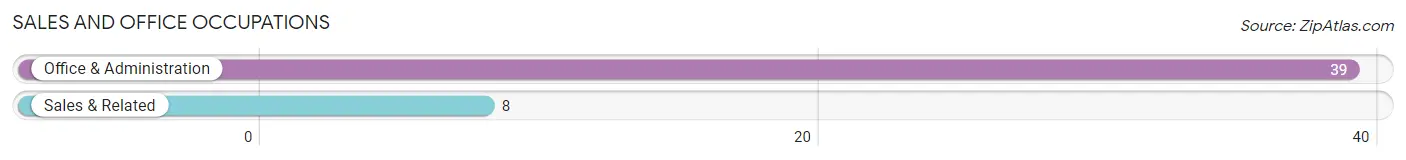
Sales and Office Occupations by Sex

| Occupation | Male | Female |
| Sales & Related | 8 (100.0%) | 0 (0.0%) |
| Office & Administration | 24 (61.5%) | 15 (38.5%) |
| Total (Category) | 32 (68.1%) | 15 (31.9%) |
| Total (Overall) | 286 (50.5%) | 280 (49.5%) |
Natural Resources, Construction and Maintenance Occupations
The most common Natural Resources, Construction and Maintenance occupations in Waterloo are , and Construction & Extraction (10 | 1.8%).
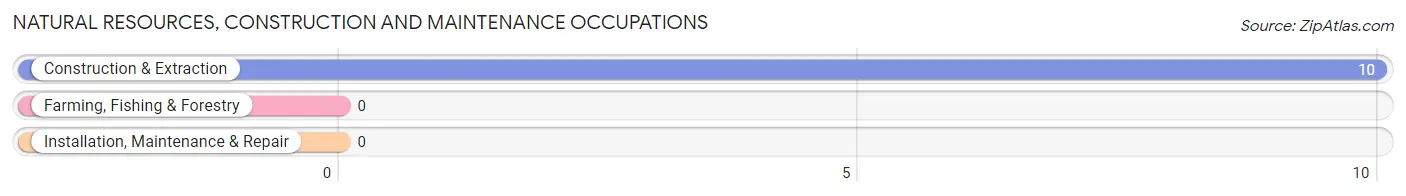
Natural Resources, Construction and Maintenance Occupations by Sex
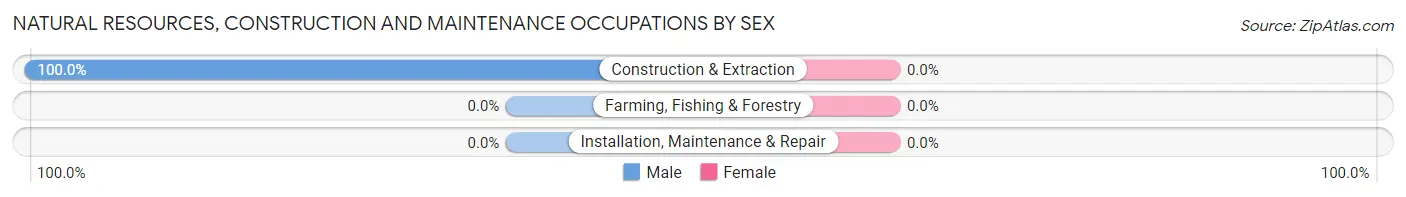
| Occupation | Male | Female |
| Farming, Fishing & Forestry | 0 (0.0%) | 0 (0.0%) |
| Construction & Extraction | 10 (100.0%) | 0 (0.0%) |
| Installation, Maintenance & Repair | 0 (0.0%) | 0 (0.0%) |
| Total (Category) | 10 (100.0%) | 0 (0.0%) |
| Total (Overall) | 286 (50.5%) | 280 (49.5%) |
Production, Transportation and Moving Occupations
The most common Production, Transportation and Moving occupations in Waterloo are , and Production (51 | 9.0%).
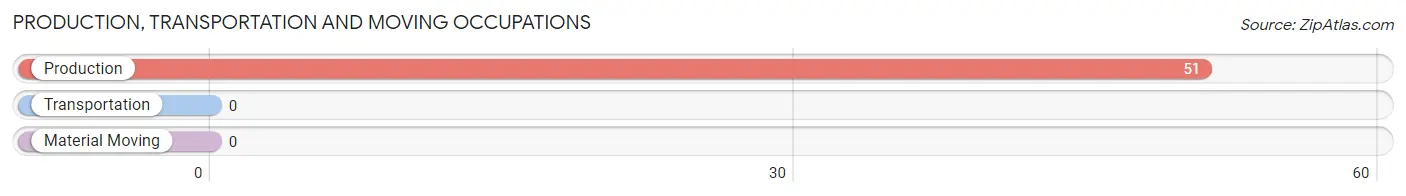
Production, Transportation and Moving Occupations by Sex
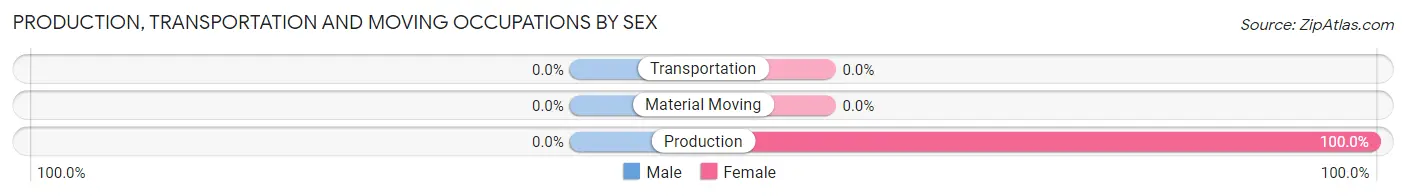
| Occupation | Male | Female |
| Production | 0 (0.0%) | 51 (100.0%) |
| Transportation | 0 (0.0%) | 0 (0.0%) |
| Material Moving | 0 (0.0%) | 0 (0.0%) |
| Total (Category) | 0 (0.0%) | 51 (100.0%) |
| Total (Overall) | 286 (50.5%) | 280 (49.5%) |
Employment Industries by Sex in Waterloo
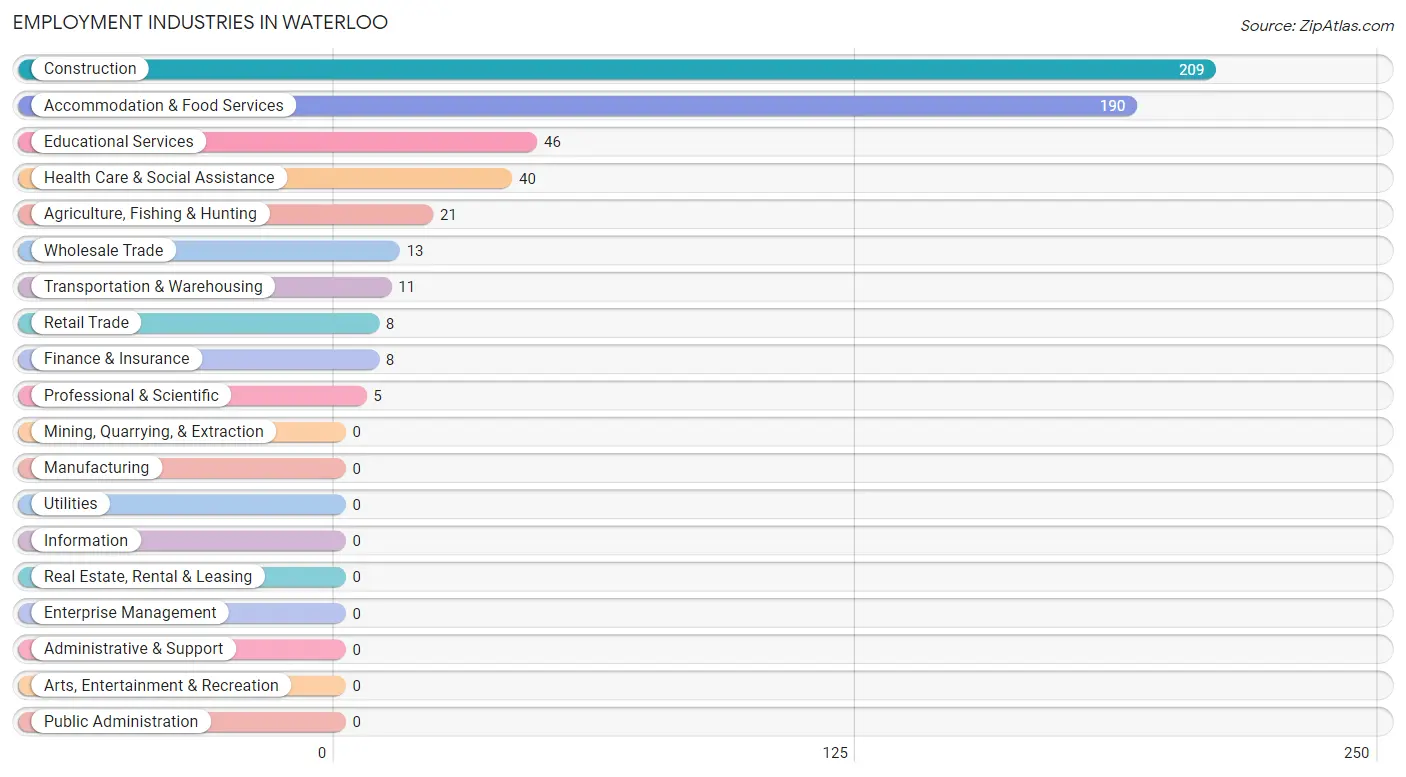
Employment Industries in Waterloo
The major employment industries in Waterloo include Construction (209 | 36.9%), Accommodation & Food Services (190 | 33.6%), Educational Services (46 | 8.1%), Health Care & Social Assistance (40 | 7.1%), and Agriculture, Fishing & Hunting (21 | 3.7%).
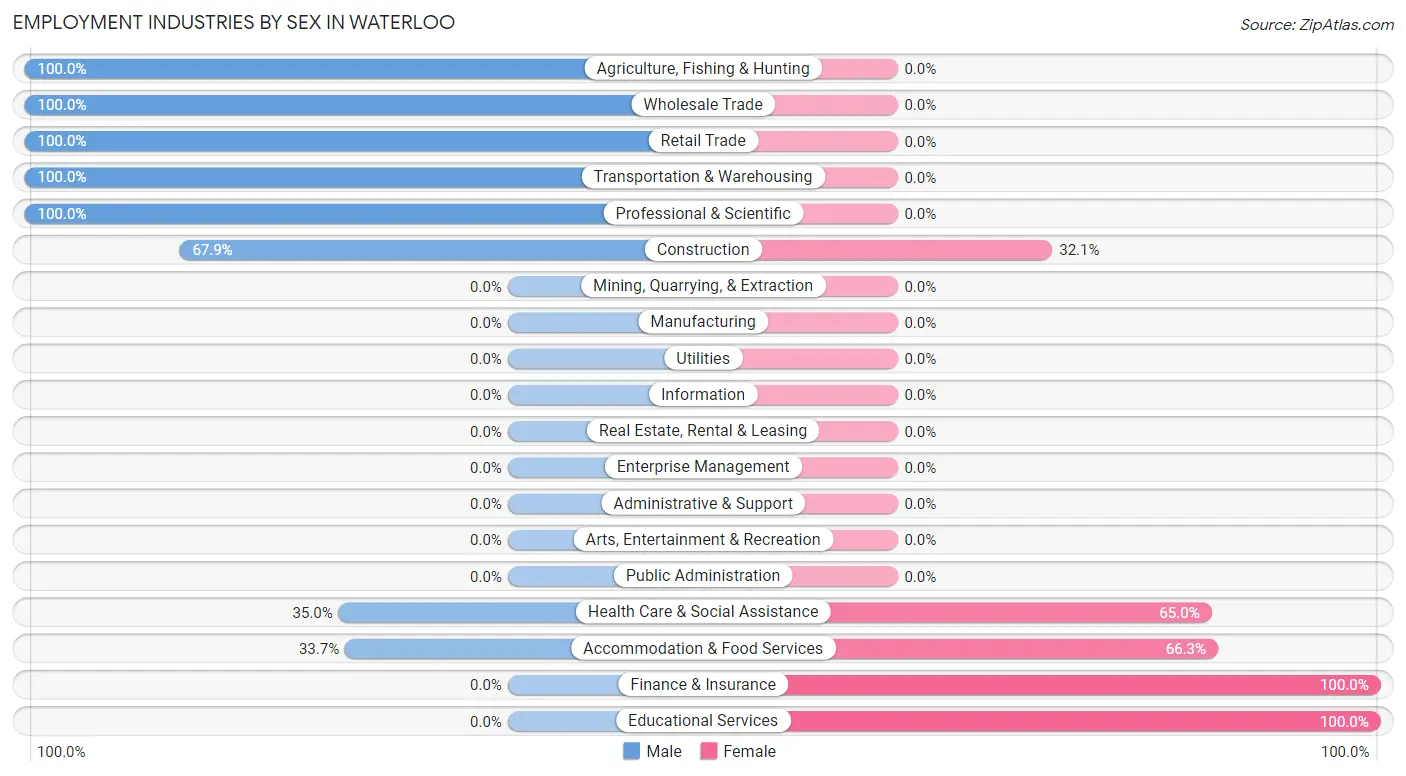
Employment Industries by Sex in Waterloo
The Waterloo industries that see more men than women are Agriculture, Fishing & Hunting (100.0%), Wholesale Trade (100.0%), and Retail Trade (100.0%), whereas the industries that tend to have a higher number of women are Finance & Insurance (100.0%), Educational Services (100.0%), and Accommodation & Food Services (66.3%).
| Industry | Male | Female |
| Agriculture, Fishing & Hunting | 21 (100.0%) | 0 (0.0%) |
| Mining, Quarrying, & Extraction | 0 (0.0%) | 0 (0.0%) |
| Construction | 142 (67.9%) | 67 (32.1%) |
| Manufacturing | 0 (0.0%) | 0 (0.0%) |
| Wholesale Trade | 13 (100.0%) | 0 (0.0%) |
| Retail Trade | 8 (100.0%) | 0 (0.0%) |
| Transportation & Warehousing | 11 (100.0%) | 0 (0.0%) |
| Utilities | 0 (0.0%) | 0 (0.0%) |
| Information | 0 (0.0%) | 0 (0.0%) |
| Finance & Insurance | 0 (0.0%) | 8 (100.0%) |
| Real Estate, Rental & Leasing | 0 (0.0%) | 0 (0.0%) |
| Professional & Scientific | 5 (100.0%) | 0 (0.0%) |
| Enterprise Management | 0 (0.0%) | 0 (0.0%) |
| Administrative & Support | 0 (0.0%) | 0 (0.0%) |
| Educational Services | 0 (0.0%) | 46 (100.0%) |
| Health Care & Social Assistance | 14 (35.0%) | 26 (65.0%) |
| Arts, Entertainment & Recreation | 0 (0.0%) | 0 (0.0%) |
| Accommodation & Food Services | 64 (33.7%) | 126 (66.3%) |
| Public Administration | 0 (0.0%) | 0 (0.0%) |
| Total | 286 (50.5%) | 280 (49.5%) |
Education in Waterloo
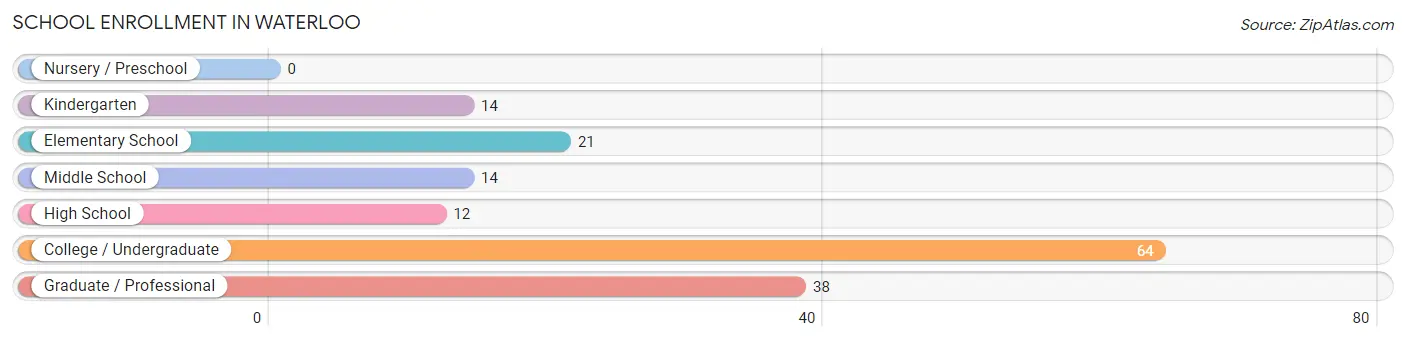
School Enrollment in Waterloo
The most common levels of schooling among the 163 students in Waterloo are college / undergraduate (64 | 39.3%), graduate / professional (38 | 23.3%), and elementary school (21 | 12.9%).
| School Level | # Students | % Students |
| Nursery / Preschool | 0 | 0.0% |
| Kindergarten | 14 | 8.6% |
| Elementary School | 21 | 12.9% |
| Middle School | 14 | 8.6% |
| High School | 12 | 7.4% |
| College / Undergraduate | 64 | 39.3% |
| Graduate / Professional | 38 | 23.3% |
| Total | 163 | 100.0% |
School Enrollment by Age by Funding Source in Waterloo
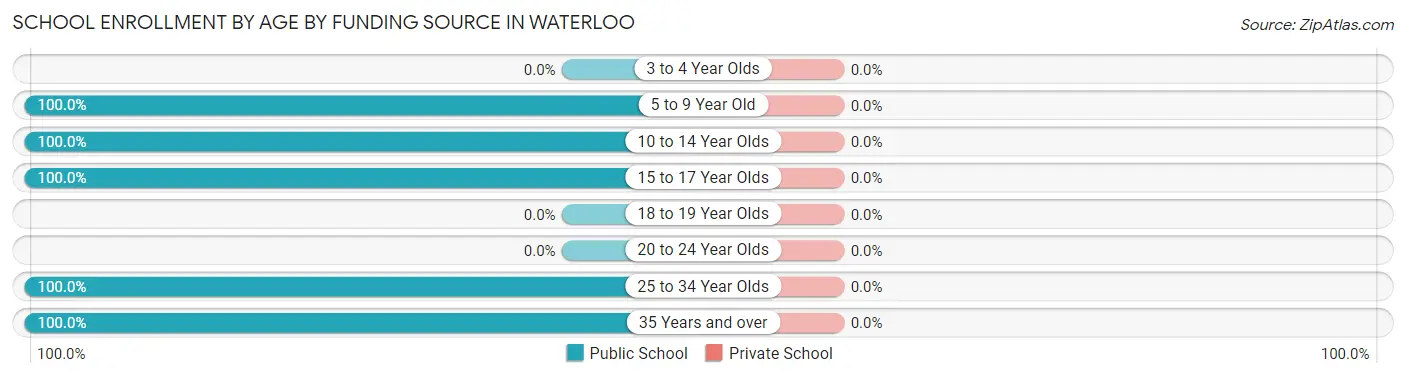
| Age Bracket | Public School | Private School |
| 3 to 4 Year Olds | 0 (0.0%) | 0 (0.0%) |
| 5 to 9 Year Old | 35 (100.0%) | 0 (0.0%) |
| 10 to 14 Year Olds | 14 (100.0%) | 0 (0.0%) |
| 15 to 17 Year Olds | 12 (100.0%) | 0 (0.0%) |
| 18 to 19 Year Olds | 0 (0.0%) | 0 (0.0%) |
| 20 to 24 Year Olds | 0 (0.0%) | 0 (0.0%) |
| 25 to 34 Year Olds | 64 (100.0%) | 0 (0.0%) |
| 35 Years and over | 38 (100.0%) | 0 (0.0%) |
| Total | 163 (100.0%) | 0 (0.0%) |
Educational Attainment by Field of Study in Waterloo
Science & technology (71 | 47.3%), business (28 | 18.7%), psychology (18 | 12.0%), computers & mathematics (13 | 8.7%), and visual & performing arts (9 | 6.0%) are the most common fields of study among 150 individuals in Waterloo who have obtained a bachelor's degree or higher.
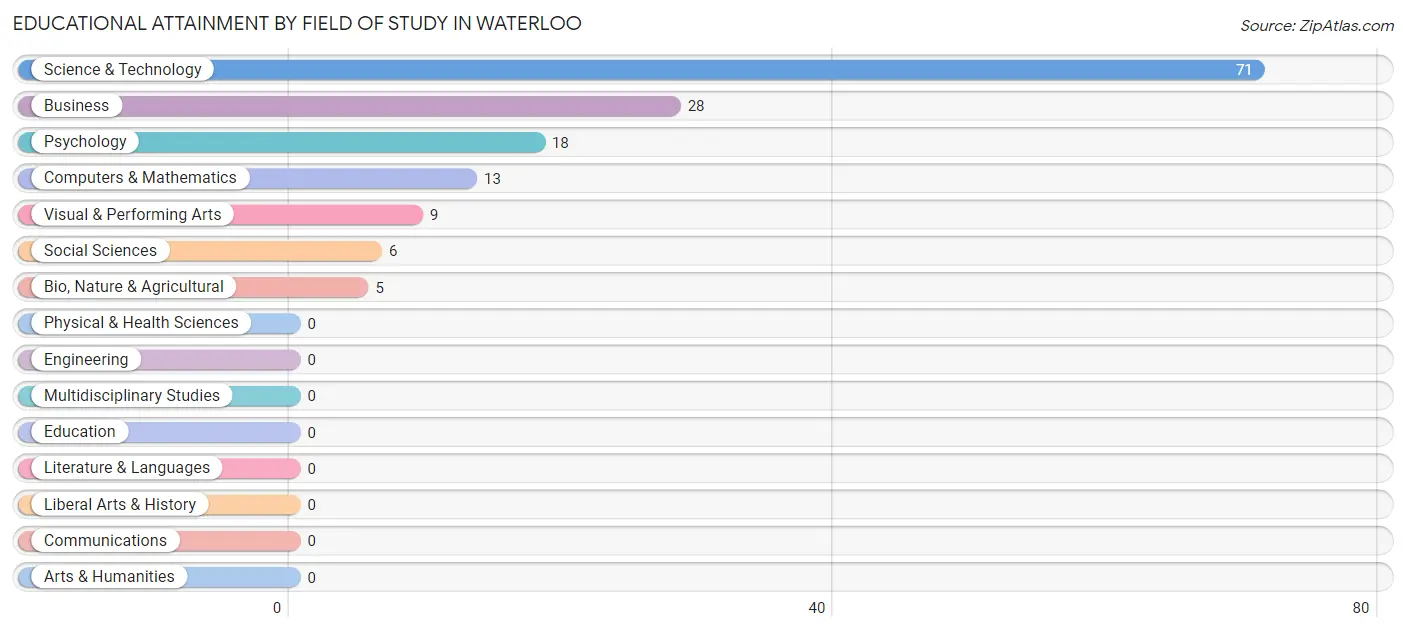
| Field of Study | # Graduates | % Graduates |
| Computers & Mathematics | 13 | 8.7% |
| Bio, Nature & Agricultural | 5 | 3.3% |
| Physical & Health Sciences | 0 | 0.0% |
| Psychology | 18 | 12.0% |
| Social Sciences | 6 | 4.0% |
| Engineering | 0 | 0.0% |
| Multidisciplinary Studies | 0 | 0.0% |
| Science & Technology | 71 | 47.3% |
| Business | 28 | 18.7% |
| Education | 0 | 0.0% |
| Literature & Languages | 0 | 0.0% |
| Liberal Arts & History | 0 | 0.0% |
| Visual & Performing Arts | 9 | 6.0% |
| Communications | 0 | 0.0% |
| Arts & Humanities | 0 | 0.0% |
| Total | 150 | 100.0% |
Transportation & Commute in Waterloo
Vehicle Availability by Sex in Waterloo
The most prevalent vehicle ownership categories in Waterloo are males with 2 vehicles (136, accounting for 47.5%) and females with 2 vehicles (74, making up 49.8%).
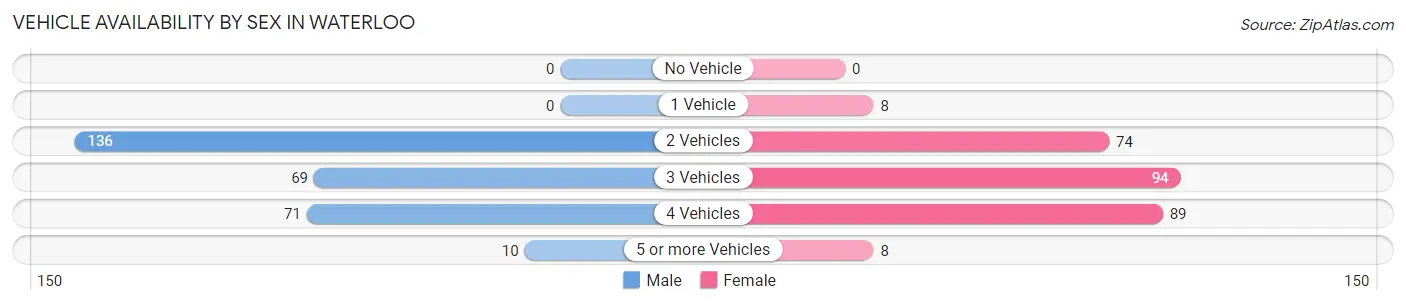
| Vehicles Available | Male | Female |
| No Vehicle | 0 (0.0%) | 0 (0.0%) |
| 1 Vehicle | 0 (0.0%) | 8 (2.9%) |
| 2 Vehicles | 136 (47.5%) | 74 (27.1%) |
| 3 Vehicles | 69 (24.1%) | 94 (34.4%) |
| 4 Vehicles | 71 (24.8%) | 89 (32.6%) |
| 5 or more Vehicles | 10 (3.5%) | 8 (2.9%) |
| Total | 286 (100.0%) | 273 (100.0%) |
Commute Time in Waterloo
The most frequently occuring commute durations in Waterloo are 30 to 34 minutes (160 commuters, 35.3%), 15 to 19 minutes (88 commuters, 19.4%), and 20 to 24 minutes (67 commuters, 14.8%).
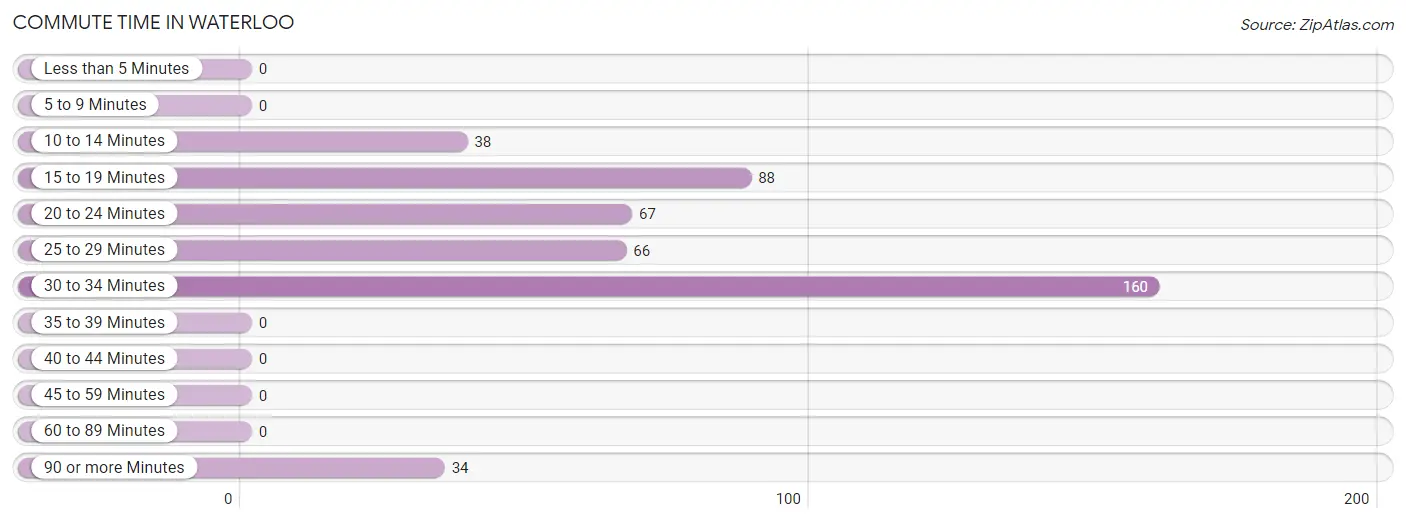
| Commute Time | # Commuters | % Commuters |
| Less than 5 Minutes | 0 | 0.0% |
| 5 to 9 Minutes | 0 | 0.0% |
| 10 to 14 Minutes | 38 | 8.4% |
| 15 to 19 Minutes | 88 | 19.4% |
| 20 to 24 Minutes | 67 | 14.8% |
| 25 to 29 Minutes | 66 | 14.6% |
| 30 to 34 Minutes | 160 | 35.3% |
| 35 to 39 Minutes | 0 | 0.0% |
| 40 to 44 Minutes | 0 | 0.0% |
| 45 to 59 Minutes | 0 | 0.0% |
| 60 to 89 Minutes | 0 | 0.0% |
| 90 or more Minutes | 34 | 7.5% |
Commute Time by Sex in Waterloo
The most common commute times in Waterloo are 30 to 34 minutes (85 commuters, 45.2%) for males and 30 to 34 minutes (75 commuters, 28.3%) for females.
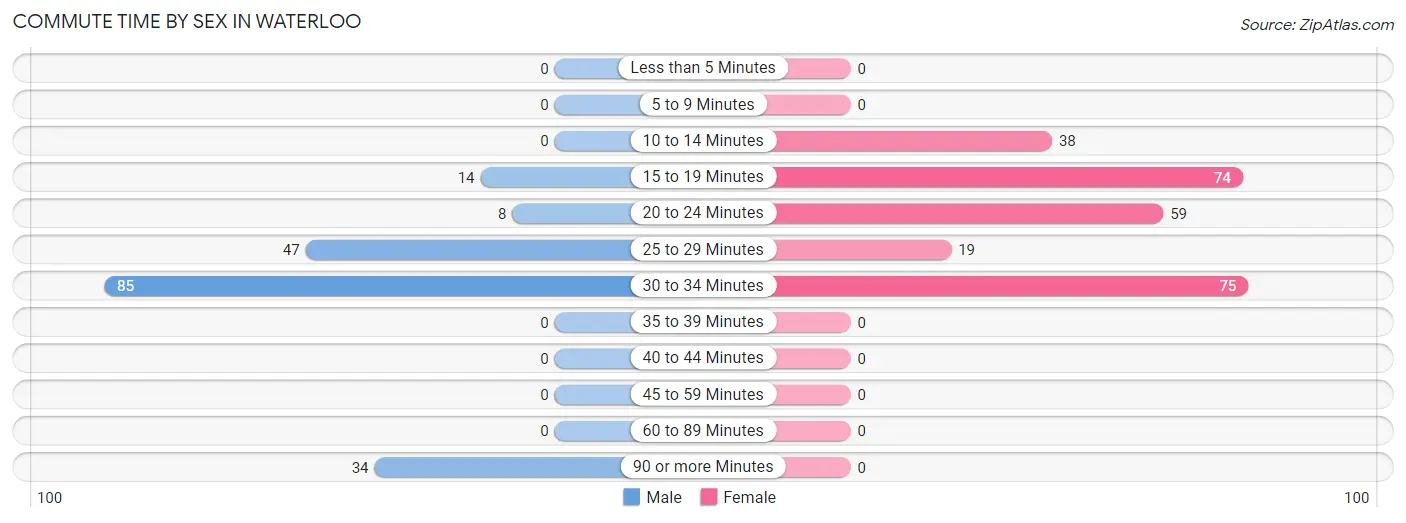
| Commute Time | Male | Female |
| Less than 5 Minutes | 0 (0.0%) | 0 (0.0%) |
| 5 to 9 Minutes | 0 (0.0%) | 0 (0.0%) |
| 10 to 14 Minutes | 0 (0.0%) | 38 (14.3%) |
| 15 to 19 Minutes | 14 (7.4%) | 74 (27.9%) |
| 20 to 24 Minutes | 8 (4.3%) | 59 (22.3%) |
| 25 to 29 Minutes | 47 (25.0%) | 19 (7.2%) |
| 30 to 34 Minutes | 85 (45.2%) | 75 (28.3%) |
| 35 to 39 Minutes | 0 (0.0%) | 0 (0.0%) |
| 40 to 44 Minutes | 0 (0.0%) | 0 (0.0%) |
| 45 to 59 Minutes | 0 (0.0%) | 0 (0.0%) |
| 60 to 89 Minutes | 0 (0.0%) | 0 (0.0%) |
| 90 or more Minutes | 34 (18.1%) | 0 (0.0%) |
Time of Departure to Work by Sex in Waterloo
The most frequent times of departure to work in Waterloo are 11:00 AM to 11:59 AM (75, 39.9%) for males and 7:00 AM to 7:29 AM (77, 29.1%) for females.
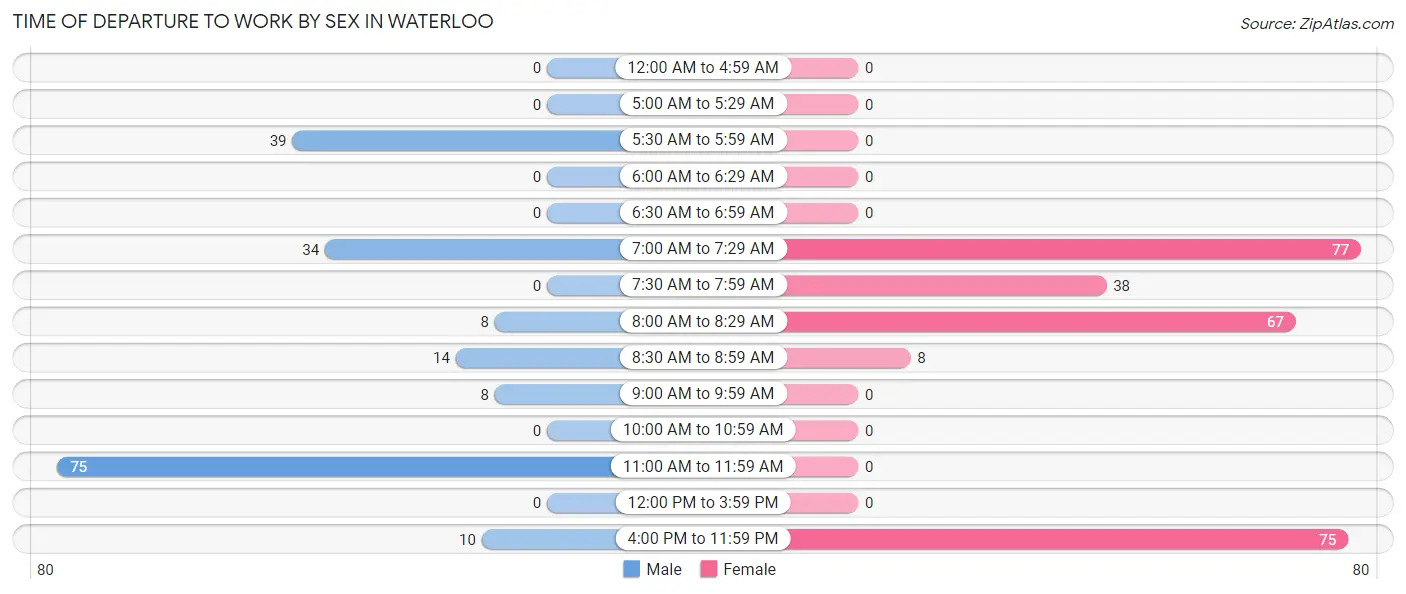
| Time of Departure | Male | Female |
| 12:00 AM to 4:59 AM | 0 (0.0%) | 0 (0.0%) |
| 5:00 AM to 5:29 AM | 0 (0.0%) | 0 (0.0%) |
| 5:30 AM to 5:59 AM | 39 (20.7%) | 0 (0.0%) |
| 6:00 AM to 6:29 AM | 0 (0.0%) | 0 (0.0%) |
| 6:30 AM to 6:59 AM | 0 (0.0%) | 0 (0.0%) |
| 7:00 AM to 7:29 AM | 34 (18.1%) | 77 (29.1%) |
| 7:30 AM to 7:59 AM | 0 (0.0%) | 38 (14.3%) |
| 8:00 AM to 8:29 AM | 8 (4.3%) | 67 (25.3%) |
| 8:30 AM to 8:59 AM | 14 (7.4%) | 8 (3.0%) |
| 9:00 AM to 9:59 AM | 8 (4.3%) | 0 (0.0%) |
| 10:00 AM to 10:59 AM | 0 (0.0%) | 0 (0.0%) |
| 11:00 AM to 11:59 AM | 75 (39.9%) | 0 (0.0%) |
| 12:00 PM to 3:59 PM | 0 (0.0%) | 0 (0.0%) |
| 4:00 PM to 11:59 PM | 10 (5.3%) | 75 (28.3%) |
| Total | 188 (100.0%) | 265 (100.0%) |
Housing Occupancy in Waterloo
Occupancy by Ownership in Waterloo
Of the total 321 dwellings in Waterloo, owner-occupied units account for 106 (33.0%), while renter-occupied units make up 215 (67.0%).
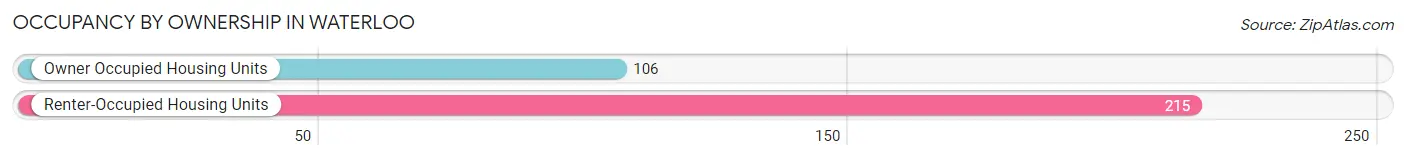
| Occupancy | # Housing Units | % Housing Units |
| Owner Occupied Housing Units | 106 | 33.0% |
| Renter-Occupied Housing Units | 215 | 67.0% |
| Total Occupied Housing Units | 321 | 100.0% |
Occupancy by Household Size in Waterloo
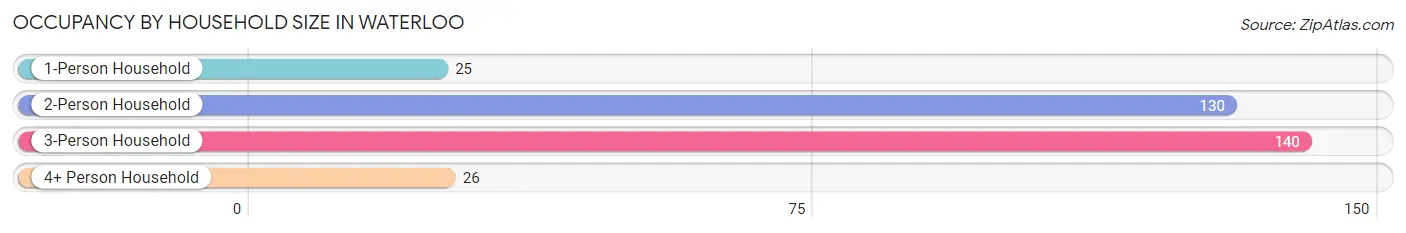
| Household Size | # Housing Units | % Housing Units |
| 1-Person Household | 25 | 7.8% |
| 2-Person Household | 130 | 40.5% |
| 3-Person Household | 140 | 43.6% |
| 4+ Person Household | 26 | 8.1% |
| Total Housing Units | 321 | 100.0% |
Occupancy by Ownership by Household Size in Waterloo
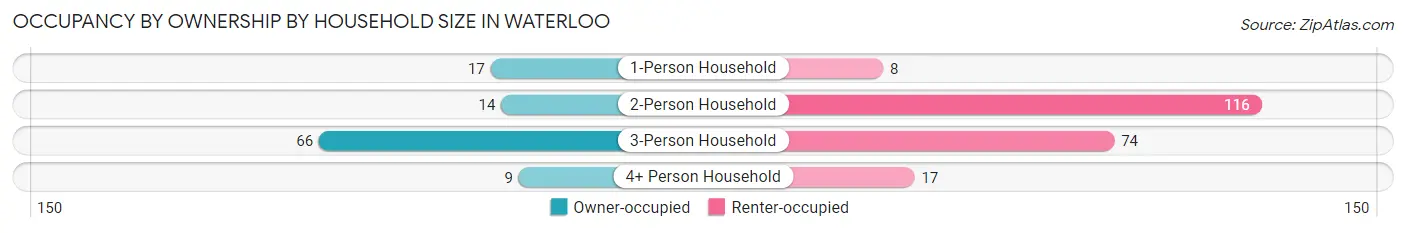
| Household Size | Owner-occupied | Renter-occupied |
| 1-Person Household | 17 (68.0%) | 8 (32.0%) |
| 2-Person Household | 14 (10.8%) | 116 (89.2%) |
| 3-Person Household | 66 (47.1%) | 74 (52.9%) |
| 4+ Person Household | 9 (34.6%) | 17 (65.4%) |
| Total Housing Units | 106 (33.0%) | 215 (67.0%) |
Occupancy by Educational Attainment in Waterloo
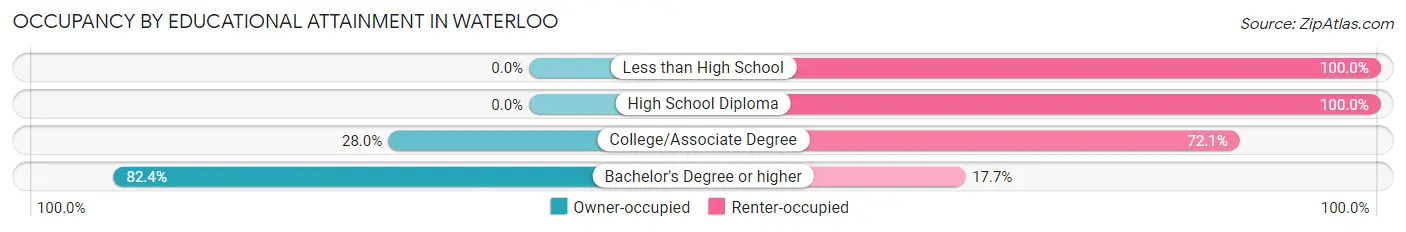
| Household Size | Owner-occupied | Renter-occupied |
| Less than High School | 0 (0.0%) | 17 (100.0%) |
| High School Diploma | 0 (0.0%) | 24 (100.0%) |
| College/Associate Degree | 64 (28.0%) | 165 (72.1%) |
| Bachelor's Degree or higher | 42 (82.4%) | 9 (17.6%) |
Occupancy by Age of Householder in Waterloo
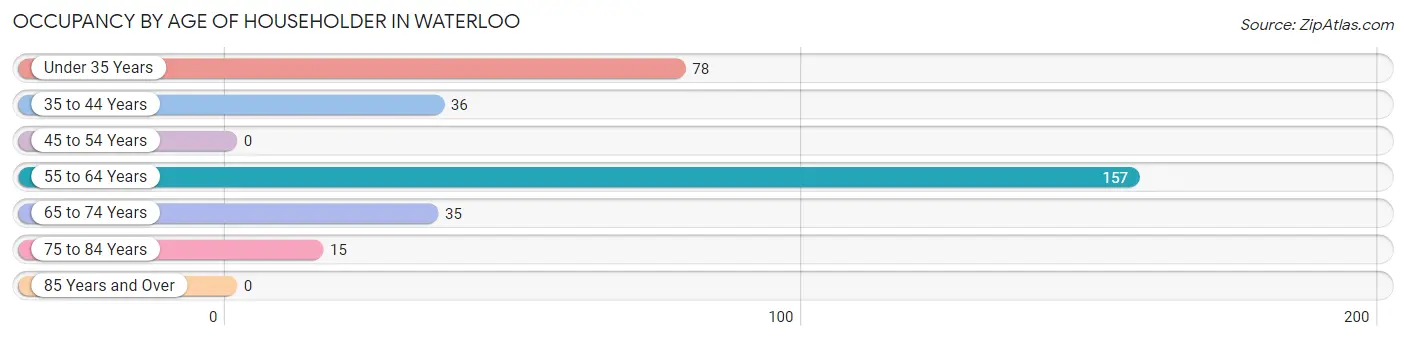
| Age Bracket | # Households | % Households |
| Under 35 Years | 78 | 24.3% |
| 35 to 44 Years | 36 | 11.2% |
| 45 to 54 Years | 0 | 0.0% |
| 55 to 64 Years | 157 | 48.9% |
| 65 to 74 Years | 35 | 10.9% |
| 75 to 84 Years | 15 | 4.7% |
| 85 Years and Over | 0 | 0.0% |
| Total | 321 | 100.0% |
Housing Finances in Waterloo
Median Income by Occupancy in Waterloo
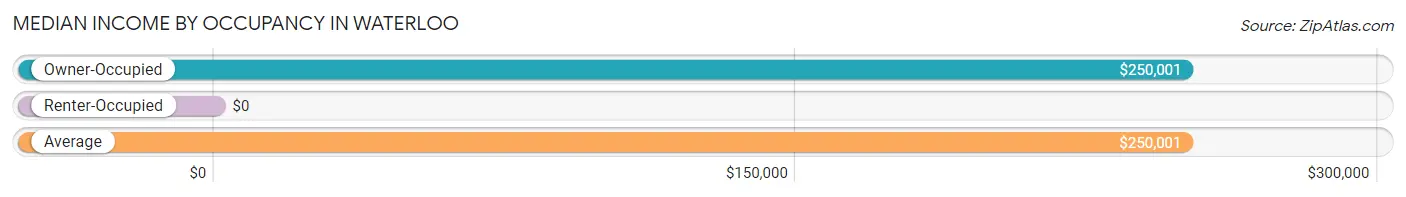
| Occupancy Type | # Households | Median Income |
| Owner-Occupied | 106 (33.0%) | $250,001 |
| Renter-Occupied | 215 (67.0%) | $0 |
| Average | 321 (100.0%) | $250,001 |
Occupancy by Householder Income Bracket in Waterloo
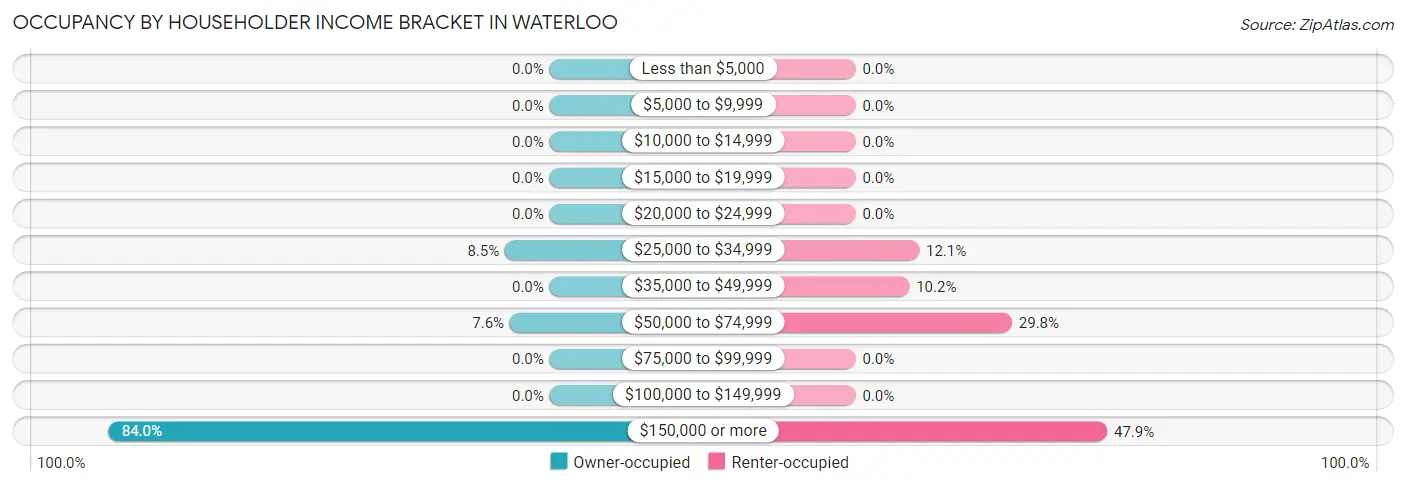
| Income Bracket | Owner-occupied | Renter-occupied |
| Less than $5,000 | 0 (0.0%) | 0 (0.0%) |
| $5,000 to $9,999 | 0 (0.0%) | 0 (0.0%) |
| $10,000 to $14,999 | 0 (0.0%) | 0 (0.0%) |
| $15,000 to $19,999 | 0 (0.0%) | 0 (0.0%) |
| $20,000 to $24,999 | 0 (0.0%) | 0 (0.0%) |
| $25,000 to $34,999 | 9 (8.5%) | 26 (12.1%) |
| $35,000 to $49,999 | 0 (0.0%) | 22 (10.2%) |
| $50,000 to $74,999 | 8 (7.5%) | 64 (29.8%) |
| $75,000 to $99,999 | 0 (0.0%) | 0 (0.0%) |
| $100,000 to $149,999 | 0 (0.0%) | 0 (0.0%) |
| $150,000 or more | 89 (84.0%) | 103 (47.9%) |
| Total | 106 (100.0%) | 215 (100.0%) |
Monthly Housing Cost Tiers in Waterloo
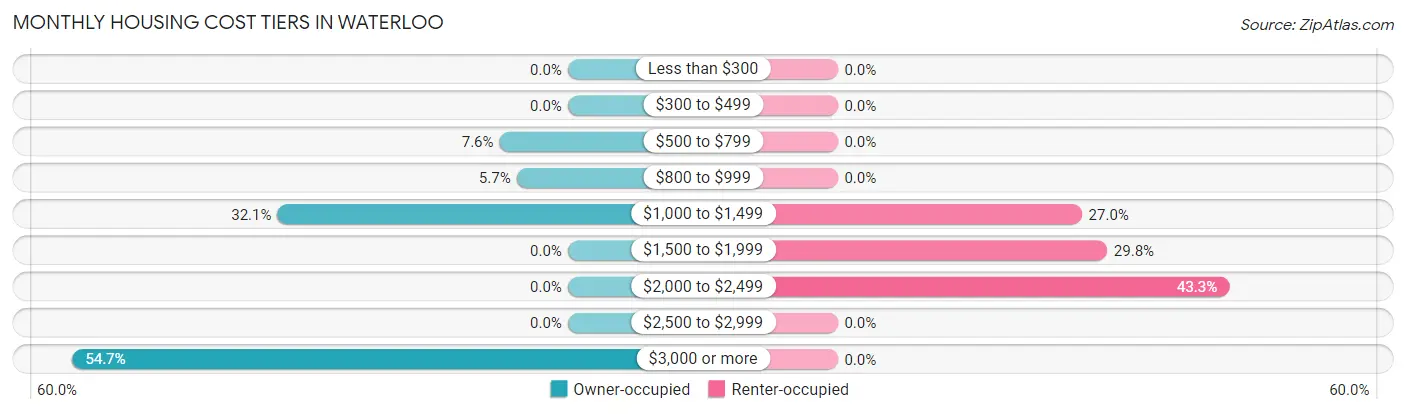
| Monthly Cost | Owner-occupied | Renter-occupied |
| Less than $300 | 0 (0.0%) | 0 (0.0%) |
| $300 to $499 | 0 (0.0%) | 0 (0.0%) |
| $500 to $799 | 8 (7.5%) | 0 (0.0%) |
| $800 to $999 | 6 (5.7%) | 0 (0.0%) |
| $1,000 to $1,499 | 34 (32.1%) | 58 (27.0%) |
| $1,500 to $1,999 | 0 (0.0%) | 64 (29.8%) |
| $2,000 to $2,499 | 0 (0.0%) | 93 (43.3%) |
| $2,500 to $2,999 | 0 (0.0%) | 0 (0.0%) |
| $3,000 or more | 58 (54.7%) | 0 (0.0%) |
| Total | 106 (100.0%) | 215 (100.0%) |
Physical Housing Characteristics in Waterloo
Housing Structures in Waterloo
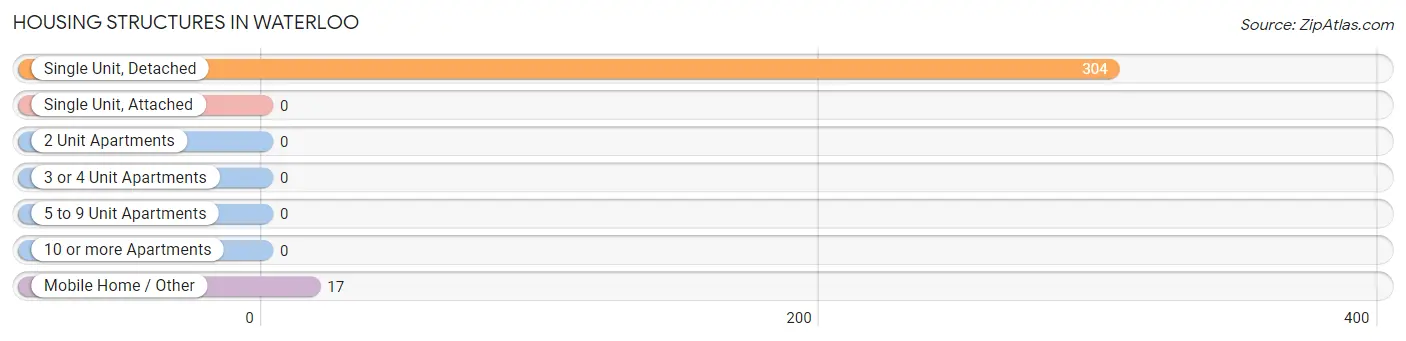
| Structure Type | # Housing Units | % Housing Units |
| Single Unit, Detached | 304 | 94.7% |
| Single Unit, Attached | 0 | 0.0% |
| 2 Unit Apartments | 0 | 0.0% |
| 3 or 4 Unit Apartments | 0 | 0.0% |
| 5 to 9 Unit Apartments | 0 | 0.0% |
| 10 or more Apartments | 0 | 0.0% |
| Mobile Home / Other | 17 | 5.3% |
| Total | 321 | 100.0% |
Housing Structures by Occupancy in Waterloo
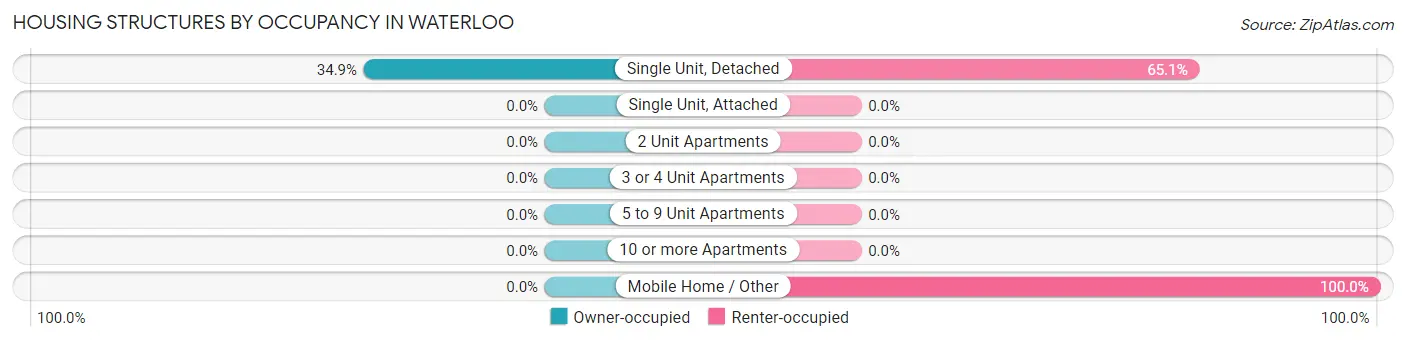
| Structure Type | Owner-occupied | Renter-occupied |
| Single Unit, Detached | 106 (34.9%) | 198 (65.1%) |
| Single Unit, Attached | 0 (0.0%) | 0 (0.0%) |
| 2 Unit Apartments | 0 (0.0%) | 0 (0.0%) |
| 3 or 4 Unit Apartments | 0 (0.0%) | 0 (0.0%) |
| 5 to 9 Unit Apartments | 0 (0.0%) | 0 (0.0%) |
| 10 or more Apartments | 0 (0.0%) | 0 (0.0%) |
| Mobile Home / Other | 0 (0.0%) | 17 (100.0%) |
| Total | 106 (33.0%) | 215 (67.0%) |
Housing Structures by Number of Rooms in Waterloo
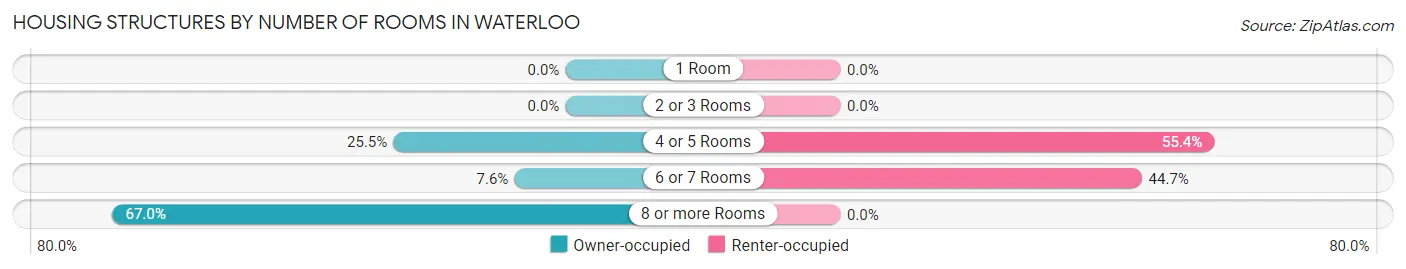
| Number of Rooms | Owner-occupied | Renter-occupied |
| 1 Room | 0 (0.0%) | 0 (0.0%) |
| 2 or 3 Rooms | 0 (0.0%) | 0 (0.0%) |
| 4 or 5 Rooms | 27 (25.5%) | 119 (55.3%) |
| 6 or 7 Rooms | 8 (7.5%) | 96 (44.7%) |
| 8 or more Rooms | 71 (67.0%) | 0 (0.0%) |
| Total | 106 (100.0%) | 215 (100.0%) |
Housing Structure by Heating Type in Waterloo
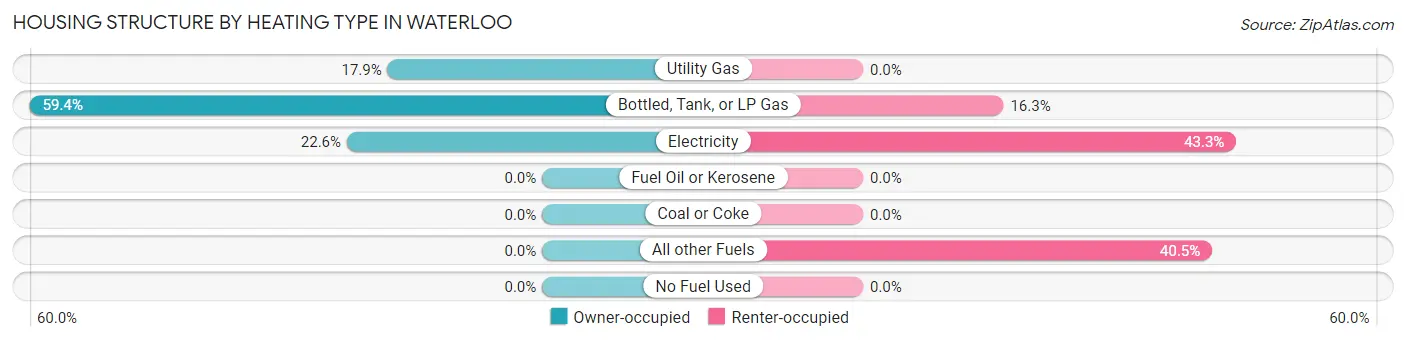
| Heating Type | Owner-occupied | Renter-occupied |
| Utility Gas | 19 (17.9%) | 0 (0.0%) |
| Bottled, Tank, or LP Gas | 63 (59.4%) | 35 (16.3%) |
| Electricity | 24 (22.6%) | 93 (43.3%) |
| Fuel Oil or Kerosene | 0 (0.0%) | 0 (0.0%) |
| Coal or Coke | 0 (0.0%) | 0 (0.0%) |
| All other Fuels | 0 (0.0%) | 87 (40.5%) |
| No Fuel Used | 0 (0.0%) | 0 (0.0%) |
| Total | 106 (100.0%) | 215 (100.0%) |
Household Vehicle Usage in Waterloo
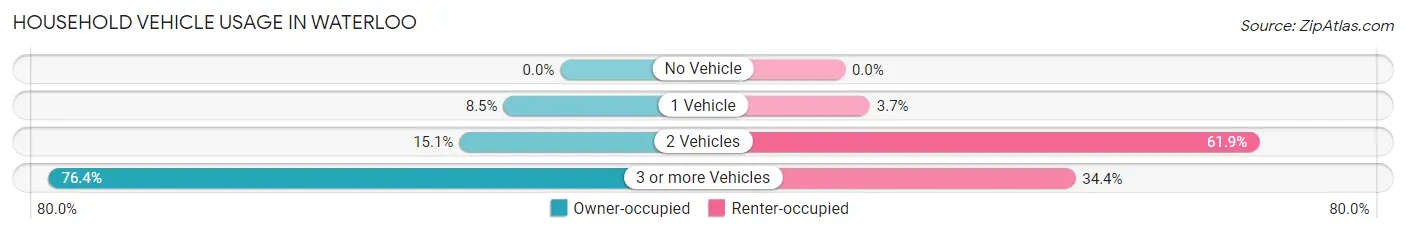
| Vehicles per Household | Owner-occupied | Renter-occupied |
| No Vehicle | 0 (0.0%) | 0 (0.0%) |
| 1 Vehicle | 9 (8.5%) | 8 (3.7%) |
| 2 Vehicles | 16 (15.1%) | 133 (61.9%) |
| 3 or more Vehicles | 81 (76.4%) | 74 (34.4%) |
| Total | 106 (100.0%) | 215 (100.0%) |
Real Estate & Mortgages in Waterloo
Real Estate and Mortgage Overview in Waterloo
| Characteristic | Without Mortgage | With Mortgage |
| Housing Units | 32 | 74 |
| Median Property Value | - | - |
| Median Household Income | - | - |
| Monthly Housing Costs | $1,022 | $58 |
| Real Estate Taxes | - | - |
Property Value by Mortgage Status in Waterloo
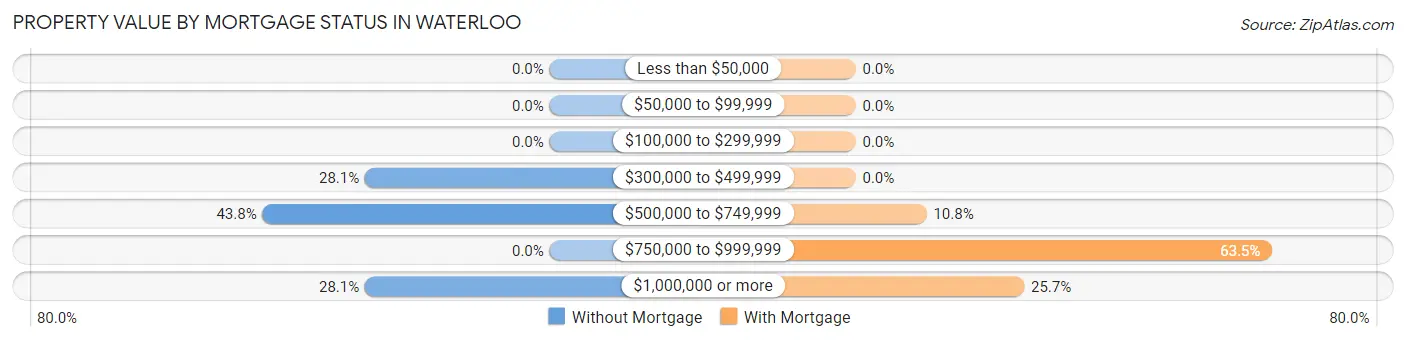
| Property Value | Without Mortgage | With Mortgage |
| Less than $50,000 | 0 (0.0%) | 0 (0.0%) |
| $50,000 to $99,999 | 0 (0.0%) | 0 (0.0%) |
| $100,000 to $299,999 | 0 (0.0%) | 0 (0.0%) |
| $300,000 to $499,999 | 9 (28.1%) | 0 (0.0%) |
| $500,000 to $749,999 | 14 (43.8%) | 8 (10.8%) |
| $750,000 to $999,999 | 0 (0.0%) | 47 (63.5%) |
| $1,000,000 or more | 9 (28.1%) | 19 (25.7%) |
| Total | 32 (100.0%) | 74 (100.0%) |
Household Income by Mortgage Status in Waterloo
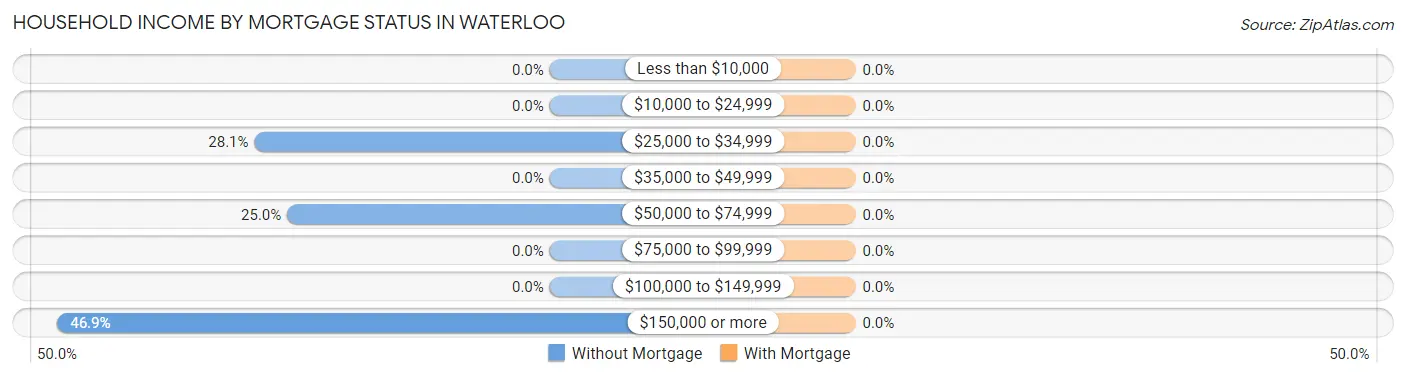
| Household Income | Without Mortgage | With Mortgage |
| Less than $10,000 | 0 (0.0%) | 0 (0.0%) |
| $10,000 to $24,999 | 0 (0.0%) | 0 (0.0%) |
| $25,000 to $34,999 | 9 (28.1%) | 0 (0.0%) |
| $35,000 to $49,999 | 0 (0.0%) | 0 (0.0%) |
| $50,000 to $74,999 | 8 (25.0%) | 0 (0.0%) |
| $75,000 to $99,999 | 0 (0.0%) | 0 (0.0%) |
| $100,000 to $149,999 | 0 (0.0%) | 0 (0.0%) |
| $150,000 or more | 15 (46.9%) | 0 (0.0%) |
| Total | 32 (100.0%) | 74 (100.0%) |
Property Value to Household Income Ratio in Waterloo
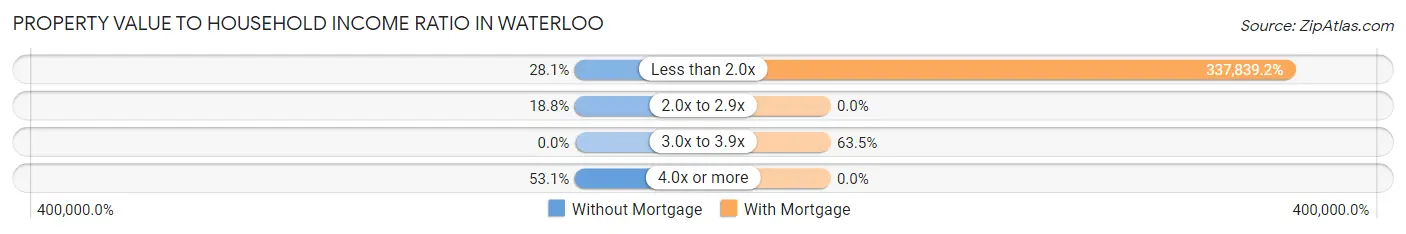
| Value-to-Income Ratio | Without Mortgage | With Mortgage |
| Less than 2.0x | 9 (28.1%) | 250,001 (337,839.2%) |
| 2.0x to 2.9x | 6 (18.8%) | 0 (0.0%) |
| 3.0x to 3.9x | 0 (0.0%) | 47 (63.5%) |
| 4.0x or more | 17 (53.1%) | 0 (0.0%) |
| Total | 32 (100.0%) | 74 (100.0%) |
Real Estate Taxes by Mortgage Status in Waterloo
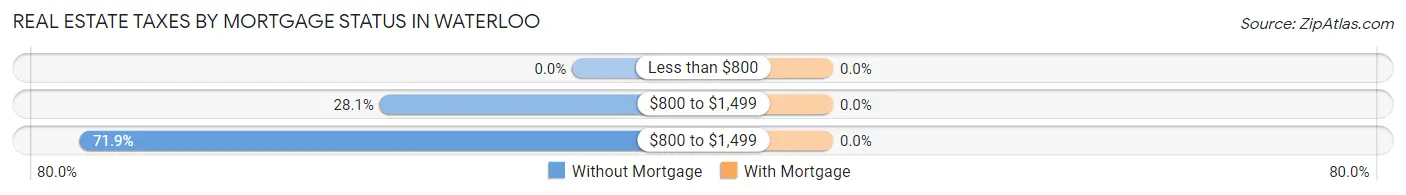
| Property Taxes | Without Mortgage | With Mortgage |
| Less than $800 | 0 (0.0%) | 0 (0.0%) |
| $800 to $1,499 | 9 (28.1%) | 0 (0.0%) |
| $800 to $1,499 | 23 (71.9%) | 0 (0.0%) |
| Total | 32 (100.0%) | 74 (100.0%) |
Health & Disability in Waterloo
Health Insurance Coverage by Age in Waterloo
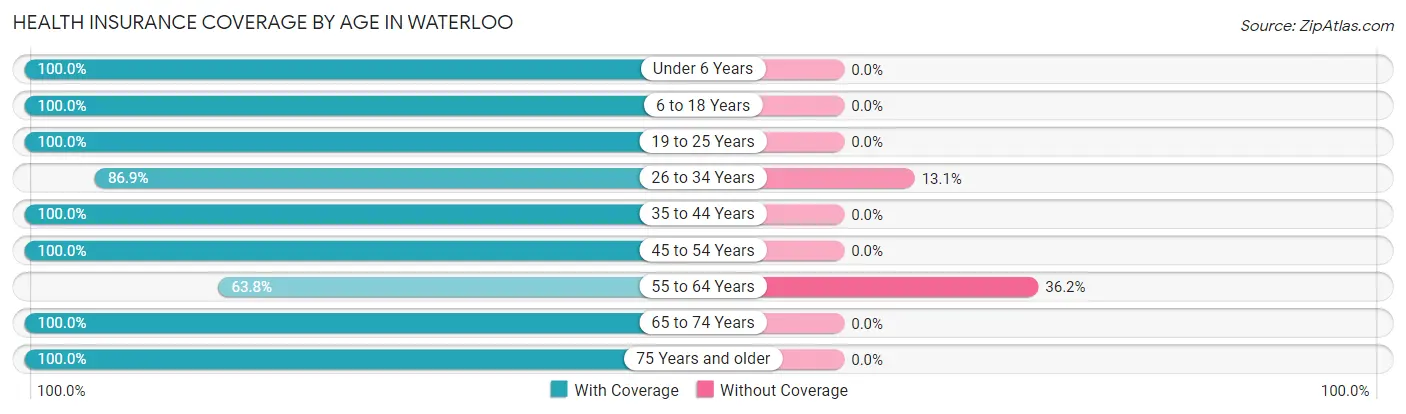
| Age Bracket | With Coverage | Without Coverage |
| Under 6 Years | 73 (100.0%) | 0 (0.0%) |
| 6 to 18 Years | 122 (100.0%) | 0 (0.0%) |
| 19 to 25 Years | 51 (100.0%) | 0 (0.0%) |
| 26 to 34 Years | 86 (86.9%) | 13 (13.1%) |
| 35 to 44 Years | 66 (100.0%) | 0 (0.0%) |
| 45 to 54 Years | 45 (100.0%) | 0 (0.0%) |
| 55 to 64 Years | 164 (63.8%) | 93 (36.2%) |
| 65 to 74 Years | 77 (100.0%) | 0 (0.0%) |
| 75 Years and older | 50 (100.0%) | 0 (0.0%) |
| Total | 734 (87.4%) | 106 (12.6%) |
Health Insurance Coverage by Citizenship Status in Waterloo
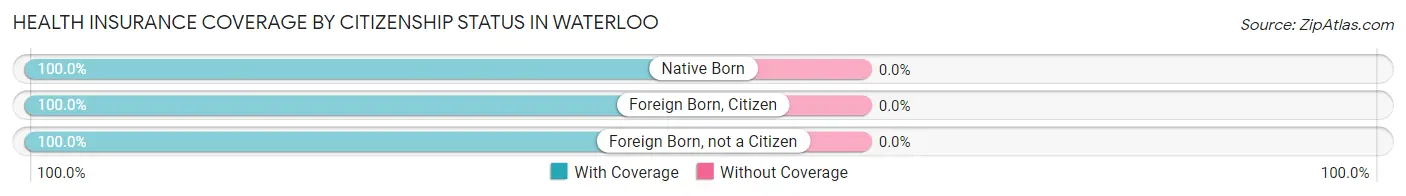
| Citizenship Status | With Coverage | Without Coverage |
| Native Born | 73 (100.0%) | 0 (0.0%) |
| Foreign Born, Citizen | 122 (100.0%) | 0 (0.0%) |
| Foreign Born, not a Citizen | 51 (100.0%) | 0 (0.0%) |
Health Insurance Coverage by Household Income in Waterloo
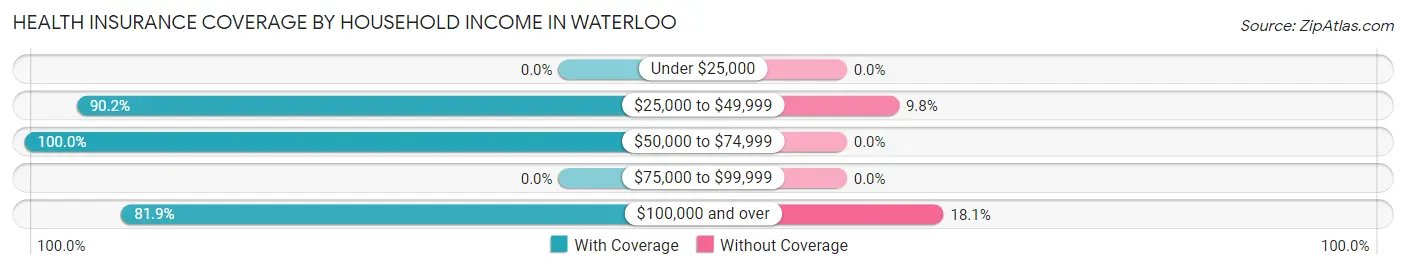
| Household Income | With Coverage | Without Coverage |
| Under $25,000 | 0 (0.0%) | 0 (0.0%) |
| $25,000 to $49,999 | 120 (90.2%) | 13 (9.8%) |
| $50,000 to $74,999 | 194 (100.0%) | 0 (0.0%) |
| $75,000 to $99,999 | 0 (0.0%) | 0 (0.0%) |
| $100,000 and over | 420 (81.9%) | 93 (18.1%) |
Public vs Private Health Insurance Coverage by Age in Waterloo
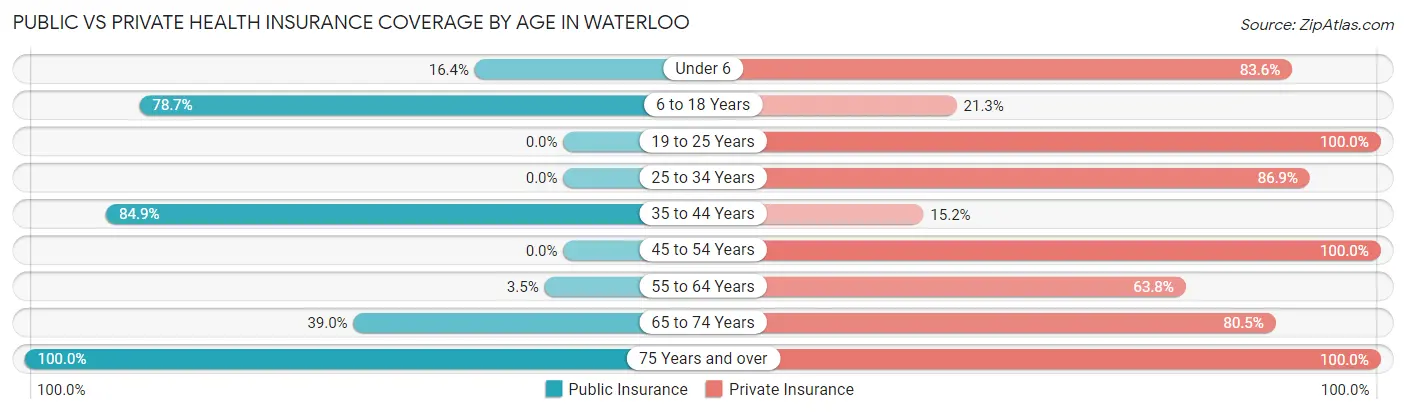
| Age Bracket | Public Insurance | Private Insurance |
| Under 6 | 12 (16.4%) | 61 (83.6%) |
| 6 to 18 Years | 96 (78.7%) | 26 (21.3%) |
| 19 to 25 Years | 0 (0.0%) | 51 (100.0%) |
| 25 to 34 Years | 0 (0.0%) | 86 (86.9%) |
| 35 to 44 Years | 56 (84.9%) | 10 (15.1%) |
| 45 to 54 Years | 0 (0.0%) | 45 (100.0%) |
| 55 to 64 Years | 9 (3.5%) | 164 (63.8%) |
| 65 to 74 Years | 30 (39.0%) | 62 (80.5%) |
| 75 Years and over | 50 (100.0%) | 50 (100.0%) |
| Total | 253 (30.1%) | 555 (66.1%) |
Disability Status by Sex by Age in Waterloo
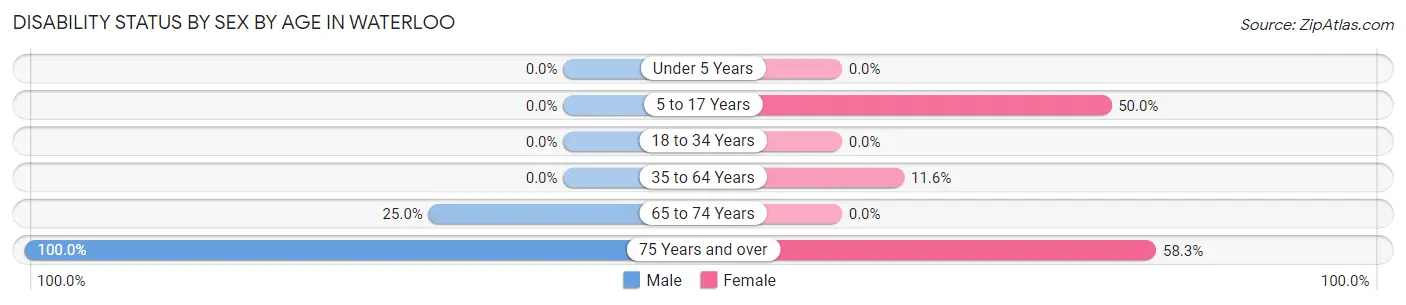
| Age Bracket | Male | Female |
| Under 5 Years | 0 (0.0%) | 0 (0.0%) |
| 5 to 17 Years | 0 (0.0%) | 14 (50.0%) |
| 18 to 34 Years | 0 (0.0%) | 0 (0.0%) |
| 35 to 64 Years | 0 (0.0%) | 17 (11.6%) |
| 65 to 74 Years | 9 (25.0%) | 0 (0.0%) |
| 75 Years and over | 14 (100.0%) | 21 (58.3%) |
Disability Class by Sex by Age in Waterloo
Disability Class: Hearing Difficulty
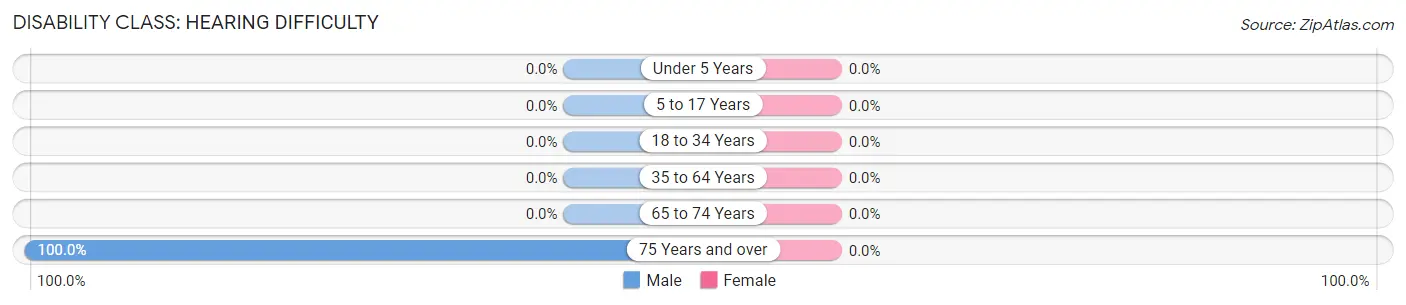
| Age Bracket | Male | Female |
| Under 5 Years | 0 (0.0%) | 0 (0.0%) |
| 5 to 17 Years | 0 (0.0%) | 0 (0.0%) |
| 18 to 34 Years | 0 (0.0%) | 0 (0.0%) |
| 35 to 64 Years | 0 (0.0%) | 0 (0.0%) |
| 65 to 74 Years | 0 (0.0%) | 0 (0.0%) |
| 75 Years and over | 14 (100.0%) | 0 (0.0%) |
Disability Class: Vision Difficulty
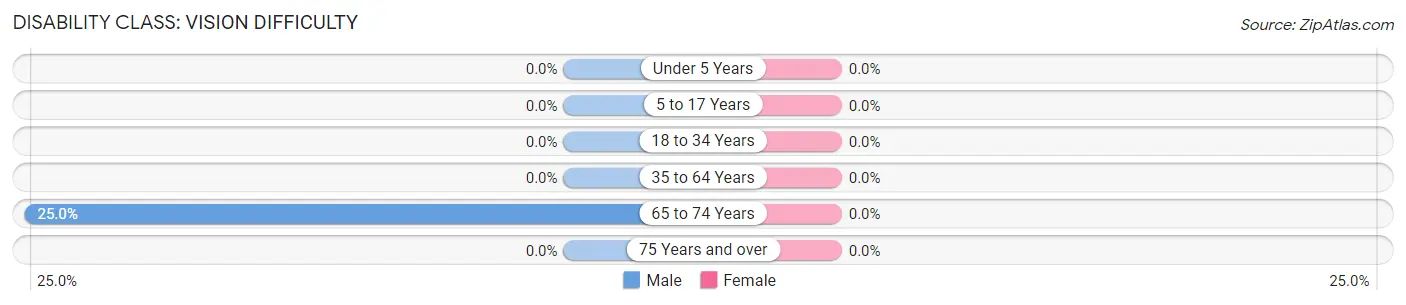
| Age Bracket | Male | Female |
| Under 5 Years | 0 (0.0%) | 0 (0.0%) |
| 5 to 17 Years | 0 (0.0%) | 0 (0.0%) |
| 18 to 34 Years | 0 (0.0%) | 0 (0.0%) |
| 35 to 64 Years | 0 (0.0%) | 0 (0.0%) |
| 65 to 74 Years | 9 (25.0%) | 0 (0.0%) |
| 75 Years and over | 0 (0.0%) | 0 (0.0%) |
Disability Class: Cognitive Difficulty
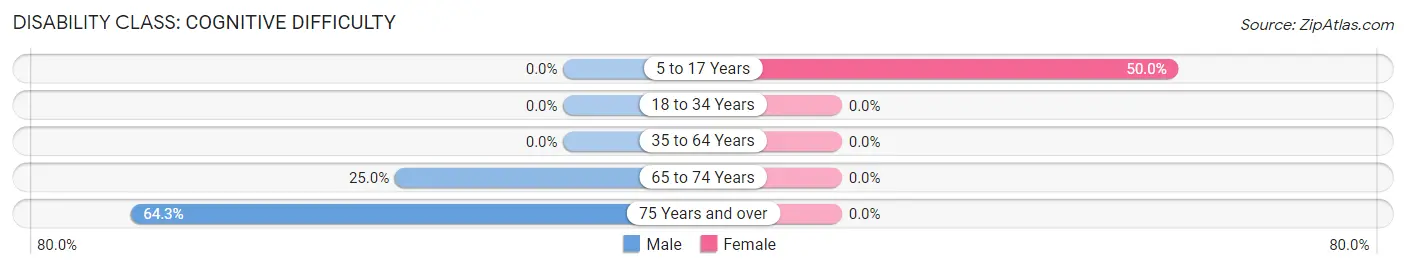
| Age Bracket | Male | Female |
| 5 to 17 Years | 0 (0.0%) | 14 (50.0%) |
| 18 to 34 Years | 0 (0.0%) | 0 (0.0%) |
| 35 to 64 Years | 0 (0.0%) | 0 (0.0%) |
| 65 to 74 Years | 9 (25.0%) | 0 (0.0%) |
| 75 Years and over | 9 (64.3%) | 0 (0.0%) |
Disability Class: Ambulatory Difficulty
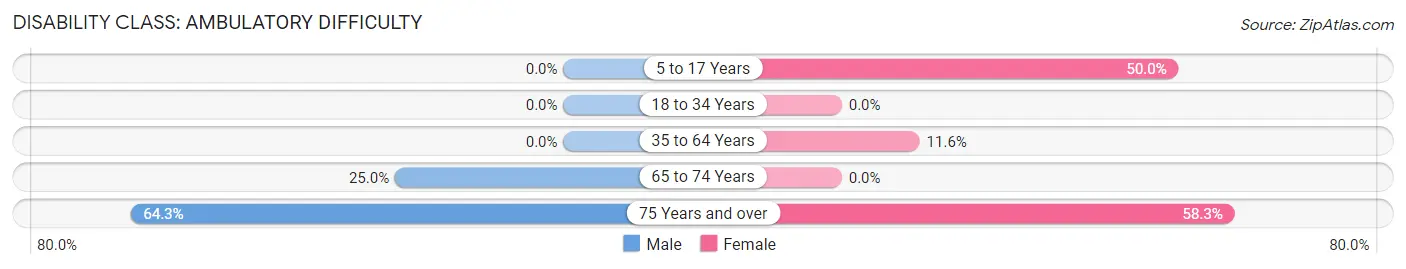
| Age Bracket | Male | Female |
| 5 to 17 Years | 0 (0.0%) | 14 (50.0%) |
| 18 to 34 Years | 0 (0.0%) | 0 (0.0%) |
| 35 to 64 Years | 0 (0.0%) | 17 (11.6%) |
| 65 to 74 Years | 9 (25.0%) | 0 (0.0%) |
| 75 Years and over | 9 (64.3%) | 21 (58.3%) |
Disability Class: Self-Care Difficulty
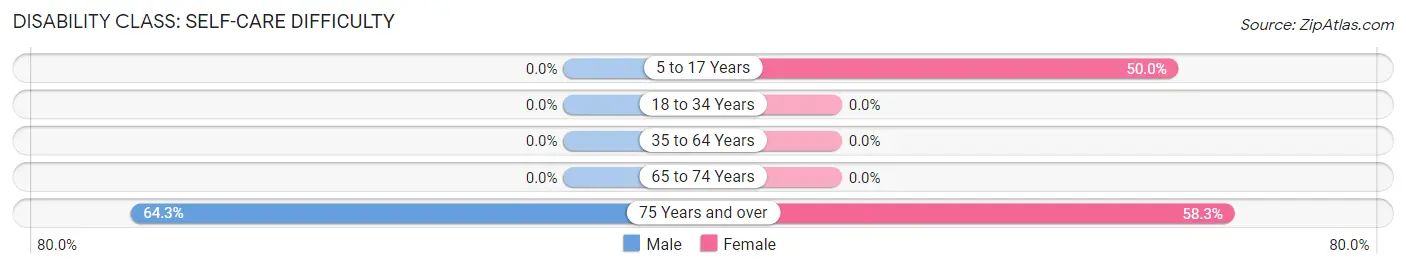
| Age Bracket | Male | Female |
| 5 to 17 Years | 0 (0.0%) | 14 (50.0%) |
| 18 to 34 Years | 0 (0.0%) | 0 (0.0%) |
| 35 to 64 Years | 0 (0.0%) | 0 (0.0%) |
| 65 to 74 Years | 0 (0.0%) | 0 (0.0%) |
| 75 Years and over | 9 (64.3%) | 21 (58.3%) |
Technology Access in Waterloo
Computing Device Access in Waterloo
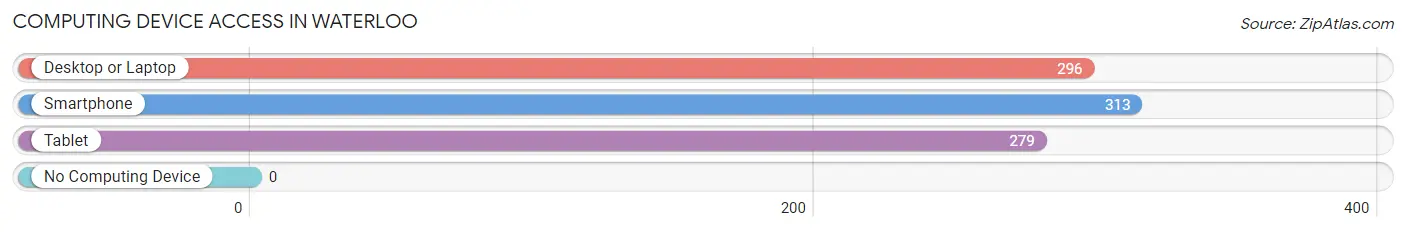
| Device Type | # Households | % Households |
| Desktop or Laptop | 296 | 92.2% |
| Smartphone | 313 | 97.5% |
| Tablet | 279 | 86.9% |
| No Computing Device | 0 | 0.0% |
| Total | 321 | 100.0% |
Internet Access in Waterloo
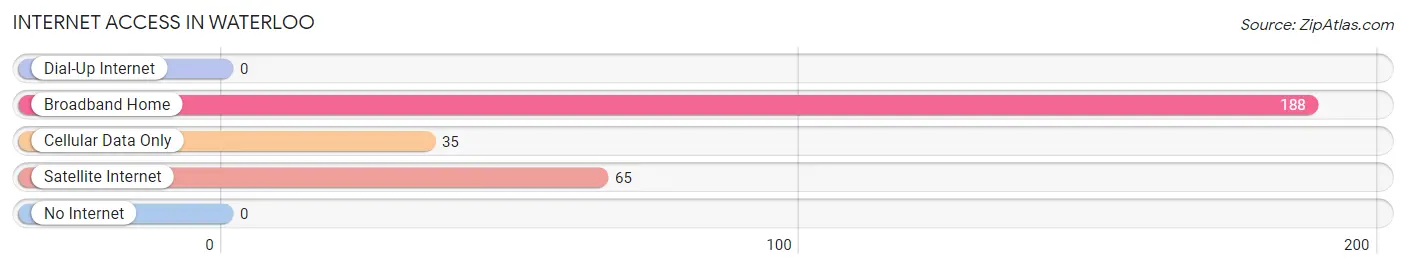
| Internet Type | # Households | % Households |
| Dial-Up Internet | 0 | 0.0% |
| Broadband Home | 188 | 58.6% |
| Cellular Data Only | 35 | 10.9% |
| Satellite Internet | 65 | 20.3% |
| No Internet | 0 | 0.0% |
| Total | 321 | 100.0% |
Waterloo Summary
Waterloo is a city located in the Regional Municipality of Waterloo, in the province of Ontario, Canada. It is situated in the Grand River Valley, approximately 100 km west of Toronto. Waterloo is the smallest of the three cities in the Regional Municipality of Waterloo, and is bordered by the cities of Kitchener and Cambridge.
History
The area now known as Waterloo was first settled in 1806 by Mennonites from Pennsylvania. The Mennonites were attracted to the area by the availability of land and the proximity to the Grand River. The first permanent settlement was established in 1816, and the village of Waterloo was officially incorporated in 1857.
The city of Waterloo experienced rapid growth in the late 19th and early 20th centuries, due to the development of the local manufacturing industry. The city was home to a number of factories, including the Seagram Distillery, which was established in 1857. The city also became a major centre for the production of furniture, and was home to a number of furniture factories.
In the mid-20th century, Waterloo experienced a period of decline, as the local manufacturing industry began to decline. The city was also affected by the closure of the Seagram Distillery in 1992. However, in recent years, the city has experienced a period of revitalization, with the development of a number of new businesses and industries.
Geography
Waterloo is located in the Grand River Valley, approximately 100 km west of Toronto. The city is situated on the north shore of the Grand River, and is bordered by the cities of Kitchener and Cambridge. The city is located in a predominantly rural area, and is surrounded by a number of small towns and villages.
The city of Waterloo covers an area of approximately 40 square kilometres, and has a population of approximately 98,000 people. The city is divided into a number of neighbourhoods, including Uptown Waterloo, Downtown Waterloo, and the University of Waterloo.
Economy
The economy of Waterloo is largely based on the service sector, with a number of large employers located in the city. The largest employer in the city is the University of Waterloo, which employs over 10,000 people. Other major employers in the city include the Manulife Financial Corporation, Sun Life Financial, and the Waterloo Regional Police Service.
The city is also home to a number of technology companies, including BlackBerry, OpenText, and D2L. The city is also home to a number of manufacturing companies, including Toyota Motor Manufacturing Canada, and the Seagram Distillery.
Demographics
The population of Waterloo is approximately 98,000 people, with a median age of 38. The city has a diverse population, with a large number of immigrants from a variety of countries. The largest ethnic group in the city is German, followed by English, Irish, Scottish, French, and Dutch.
The city also has a large student population, due to the presence of the University of Waterloo. The city has a large number of young people, with approximately 30% of the population under the age of 25.
Conclusion
Waterloo is a city located in the Regional Municipality of Waterloo, in the province of Ontario, Canada. The city has a long history, and has experienced a period of revitalization in recent years. The economy of the city is largely based on the service sector, and the city is home to a number of large employers. The population of the city is diverse, with a large number of immigrants and a large student population.
Common Questions
What is Per Capita Income in Waterloo?
Per Capita income in Waterloo is $68,579.
What is the Median Family Income in Waterloo?
Median Family Income in Waterloo is $250,001.
What is the Median Household income in Waterloo?
Median Household Income in Waterloo is $250,001.
What is Inequality or Gini Index in Waterloo?
Inequality or Gini Index in Waterloo is 0.36.
What is the Total Population of Waterloo?
Total Population of Waterloo is 840.
What is the Total Male Population of Waterloo?
Total Male Population of Waterloo is 394.
What is the Total Female Population of Waterloo?
Total Female Population of Waterloo is 446.
What is the Ratio of Males per 100 Females in Waterloo?
There are 88.34 Males per 100 Females in Waterloo.
What is the Ratio of Females per 100 Males in Waterloo?
There are 113.20 Females per 100 Males in Waterloo.
What is the Median Population Age in Waterloo?
Median Population Age in Waterloo is 53.1 Years.
What is the Average Family Size in Waterloo
Average Family Size in Waterloo is 2.6 People.
What is the Average Household Size in Waterloo
Average Household Size in Waterloo is 2.6 People.
How Large is the Labor Force in Waterloo?
There are 566 People in the Labor Forcein in Waterloo.
What is the Percentage of People in the Labor Force in Waterloo?
78.6% of People are in the Labor Force in Waterloo.