Cities with the Highest Percentage of Population Employed in Food Preparation & Serving in Tennessee
RELATED REPORTS & OPTIONS
Food Preparation & Serving
Tennessee
Compare Cities
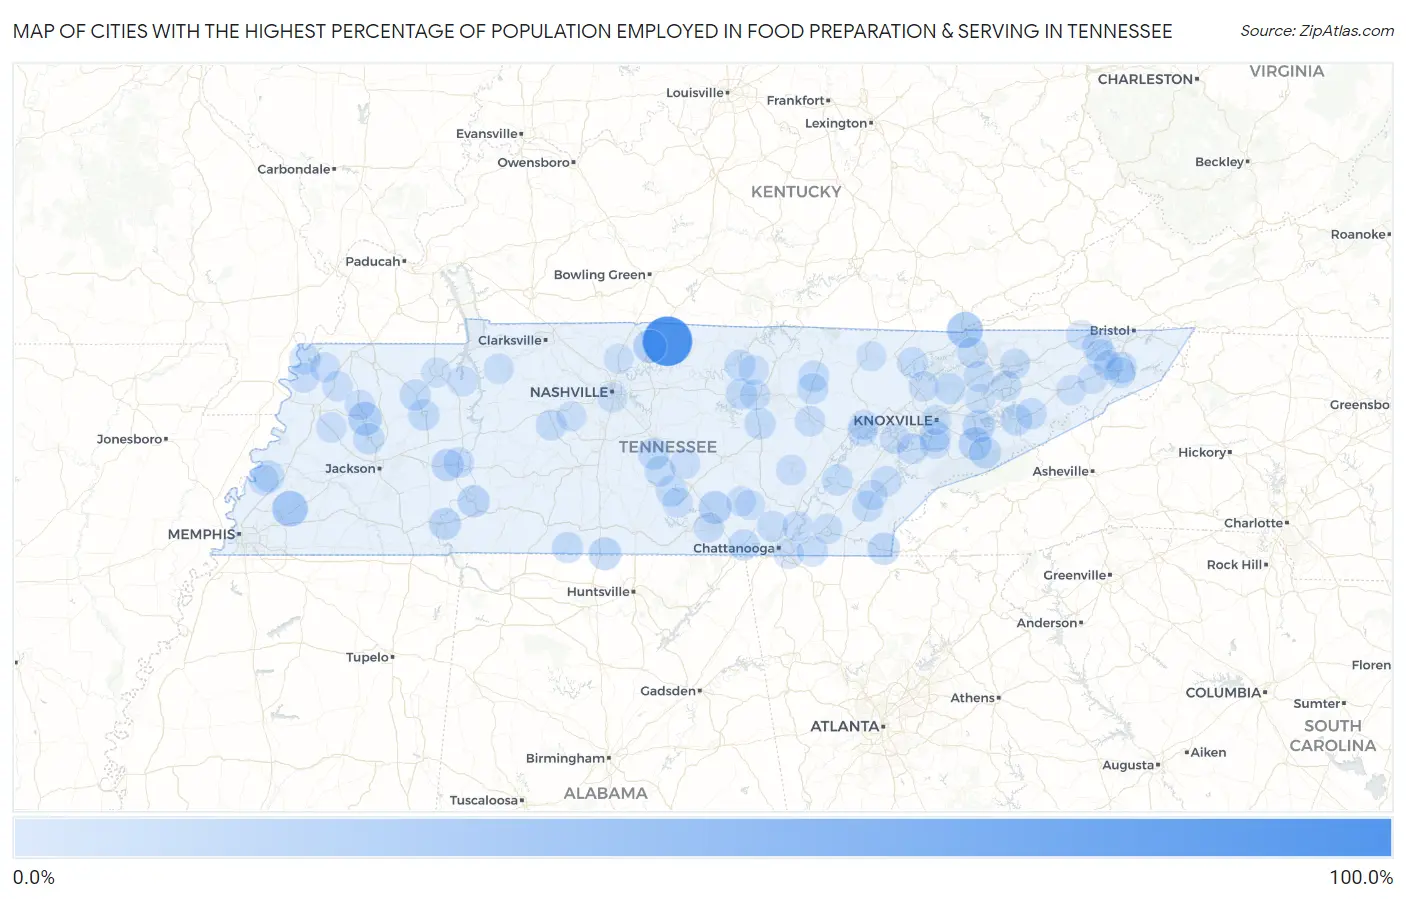
Map of Cities with the Highest Percentage of Population Employed in Food Preparation & Serving in Tennessee
0.0%
100.0%
Cities with the Highest Percentage of Population Employed in Food Preparation & Serving in Tennessee
| City | % Employed | vs State | vs National | |
| 1. | Bransford | 81.4% | 5.4%(+76.0)#1 | 5.3%(+76.1)#41 |
| 2. | Shiloh | 32.1% | 5.4%(+26.7)#2 | 5.3%(+26.8)#294 |
| 3. | Leoma | 29.1% | 5.4%(+23.7)#3 | 5.3%(+23.8)#369 |
| 4. | Cumberland Gap | 28.6% | 5.4%(+23.2)#4 | 5.3%(+23.3)#379 |
| 5. | Gallaway | 28.0% | 5.4%(+22.6)#5 | 5.3%(+22.8)#396 |
| 6. | Bon Air | 27.0% | 5.4%(+21.6)#6 | 5.3%(+21.7)#428 |
| 7. | Greenvale | 25.7% | 5.4%(+20.3)#7 | 5.3%(+20.4)#479 |
| 8. | Conasauga | 22.8% | 5.4%(+17.4)#8 | 5.3%(+17.5)#632 |
| 9. | Hickman | 22.3% | 5.4%(+16.9)#9 | 5.3%(+17.0)#653 |
| 10. | Trenton | 20.7% | 5.4%(+15.3)#10 | 5.3%(+15.4)#767 |
| 11. | Graball | 19.7% | 5.4%(+14.3)#11 | 5.3%(+14.4)#874 |
| 12. | Pelham | 17.9% | 5.4%(+12.4)#12 | 5.3%(+12.6)#1,085 |
| 13. | Pigeon Forge | 17.6% | 5.4%(+12.1)#13 | 5.3%(+12.3)#1,119 |
| 14. | Ardmore | 17.0% | 5.4%(+11.6)#14 | 5.3%(+11.7)#1,205 |
| 15. | Prospect | 16.7% | 5.4%(+11.2)#15 | 5.3%(+11.4)#1,262 |
| 16. | Sevierville | 16.2% | 5.4%(+10.8)#16 | 5.3%(+10.9)#1,353 |
| 17. | Ducktown | 15.4% | 5.4%(+9.97)#17 | 5.3%(+10.1)#1,528 |
| 18. | Clifton | 15.3% | 5.4%(+9.92)#18 | 5.3%(+10.1)#1,545 |
| 19. | Darden | 15.3% | 5.4%(+9.91)#19 | 5.3%(+10.0)#1,549 |
| 20. | Savannah | 14.9% | 5.4%(+9.45)#20 | 5.3%(+9.58)#1,669 |
| 21. | Gatlinburg | 14.4% | 5.4%(+8.97)#21 | 5.3%(+9.10)#1,797 |
| 22. | Christiana | 14.1% | 5.4%(+8.65)#22 | 5.3%(+8.78)#1,896 |
| 23. | Kahite | 13.5% | 5.4%(+8.09)#23 | 5.3%(+8.23)#2,062 |
| 24. | Rockford | 13.4% | 5.4%(+8.00)#24 | 5.3%(+8.13)#2,098 |
| 25. | Burlison | 13.3% | 5.4%(+7.91)#25 | 5.3%(+8.05)#2,125 |
| 26. | Newport | 13.0% | 5.4%(+7.63)#26 | 5.3%(+7.76)#2,233 |
| 27. | Sparta | 12.9% | 5.4%(+7.50)#27 | 5.3%(+7.63)#2,288 |
| 28. | Jasper | 12.8% | 5.4%(+7.35)#28 | 5.3%(+7.49)#2,361 |
| 29. | Humboldt | 12.5% | 5.4%(+7.10)#29 | 5.3%(+7.23)#2,474 |
| 30. | Minor Hill | 12.4% | 5.4%(+7.00)#30 | 5.3%(+7.13)#2,555 |
| 31. | Huntingdon | 12.3% | 5.4%(+6.90)#31 | 5.3%(+7.03)#2,596 |
| 32. | Mckenzie | 12.1% | 5.4%(+6.72)#32 | 5.3%(+6.86)#2,678 |
| 33. | Central | 12.1% | 5.4%(+6.72)#33 | 5.3%(+6.85)#2,680 |
| 34. | Grimsley | 12.1% | 5.4%(+6.65)#34 | 5.3%(+6.79)#2,719 |
| 35. | Normandy | 12.1% | 5.4%(+6.65)#35 | 5.3%(+6.78)#2,723 |
| 36. | Decatur | 11.5% | 5.4%(+6.13)#36 | 5.3%(+6.26)#3,040 |
| 37. | Tiptonville | 11.5% | 5.4%(+6.04)#37 | 5.3%(+6.17)#3,093 |
| 38. | Plainview | 11.4% | 5.4%(+6.02)#38 | 5.3%(+6.16)#3,097 |
| 39. | Clarkrange | 11.4% | 5.4%(+6.02)#39 | 5.3%(+6.15)#3,100 |
| 40. | Bon Aqua Junction | 11.4% | 5.4%(+6.01)#40 | 5.3%(+6.14)#3,102 |
| 41. | Etowah | 11.4% | 5.4%(+5.99)#41 | 5.3%(+6.12)#3,122 |
| 42. | John Sevier | 11.3% | 5.4%(+5.90)#42 | 5.3%(+6.03)#3,188 |
| 43. | Gray | 11.3% | 5.4%(+5.89)#43 | 5.3%(+6.02)#3,199 |
| 44. | Pine Crest | 11.2% | 5.4%(+5.81)#44 | 5.3%(+5.94)#3,247 |
| 45. | Bell Buckle | 11.2% | 5.4%(+5.81)#45 | 5.3%(+5.94)#3,248 |
| 46. | Gainesboro | 11.2% | 5.4%(+5.79)#46 | 5.3%(+5.92)#3,256 |
| 47. | Baxter | 11.1% | 5.4%(+5.67)#47 | 5.3%(+5.81)#3,338 |
| 48. | Parrottsville | 11.0% | 5.4%(+5.54)#48 | 5.3%(+5.67)#3,416 |
| 49. | La Follette | 11.0% | 5.4%(+5.53)#49 | 5.3%(+5.67)#3,419 |
| 50. | Lone Oak | 10.9% | 5.4%(+5.46)#50 | 5.3%(+5.59)#3,455 |
| 51. | Friendsville | 10.8% | 5.4%(+5.43)#51 | 5.3%(+5.56)#3,482 |
| 52. | Parsons | 10.5% | 5.4%(+5.10)#52 | 5.3%(+5.23)#3,716 |
| 53. | Cookeville | 10.4% | 5.4%(+4.98)#53 | 5.3%(+5.11)#3,797 |
| 54. | New Tazewell | 10.2% | 5.4%(+4.82)#54 | 5.3%(+4.95)#3,910 |
| 55. | Gilt Edge | 10.2% | 5.4%(+4.81)#55 | 5.3%(+4.94)#3,916 |
| 56. | Crossville | 10.2% | 5.4%(+4.76)#56 | 5.3%(+4.90)#3,955 |
| 57. | Rutledge | 10.1% | 5.4%(+4.72)#57 | 5.3%(+4.85)#3,993 |
| 58. | Morristown | 10.1% | 5.4%(+4.64)#58 | 5.3%(+4.77)#4,050 |
| 59. | Madisonville | 10.0% | 5.4%(+4.61)#59 | 5.3%(+4.74)#4,082 |
| 60. | Essary Springs | 10.0% | 5.4%(+4.58)#60 | 5.3%(+4.71)#4,119 |
| 61. | Apison | 10.0% | 5.4%(+4.56)#61 | 5.3%(+4.69)#4,134 |
| 62. | Pikeville | 9.6% | 5.4%(+4.15)#62 | 5.3%(+4.29)#4,470 |
| 63. | Lakewood Park | 9.4% | 5.4%(+3.97)#63 | 5.3%(+4.10)#4,647 |
| 64. | Finley | 9.3% | 5.4%(+3.93)#64 | 5.3%(+4.06)#4,693 |
| 65. | Big Sandy | 9.3% | 5.4%(+3.89)#65 | 5.3%(+4.03)#4,734 |
| 66. | East Ridge | 9.3% | 5.4%(+3.85)#66 | 5.3%(+3.99)#4,771 |
| 67. | Friendship | 9.2% | 5.4%(+3.77)#67 | 5.3%(+3.90)#4,850 |
| 68. | Luray | 9.2% | 5.4%(+3.74)#68 | 5.3%(+3.87)#4,877 |
| 69. | Eagleton Village | 9.1% | 5.4%(+3.70)#69 | 5.3%(+3.83)#4,923 |
| 70. | Andersonville | 9.1% | 5.4%(+3.67)#70 | 5.3%(+3.80)#4,955 |
| 71. | Lenoir City | 9.1% | 5.4%(+3.66)#71 | 5.3%(+3.79)#4,980 |
| 72. | Trimble | 9.0% | 5.4%(+3.61)#72 | 5.3%(+3.74)#5,030 |
| 73. | Colonial Heights | 9.0% | 5.4%(+3.55)#73 | 5.3%(+3.69)#5,097 |
| 74. | Lakesite | 9.0% | 5.4%(+3.54)#74 | 5.3%(+3.67)#5,119 |
| 75. | Harriman | 8.9% | 5.4%(+3.51)#75 | 5.3%(+3.65)#5,157 |
| 76. | Ridgely | 8.9% | 5.4%(+3.49)#76 | 5.3%(+3.62)#5,181 |
| 77. | Englewood | 8.9% | 5.4%(+3.49)#77 | 5.3%(+3.62)#5,187 |
| 78. | Mooresburg | 8.8% | 5.4%(+3.34)#78 | 5.3%(+3.48)#5,354 |
| 79. | Midtown | 8.7% | 5.4%(+3.27)#79 | 5.3%(+3.40)#5,454 |
| 80. | Sewanee | 8.6% | 5.4%(+3.19)#80 | 5.3%(+3.33)#5,536 |
| 81. | Tullahoma | 8.6% | 5.4%(+3.18)#81 | 5.3%(+3.31)#5,547 |
| 82. | Cleveland | 8.6% | 5.4%(+3.14)#82 | 5.3%(+3.27)#5,589 |
| 83. | Dyer | 8.5% | 5.4%(+3.12)#83 | 5.3%(+3.25)#5,618 |
| 84. | Tennessee Ridge | 8.5% | 5.4%(+3.10)#84 | 5.3%(+3.24)#5,632 |
| 85. | Knoxville | 8.5% | 5.4%(+3.08)#85 | 5.3%(+3.22)#5,660 |
| 86. | Hornbeak | 8.5% | 5.4%(+3.06)#86 | 5.3%(+3.20)#5,679 |
| 87. | Blanche | 8.3% | 5.4%(+2.84)#87 | 5.3%(+2.97)#5,989 |
| 88. | Tusculum | 8.2% | 5.4%(+2.81)#88 | 5.3%(+2.94)#6,022 |
| 89. | Dodson Branch | 8.1% | 5.4%(+2.66)#89 | 5.3%(+2.80)#6,223 |
| 90. | Fairview | 8.1% | 5.4%(+2.66)#90 | 5.3%(+2.79)#6,234 |
| 91. | New Market | 8.0% | 5.4%(+2.61)#91 | 5.3%(+2.74)#6,293 |
| 92. | Palmer | 8.0% | 5.4%(+2.61)#92 | 5.3%(+2.74)#6,300 |
| 93. | Telford | 8.0% | 5.4%(+2.59)#93 | 5.3%(+2.72)#6,319 |
| 94. | Gruetli Laager | 8.0% | 5.4%(+2.57)#94 | 5.3%(+2.71)#6,353 |
| 95. | Mount Carmel | 8.0% | 5.4%(+2.57)#95 | 5.3%(+2.70)#6,358 |
| 96. | Millersville | 8.0% | 5.4%(+2.55)#96 | 5.3%(+2.68)#6,386 |
| 97. | Paris | 7.9% | 5.4%(+2.46)#97 | 5.3%(+2.59)#6,525 |
| 98. | Berry Hill | 7.9% | 5.4%(+2.45)#98 | 5.3%(+2.58)#6,545 |
| 99. | Johnson City | 7.8% | 5.4%(+2.41)#99 | 5.3%(+2.54)#6,616 |
| 100. | Huntsville | 7.8% | 5.4%(+2.40)#100 | 5.3%(+2.53)#6,630 |
Common Questions
What are the Top 10 Cities with the Highest Percentage of Population Employed in Food Preparation & Serving in Tennessee?
Top 10 Cities with the Highest Percentage of Population Employed in Food Preparation & Serving in Tennessee are:
#1
81.4%
#2
28.6%
#3
28.0%
#4
20.7%
#5
19.7%
#6
17.9%
#7
17.6%
#8
17.0%
#9
16.2%
#10
15.4%
What city has the Highest Percentage of Population Employed in Food Preparation & Serving in Tennessee?
Bransford has the Highest Percentage of Population Employed in Food Preparation & Serving in Tennessee with 81.4%.
What is the Percentage of Population Employed in Food Preparation & Serving in the State of Tennessee?
Percentage of Population Employed in Food Preparation & Serving in Tennessee is 5.4%.
What is the Percentage of Population Employed in Food Preparation & Serving in the United States?
Percentage of Population Employed in Food Preparation & Serving in the United States is 5.3%.