Zip Codes with the Highest Percentage of Population Employed in Food Preparation & Serving in Sacramento, CA
RELATED REPORTS & OPTIONS
Food Preparation & Serving
Sacramento
Compare Zip Codes
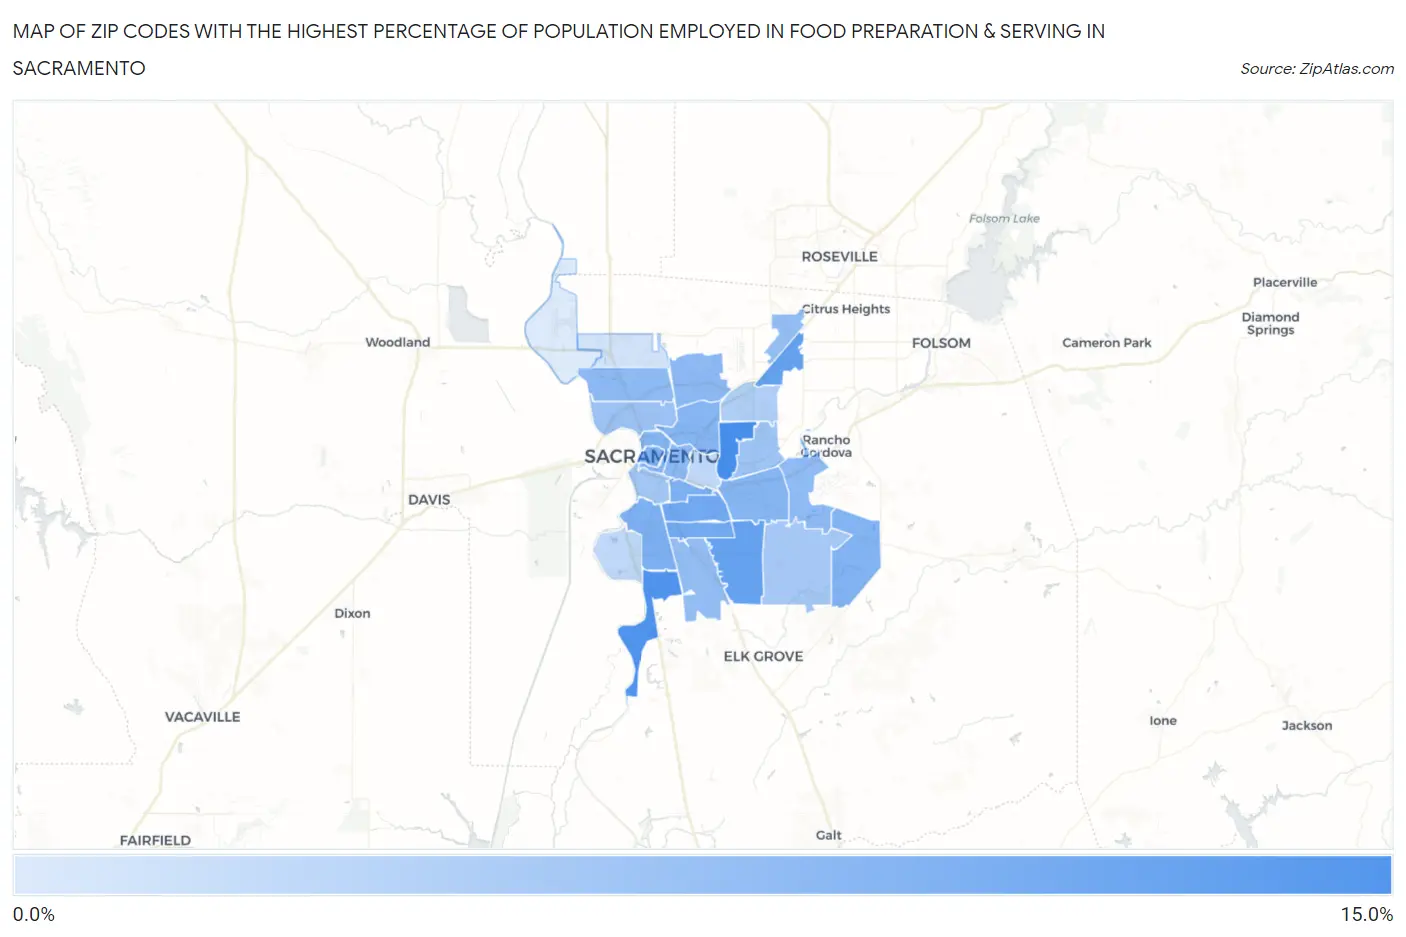
Map of Zip Codes with the Highest Percentage of Population Employed in Food Preparation & Serving in Sacramento
2.0%
10.5%
Zip Codes with the Highest Percentage of Population Employed in Food Preparation & Serving in Sacramento, CA
| Zip Code | % Employed | vs State | vs National | |
| 1. | 95825 | 10.5% | 5.4%(+5.09)#119 | 5.3%(+5.18)#2,339 |
| 2. | 95832 | 9.9% | 5.4%(+4.49)#145 | 5.3%(+4.58)#2,737 |
| 3. | 95841 | 8.7% | 5.4%(+3.33)#191 | 5.3%(+3.43)#3,823 |
| 4. | 95828 | 8.7% | 5.4%(+3.31)#193 | 5.3%(+3.41)#3,846 |
| 5. | 95820 | 8.0% | 5.4%(+2.64)#225 | 5.3%(+2.73)#4,704 |
| 6. | 95824 | 7.9% | 5.4%(+2.51)#238 | 5.3%(+2.60)#4,905 |
| 7. | 95817 | 7.4% | 5.4%(+2.06)#281 | 5.3%(+2.15)#5,671 |
| 8. | 95814 | 7.4% | 5.4%(+2.01)#287 | 5.3%(+2.11)#5,758 |
| 9. | 95822 | 7.3% | 5.4%(+1.88)#303 | 5.3%(+1.97)#6,009 |
| 10. | 95830 | 7.1% | 5.4%(+1.73)#325 | 5.3%(+1.83)#6,303 |
| 11. | 95815 | 6.9% | 5.4%(+1.49)#365 | 5.3%(+1.59)#6,881 |
| 12. | 95826 | 6.8% | 5.4%(+1.47)#370 | 5.3%(+1.56)#6,942 |
| 13. | 95811 | 6.8% | 5.4%(+1.41)#379 | 5.3%(+1.50)#7,094 |
| 14. | 95838 | 6.4% | 5.4%(+1.06)#452 | 5.3%(+1.16)#8,020 |
| 15. | 95816 | 6.4% | 5.4%(+1.04)#457 | 5.3%(+1.14)#8,080 |
| 16. | 95827 | 6.3% | 5.4%(+0.917)#481 | 5.3%(+1.01)#8,434 |
| 17. | 95834 | 6.3% | 5.4%(+0.882)#490 | 5.3%(+0.978)#8,528 |
| 18. | 95842 | 6.1% | 5.4%(+0.731)#516 | 5.3%(+0.827)#8,981 |
| 19. | 95823 | 6.0% | 5.4%(+0.660)#533 | 5.3%(+0.756)#9,198 |
| 20. | 95833 | 5.6% | 5.4%(+0.239)#630 | 5.3%(+0.335)#10,637 |
| 21. | 95864 | 5.4% | 5.4%(+0.036)#680 | 5.3%(+0.132)#11,349 |
| 22. | 95818 | 5.1% | 5.4%(-0.240)#741 | 5.3%(-0.143)#12,388 |
| 23. | 95829 | 5.1% | 5.4%(-0.295)#760 | 5.3%(-0.199)#12,588 |
| 24. | 95821 | 4.5% | 5.4%(-0.844)#895 | 5.3%(-0.747)#14,861 |
| 25. | 95831 | 3.6% | 5.4%(-1.75)#1,096 | 5.3%(-1.65)#18,628 |
| 26. | 95819 | 3.6% | 5.4%(-1.80)#1,105 | 5.3%(-1.71)#18,872 |
| 27. | 95835 | 2.5% | 5.4%(-2.83)#1,303 | 5.3%(-2.74)#22,984 |
| 28. | 95837 | 2.0% | 5.4%(-3.42)#1,393 | 5.3%(-3.33)#24,817 |
1
Common Questions
What are the Top 10 Zip Codes with the Highest Percentage of Population Employed in Food Preparation & Serving in Sacramento, CA?
Top 10 Zip Codes with the Highest Percentage of Population Employed in Food Preparation & Serving in Sacramento, CA are:
What zip code has the Highest Percentage of Population Employed in Food Preparation & Serving in Sacramento, CA?
95825 has the Highest Percentage of Population Employed in Food Preparation & Serving in Sacramento, CA with 10.5%.
What is the Percentage of Population Employed in Food Preparation & Serving in Sacramento, CA?
Percentage of Population Employed in Food Preparation & Serving in Sacramento is 6.0%.
What is the Percentage of Population Employed in Food Preparation & Serving in California?
Percentage of Population Employed in Food Preparation & Serving in California is 5.4%.
What is the Percentage of Population Employed in Food Preparation & Serving in the United States?
Percentage of Population Employed in Food Preparation & Serving in the United States is 5.3%.