Zip Codes with the Highest Percentage of Population Employed in Food Preparation & Serving in San Francisco, CA
RELATED REPORTS & OPTIONS
Food Preparation & Serving
San Francisco
Compare Zip Codes
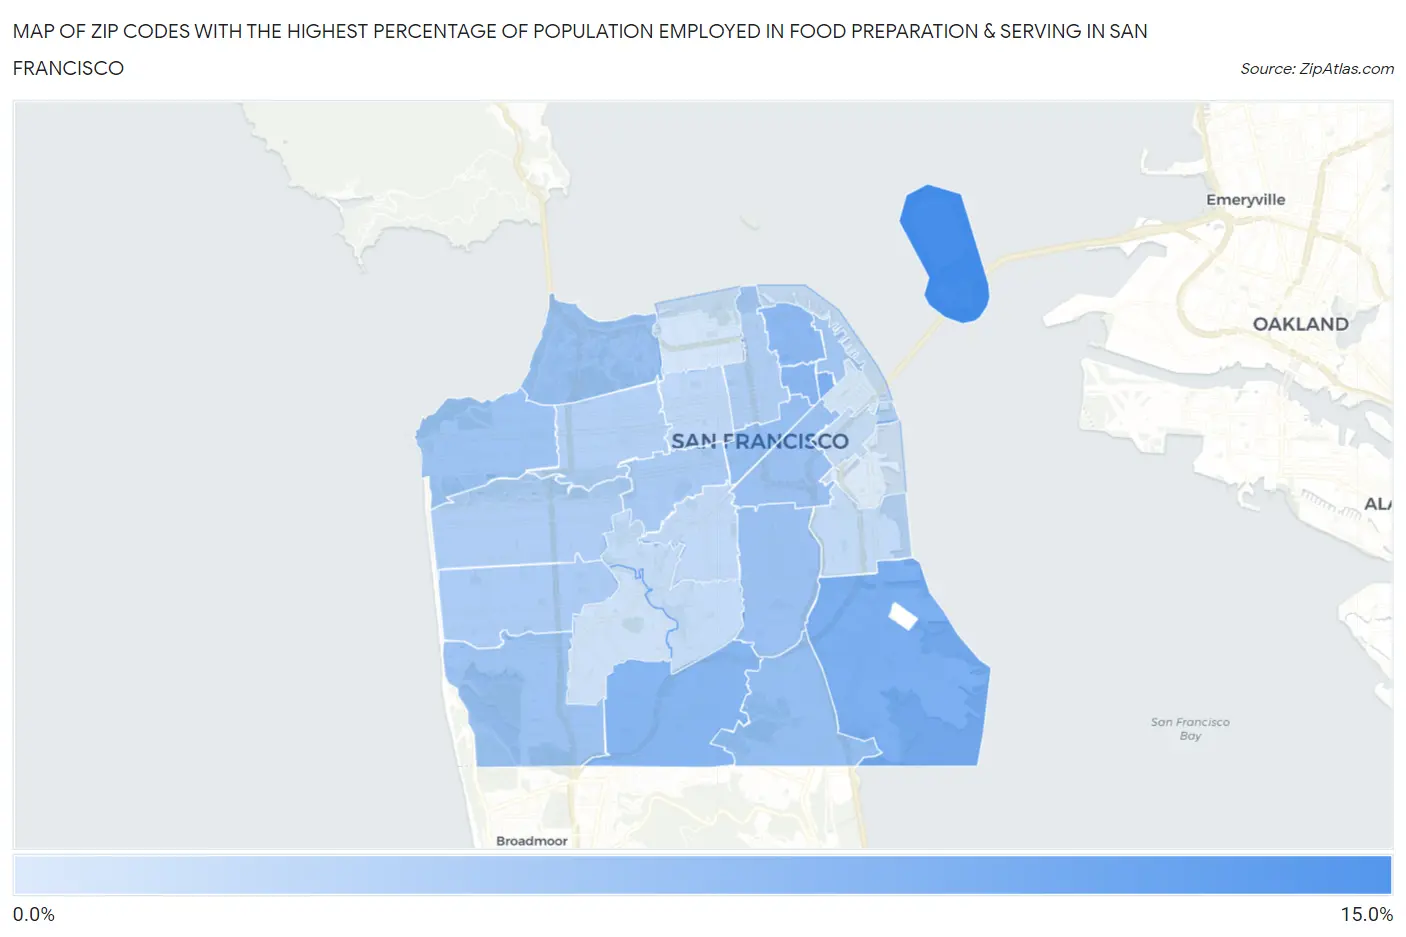
Map of Zip Codes with the Highest Percentage of Population Employed in Food Preparation & Serving in San Francisco
0.015%
13.7%
Zip Codes with the Highest Percentage of Population Employed in Food Preparation & Serving in San Francisco, CA
| Zip Code | % Employed | vs State | vs National | |
| 1. | 94130 | 13.7% | 5.4%(+8.33)#65 | 5.3%(+8.43)#1,230 |
| 2. | 94124 | 8.7% | 5.4%(+3.29)#196 | 5.3%(+3.39)#3,889 |
| 3. | 94104 | 8.4% | 5.4%(+2.99)#202 | 5.3%(+3.08)#4,213 |
| 4. | 94112 | 7.6% | 5.4%(+2.24)#264 | 5.3%(+2.34)#5,341 |
| 5. | 94108 | 7.4% | 5.4%(+2.00)#290 | 5.3%(+2.09)#5,782 |
| 6. | 94133 | 7.1% | 5.4%(+1.76)#321 | 5.3%(+1.86)#6,235 |
| 7. | 94134 | 6.4% | 5.4%(+0.968)#473 | 5.3%(+1.06)#8,277 |
| 8. | 94102 | 6.1% | 5.4%(+0.708)#527 | 5.3%(+0.805)#9,057 |
| 9. | 94129 | 6.0% | 5.4%(+0.612)#545 | 5.3%(+0.709)#9,361 |
| 10. | 94103 | 5.6% | 5.4%(+0.254)#625 | 5.3%(+0.351)#10,571 |
| 11. | 94110 | 5.6% | 5.4%(+0.239)#629 | 5.3%(+0.336)#10,635 |
| 12. | 94121 | 5.5% | 5.4%(+0.109)#663 | 5.3%(+0.206)#11,093 |
| 13. | 94132 | 5.4% | 5.4%(+0.033)#683 | 5.3%(+0.130)#11,361 |
| 14. | 94111 | 5.1% | 5.4%(-0.296)#764 | 5.3%(-0.200)#12,592 |
| 15. | 94117 | 4.4% | 5.4%(-1.00)#941 | 5.3%(-0.908)#15,519 |
| 16. | 94116 | 4.3% | 5.4%(-1.09)#969 | 5.3%(-0.998)#15,934 |
| 17. | 94122 | 4.0% | 5.4%(-1.37)#1,020 | 5.3%(-1.27)#17,069 |
| 18. | 94109 | 4.0% | 5.4%(-1.38)#1,023 | 5.3%(-1.29)#17,144 |
| 19. | 94118 | 3.6% | 5.4%(-1.78)#1,100 | 5.3%(-1.68)#18,771 |
| 20. | 94115 | 2.7% | 5.4%(-2.67)#1,275 | 5.3%(-2.57)#22,377 |
| 21. | 94114 | 2.4% | 5.4%(-3.02)#1,333 | 5.3%(-2.93)#23,583 |
| 22. | 94107 | 2.3% | 5.4%(-3.12)#1,350 | 5.3%(-3.02)#23,912 |
| 23. | 94131 | 2.0% | 5.4%(-3.36)#1,382 | 5.3%(-3.26)#24,630 |
| 24. | 94127 | 1.2% | 5.4%(-4.21)#1,458 | 5.3%(-4.11)#26,650 |
| 25. | 94123 | 0.89% | 5.4%(-4.49)#1,473 | 5.3%(-4.39)#27,161 |
| 26. | 94105 | 0.74% | 5.4%(-4.64)#1,481 | 5.3%(-4.55)#27,401 |
| 27. | 94158 | 0.015% | 5.4%(-5.37)#1,505 | 5.3%(-5.27)#27,943 |
1
Common Questions
What are the Top 10 Zip Codes with the Highest Percentage of Population Employed in Food Preparation & Serving in San Francisco, CA?
Top 10 Zip Codes with the Highest Percentage of Population Employed in Food Preparation & Serving in San Francisco, CA are:
What zip code has the Highest Percentage of Population Employed in Food Preparation & Serving in San Francisco, CA?
94130 has the Highest Percentage of Population Employed in Food Preparation & Serving in San Francisco, CA with 13.7%.
What is the Percentage of Population Employed in Food Preparation & Serving in San Francisco, CA?
Percentage of Population Employed in Food Preparation & Serving in San Francisco is 4.6%.
What is the Percentage of Population Employed in Food Preparation & Serving in California?
Percentage of Population Employed in Food Preparation & Serving in California is 5.4%.
What is the Percentage of Population Employed in Food Preparation & Serving in the United States?
Percentage of Population Employed in Food Preparation & Serving in the United States is 5.3%.