Cities with the Highest Percentage of Population Employed in Food Preparation & Serving in Colorado
RELATED REPORTS & OPTIONS
Food Preparation & Serving
Colorado
Compare Cities
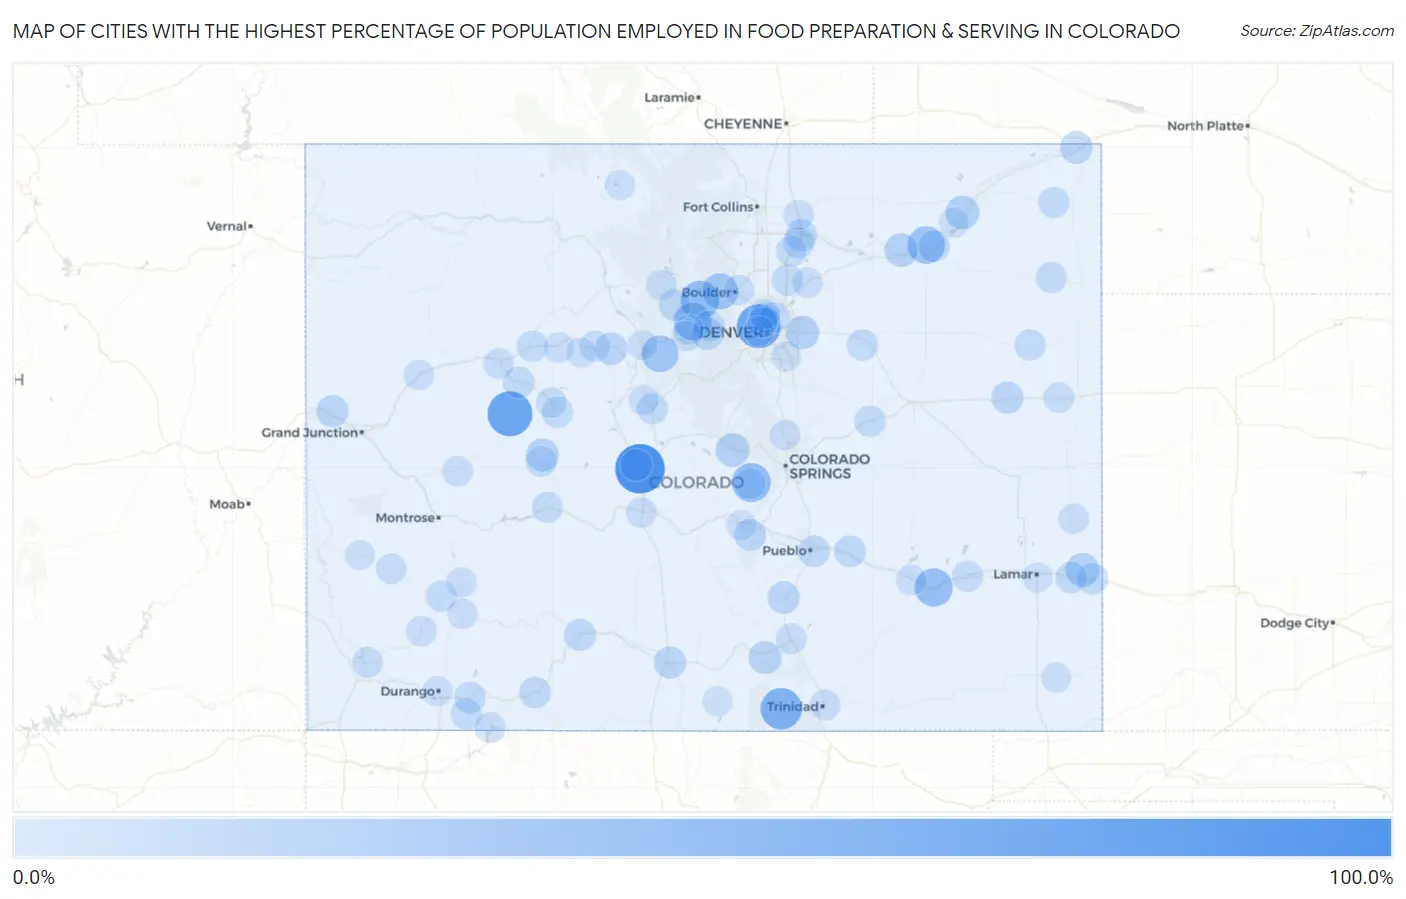
Map of Cities with the Highest Percentage of Population Employed in Food Preparation & Serving in Colorado
0.0%
100.0%
Cities with the Highest Percentage of Population Employed in Food Preparation & Serving in Colorado
| City | % Employed | vs State | vs National | |
| 1. | Johnson Village | 81.6% | 5.2%(+76.4)#1 | 5.3%(+76.3)#40 |
| 2. | Redstone | 63.1% | 5.2%(+57.9)#2 | 5.3%(+57.8)#64 |
| 3. | Lakeside | 60.0% | 5.2%(+54.8)#3 | 5.3%(+54.7)#73 |
| 4. | Weston | 50.0% | 5.2%(+44.8)#4 | 5.3%(+44.7)#114 |
| 5. | Goldfield | 40.3% | 5.2%(+35.1)#5 | 5.3%(+35.0)#186 |
| 6. | Eldora | 38.7% | 5.2%(+33.5)#6 | 5.3%(+33.4)#201 |
| 7. | North La Junta | 37.0% | 5.2%(+31.8)#7 | 5.3%(+31.7)#220 |
| 8. | St Mary S | 36.3% | 5.2%(+31.1)#8 | 5.3%(+31.0)#231 |
| 9. | Snyder | 35.0% | 5.2%(+29.8)#9 | 5.3%(+29.7)#252 |
| 10. | Keystone | 32.6% | 5.2%(+27.4)#10 | 5.3%(+27.3)#289 |
| 11. | Sugarloaf | 30.0% | 5.2%(+24.8)#11 | 5.3%(+24.7)#344 |
| 12. | Briggsdale | 26.6% | 5.2%(+21.4)#12 | 5.3%(+21.3)#446 |
| 13. | Atwood | 21.6% | 5.2%(+16.4)#13 | 5.3%(+16.3)#705 |
| 14. | Hartman | 20.8% | 5.2%(+15.7)#14 | 5.3%(+15.5)#753 |
| 15. | Florissant | 20.6% | 5.2%(+15.5)#15 | 5.3%(+15.3)#771 |
| 16. | Blue Sky | 20.4% | 5.2%(+15.2)#16 | 5.3%(+15.1)#794 |
| 17. | Aetna Estates | 19.8% | 5.2%(+14.6)#17 | 5.3%(+14.5)#867 |
| 18. | Mount Crested Butte | 18.3% | 5.2%(+13.2)#18 | 5.3%(+13.0)#1,025 |
| 19. | La Veta | 17.9% | 5.2%(+12.8)#19 | 5.3%(+12.7)#1,077 |
| 20. | Vail | 16.5% | 5.2%(+11.3)#20 | 5.3%(+11.2)#1,299 |
| 21. | Julesburg | 16.2% | 5.2%(+11.1)#21 | 5.3%(+10.9)#1,346 |
| 22. | Colorado City | 16.1% | 5.2%(+10.9)#22 | 5.3%(+10.8)#1,392 |
| 23. | Loma | 15.4% | 5.2%(+10.2)#23 | 5.3%(+10.1)#1,525 |
| 24. | Alamosa East | 15.3% | 5.2%(+10.2)#24 | 5.3%(+10.1)#1,544 |
| 25. | Idaho Springs | 14.7% | 5.2%(+9.51)#25 | 5.3%(+9.40)#1,715 |
| 26. | Coal Creek | 14.6% | 5.2%(+9.41)#26 | 5.3%(+9.31)#1,736 |
| 27. | Seibert | 14.6% | 5.2%(+9.40)#27 | 5.3%(+9.30)#1,742 |
| 28. | South Fork | 14.5% | 5.2%(+9.36)#28 | 5.3%(+9.26)#1,755 |
| 29. | Buena Vista | 14.4% | 5.2%(+9.21)#29 | 5.3%(+9.11)#1,796 |
| 30. | Fraser | 14.1% | 5.2%(+8.92)#30 | 5.3%(+8.82)#1,881 |
| 31. | Blende | 14.0% | 5.2%(+8.83)#31 | 5.3%(+8.73)#1,914 |
| 32. | Garden City | 13.7% | 5.2%(+8.52)#32 | 5.3%(+8.41)#2,006 |
| 33. | Boone | 13.6% | 5.2%(+8.40)#33 | 5.3%(+8.29)#2,043 |
| 34. | Hillrose | 13.5% | 5.2%(+8.28)#34 | 5.3%(+8.18)#2,077 |
| 35. | Pagosa Springs | 13.5% | 5.2%(+8.27)#35 | 5.3%(+8.17)#2,081 |
| 36. | Holly | 13.3% | 5.2%(+8.09)#36 | 5.3%(+7.99)#2,151 |
| 37. | Mulford | 13.2% | 5.2%(+8.06)#37 | 5.3%(+7.96)#2,163 |
| 38. | Granada | 13.0% | 5.2%(+7.83)#38 | 5.3%(+7.72)#2,256 |
| 39. | La Salle | 12.8% | 5.2%(+7.61)#39 | 5.3%(+7.51)#2,350 |
| 40. | Echo Hills | 12.6% | 5.2%(+7.41)#40 | 5.3%(+7.30)#2,448 |
| 41. | Simla | 12.5% | 5.2%(+7.32)#41 | 5.3%(+7.21)#2,488 |
| 42. | Peoria | 12.5% | 5.2%(+7.32)#42 | 5.3%(+7.21)#2,509 |
| 43. | Bayfield | 12.5% | 5.2%(+7.31)#43 | 5.3%(+7.21)#2,530 |
| 44. | Fairplay | 12.0% | 5.2%(+6.84)#44 | 5.3%(+6.74)#2,745 |
| 45. | Dotsero | 12.0% | 5.2%(+6.79)#45 | 5.3%(+6.68)#2,781 |
| 46. | Central City | 12.0% | 5.2%(+6.77)#46 | 5.3%(+6.67)#2,791 |
| 47. | Eckley | 11.9% | 5.2%(+6.75)#47 | 5.3%(+6.65)#2,808 |
| 48. | Joes | 11.9% | 5.2%(+6.72)#48 | 5.3%(+6.62)#2,825 |
| 49. | Gunnison | 11.7% | 5.2%(+6.56)#49 | 5.3%(+6.45)#2,916 |
| 50. | Aspen | 11.7% | 5.2%(+6.52)#50 | 5.3%(+6.41)#2,947 |
| 51. | Fort Lupton | 11.6% | 5.2%(+6.45)#51 | 5.3%(+6.34)#2,985 |
| 52. | Victor | 11.6% | 5.2%(+6.40)#52 | 5.3%(+6.30)#3,018 |
| 53. | Mountain Village | 11.5% | 5.2%(+6.32)#53 | 5.3%(+6.22)#3,064 |
| 54. | Las Animas | 11.3% | 5.2%(+6.12)#54 | 5.3%(+6.01)#3,205 |
| 55. | Derby | 11.1% | 5.2%(+5.96)#55 | 5.3%(+5.86)#3,291 |
| 56. | Paoli | 11.1% | 5.2%(+5.93)#56 | 5.3%(+5.83)#3,326 |
| 57. | Crested Butte | 11.0% | 5.2%(+5.83)#57 | 5.3%(+5.73)#3,387 |
| 58. | Ignacio | 10.9% | 5.2%(+5.71)#58 | 5.3%(+5.61)#3,446 |
| 59. | Avon | 10.5% | 5.2%(+5.36)#59 | 5.3%(+5.25)#3,686 |
| 60. | Walsenburg | 10.5% | 5.2%(+5.31)#60 | 5.3%(+5.21)#3,733 |
| 61. | Gilcrest | 10.3% | 5.2%(+5.08)#61 | 5.3%(+4.97)#3,885 |
| 62. | Dolores | 10.1% | 5.2%(+4.88)#62 | 5.3%(+4.77)#4,051 |
| 63. | Arboles | 10.0% | 5.2%(+4.82)#63 | 5.3%(+4.71)#4,097 |
| 64. | Trinidad | 9.8% | 5.2%(+4.67)#64 | 5.3%(+4.56)#4,224 |
| 65. | Glenwood Springs | 9.8% | 5.2%(+4.60)#65 | 5.3%(+4.49)#4,281 |
| 66. | Bethune | 9.8% | 5.2%(+4.57)#66 | 5.3%(+4.47)#4,304 |
| 67. | Woody Creek | 9.7% | 5.2%(+4.50)#67 | 5.3%(+4.39)#4,374 |
| 68. | Norwood | 9.6% | 5.2%(+4.46)#68 | 5.3%(+4.36)#4,400 |
| 69. | Rico | 9.6% | 5.2%(+4.41)#69 | 5.3%(+4.31)#4,455 |
| 70. | Sheridan Lake | 9.5% | 5.2%(+4.34)#70 | 5.3%(+4.24)#4,520 |
| 71. | Gleneagle | 9.5% | 5.2%(+4.33)#71 | 5.3%(+4.22)#4,530 |
| 72. | Boulder | 9.5% | 5.2%(+4.31)#72 | 5.3%(+4.21)#4,541 |
| 73. | Hotchkiss | 9.4% | 5.2%(+4.24)#73 | 5.3%(+4.14)#4,607 |
| 74. | Granby | 9.4% | 5.2%(+4.24)#74 | 5.3%(+4.13)#4,618 |
| 75. | Poncha Springs | 9.4% | 5.2%(+4.23)#75 | 5.3%(+4.12)#4,627 |
| 76. | Eagle | 9.4% | 5.2%(+4.22)#76 | 5.3%(+4.12)#4,631 |
| 77. | Hudson | 9.3% | 5.2%(+4.09)#77 | 5.3%(+3.99)#4,769 |
| 78. | Parachute | 9.1% | 5.2%(+3.94)#78 | 5.3%(+3.83)#4,921 |
| 79. | Rocky Ford | 9.0% | 5.2%(+3.86)#79 | 5.3%(+3.75)#5,016 |
| 80. | Sherrelwood | 9.0% | 5.2%(+3.85)#80 | 5.3%(+3.74)#5,027 |
| 81. | Federal Heights | 9.0% | 5.2%(+3.82)#81 | 5.3%(+3.71)#5,061 |
| 82. | Edgewater | 9.0% | 5.2%(+3.78)#82 | 5.3%(+3.68)#5,103 |
| 83. | Alma | 8.9% | 5.2%(+3.72)#83 | 5.3%(+3.61)#5,196 |
| 84. | Silverton | 8.8% | 5.2%(+3.63)#84 | 5.3%(+3.52)#5,307 |
| 85. | Ouray | 8.8% | 5.2%(+3.58)#85 | 5.3%(+3.48)#5,357 |
| 86. | Eaton | 8.7% | 5.2%(+3.54)#86 | 5.3%(+3.43)#5,401 |
| 87. | Georgetown | 8.6% | 5.2%(+3.44)#87 | 5.3%(+3.34)#5,516 |
| 88. | Berkley | 8.5% | 5.2%(+3.37)#88 | 5.3%(+3.26)#5,603 |
| 89. | Empire | 8.5% | 5.2%(+3.30)#89 | 5.3%(+3.19)#5,683 |
| 90. | Vilas | 8.3% | 5.2%(+3.15)#90 | 5.3%(+3.05)#5,892 |
| 91. | Walden | 8.3% | 5.2%(+3.10)#91 | 5.3%(+3.00)#5,958 |
| 92. | Lamar | 8.2% | 5.2%(+2.99)#92 | 5.3%(+2.88)#6,108 |
| 93. | Edwards | 8.2% | 5.2%(+2.97)#93 | 5.3%(+2.87)#6,135 |
| 94. | San Luis | 8.1% | 5.2%(+2.96)#94 | 5.3%(+2.85)#6,149 |
| 95. | Durango | 8.1% | 5.2%(+2.94)#95 | 5.3%(+2.84)#6,170 |
| 96. | Dove Valley | 8.0% | 5.2%(+2.83)#96 | 5.3%(+2.73)#6,315 |
| 97. | Silverthorne | 8.0% | 5.2%(+2.79)#97 | 5.3%(+2.68)#6,384 |
| 98. | Lincoln Park | 7.9% | 5.2%(+2.74)#98 | 5.3%(+2.64)#6,452 |
| 99. | Naturita | 7.8% | 5.2%(+2.63)#99 | 5.3%(+2.53)#6,639 |
| 100. | Merino | 7.8% | 5.2%(+2.60)#100 | 5.3%(+2.50)#6,692 |
Common Questions
What are the Top 10 Cities with the Highest Percentage of Population Employed in Food Preparation & Serving in Colorado?
Top 10 Cities with the Highest Percentage of Population Employed in Food Preparation & Serving in Colorado are:
#1
81.6%
#2
63.1%
#3
60.0%
#4
50.0%
#5
40.3%
#6
38.7%
#7
37.0%
#8
36.3%
#9
35.0%
#10
32.6%
What city has the Highest Percentage of Population Employed in Food Preparation & Serving in Colorado?
Johnson Village has the Highest Percentage of Population Employed in Food Preparation & Serving in Colorado with 81.6%.
What is the Percentage of Population Employed in Food Preparation & Serving in the State of Colorado?
Percentage of Population Employed in Food Preparation & Serving in Colorado is 5.2%.
What is the Percentage of Population Employed in Food Preparation & Serving in the United States?
Percentage of Population Employed in Food Preparation & Serving in the United States is 5.3%.