Mountain Gate, CA Map & Demographics
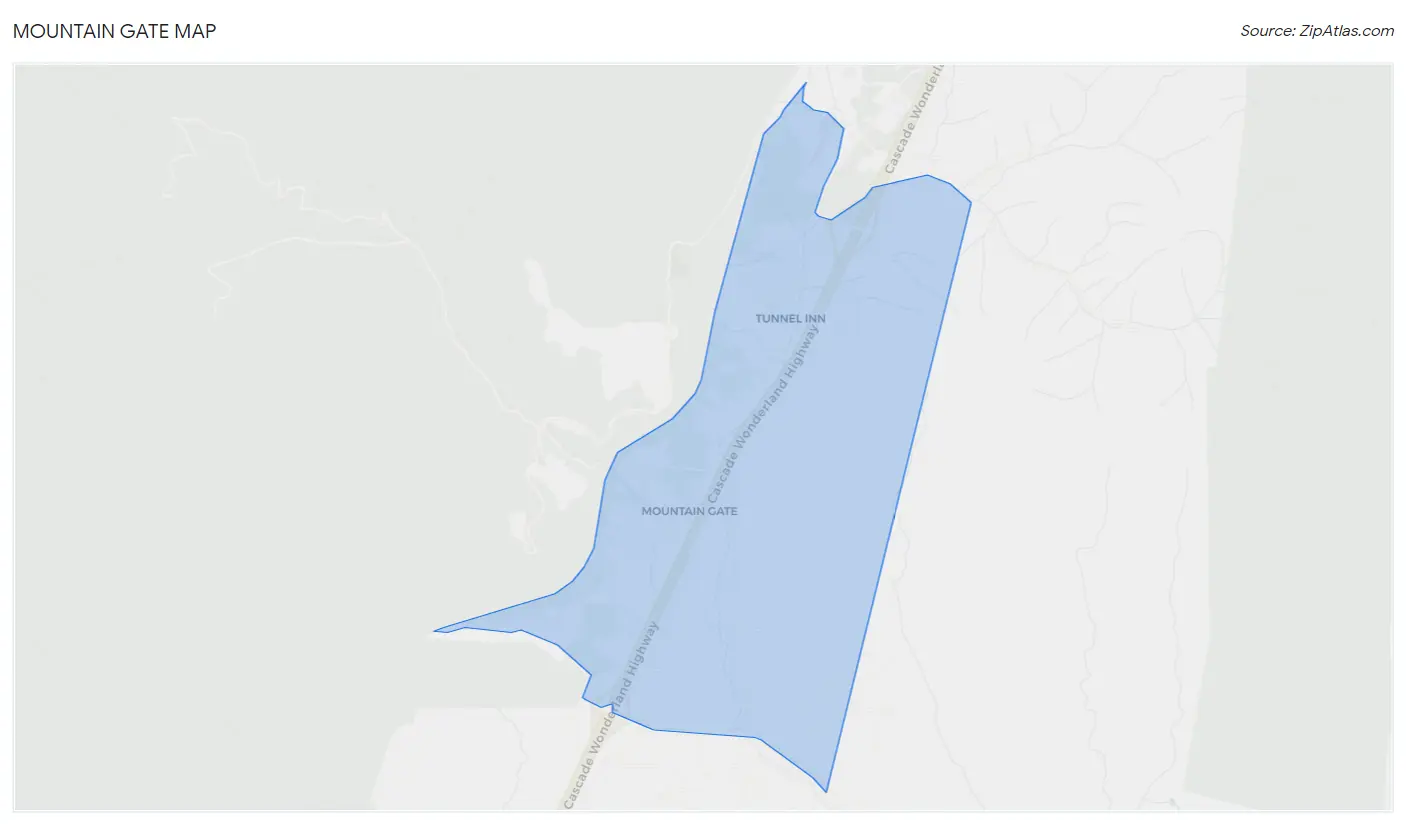
Mountain Gate Map
Mountain Gate Overview
$21,692
PER CAPITA INCOME
$24,250
AVG HOUSEHOLD INCOME
$5,814
FAMILY INCOME DEFICIT
0.47
INEQUALITY / GINI INDEX
819
TOTAL POPULATION
468
MALE POPULATION
351
FEMALE POPULATION
133.33
MALES / 100 FEMALES
75.00
FEMALES / 100 MALES
57.3
MEDIAN AGE
3.1
AVG FAMILY SIZE
1.9
AVG HOUSEHOLD SIZE
246
LABOR FORCE [ PEOPLE ]
37.0%
PERCENT IN LABOR FORCE
Income in Mountain Gate
Income Overview in Mountain Gate
| Characteristic | Number | Measure |
| Per Capita Income | 819 | $21,692 |
| Median Family Income | 167 | $0 |
| Mean Family Income | 167 | $66,563 |
| Median Household Income | 421 | $24,250 |
| Mean Household Income | 421 | $41,927 |
| Income Deficit | 167 | $5,814 |
| Wage / Income Gap (%) | 819 | 0.00% |
| Wage / Income Gap ($) | 819 | 100.00¢ per $1 |
| Gini / Inequality Index | 819 | 0.47 |
Earnings by Sex in Mountain Gate
| Sex | Number | Average Earnings |
| Male | 210 (73.7%) | $0 |
| Female | 75 (26.3%) | $0 |
| Total | 285 (100.0%) | $0 |
Earnings by Sex by Income Bracket in Mountain Gate
The most common earnings brackets in Mountain Gate are $7,500 to $9,999 for men (65 | 30.9%) and $17,500 to $19,999 for women (29 | 38.7%).
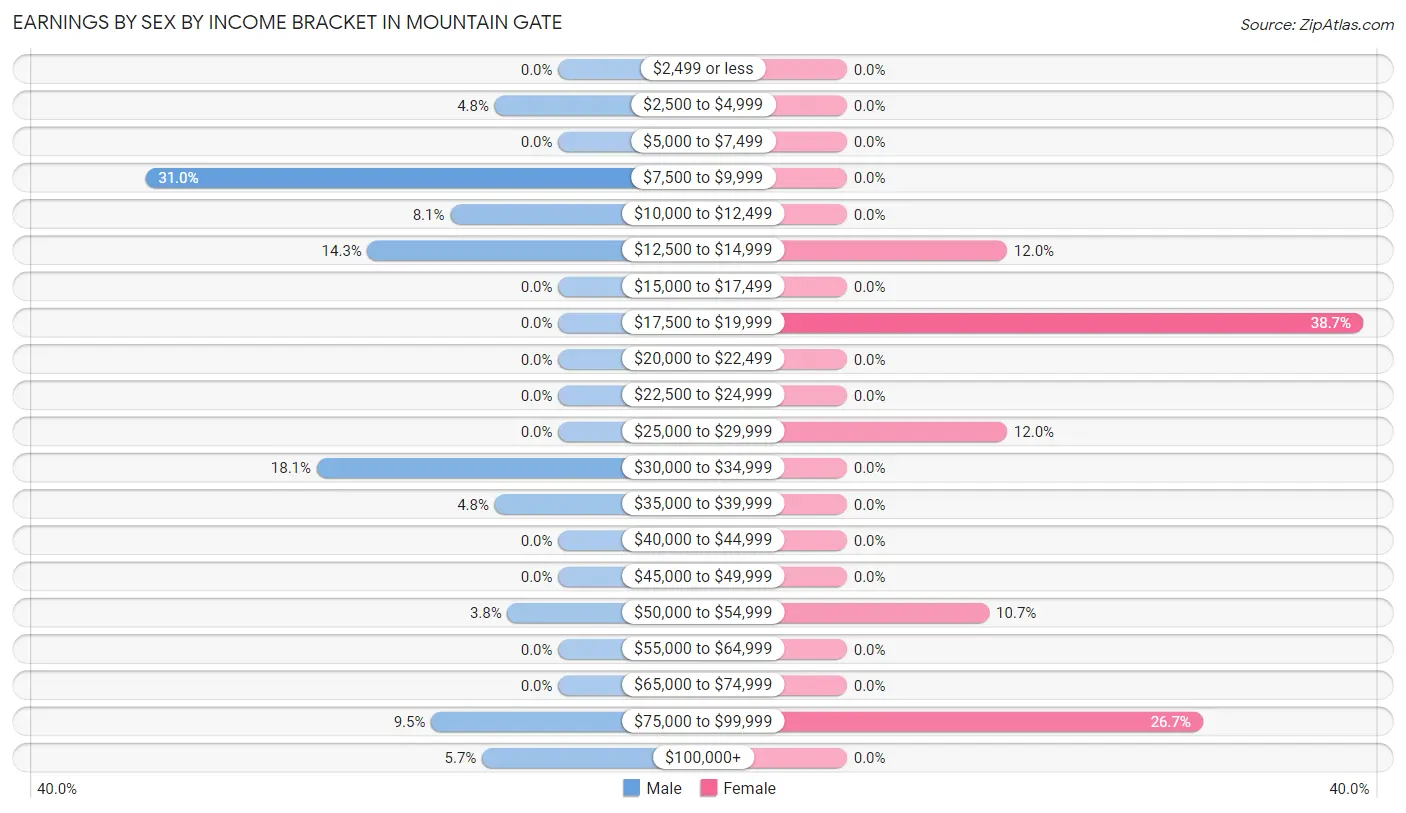
| Income | Male | Female |
| $2,499 or less | 0 (0.0%) | 0 (0.0%) |
| $2,500 to $4,999 | 10 (4.8%) | 0 (0.0%) |
| $5,000 to $7,499 | 0 (0.0%) | 0 (0.0%) |
| $7,500 to $9,999 | 65 (30.9%) | 0 (0.0%) |
| $10,000 to $12,499 | 17 (8.1%) | 0 (0.0%) |
| $12,500 to $14,999 | 30 (14.3%) | 9 (12.0%) |
| $15,000 to $17,499 | 0 (0.0%) | 0 (0.0%) |
| $17,500 to $19,999 | 0 (0.0%) | 29 (38.7%) |
| $20,000 to $22,499 | 0 (0.0%) | 0 (0.0%) |
| $22,500 to $24,999 | 0 (0.0%) | 0 (0.0%) |
| $25,000 to $29,999 | 0 (0.0%) | 9 (12.0%) |
| $30,000 to $34,999 | 38 (18.1%) | 0 (0.0%) |
| $35,000 to $39,999 | 10 (4.8%) | 0 (0.0%) |
| $40,000 to $44,999 | 0 (0.0%) | 0 (0.0%) |
| $45,000 to $49,999 | 0 (0.0%) | 0 (0.0%) |
| $50,000 to $54,999 | 8 (3.8%) | 8 (10.7%) |
| $55,000 to $64,999 | 0 (0.0%) | 0 (0.0%) |
| $65,000 to $74,999 | 0 (0.0%) | 0 (0.0%) |
| $75,000 to $99,999 | 20 (9.5%) | 20 (26.7%) |
| $100,000+ | 12 (5.7%) | 0 (0.0%) |
| Total | 210 (100.0%) | 75 (100.0%) |
Earnings by Sex by Educational Attainment in Mountain Gate
| Educational Attainment | Male Income | Female Income |
| Less than High School | - | - |
| High School Diploma | - | - |
| College or Associate's Degree | - | - |
| Bachelor's Degree | - | - |
| Graduate Degree | - | - |
| Total | - | - |
Family Income in Mountain Gate
Family Income Brackets in Mountain Gate
According to the Mountain Gate family income data, there are 46 families falling into the $25,000 to $34,999 income range, which is the most common income bracket and makes up 27.5% of all families.
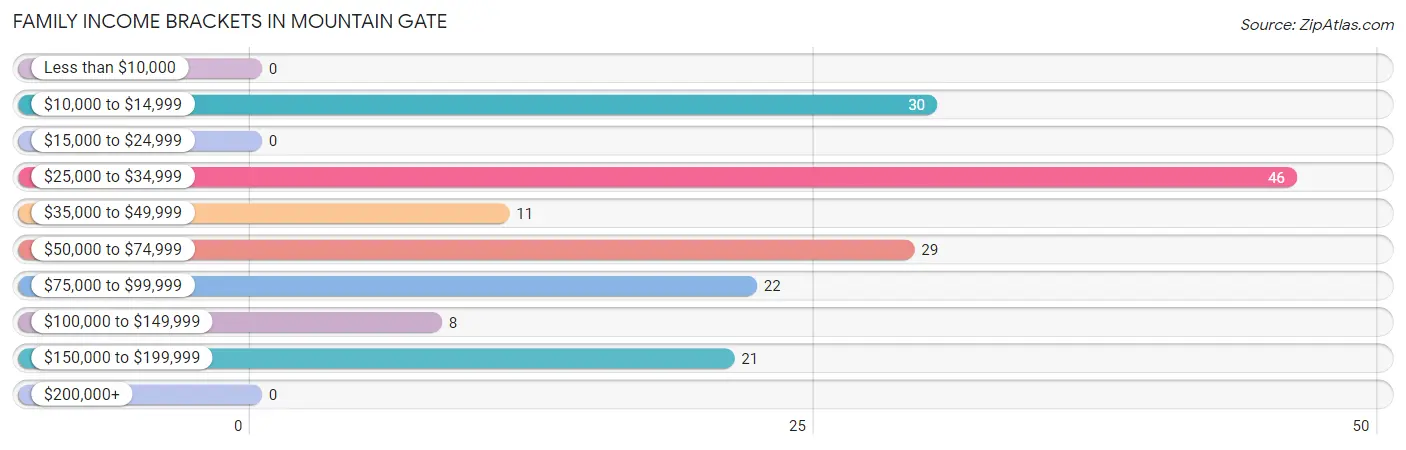
| Income Bracket | # Families | % Families |
| Less than $10,000 | 0 | 0.0% |
| $10,000 to $14,999 | 30 | 18.0% |
| $15,000 to $24,999 | 0 | 0.0% |
| $25,000 to $34,999 | 46 | 27.5% |
| $35,000 to $49,999 | 11 | 6.6% |
| $50,000 to $74,999 | 29 | 17.4% |
| $75,000 to $99,999 | 22 | 13.2% |
| $100,000 to $149,999 | 8 | 4.8% |
| $150,000 to $199,999 | 21 | 12.6% |
| $200,000+ | 0 | 0.0% |
Family Income by Famaliy Size in Mountain Gate
2-person families (103 | 61.7%) account for the highest median family income in Mountain Gate with $65,417 per family, while 2-person families (103 | 61.7%) have the highest median income of $32,708 per family member.
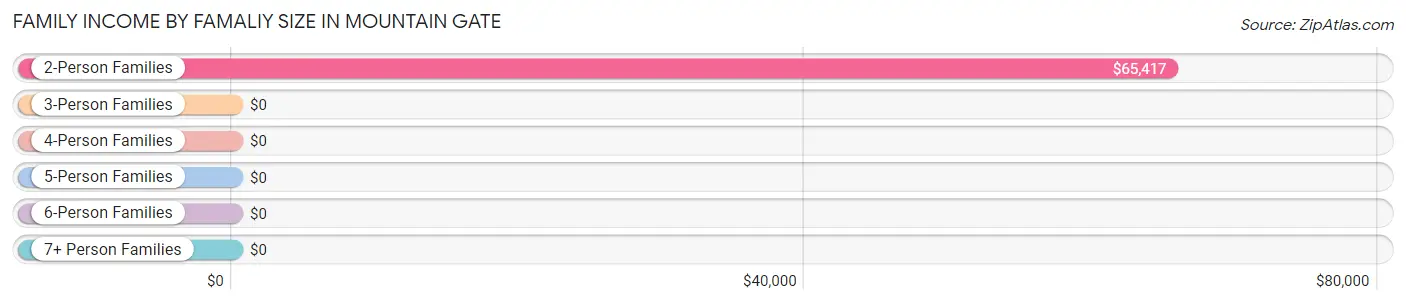
| Income Bracket | # Families | Median Income |
| 2-Person Families | 103 (61.7%) | $65,417 |
| 3-Person Families | 10 (6.0%) | $0 |
| 4-Person Families | 17 (10.2%) | $0 |
| 5-Person Families | 29 (17.4%) | $0 |
| 6-Person Families | 0 (0.0%) | $0 |
| 7+ Person Families | 8 (4.8%) | $0 |
| Total | 167 (100.0%) | $0 |
Family Income by Number of Earners in Mountain Gate
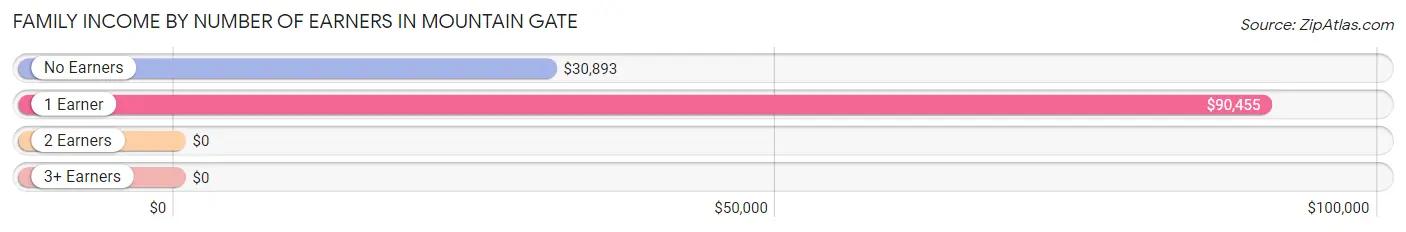
| Number of Earners | # Families | Median Income |
| No Earners | 69 (41.3%) | $30,893 |
| 1 Earner | 42 (25.2%) | $90,455 |
| 2 Earners | 39 (23.4%) | $0 |
| 3+ Earners | 17 (10.2%) | $0 |
| Total | 167 (100.0%) | $0 |
Household Income in Mountain Gate
Household Income Brackets in Mountain Gate
With 131 households falling in the category, the $15,000 to $24,999 income range is the most frequent in Mountain Gate, accounting for 31.1% of all households.
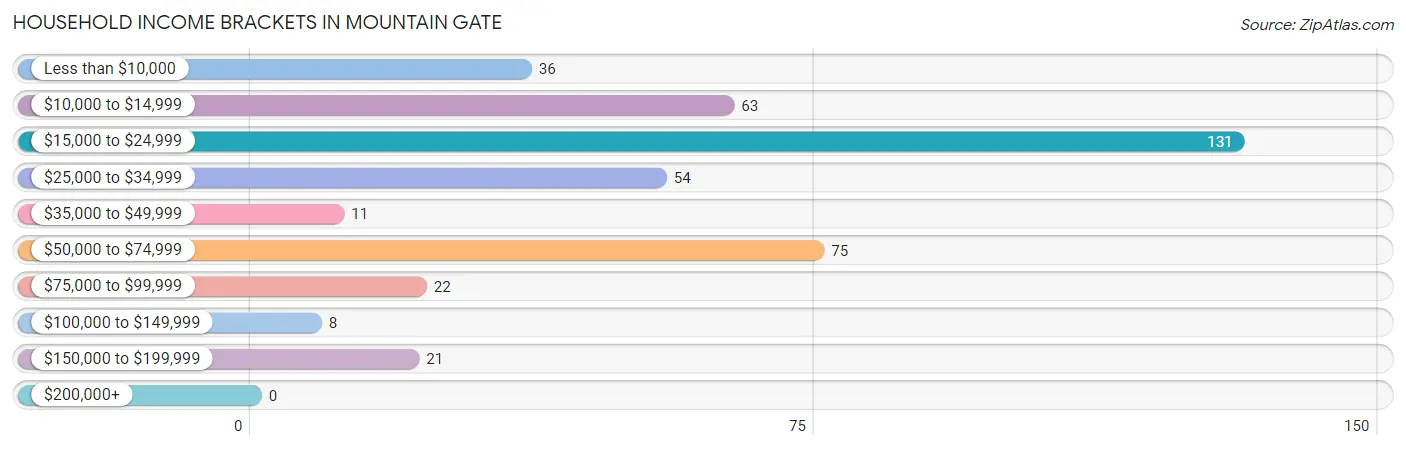
| Income Bracket | # Households | % Households |
| Less than $10,000 | 36 | 8.6% |
| $10,000 to $14,999 | 63 | 15.0% |
| $15,000 to $24,999 | 131 | 31.1% |
| $25,000 to $34,999 | 54 | 12.8% |
| $35,000 to $49,999 | 11 | 2.6% |
| $50,000 to $74,999 | 75 | 17.8% |
| $75,000 to $99,999 | 22 | 5.2% |
| $100,000 to $149,999 | 8 | 1.9% |
| $150,000 to $199,999 | 21 | 5.0% |
| $200,000+ | 0 | 0.0% |
Household Income by Householder Age in Mountain Gate
The median household income in Mountain Gate is $24,250, with the highest median household income of $33,448 found in the 25 to 44 years age bracket for the primary householder. A total of 56 households (13.3%) fall into this category.
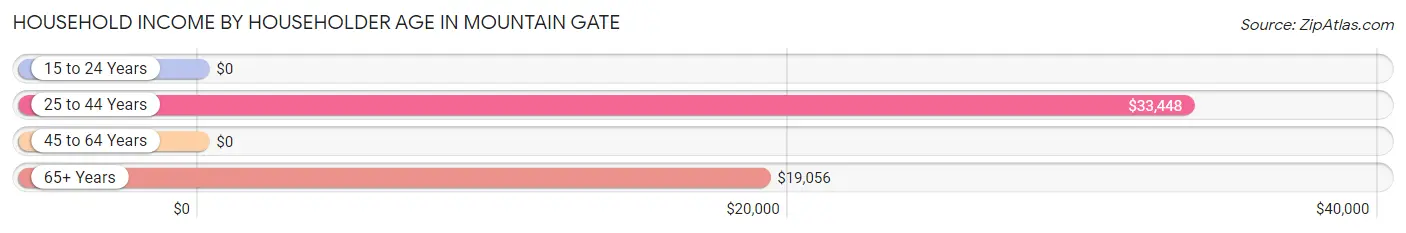
| Income Bracket | # Households | Median Income |
| 15 to 24 Years | 0 (0.0%) | $0 |
| 25 to 44 Years | 56 (13.3%) | $33,448 |
| 45 to 64 Years | 181 (43.0%) | $0 |
| 65+ Years | 184 (43.7%) | $19,056 |
| Total | 421 (100.0%) | $24,250 |
Poverty in Mountain Gate
Income Below Poverty by Sex and Age in Mountain Gate
With 41.7% poverty level for males and 49.9% for females among the residents of Mountain Gate, under 5 year old males and 6 to 11 year old females are the most vulnerable to poverty, with 36 males (100.0%) and 31 females (100.0%) in their respective age groups living below the poverty level.
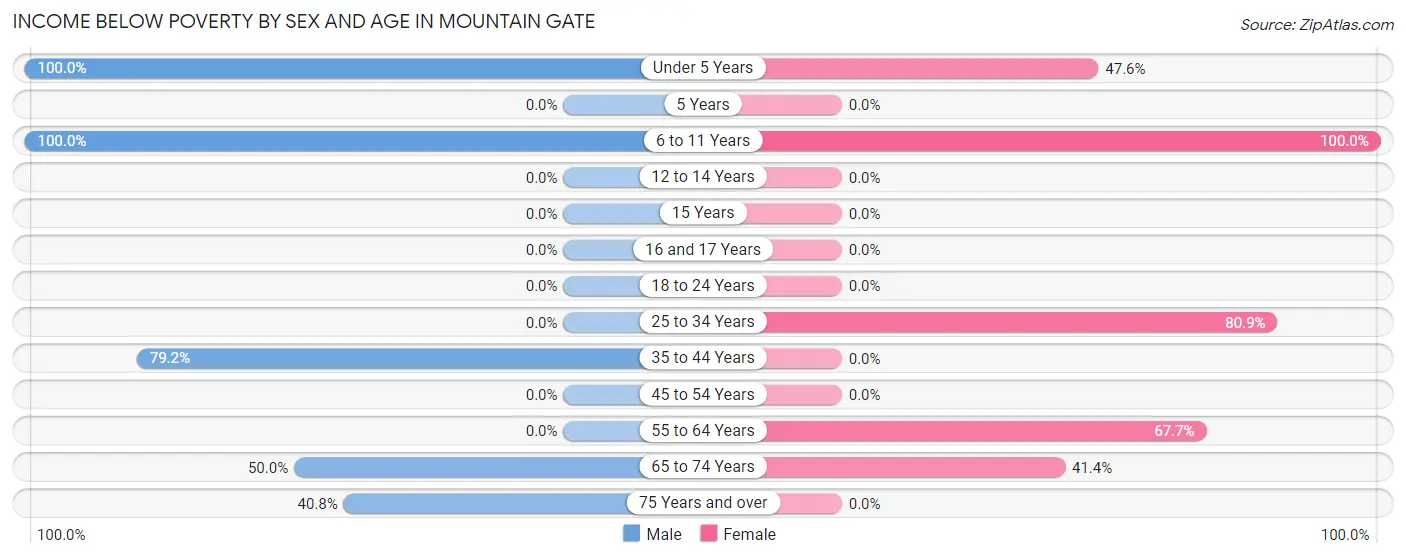
| Age Bracket | Male | Female |
| Under 5 Years | 36 (100.0%) | 10 (47.6%) |
| 5 Years | 0 (0.0%) | 0 (0.0%) |
| 6 to 11 Years | 57 (100.0%) | 31 (100.0%) |
| 12 to 14 Years | 0 (0.0%) | 0 (0.0%) |
| 15 Years | 0 (0.0%) | 0 (0.0%) |
| 16 and 17 Years | 0 (0.0%) | 0 (0.0%) |
| 18 to 24 Years | 0 (0.0%) | 0 (0.0%) |
| 25 to 34 Years | 0 (0.0%) | 38 (80.8%) |
| 35 to 44 Years | 38 (79.2%) | 0 (0.0%) |
| 45 to 54 Years | 0 (0.0%) | 0 (0.0%) |
| 55 to 64 Years | 0 (0.0%) | 67 (67.7%) |
| 65 to 74 Years | 33 (50.0%) | 29 (41.4%) |
| 75 Years and over | 31 (40.8%) | 0 (0.0%) |
| Total | 195 (41.7%) | 175 (49.9%) |
Income Above Poverty by Sex and Age in Mountain Gate
According to the poverty statistics in Mountain Gate, males aged 16 and 17 years and females aged 15 years are the age groups that are most secure financially, with 100.0% of males and 100.0% of females in these age groups living above the poverty line.
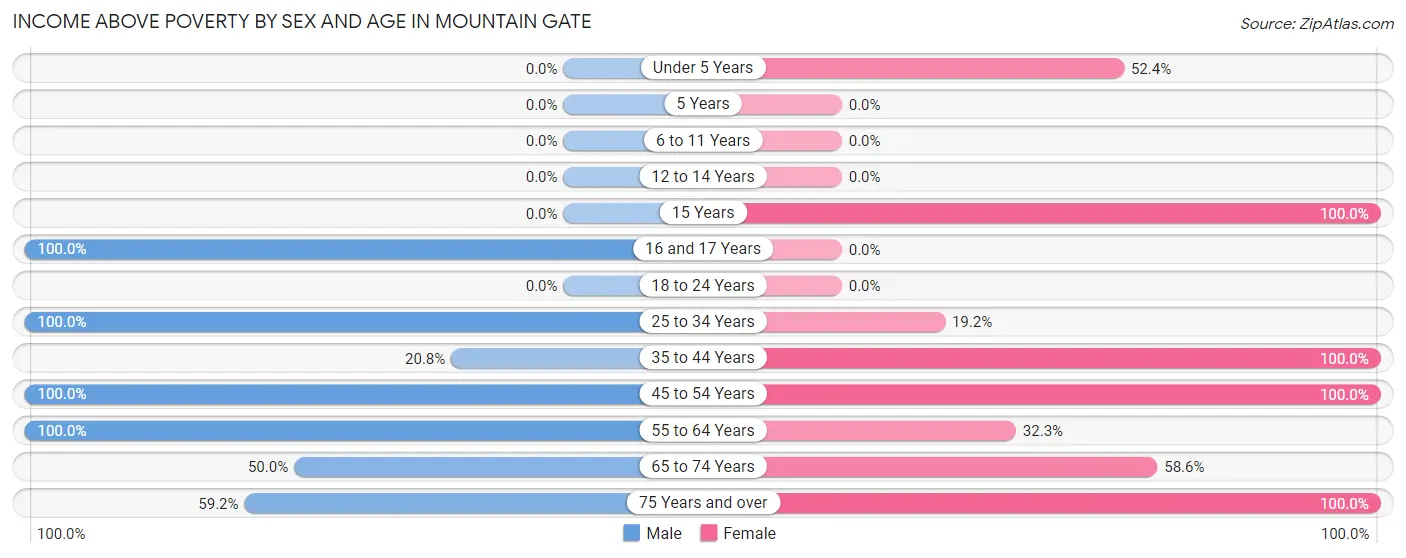
| Age Bracket | Male | Female |
| Under 5 Years | 0 (0.0%) | 11 (52.4%) |
| 5 Years | 0 (0.0%) | 0 (0.0%) |
| 6 to 11 Years | 0 (0.0%) | 0 (0.0%) |
| 12 to 14 Years | 0 (0.0%) | 0 (0.0%) |
| 15 Years | 0 (0.0%) | 9 (100.0%) |
| 16 and 17 Years | 10 (100.0%) | 0 (0.0%) |
| 18 to 24 Years | 0 (0.0%) | 0 (0.0%) |
| 25 to 34 Years | 9 (100.0%) | 9 (19.2%) |
| 35 to 44 Years | 10 (20.8%) | 9 (100.0%) |
| 45 to 54 Years | 74 (100.0%) | 17 (100.0%) |
| 55 to 64 Years | 92 (100.0%) | 32 (32.3%) |
| 65 to 74 Years | 33 (50.0%) | 41 (58.6%) |
| 75 Years and over | 45 (59.2%) | 48 (100.0%) |
| Total | 273 (58.3%) | 176 (50.1%) |
Income Below Poverty Among Married-Couple Families in Mountain Gate
The poverty statistics for married-couple families in Mountain Gate show that 39.9% or 59 of the total 148 families live below the poverty line. Families with 3 or 4 children have the highest poverty rate of 100.0%, comprising of 29 families. On the other hand, families with 1 or 2 children have the lowest poverty rate of 0.0%, which includes 0 families.
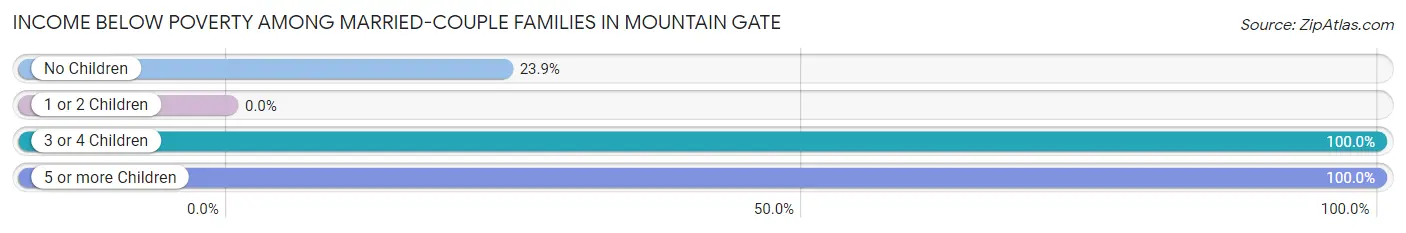
| Children | Above Poverty | Below Poverty |
| No Children | 70 (76.1%) | 22 (23.9%) |
| 1 or 2 Children | 19 (100.0%) | 0 (0.0%) |
| 3 or 4 Children | 0 (0.0%) | 29 (100.0%) |
| 5 or more Children | 0 (0.0%) | 8 (100.0%) |
| Total | 89 (60.1%) | 59 (39.9%) |
Income Below Poverty Among Single-Parent Households in Mountain Gate
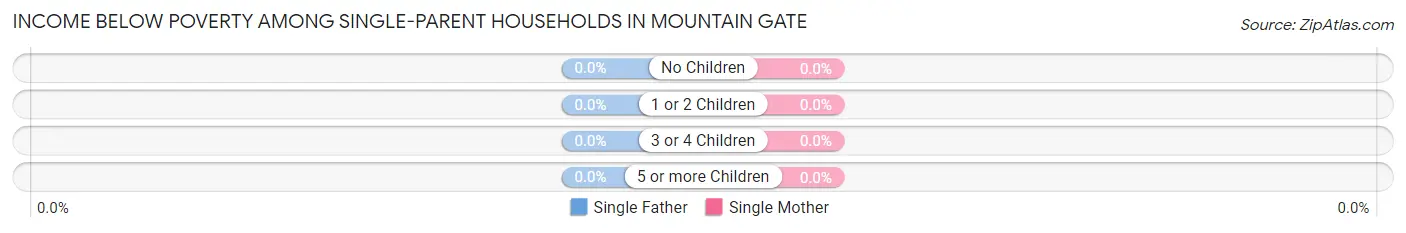
| Children | Single Father | Single Mother |
| No Children | 0 (0.0%) | 0 (0.0%) |
| 1 or 2 Children | 0 (0.0%) | 0 (0.0%) |
| 3 or 4 Children | 0 (0.0%) | 0 (0.0%) |
| 5 or more Children | 0 (0.0%) | 0 (0.0%) |
| Total | 0 (0.0%) | 0 (0.0%) |
Income Below Poverty Among Married-Couple vs Single-Parent Households in Mountain Gate
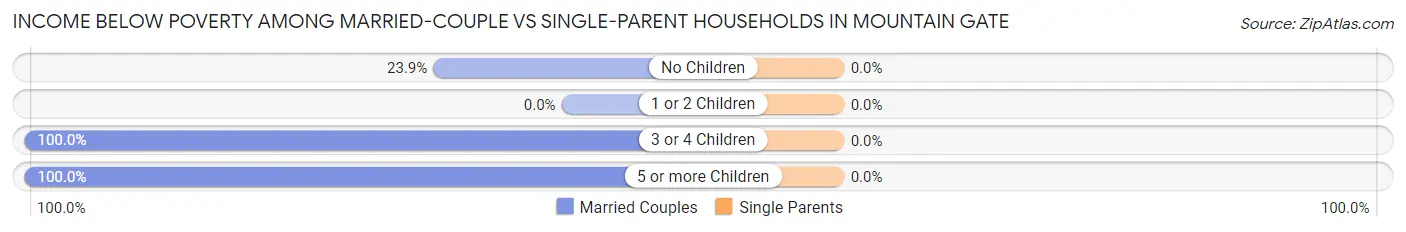
| Children | Married-Couple Families | Single-Parent Households |
| No Children | 22 (23.9%) | 0 (0.0%) |
| 1 or 2 Children | 0 (0.0%) | 0 (0.0%) |
| 3 or 4 Children | 29 (100.0%) | 0 (0.0%) |
| 5 or more Children | 8 (100.0%) | 0 (0.0%) |
| Total | 59 (39.9%) | 0 (0.0%) |
Race in Mountain Gate
The most populous races in Mountain Gate are White / Caucasian (768 | 93.8%), Native / Alaskan (27 | 3.3%), and Two or more Races (24 | 2.9%).
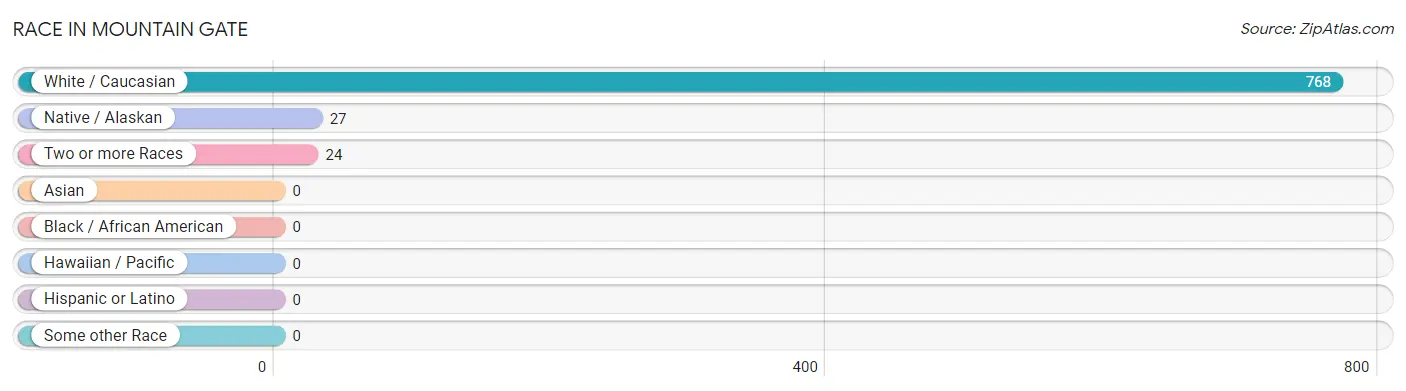
| Race | # Population | % Population |
| Asian | 0 | 0.0% |
| Black / African American | 0 | 0.0% |
| Hawaiian / Pacific | 0 | 0.0% |
| Hispanic or Latino | 0 | 0.0% |
| Native / Alaskan | 27 | 3.3% |
| White / Caucasian | 768 | 93.8% |
| Two or more Races | 24 | 2.9% |
| Some other Race | 0 | 0.0% |
| Total | 819 | 100.0% |
Ancestry in Mountain Gate
The most populous ancestries reported in Mountain Gate are German (169 | 20.6%), European (130 | 15.9%), American (105 | 12.8%), English (93 | 11.4%), and Italian (77 | 9.4%), together accounting for 70.1% of all Mountain Gate residents.
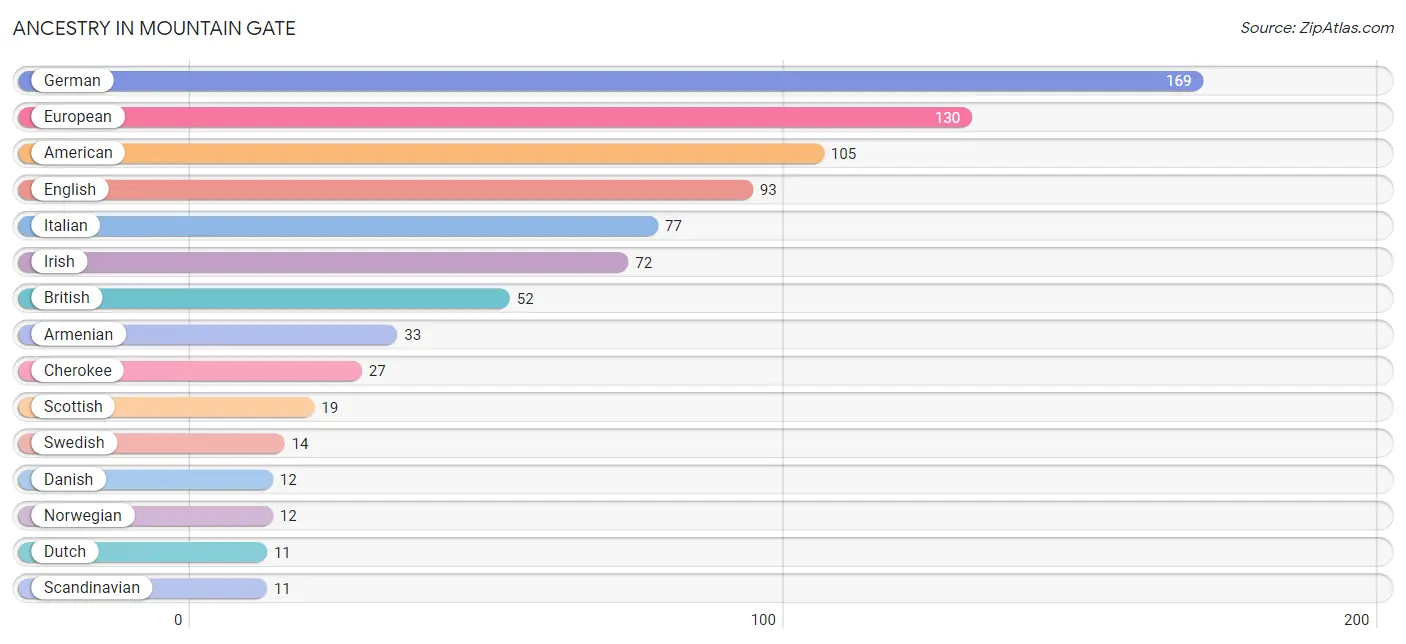
| Ancestry | # Population | % Population |
| American | 105 | 12.8% |
| Armenian | 33 | 4.0% |
| Blackfeet | 10 | 1.2% |
| British | 52 | 6.4% |
| Cherokee | 27 | 3.3% |
| Danish | 12 | 1.5% |
| Dutch | 11 | 1.3% |
| English | 93 | 11.4% |
| European | 130 | 15.9% |
| French | 9 | 1.1% |
| German | 169 | 20.6% |
| Irish | 72 | 8.8% |
| Italian | 77 | 9.4% |
| Norwegian | 12 | 1.5% |
| Portuguese | 7 | 0.9% |
| Scandinavian | 11 | 1.3% |
| Scottish | 19 | 2.3% |
| Swedish | 14 | 1.7% | View All 18 Rows |
Immigrants in Mountain Gate

| Immigration Origin | # Population | % Population | View All 0 Rows |
Sex and Age in Mountain Gate
Sex and Age in Mountain Gate
The most populous age groups in Mountain Gate are 50 to 54 Years (74 | 15.8%) for men and 60 to 64 Years (88 | 25.1%) for women.
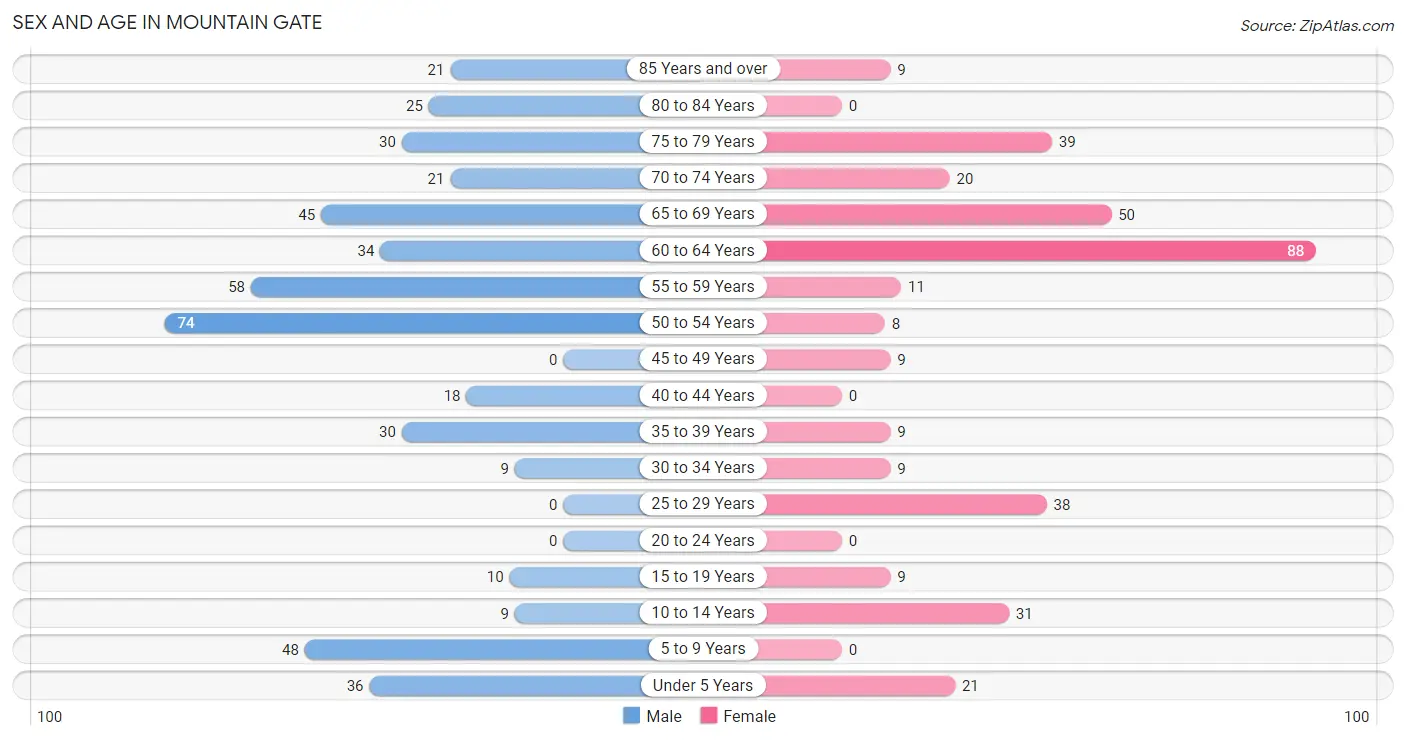
| Age Bracket | Male | Female |
| Under 5 Years | 36 (7.7%) | 21 (6.0%) |
| 5 to 9 Years | 48 (10.3%) | 0 (0.0%) |
| 10 to 14 Years | 9 (1.9%) | 31 (8.8%) |
| 15 to 19 Years | 10 (2.1%) | 9 (2.6%) |
| 20 to 24 Years | 0 (0.0%) | 0 (0.0%) |
| 25 to 29 Years | 0 (0.0%) | 38 (10.8%) |
| 30 to 34 Years | 9 (1.9%) | 9 (2.6%) |
| 35 to 39 Years | 30 (6.4%) | 9 (2.6%) |
| 40 to 44 Years | 18 (3.8%) | 0 (0.0%) |
| 45 to 49 Years | 0 (0.0%) | 9 (2.6%) |
| 50 to 54 Years | 74 (15.8%) | 8 (2.3%) |
| 55 to 59 Years | 58 (12.4%) | 11 (3.1%) |
| 60 to 64 Years | 34 (7.3%) | 88 (25.1%) |
| 65 to 69 Years | 45 (9.6%) | 50 (14.2%) |
| 70 to 74 Years | 21 (4.5%) | 20 (5.7%) |
| 75 to 79 Years | 30 (6.4%) | 39 (11.1%) |
| 80 to 84 Years | 25 (5.3%) | 0 (0.0%) |
| 85 Years and over | 21 (4.5%) | 9 (2.6%) |
| Total | 468 (100.0%) | 351 (100.0%) |
Families and Households in Mountain Gate
Median Family Size in Mountain Gate
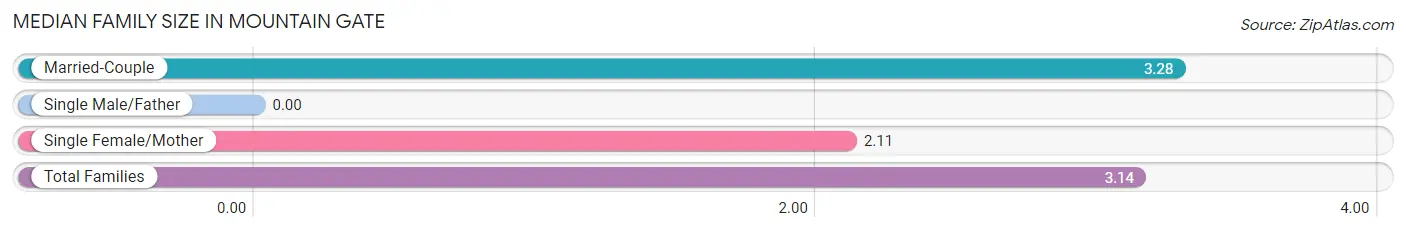
| Family Type | # Families | Family Size |
| Married-Couple | 148 (88.6%) | 3.28 |
| Single Male/Father | 0 (0.0%) | - |
| Single Female/Mother | 19 (11.4%) | 2.11 |
| Total Families | 167 (100.0%) | 3.14 |
Median Household Size in Mountain Gate
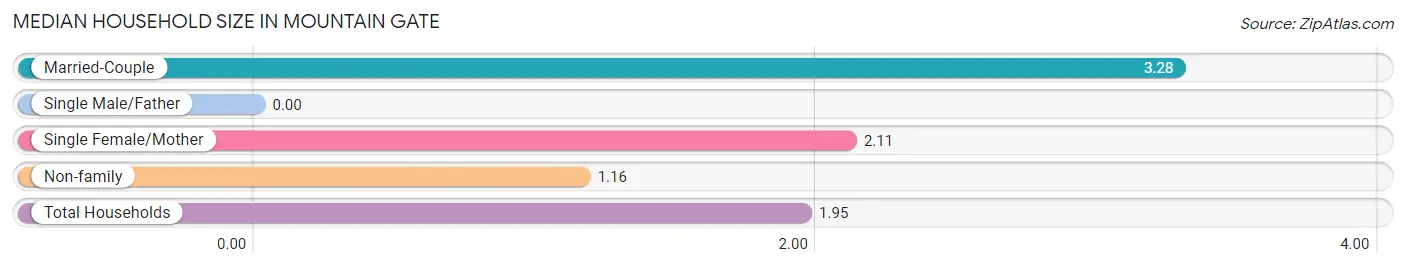
| Household Type | # Households | Household Size |
| Married-Couple | 148 (35.1%) | 3.28 |
| Single Male/Father | 0 (0.0%) | - |
| Single Female/Mother | 19 (4.5%) | 2.11 |
| Non-family | 254 (60.3%) | 1.16 |
| Total Households | 421 (100.0%) | 1.95 |
Household Size by Marriage Status in Mountain Gate
Out of a total of 421 households in Mountain Gate, 167 (39.7%) are family households, while 254 (60.3%) are nonfamily households. The most numerous type of family households are 2-person households, comprising 103, and the most common type of nonfamily households are 1-person households, comprising 216.
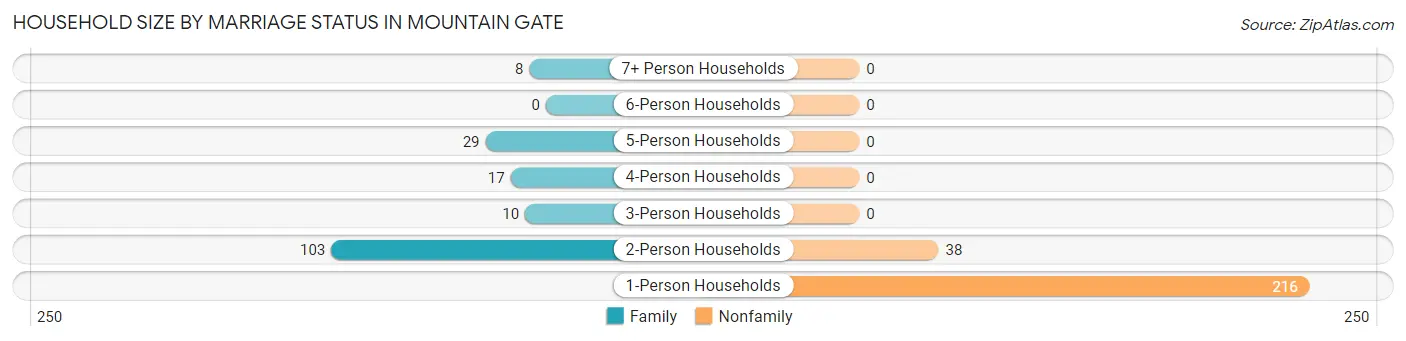
| Household Size | Family Households | Nonfamily Households |
| 1-Person Households | - | 216 (51.3%) |
| 2-Person Households | 103 (24.5%) | 38 (9.0%) |
| 3-Person Households | 10 (2.4%) | 0 (0.0%) |
| 4-Person Households | 17 (4.0%) | 0 (0.0%) |
| 5-Person Households | 29 (6.9%) | 0 (0.0%) |
| 6-Person Households | 0 (0.0%) | 0 (0.0%) |
| 7+ Person Households | 8 (1.9%) | 0 (0.0%) |
| Total | 167 (39.7%) | 254 (60.3%) |
Female Fertility in Mountain Gate
Fertility by Age in Mountain Gate
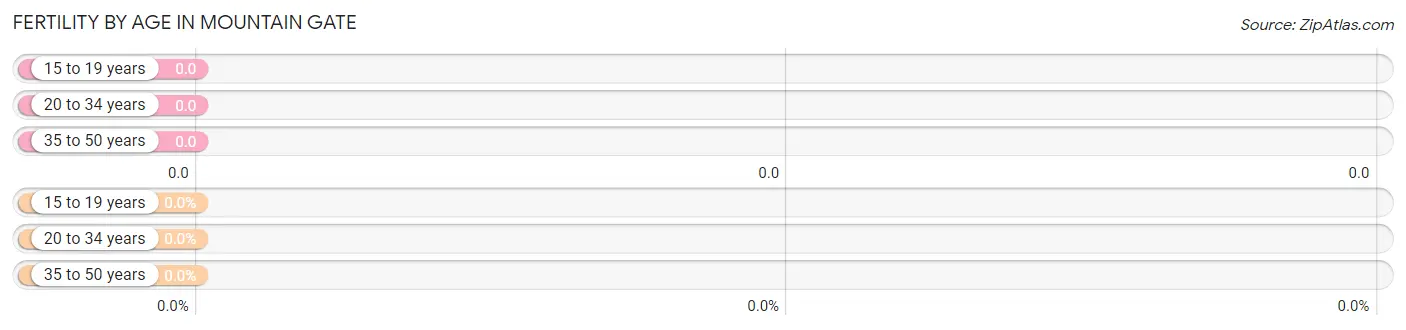
| Age Bracket | Women with Births | Births / 1,000 Women |
| 15 to 19 years | 0 (0.0%) | 0.0 |
| 20 to 34 years | 0 (0.0%) | 0.0 |
| 35 to 50 years | 0 (0.0%) | 0.0 |
| Total | 0 (0.0%) | 0.0 |
Fertility by Age by Marriage Status in Mountain Gate
| Age Bracket | Married | Unmarried |
| 15 to 19 years | 0 (0.0%) | 0 (0.0%) |
| 20 to 34 years | 0 (0.0%) | 0 (0.0%) |
| 35 to 50 years | 0 (0.0%) | 0 (0.0%) |
| Total | 0 (0.0%) | 0 (0.0%) |
Fertility by Education in Mountain Gate
| Educational Attainment | Women with Births | Births / 1,000 Women |
| Less than High School | 0 (0.0%) | 0.0 |
| High School Diploma | 0 (0.0%) | 0.0 |
| College or Associate's Degree | 0 (0.0%) | 0.0 |
| Bachelor's Degree | 0 (0.0%) | 0.0 |
| Graduate Degree | 0 (0.0%) | 0.0 |
| Total | 0 (0.0%) | 0.0 |
Fertility by Education by Marriage Status in Mountain Gate
| Educational Attainment | Married | Unmarried |
| Less than High School | 0 (0.0%) | 0 (0.0%) |
| High School Diploma | 0 (0.0%) | 0 (0.0%) |
| College or Associate's Degree | 0 (0.0%) | 0 (0.0%) |
| Bachelor's Degree | 0 (0.0%) | 0 (0.0%) |
| Graduate Degree | 0 (0.0%) | 0 (0.0%) |
| Total | 0 (0.0%) | 0 (0.0%) |
Employment Characteristics in Mountain Gate
Employment by Class of Employer in Mountain Gate
Among the 237 employed individuals in Mountain Gate, private company employees (127 | 53.6%), not-for-profit organizations (65 | 27.4%), and federal government employees (17 | 7.2%) make up the most common classes of employment.
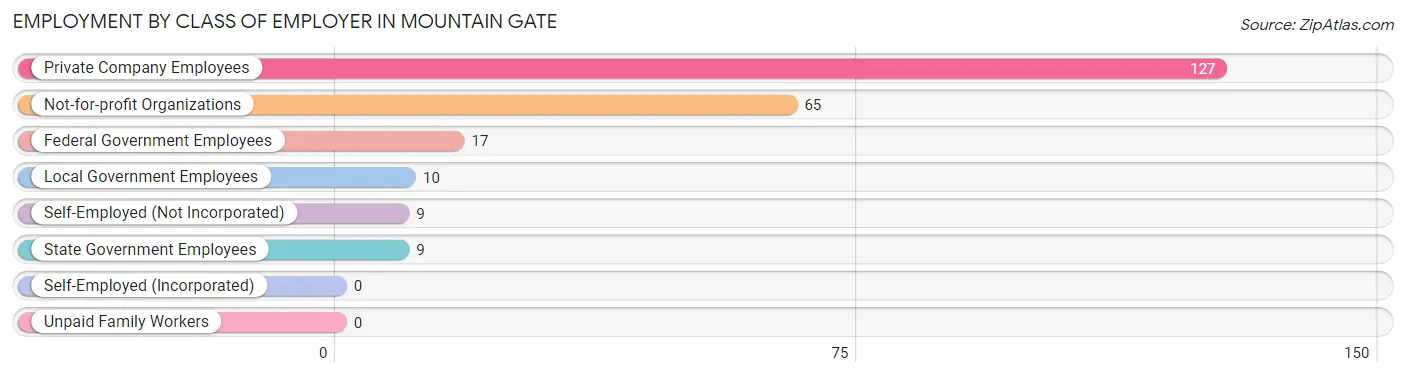
| Employer Class | # Employees | % Employees |
| Private Company Employees | 127 | 53.6% |
| Self-Employed (Incorporated) | 0 | 0.0% |
| Self-Employed (Not Incorporated) | 9 | 3.8% |
| Not-for-profit Organizations | 65 | 27.4% |
| Local Government Employees | 10 | 4.2% |
| State Government Employees | 9 | 3.8% |
| Federal Government Employees | 17 | 7.2% |
| Unpaid Family Workers | 0 | 0.0% |
| Total | 237 | 100.0% |
Employment Status by Age in Mountain Gate
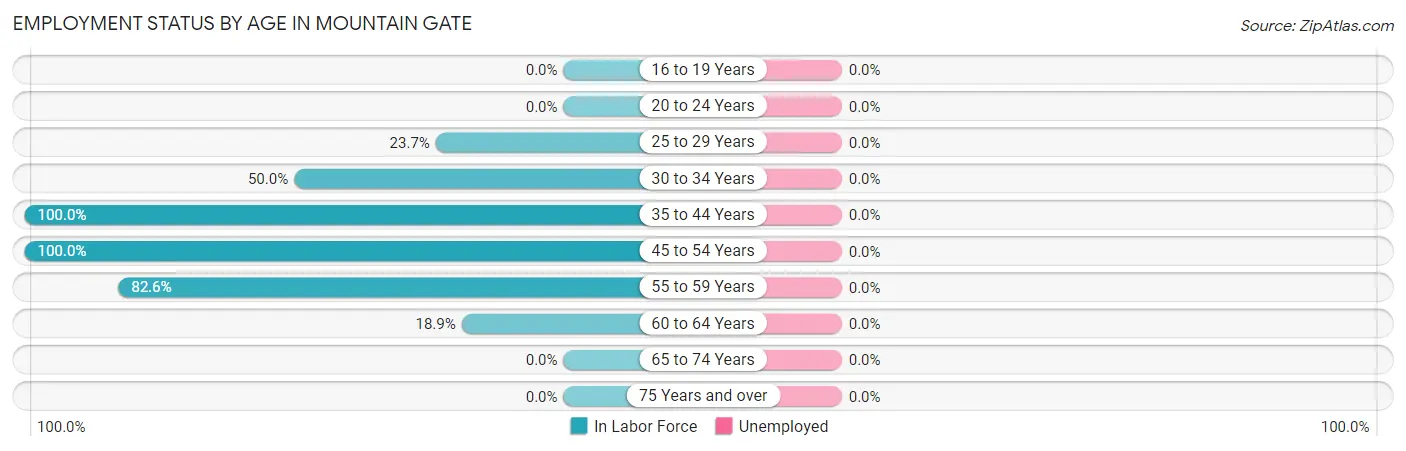
| Age Bracket | In Labor Force | Unemployed |
| 16 to 19 Years | 0 (0.0%) | 0 (0.0%) |
| 20 to 24 Years | 0 (0.0%) | 0 (0.0%) |
| 25 to 29 Years | 9 (23.7%) | 0 (0.0%) |
| 30 to 34 Years | 9 (50.0%) | 0 (0.0%) |
| 35 to 44 Years | 57 (100.0%) | 0 (0.0%) |
| 45 to 54 Years | 91 (100.0%) | 0 (0.0%) |
| 55 to 59 Years | 57 (82.6%) | 0 (0.0%) |
| 60 to 64 Years | 23 (18.9%) | 0 (0.0%) |
| 65 to 74 Years | 0 (0.0%) | 0 (0.0%) |
| 75 Years and over | 0 (0.0%) | 0 (0.0%) |
| Total | 246 (37.0%) | 0 (0.0%) |
Employment Status by Educational Attainment in Mountain Gate
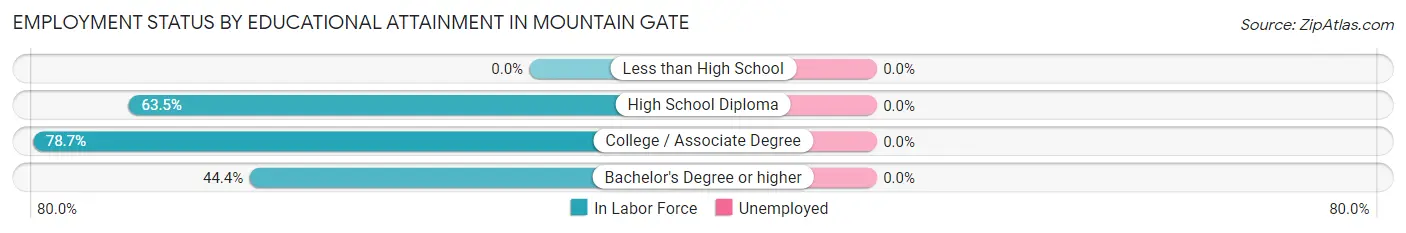
| Educational Attainment | In Labor Force | Unemployed |
| Less than High School | 0 (0.0%) | 0 (0.0%) |
| High School Diploma | 66 (63.5%) | 0 (0.0%) |
| College / Associate Degree | 140 (78.7%) | 0 (0.0%) |
| Bachelor's Degree or higher | 40 (44.4%) | 0 (0.0%) |
| Total | 246 (62.3%) | 0 (0.0%) |
Employment Occupations by Sex in Mountain Gate
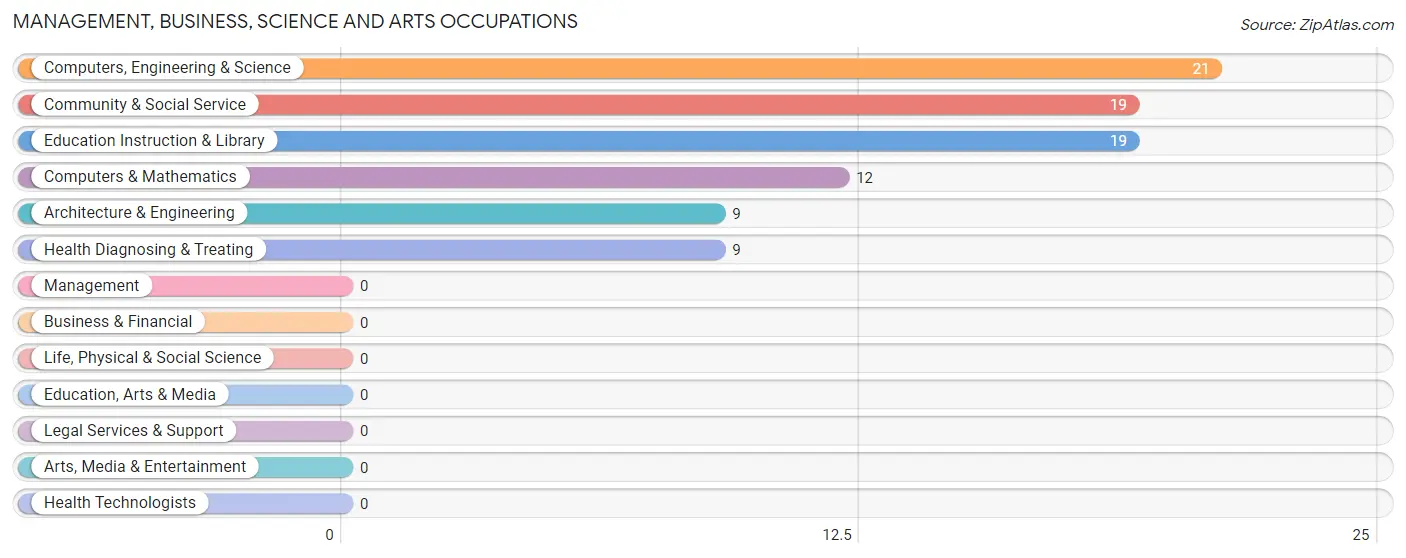
Management, Business, Science and Arts Occupations
The most common Management, Business, Science and Arts occupations in Mountain Gate are Computers, Engineering & Science (21 | 8.5%), Community & Social Service (19 | 7.7%), Education Instruction & Library (19 | 7.7%), Computers & Mathematics (12 | 4.9%), and Architecture & Engineering (9 | 3.7%).
Management, Business, Science and Arts Occupations by Sex
Within the Management, Business, Science and Arts occupations in Mountain Gate, the most male-oriented occupations are Computers, Engineering & Science (100.0%), Computers & Mathematics (100.0%), and Architecture & Engineering (100.0%), while the most female-oriented occupations are Community & Social Service (47.4%), and Education Instruction & Library (47.4%).
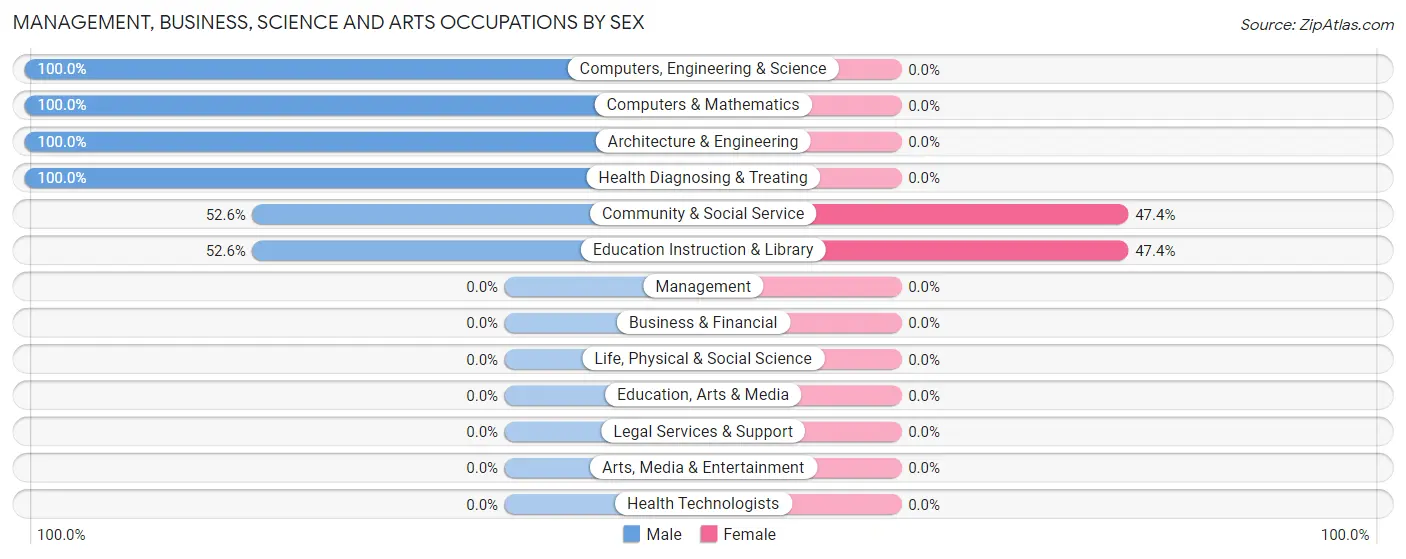
| Occupation | Male | Female |
| Management | 0 (0.0%) | 0 (0.0%) |
| Business & Financial | 0 (0.0%) | 0 (0.0%) |
| Computers, Engineering & Science | 21 (100.0%) | 0 (0.0%) |
| Computers & Mathematics | 12 (100.0%) | 0 (0.0%) |
| Architecture & Engineering | 9 (100.0%) | 0 (0.0%) |
| Life, Physical & Social Science | 0 (0.0%) | 0 (0.0%) |
| Community & Social Service | 10 (52.6%) | 9 (47.4%) |
| Education, Arts & Media | 0 (0.0%) | 0 (0.0%) |
| Legal Services & Support | 0 (0.0%) | 0 (0.0%) |
| Education Instruction & Library | 10 (52.6%) | 9 (47.4%) |
| Arts, Media & Entertainment | 0 (0.0%) | 0 (0.0%) |
| Health Diagnosing & Treating | 9 (100.0%) | 0 (0.0%) |
| Health Technologists | 0 (0.0%) | 0 (0.0%) |
| Total (Category) | 40 (81.6%) | 9 (18.4%) |
| Total (Overall) | 200 (81.3%) | 46 (18.7%) |
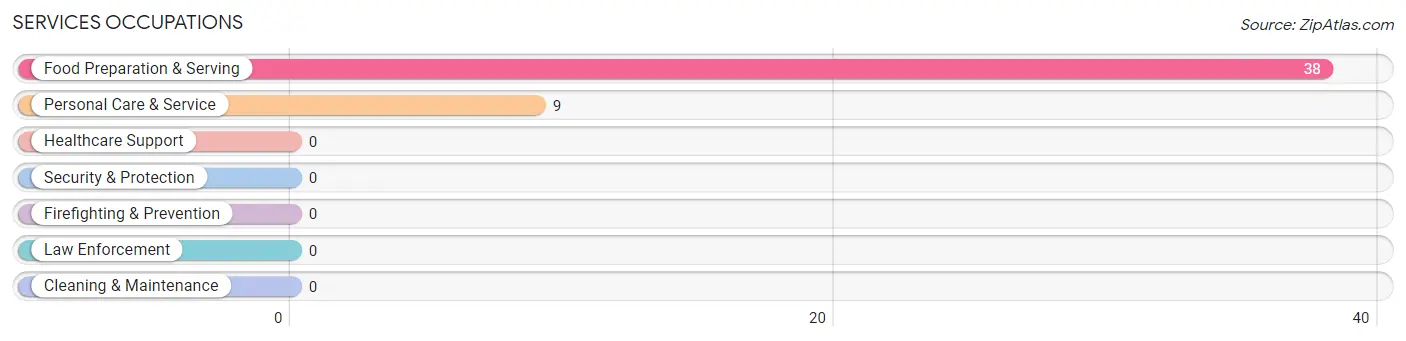
Services Occupations
The most common Services occupations in Mountain Gate are Food Preparation & Serving (38 | 15.4%), and Personal Care & Service (9 | 3.7%).
Services Occupations by Sex
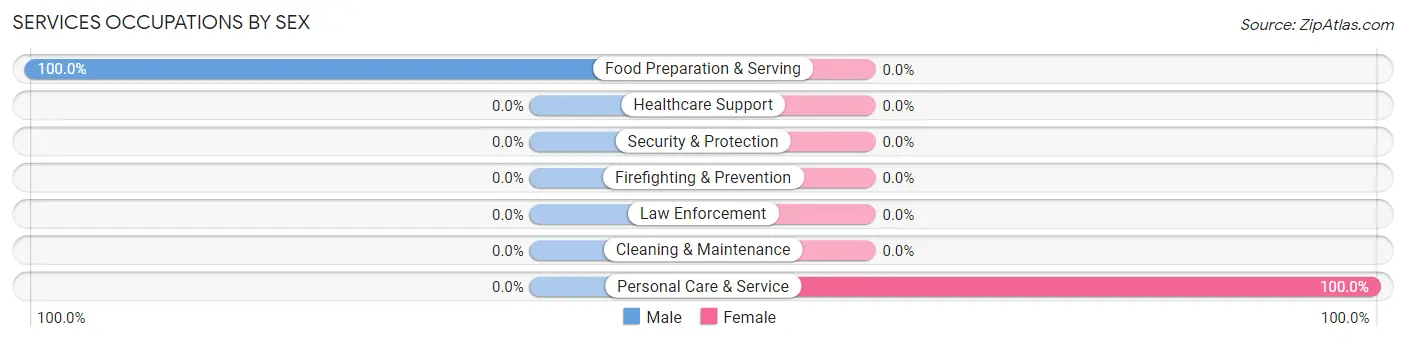
| Occupation | Male | Female |
| Healthcare Support | 0 (0.0%) | 0 (0.0%) |
| Security & Protection | 0 (0.0%) | 0 (0.0%) |
| Firefighting & Prevention | 0 (0.0%) | 0 (0.0%) |
| Law Enforcement | 0 (0.0%) | 0 (0.0%) |
| Food Preparation & Serving | 38 (100.0%) | 0 (0.0%) |
| Cleaning & Maintenance | 0 (0.0%) | 0 (0.0%) |
| Personal Care & Service | 0 (0.0%) | 9 (100.0%) |
| Total (Category) | 38 (80.8%) | 9 (19.2%) |
| Total (Overall) | 200 (81.3%) | 46 (18.7%) |
Sales and Office Occupations
The most common Sales and Office occupations in Mountain Gate are , and Office & Administration (16 | 6.5%).
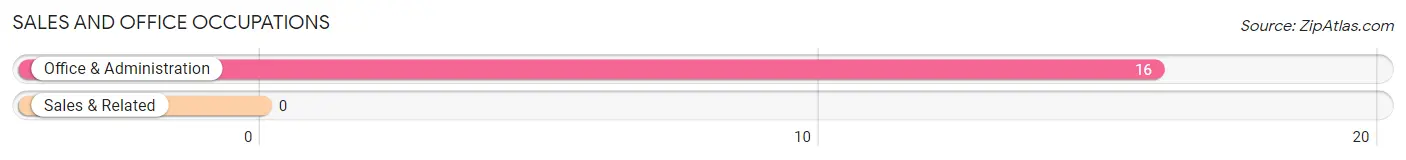
Sales and Office Occupations by Sex
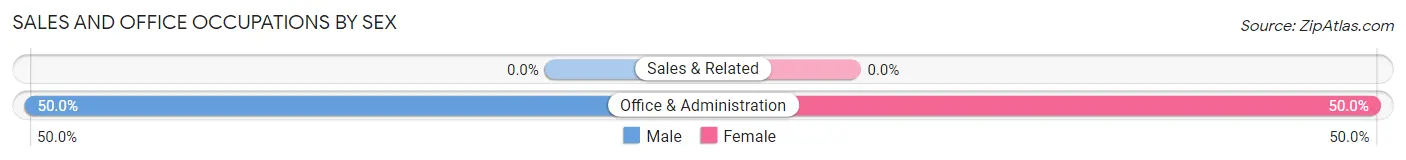
| Occupation | Male | Female |
| Sales & Related | 0 (0.0%) | 0 (0.0%) |
| Office & Administration | 8 (50.0%) | 8 (50.0%) |
| Total (Category) | 8 (50.0%) | 8 (50.0%) |
| Total (Overall) | 200 (81.3%) | 46 (18.7%) |
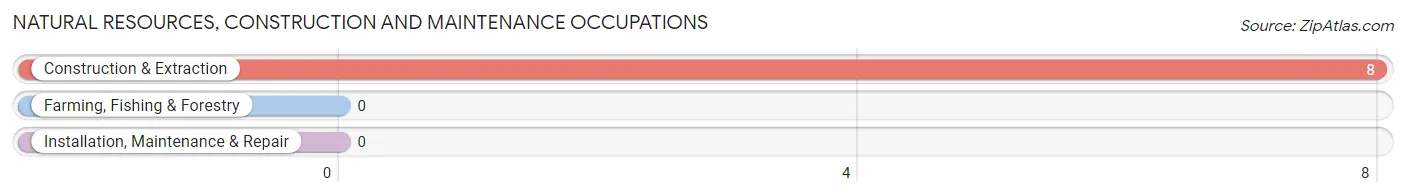
Natural Resources, Construction and Maintenance Occupations
The most common Natural Resources, Construction and Maintenance occupations in Mountain Gate are , and Construction & Extraction (8 | 3.3%).
Natural Resources, Construction and Maintenance Occupations by Sex
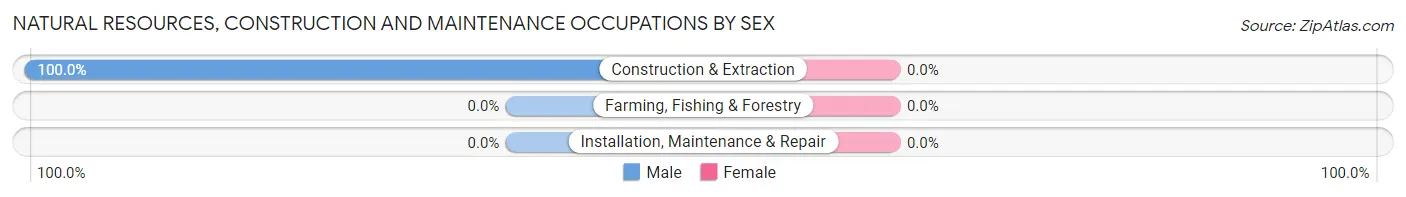
| Occupation | Male | Female |
| Farming, Fishing & Forestry | 0 (0.0%) | 0 (0.0%) |
| Construction & Extraction | 8 (100.0%) | 0 (0.0%) |
| Installation, Maintenance & Repair | 0 (0.0%) | 0 (0.0%) |
| Total (Category) | 8 (100.0%) | 0 (0.0%) |
| Total (Overall) | 200 (81.3%) | 46 (18.7%) |
Production, Transportation and Moving Occupations
The most common Production, Transportation and Moving occupations in Mountain Gate are Transportation (65 | 26.4%), Material Moving (31 | 12.6%), and Production (30 | 12.2%).
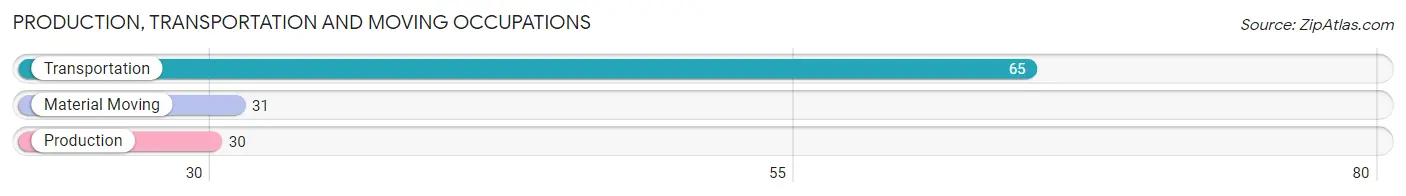
Production, Transportation and Moving Occupations by Sex
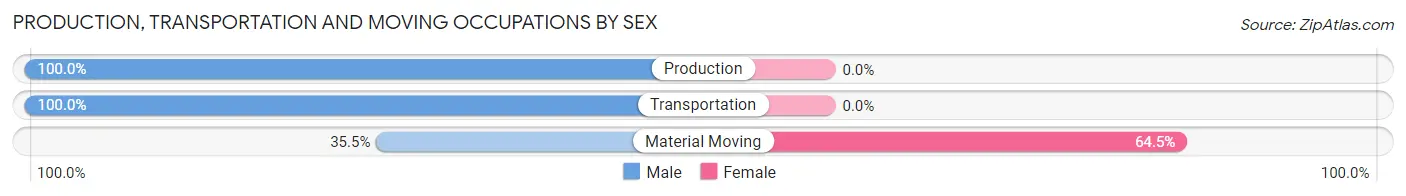
| Occupation | Male | Female |
| Production | 30 (100.0%) | 0 (0.0%) |
| Transportation | 65 (100.0%) | 0 (0.0%) |
| Material Moving | 11 (35.5%) | 20 (64.5%) |
| Total (Category) | 106 (84.1%) | 20 (15.9%) |
| Total (Overall) | 200 (81.3%) | 46 (18.7%) |
Employment Industries by Sex in Mountain Gate
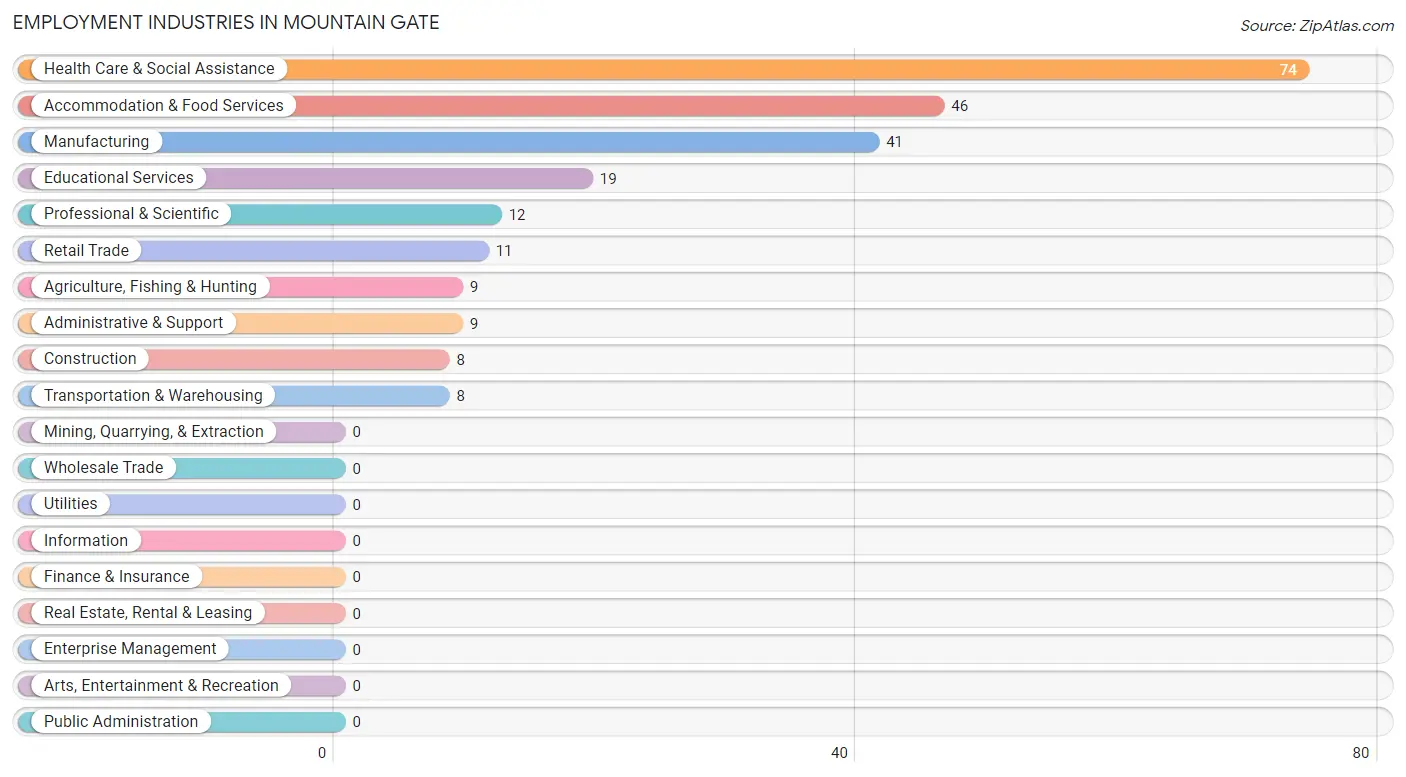
Employment Industries in Mountain Gate
The major employment industries in Mountain Gate include Health Care & Social Assistance (74 | 30.1%), Accommodation & Food Services (46 | 18.7%), Manufacturing (41 | 16.7%), Educational Services (19 | 7.7%), and Professional & Scientific (12 | 4.9%).
Employment Industries by Sex in Mountain Gate
The Mountain Gate industries that see more men than women are Agriculture, Fishing & Hunting (100.0%), Construction (100.0%), and Manufacturing (100.0%), whereas the industries that tend to have a higher number of women are Retail Trade (100.0%), Administrative & Support (100.0%), and Educational Services (47.4%).
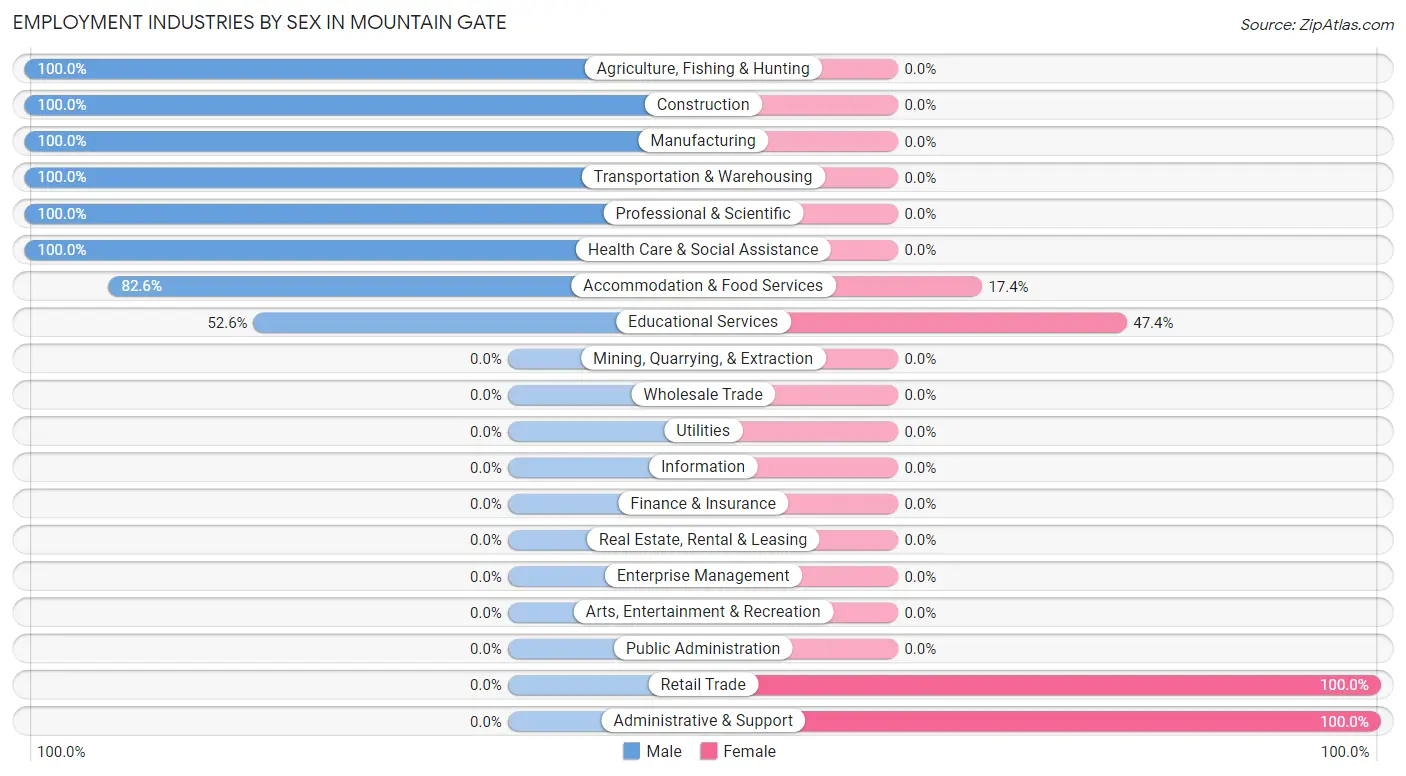
| Industry | Male | Female |
| Agriculture, Fishing & Hunting | 9 (100.0%) | 0 (0.0%) |
| Mining, Quarrying, & Extraction | 0 (0.0%) | 0 (0.0%) |
| Construction | 8 (100.0%) | 0 (0.0%) |
| Manufacturing | 41 (100.0%) | 0 (0.0%) |
| Wholesale Trade | 0 (0.0%) | 0 (0.0%) |
| Retail Trade | 0 (0.0%) | 11 (100.0%) |
| Transportation & Warehousing | 8 (100.0%) | 0 (0.0%) |
| Utilities | 0 (0.0%) | 0 (0.0%) |
| Information | 0 (0.0%) | 0 (0.0%) |
| Finance & Insurance | 0 (0.0%) | 0 (0.0%) |
| Real Estate, Rental & Leasing | 0 (0.0%) | 0 (0.0%) |
| Professional & Scientific | 12 (100.0%) | 0 (0.0%) |
| Enterprise Management | 0 (0.0%) | 0 (0.0%) |
| Administrative & Support | 0 (0.0%) | 9 (100.0%) |
| Educational Services | 10 (52.6%) | 9 (47.4%) |
| Health Care & Social Assistance | 74 (100.0%) | 0 (0.0%) |
| Arts, Entertainment & Recreation | 0 (0.0%) | 0 (0.0%) |
| Accommodation & Food Services | 38 (82.6%) | 8 (17.4%) |
| Public Administration | 0 (0.0%) | 0 (0.0%) |
| Total | 200 (81.3%) | 46 (18.7%) |
Education in Mountain Gate
School Enrollment in Mountain Gate
The most common levels of schooling among the 116 students in Mountain Gate are elementary school (79 | 68.1%), high school (19 | 16.4%), and middle school (9 | 7.8%).
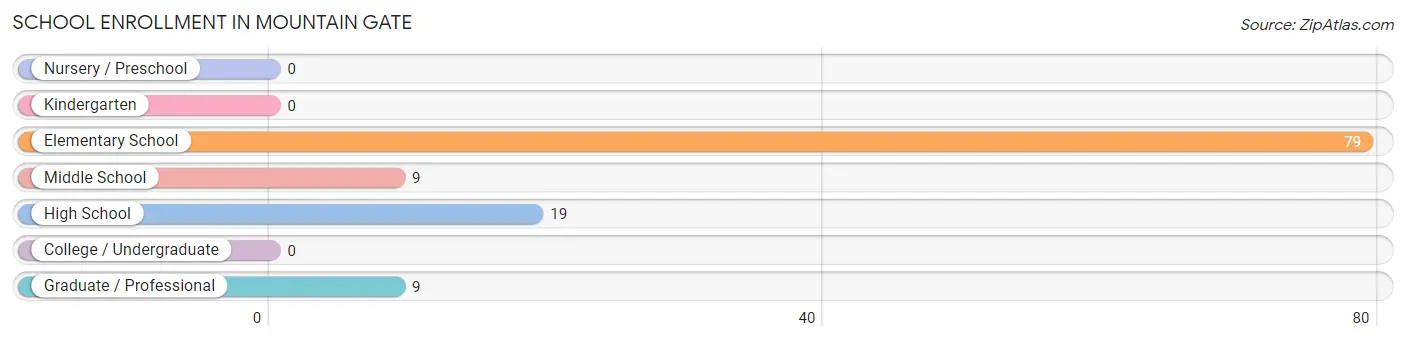
| School Level | # Students | % Students |
| Nursery / Preschool | 0 | 0.0% |
| Kindergarten | 0 | 0.0% |
| Elementary School | 79 | 68.1% |
| Middle School | 9 | 7.8% |
| High School | 19 | 16.4% |
| College / Undergraduate | 0 | 0.0% |
| Graduate / Professional | 9 | 7.8% |
| Total | 116 | 100.0% |
School Enrollment by Age by Funding Source in Mountain Gate
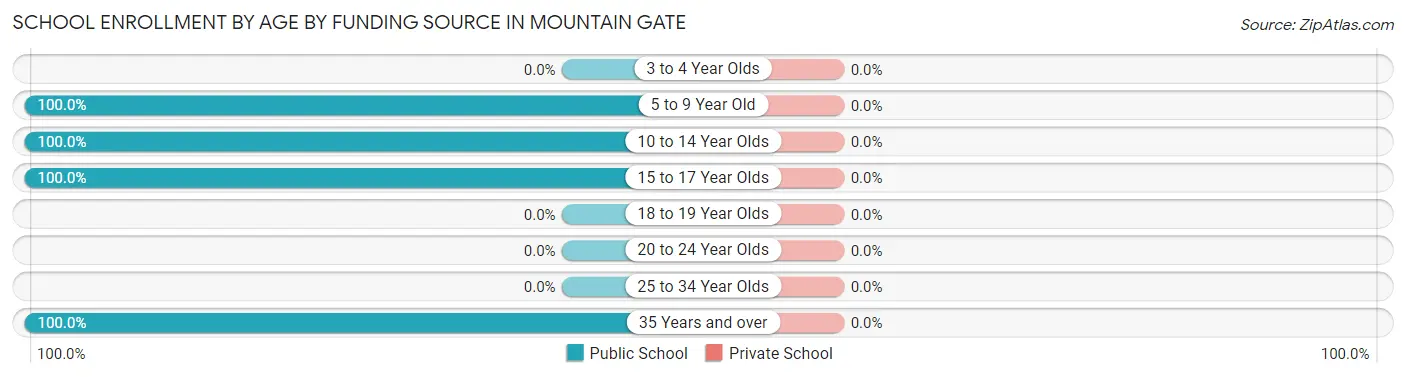
| Age Bracket | Public School | Private School |
| 3 to 4 Year Olds | 0 (0.0%) | 0 (0.0%) |
| 5 to 9 Year Old | 48 (100.0%) | 0 (0.0%) |
| 10 to 14 Year Olds | 40 (100.0%) | 0 (0.0%) |
| 15 to 17 Year Olds | 19 (100.0%) | 0 (0.0%) |
| 18 to 19 Year Olds | 0 (0.0%) | 0 (0.0%) |
| 20 to 24 Year Olds | 0 (0.0%) | 0 (0.0%) |
| 25 to 34 Year Olds | 0 (0.0%) | 0 (0.0%) |
| 35 Years and over | 9 (100.0%) | 0 (0.0%) |
| Total | 116 (100.0%) | 0 (0.0%) |
Educational Attainment by Field of Study in Mountain Gate
Science & technology (40 | 40.4%), social sciences (19 | 19.2%), computers & mathematics (12 | 12.1%), business (10 | 10.1%), and liberal arts & history (9 | 9.1%) are the most common fields of study among 99 individuals in Mountain Gate who have obtained a bachelor's degree or higher.
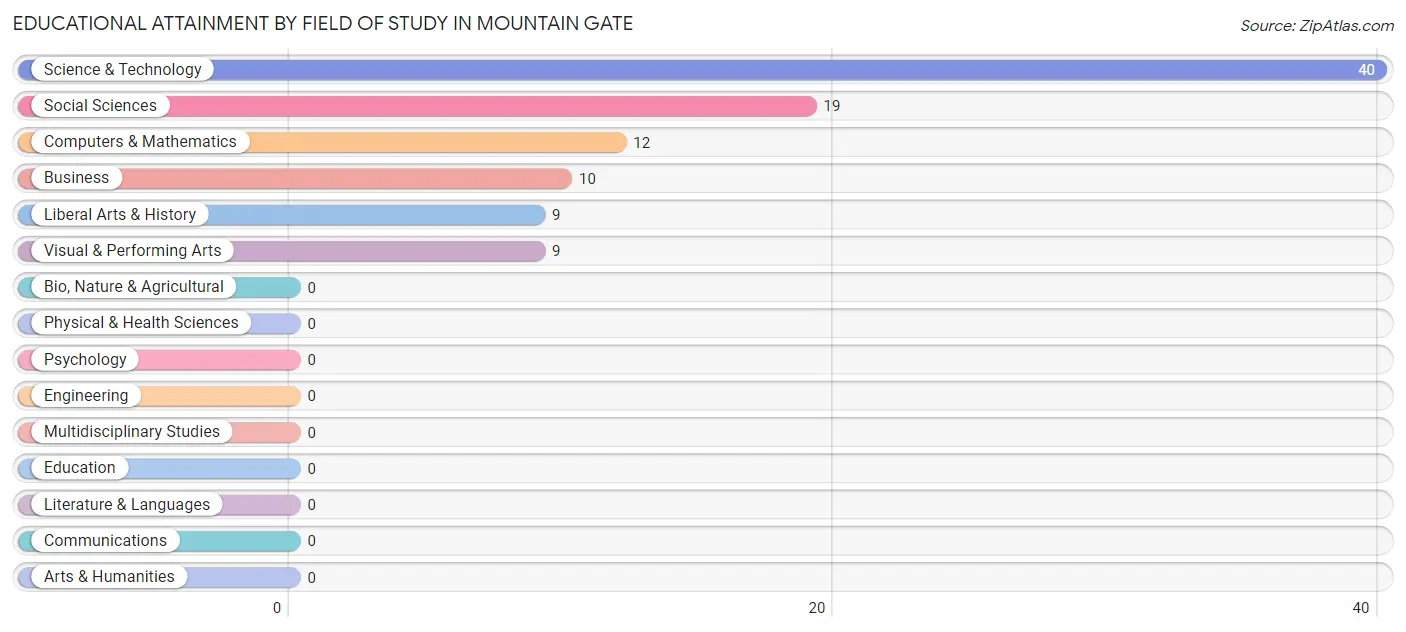
| Field of Study | # Graduates | % Graduates |
| Computers & Mathematics | 12 | 12.1% |
| Bio, Nature & Agricultural | 0 | 0.0% |
| Physical & Health Sciences | 0 | 0.0% |
| Psychology | 0 | 0.0% |
| Social Sciences | 19 | 19.2% |
| Engineering | 0 | 0.0% |
| Multidisciplinary Studies | 0 | 0.0% |
| Science & Technology | 40 | 40.4% |
| Business | 10 | 10.1% |
| Education | 0 | 0.0% |
| Literature & Languages | 0 | 0.0% |
| Liberal Arts & History | 9 | 9.1% |
| Visual & Performing Arts | 9 | 9.1% |
| Communications | 0 | 0.0% |
| Arts & Humanities | 0 | 0.0% |
| Total | 99 | 100.0% |
Transportation & Commute in Mountain Gate
Vehicle Availability by Sex in Mountain Gate
The most prevalent vehicle ownership categories in Mountain Gate are males with 2 vehicles (133, accounting for 66.5%) and females with 2 vehicles (20, making up 359.5%).
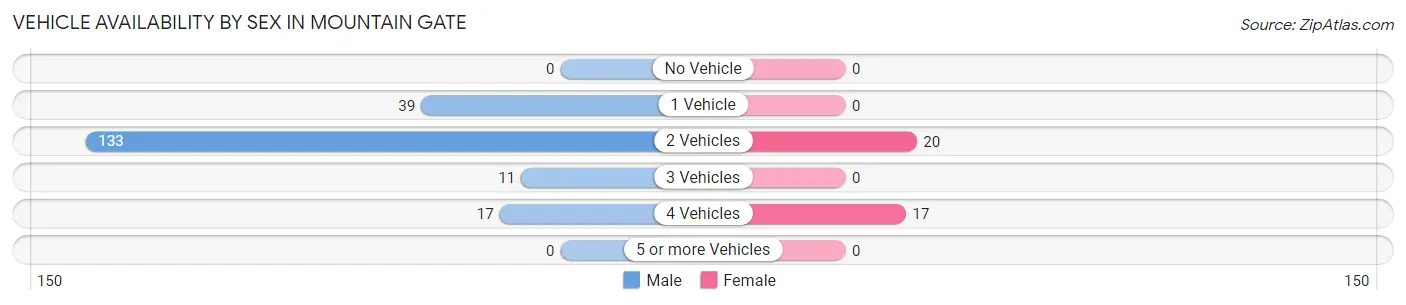
| Vehicles Available | Male | Female |
| No Vehicle | 0 (0.0%) | 0 (0.0%) |
| 1 Vehicle | 39 (19.5%) | 0 (0.0%) |
| 2 Vehicles | 133 (66.5%) | 20 (54.0%) |
| 3 Vehicles | 11 (5.5%) | 0 (0.0%) |
| 4 Vehicles | 17 (8.5%) | 17 (46.0%) |
| 5 or more Vehicles | 0 (0.0%) | 0 (0.0%) |
| Total | 200 (100.0%) | 37 (100.0%) |
Commute Time in Mountain Gate
The most frequently occuring commute durations in Mountain Gate are 15 to 19 minutes (120 commuters, 53.3%), 20 to 24 minutes (69 commuters, 30.7%), and 5 to 9 minutes (11 commuters, 4.9%).
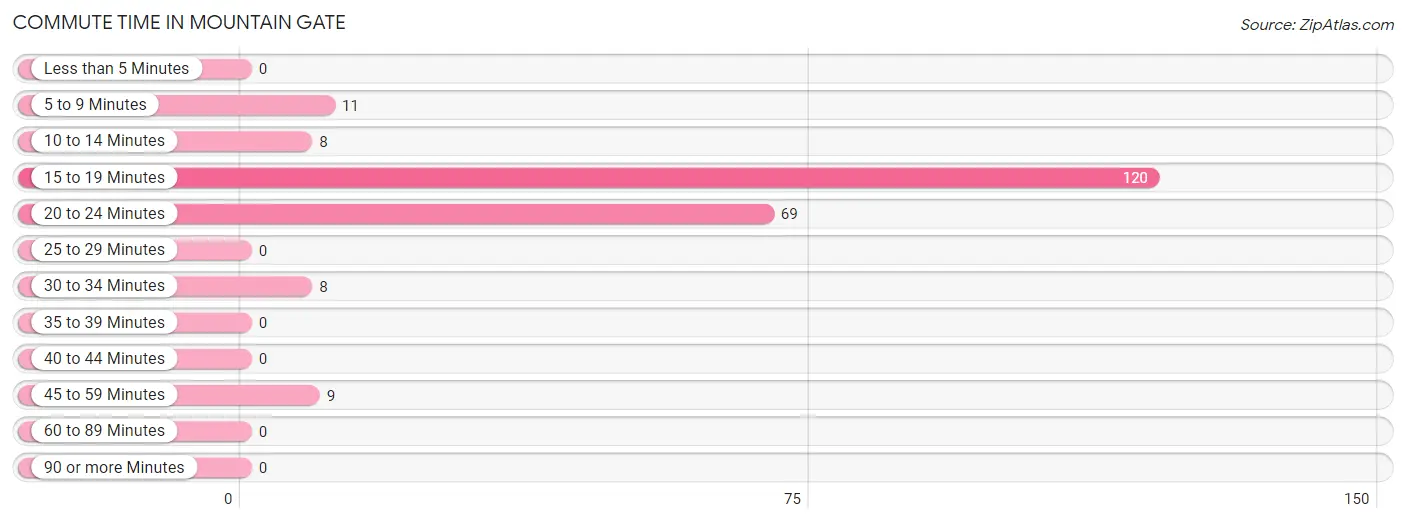
| Commute Time | # Commuters | % Commuters |
| Less than 5 Minutes | 0 | 0.0% |
| 5 to 9 Minutes | 11 | 4.9% |
| 10 to 14 Minutes | 8 | 3.6% |
| 15 to 19 Minutes | 120 | 53.3% |
| 20 to 24 Minutes | 69 | 30.7% |
| 25 to 29 Minutes | 0 | 0.0% |
| 30 to 34 Minutes | 8 | 3.6% |
| 35 to 39 Minutes | 0 | 0.0% |
| 40 to 44 Minutes | 0 | 0.0% |
| 45 to 59 Minutes | 9 | 4.0% |
| 60 to 89 Minutes | 0 | 0.0% |
| 90 or more Minutes | 0 | 0.0% |
Commute Time by Sex in Mountain Gate
The most common commute times in Mountain Gate are 15 to 19 minutes (103 commuters, 54.8%) for males and 15 to 19 minutes (17 commuters, 46.0%) for females.
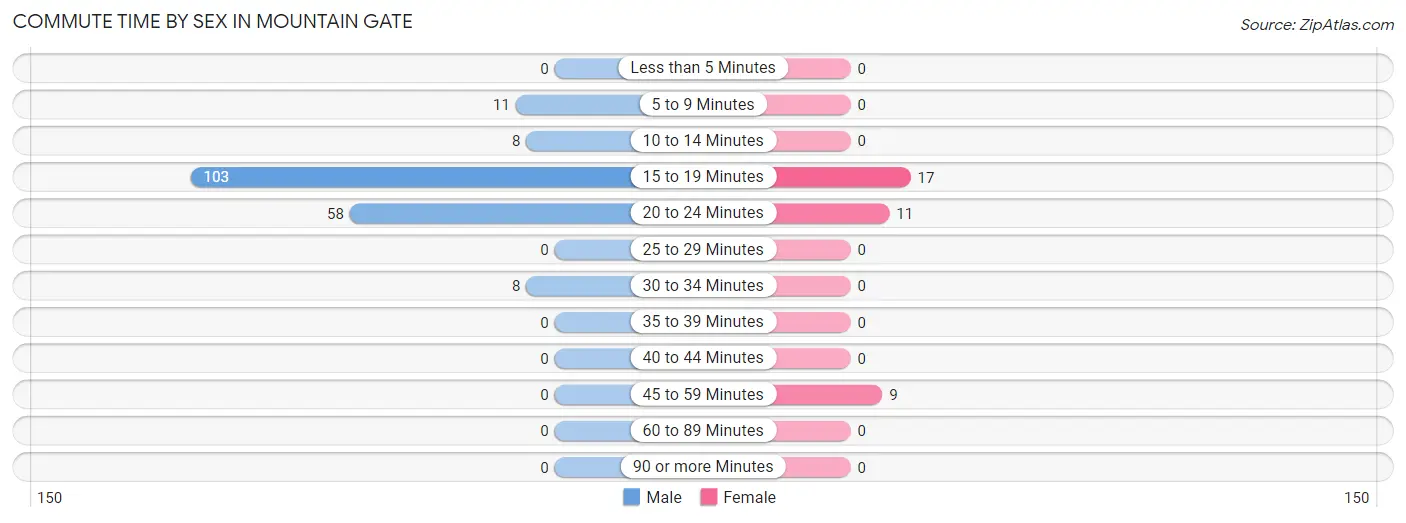
| Commute Time | Male | Female |
| Less than 5 Minutes | 0 (0.0%) | 0 (0.0%) |
| 5 to 9 Minutes | 11 (5.9%) | 0 (0.0%) |
| 10 to 14 Minutes | 8 (4.3%) | 0 (0.0%) |
| 15 to 19 Minutes | 103 (54.8%) | 17 (46.0%) |
| 20 to 24 Minutes | 58 (30.8%) | 11 (29.7%) |
| 25 to 29 Minutes | 0 (0.0%) | 0 (0.0%) |
| 30 to 34 Minutes | 8 (4.3%) | 0 (0.0%) |
| 35 to 39 Minutes | 0 (0.0%) | 0 (0.0%) |
| 40 to 44 Minutes | 0 (0.0%) | 0 (0.0%) |
| 45 to 59 Minutes | 0 (0.0%) | 9 (24.3%) |
| 60 to 89 Minutes | 0 (0.0%) | 0 (0.0%) |
| 90 or more Minutes | 0 (0.0%) | 0 (0.0%) |
Time of Departure to Work by Sex in Mountain Gate
The most frequent times of departure to work in Mountain Gate are 10:00 AM to 10:59 AM (65, 34.6%) for males and 12:00 AM to 4:59 AM (11, 29.7%) for females.
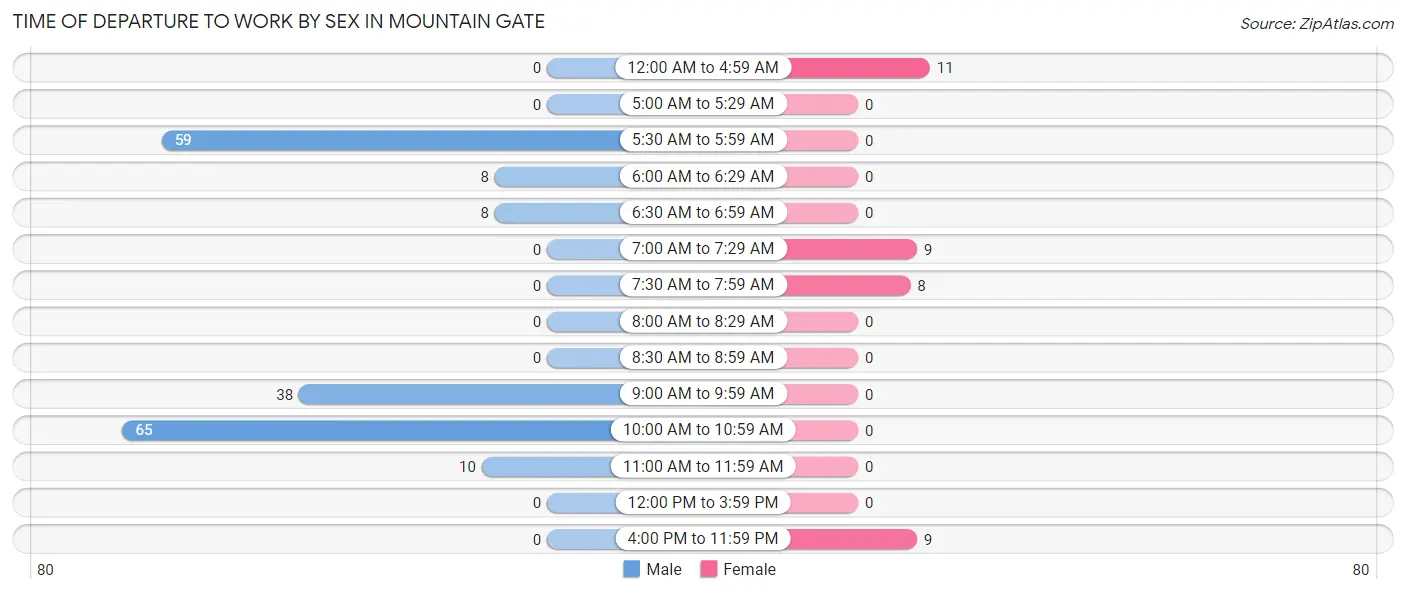
| Time of Departure | Male | Female |
| 12:00 AM to 4:59 AM | 0 (0.0%) | 11 (29.7%) |
| 5:00 AM to 5:29 AM | 0 (0.0%) | 0 (0.0%) |
| 5:30 AM to 5:59 AM | 59 (31.4%) | 0 (0.0%) |
| 6:00 AM to 6:29 AM | 8 (4.3%) | 0 (0.0%) |
| 6:30 AM to 6:59 AM | 8 (4.3%) | 0 (0.0%) |
| 7:00 AM to 7:29 AM | 0 (0.0%) | 9 (24.3%) |
| 7:30 AM to 7:59 AM | 0 (0.0%) | 8 (21.6%) |
| 8:00 AM to 8:29 AM | 0 (0.0%) | 0 (0.0%) |
| 8:30 AM to 8:59 AM | 0 (0.0%) | 0 (0.0%) |
| 9:00 AM to 9:59 AM | 38 (20.2%) | 0 (0.0%) |
| 10:00 AM to 10:59 AM | 65 (34.6%) | 0 (0.0%) |
| 11:00 AM to 11:59 AM | 10 (5.3%) | 0 (0.0%) |
| 12:00 PM to 3:59 PM | 0 (0.0%) | 0 (0.0%) |
| 4:00 PM to 11:59 PM | 0 (0.0%) | 9 (24.3%) |
| Total | 188 (100.0%) | 37 (100.0%) |
Housing Occupancy in Mountain Gate
Occupancy by Ownership in Mountain Gate
Of the total 421 dwellings in Mountain Gate, owner-occupied units account for 344 (81.7%), while renter-occupied units make up 77 (18.3%).
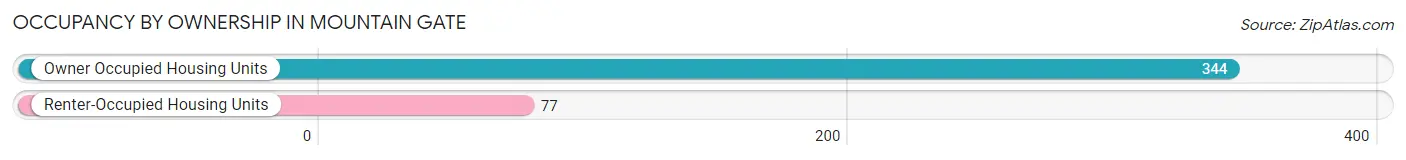
| Occupancy | # Housing Units | % Housing Units |
| Owner Occupied Housing Units | 344 | 81.7% |
| Renter-Occupied Housing Units | 77 | 18.3% |
| Total Occupied Housing Units | 421 | 100.0% |
Occupancy by Household Size in Mountain Gate
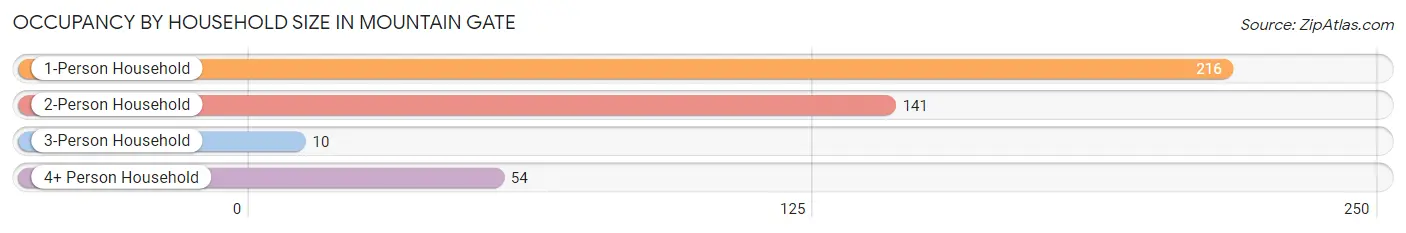
| Household Size | # Housing Units | % Housing Units |
| 1-Person Household | 216 | 51.3% |
| 2-Person Household | 141 | 33.5% |
| 3-Person Household | 10 | 2.4% |
| 4+ Person Household | 54 | 12.8% |
| Total Housing Units | 421 | 100.0% |
Occupancy by Ownership by Household Size in Mountain Gate
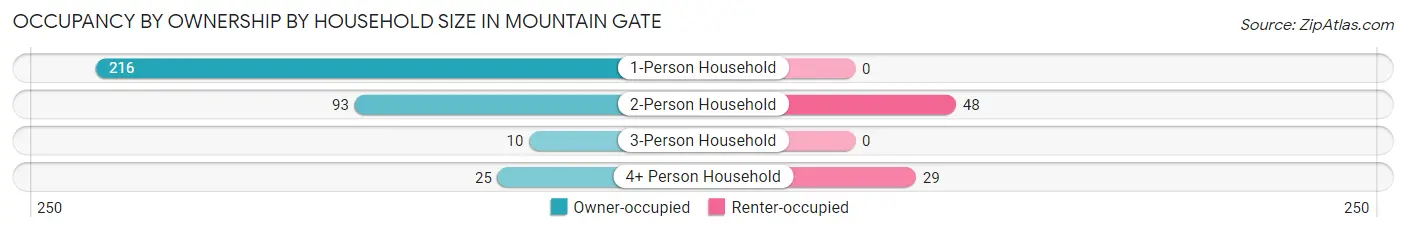
| Household Size | Owner-occupied | Renter-occupied |
| 1-Person Household | 216 (100.0%) | 0 (0.0%) |
| 2-Person Household | 93 (66.0%) | 48 (34.0%) |
| 3-Person Household | 10 (100.0%) | 0 (0.0%) |
| 4+ Person Household | 25 (46.3%) | 29 (53.7%) |
| Total Housing Units | 344 (81.7%) | 77 (18.3%) |
Occupancy by Educational Attainment in Mountain Gate
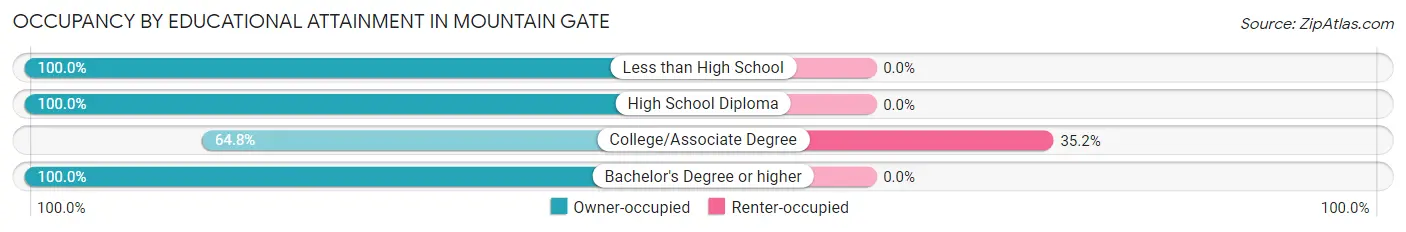
| Household Size | Owner-occupied | Renter-occupied |
| Less than High School | 32 (100.0%) | 0 (0.0%) |
| High School Diploma | 139 (100.0%) | 0 (0.0%) |
| College/Associate Degree | 142 (64.8%) | 77 (35.2%) |
| Bachelor's Degree or higher | 31 (100.0%) | 0 (0.0%) |
Occupancy by Age of Householder in Mountain Gate
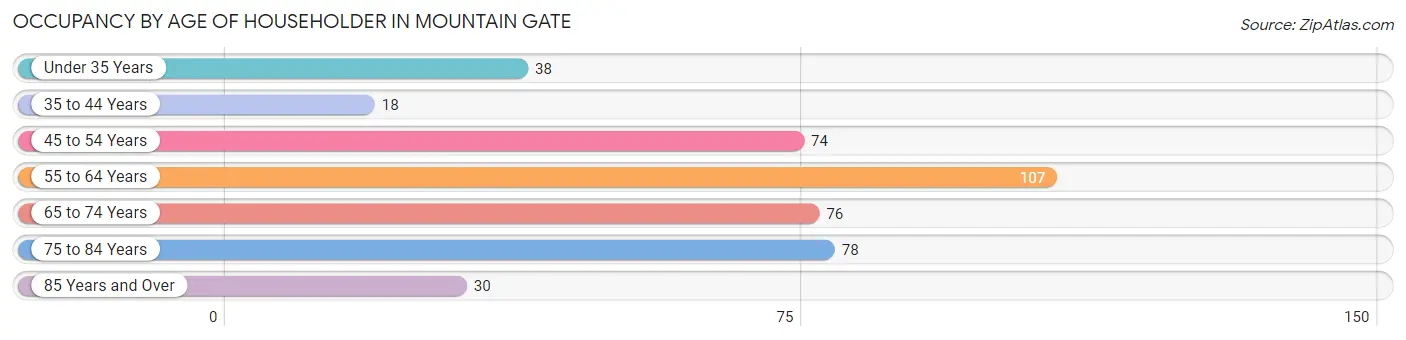
| Age Bracket | # Households | % Households |
| Under 35 Years | 38 | 9.0% |
| 35 to 44 Years | 18 | 4.3% |
| 45 to 54 Years | 74 | 17.6% |
| 55 to 64 Years | 107 | 25.4% |
| 65 to 74 Years | 76 | 18.0% |
| 75 to 84 Years | 78 | 18.5% |
| 85 Years and Over | 30 | 7.1% |
| Total | 421 | 100.0% |
Housing Finances in Mountain Gate
Median Income by Occupancy in Mountain Gate
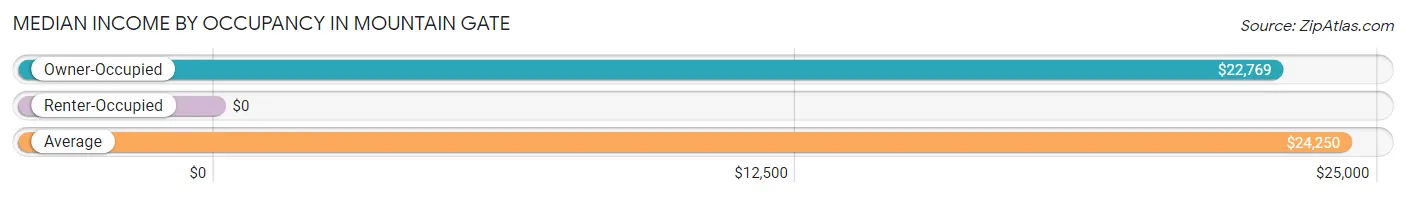
| Occupancy Type | # Households | Median Income |
| Owner-Occupied | 344 (81.7%) | $22,769 |
| Renter-Occupied | 77 (18.3%) | $0 |
| Average | 421 (100.0%) | $24,250 |
Occupancy by Householder Income Bracket in Mountain Gate
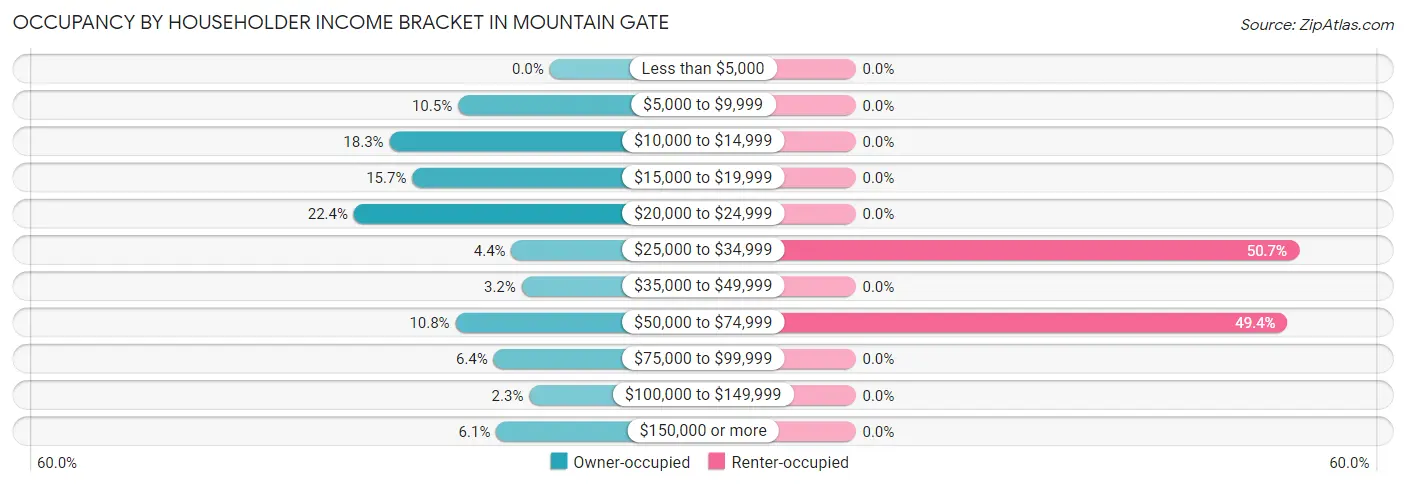
| Income Bracket | Owner-occupied | Renter-occupied |
| Less than $5,000 | 0 (0.0%) | 0 (0.0%) |
| $5,000 to $9,999 | 36 (10.5%) | 0 (0.0%) |
| $10,000 to $14,999 | 63 (18.3%) | 0 (0.0%) |
| $15,000 to $19,999 | 54 (15.7%) | 0 (0.0%) |
| $20,000 to $24,999 | 77 (22.4%) | 0 (0.0%) |
| $25,000 to $34,999 | 15 (4.4%) | 39 (50.6%) |
| $35,000 to $49,999 | 11 (3.2%) | 0 (0.0%) |
| $50,000 to $74,999 | 37 (10.8%) | 38 (49.3%) |
| $75,000 to $99,999 | 22 (6.4%) | 0 (0.0%) |
| $100,000 to $149,999 | 8 (2.3%) | 0 (0.0%) |
| $150,000 or more | 21 (6.1%) | 0 (0.0%) |
| Total | 344 (100.0%) | 77 (100.0%) |
Monthly Housing Cost Tiers in Mountain Gate
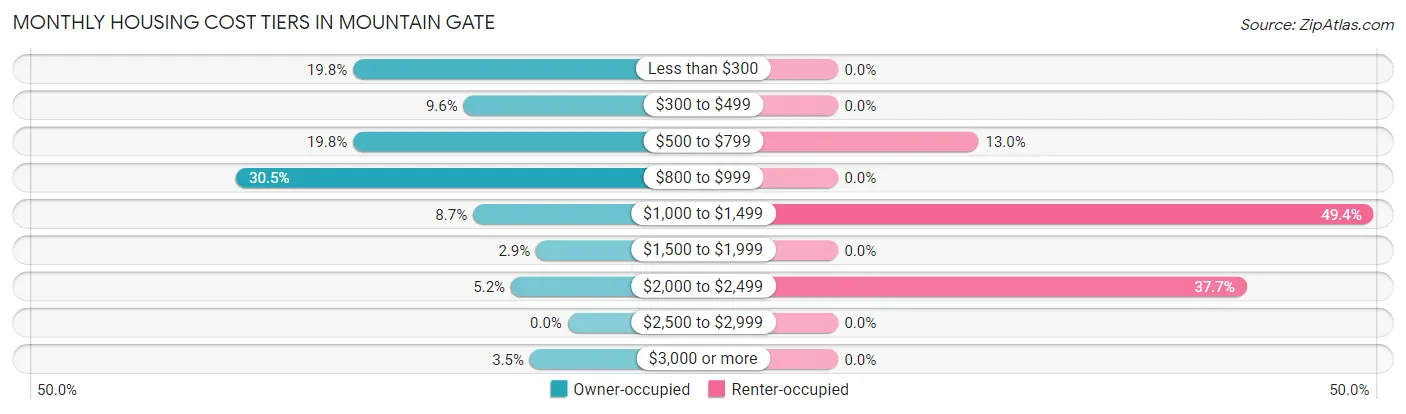
| Monthly Cost | Owner-occupied | Renter-occupied |
| Less than $300 | 68 (19.8%) | 0 (0.0%) |
| $300 to $499 | 33 (9.6%) | 0 (0.0%) |
| $500 to $799 | 68 (19.8%) | 10 (13.0%) |
| $800 to $999 | 105 (30.5%) | 0 (0.0%) |
| $1,000 to $1,499 | 30 (8.7%) | 38 (49.3%) |
| $1,500 to $1,999 | 10 (2.9%) | 0 (0.0%) |
| $2,000 to $2,499 | 18 (5.2%) | 29 (37.7%) |
| $2,500 to $2,999 | 0 (0.0%) | 0 (0.0%) |
| $3,000 or more | 12 (3.5%) | 0 (0.0%) |
| Total | 344 (100.0%) | 77 (100.0%) |
Physical Housing Characteristics in Mountain Gate
Housing Structures in Mountain Gate
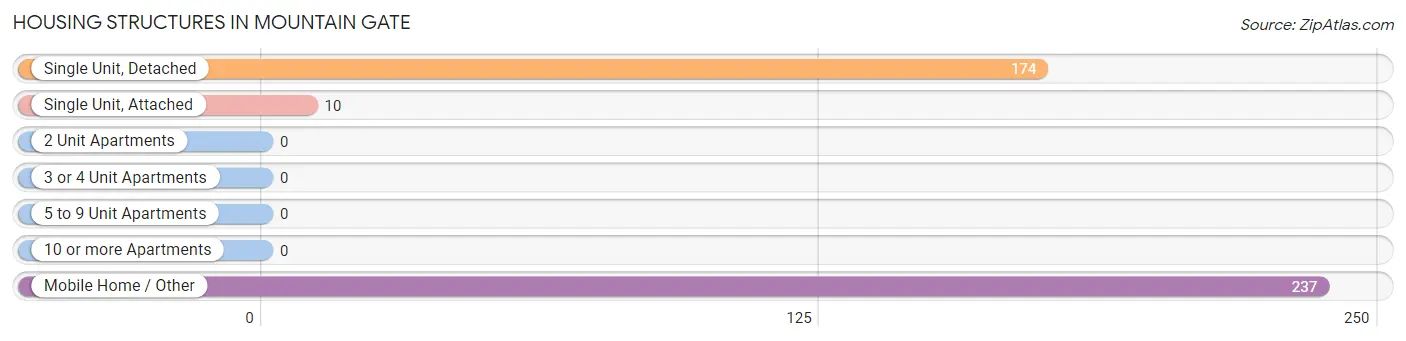
| Structure Type | # Housing Units | % Housing Units |
| Single Unit, Detached | 174 | 41.3% |
| Single Unit, Attached | 10 | 2.4% |
| 2 Unit Apartments | 0 | 0.0% |
| 3 or 4 Unit Apartments | 0 | 0.0% |
| 5 to 9 Unit Apartments | 0 | 0.0% |
| 10 or more Apartments | 0 | 0.0% |
| Mobile Home / Other | 237 | 56.3% |
| Total | 421 | 100.0% |
Housing Structures by Occupancy in Mountain Gate
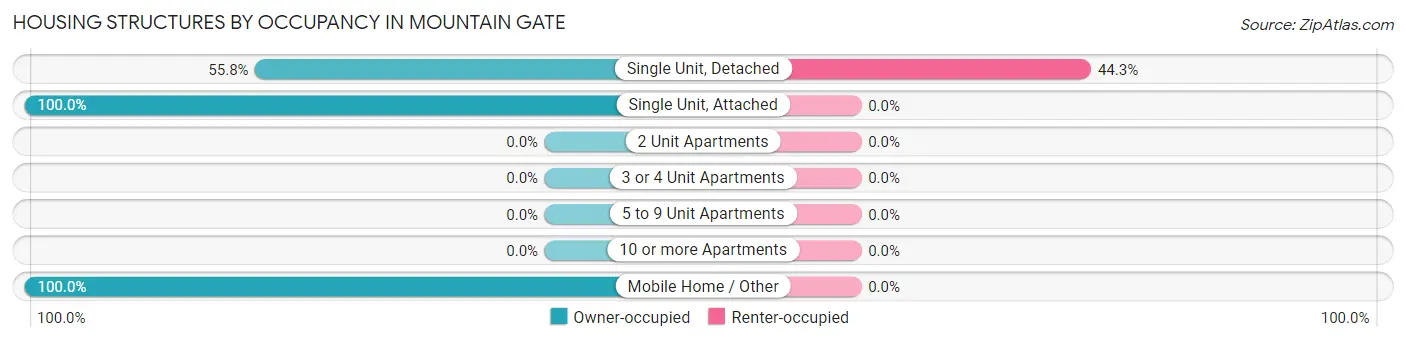
| Structure Type | Owner-occupied | Renter-occupied |
| Single Unit, Detached | 97 (55.7%) | 77 (44.3%) |
| Single Unit, Attached | 10 (100.0%) | 0 (0.0%) |
| 2 Unit Apartments | 0 (0.0%) | 0 (0.0%) |
| 3 or 4 Unit Apartments | 0 (0.0%) | 0 (0.0%) |
| 5 to 9 Unit Apartments | 0 (0.0%) | 0 (0.0%) |
| 10 or more Apartments | 0 (0.0%) | 0 (0.0%) |
| Mobile Home / Other | 237 (100.0%) | 0 (0.0%) |
| Total | 344 (81.7%) | 77 (18.3%) |
Housing Structures by Number of Rooms in Mountain Gate
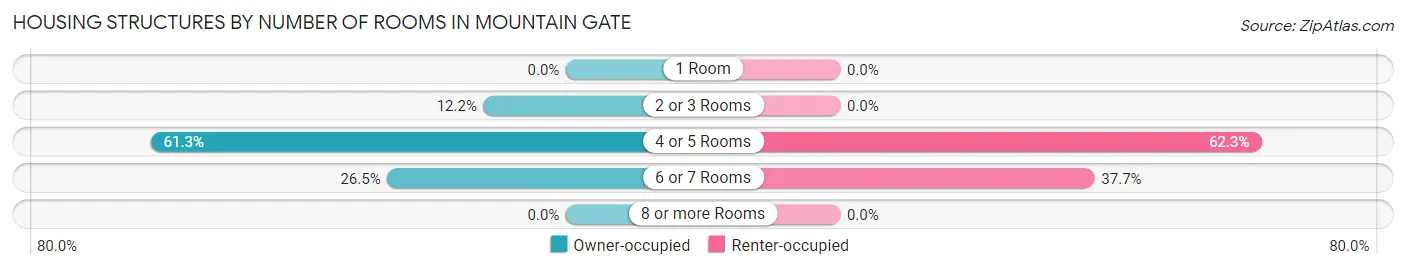
| Number of Rooms | Owner-occupied | Renter-occupied |
| 1 Room | 0 (0.0%) | 0 (0.0%) |
| 2 or 3 Rooms | 42 (12.2%) | 0 (0.0%) |
| 4 or 5 Rooms | 211 (61.3%) | 48 (62.3%) |
| 6 or 7 Rooms | 91 (26.5%) | 29 (37.7%) |
| 8 or more Rooms | 0 (0.0%) | 0 (0.0%) |
| Total | 344 (100.0%) | 77 (100.0%) |
Housing Structure by Heating Type in Mountain Gate
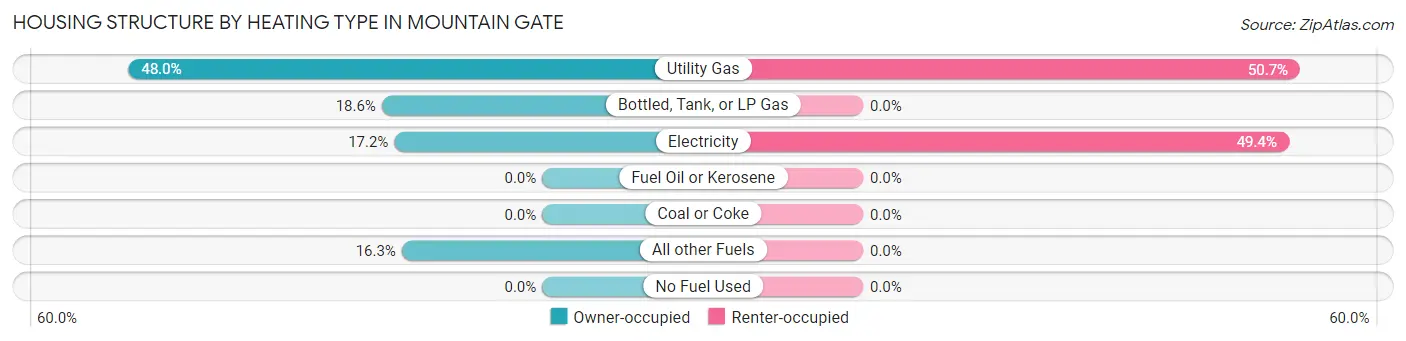
| Heating Type | Owner-occupied | Renter-occupied |
| Utility Gas | 165 (48.0%) | 39 (50.6%) |
| Bottled, Tank, or LP Gas | 64 (18.6%) | 0 (0.0%) |
| Electricity | 59 (17.2%) | 38 (49.3%) |
| Fuel Oil or Kerosene | 0 (0.0%) | 0 (0.0%) |
| Coal or Coke | 0 (0.0%) | 0 (0.0%) |
| All other Fuels | 56 (16.3%) | 0 (0.0%) |
| No Fuel Used | 0 (0.0%) | 0 (0.0%) |
| Total | 344 (100.0%) | 77 (100.0%) |
Household Vehicle Usage in Mountain Gate
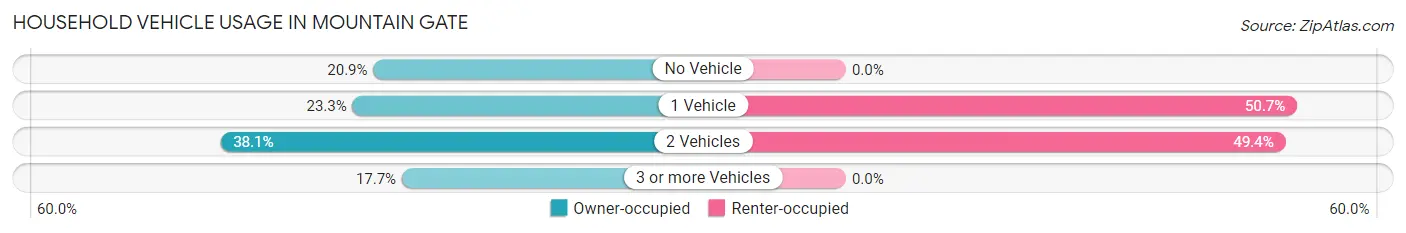
| Vehicles per Household | Owner-occupied | Renter-occupied |
| No Vehicle | 72 (20.9%) | 0 (0.0%) |
| 1 Vehicle | 80 (23.3%) | 39 (50.6%) |
| 2 Vehicles | 131 (38.1%) | 38 (49.3%) |
| 3 or more Vehicles | 61 (17.7%) | 0 (0.0%) |
| Total | 344 (100.0%) | 77 (100.0%) |
Real Estate & Mortgages in Mountain Gate
Real Estate and Mortgage Overview in Mountain Gate
| Characteristic | Without Mortgage | With Mortgage |
| Housing Units | 253 | 91 |
| Median Property Value | $126,700 | $264,800 |
| Median Household Income | $19,750 | $21 |
| Monthly Housing Costs | $691 | $12 |
| Real Estate Taxes | $534 | $0 |
Property Value by Mortgage Status in Mountain Gate
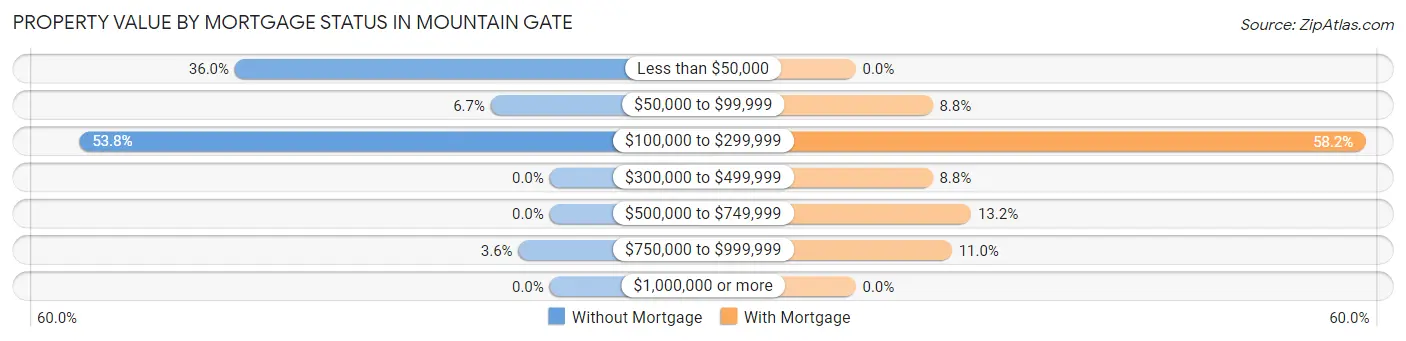
| Property Value | Without Mortgage | With Mortgage |
| Less than $50,000 | 91 (36.0%) | 0 (0.0%) |
| $50,000 to $99,999 | 17 (6.7%) | 8 (8.8%) |
| $100,000 to $299,999 | 136 (53.7%) | 53 (58.2%) |
| $300,000 to $499,999 | 0 (0.0%) | 8 (8.8%) |
| $500,000 to $749,999 | 0 (0.0%) | 12 (13.2%) |
| $750,000 to $999,999 | 9 (3.6%) | 10 (11.0%) |
| $1,000,000 or more | 0 (0.0%) | 0 (0.0%) |
| Total | 253 (100.0%) | 91 (100.0%) |
Household Income by Mortgage Status in Mountain Gate
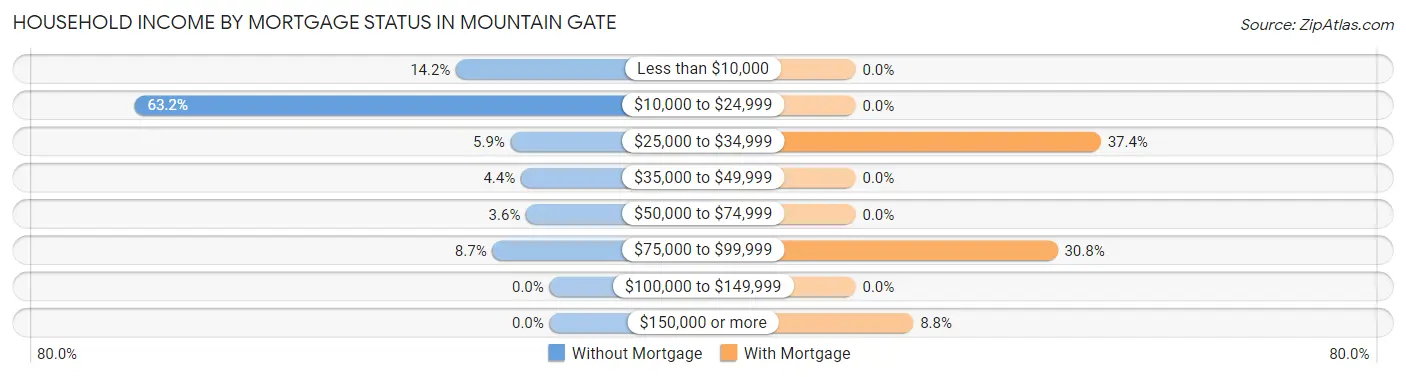
| Household Income | Without Mortgage | With Mortgage |
| Less than $10,000 | 36 (14.2%) | 0 (0.0%) |
| $10,000 to $24,999 | 160 (63.2%) | 0 (0.0%) |
| $25,000 to $34,999 | 15 (5.9%) | 34 (37.4%) |
| $35,000 to $49,999 | 11 (4.3%) | 0 (0.0%) |
| $50,000 to $74,999 | 9 (3.6%) | 0 (0.0%) |
| $75,000 to $99,999 | 22 (8.7%) | 28 (30.8%) |
| $100,000 to $149,999 | 0 (0.0%) | 0 (0.0%) |
| $150,000 or more | 0 (0.0%) | 8 (8.8%) |
| Total | 253 (100.0%) | 91 (100.0%) |
Property Value to Household Income Ratio in Mountain Gate
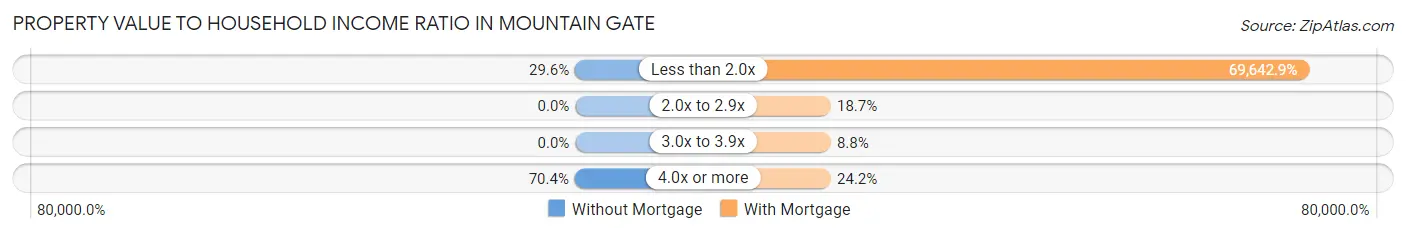
| Value-to-Income Ratio | Without Mortgage | With Mortgage |
| Less than 2.0x | 75 (29.6%) | 63,375 (69,642.9%) |
| 2.0x to 2.9x | 0 (0.0%) | 17 (18.7%) |
| 3.0x to 3.9x | 0 (0.0%) | 8 (8.8%) |
| 4.0x or more | 178 (70.4%) | 22 (24.2%) |
| Total | 253 (100.0%) | 91 (100.0%) |
Real Estate Taxes by Mortgage Status in Mountain Gate
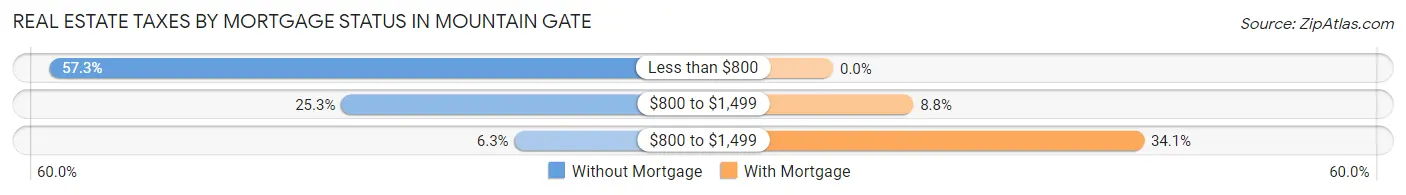
| Property Taxes | Without Mortgage | With Mortgage |
| Less than $800 | 145 (57.3%) | 0 (0.0%) |
| $800 to $1,499 | 64 (25.3%) | 8 (8.8%) |
| $800 to $1,499 | 16 (6.3%) | 31 (34.1%) |
| Total | 253 (100.0%) | 91 (100.0%) |
Health & Disability in Mountain Gate
Health Insurance Coverage by Age in Mountain Gate
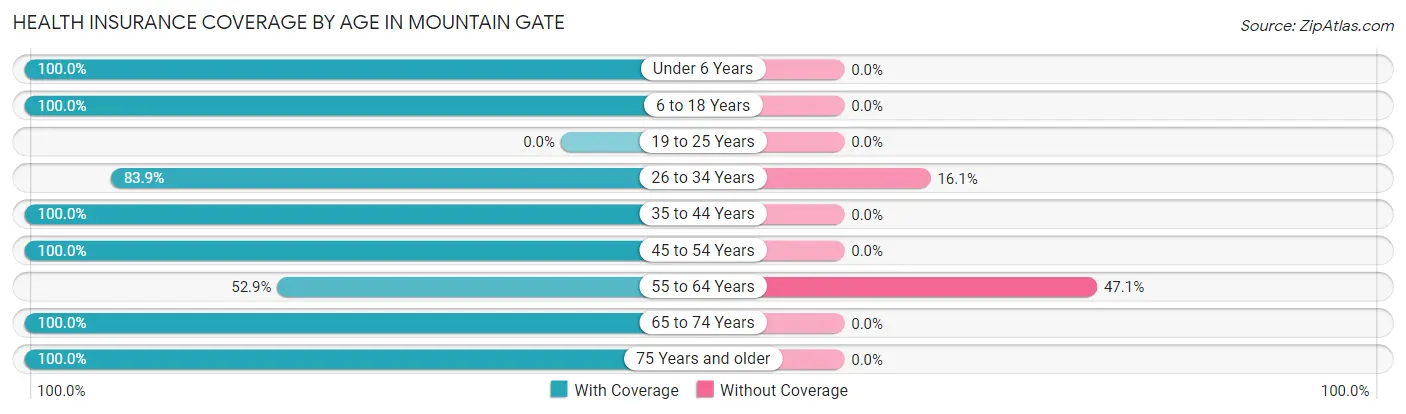
| Age Bracket | With Coverage | Without Coverage |
| Under 6 Years | 57 (100.0%) | 0 (0.0%) |
| 6 to 18 Years | 107 (100.0%) | 0 (0.0%) |
| 19 to 25 Years | 0 (0.0%) | 0 (0.0%) |
| 26 to 34 Years | 47 (83.9%) | 9 (16.1%) |
| 35 to 44 Years | 57 (100.0%) | 0 (0.0%) |
| 45 to 54 Years | 91 (100.0%) | 0 (0.0%) |
| 55 to 64 Years | 101 (52.9%) | 90 (47.1%) |
| 65 to 74 Years | 136 (100.0%) | 0 (0.0%) |
| 75 Years and older | 124 (100.0%) | 0 (0.0%) |
| Total | 720 (87.9%) | 99 (12.1%) |
Health Insurance Coverage by Citizenship Status in Mountain Gate
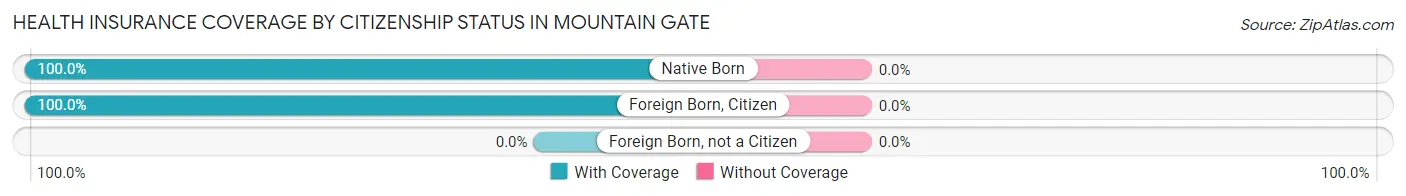
| Citizenship Status | With Coverage | Without Coverage |
| Native Born | 57 (100.0%) | 0 (0.0%) |
| Foreign Born, Citizen | 107 (100.0%) | 0 (0.0%) |
| Foreign Born, not a Citizen | 0 (0.0%) | 0 (0.0%) |
Health Insurance Coverage by Household Income in Mountain Gate
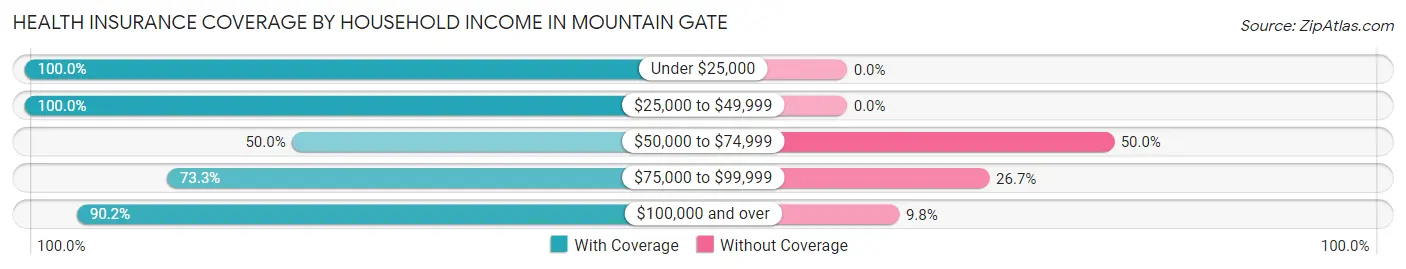
| Household Income | With Coverage | Without Coverage |
| Under $25,000 | 312 (100.0%) | 0 (0.0%) |
| $25,000 to $49,999 | 214 (100.0%) | 0 (0.0%) |
| $50,000 to $74,999 | 78 (50.0%) | 78 (50.0%) |
| $75,000 to $99,999 | 33 (73.3%) | 12 (26.7%) |
| $100,000 and over | 83 (90.2%) | 9 (9.8%) |
Public vs Private Health Insurance Coverage by Age in Mountain Gate
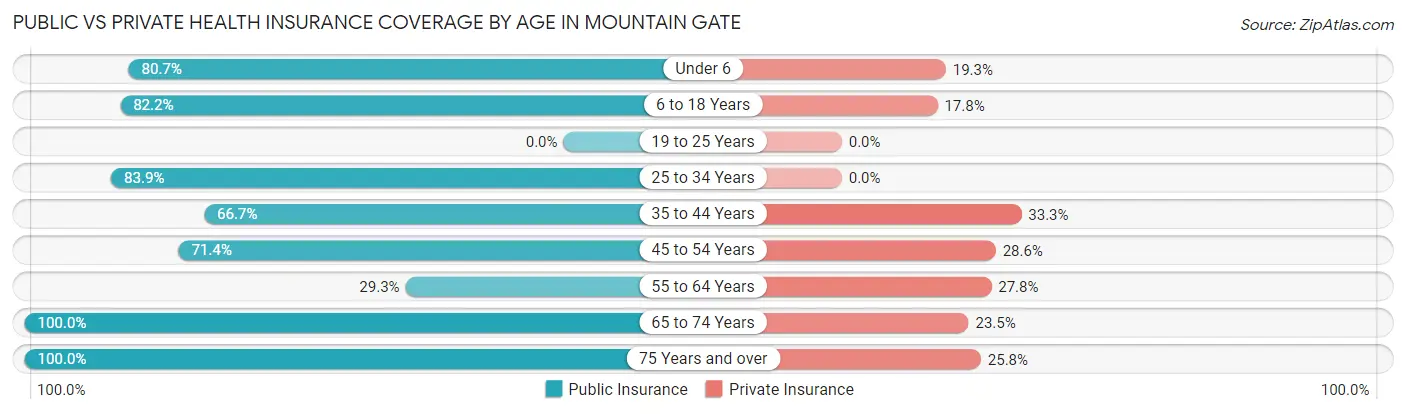
| Age Bracket | Public Insurance | Private Insurance |
| Under 6 | 46 (80.7%) | 11 (19.3%) |
| 6 to 18 Years | 88 (82.2%) | 19 (17.8%) |
| 19 to 25 Years | 0 (0.0%) | 0 (0.0%) |
| 25 to 34 Years | 47 (83.9%) | 0 (0.0%) |
| 35 to 44 Years | 38 (66.7%) | 19 (33.3%) |
| 45 to 54 Years | 65 (71.4%) | 26 (28.6%) |
| 55 to 64 Years | 56 (29.3%) | 53 (27.8%) |
| 65 to 74 Years | 136 (100.0%) | 32 (23.5%) |
| 75 Years and over | 124 (100.0%) | 32 (25.8%) |
| Total | 600 (73.3%) | 192 (23.4%) |
Disability Status by Sex by Age in Mountain Gate
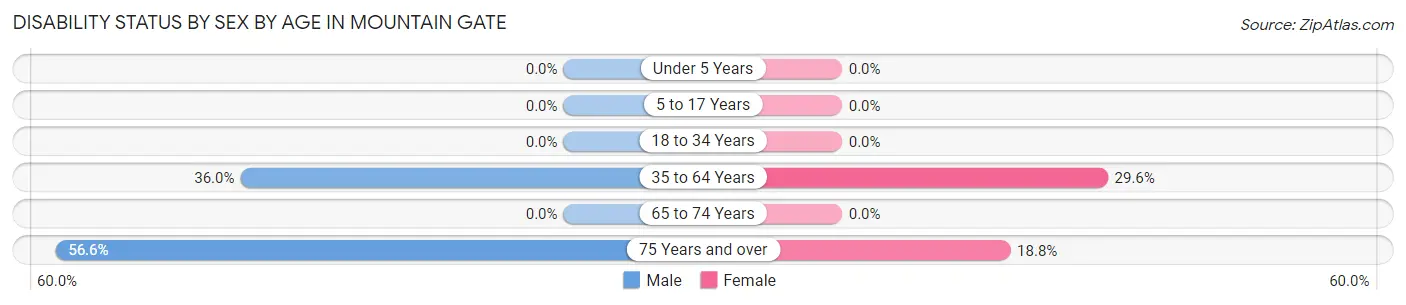
| Age Bracket | Male | Female |
| Under 5 Years | 0 (0.0%) | 0 (0.0%) |
| 5 to 17 Years | 0 (0.0%) | 0 (0.0%) |
| 18 to 34 Years | 0 (0.0%) | 0 (0.0%) |
| 35 to 64 Years | 77 (36.0%) | 37 (29.6%) |
| 65 to 74 Years | 0 (0.0%) | 0 (0.0%) |
| 75 Years and over | 43 (56.6%) | 9 (18.8%) |
Disability Class by Sex by Age in Mountain Gate
Disability Class: Hearing Difficulty
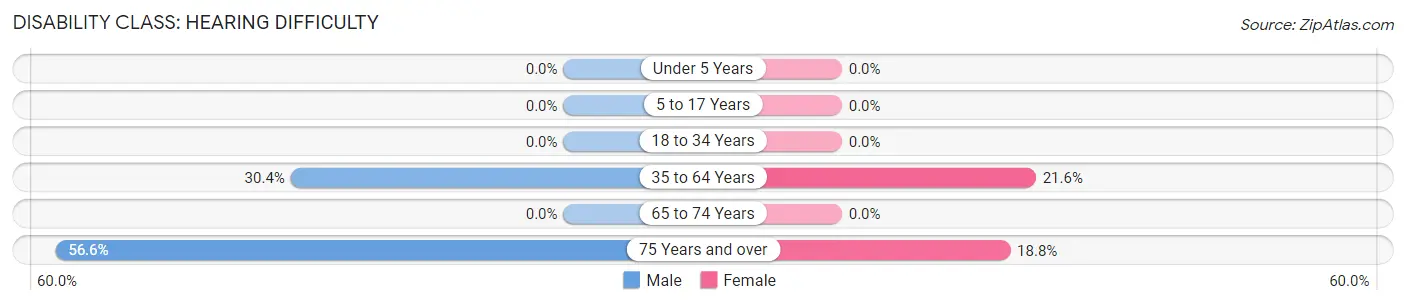
| Age Bracket | Male | Female |
| Under 5 Years | 0 (0.0%) | 0 (0.0%) |
| 5 to 17 Years | 0 (0.0%) | 0 (0.0%) |
| 18 to 34 Years | 0 (0.0%) | 0 (0.0%) |
| 35 to 64 Years | 65 (30.4%) | 27 (21.6%) |
| 65 to 74 Years | 0 (0.0%) | 0 (0.0%) |
| 75 Years and over | 43 (56.6%) | 9 (18.8%) |
Disability Class: Vision Difficulty
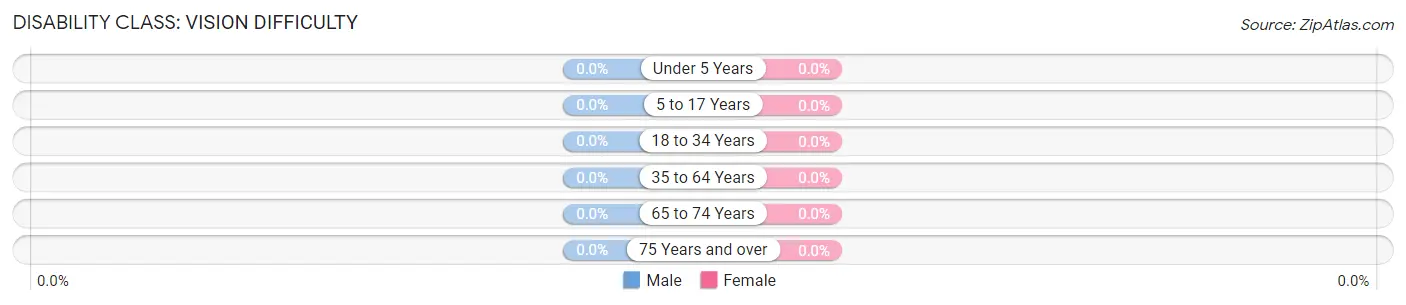
| Age Bracket | Male | Female |
| Under 5 Years | 0 (0.0%) | 0 (0.0%) |
| 5 to 17 Years | 0 (0.0%) | 0 (0.0%) |
| 18 to 34 Years | 0 (0.0%) | 0 (0.0%) |
| 35 to 64 Years | 0 (0.0%) | 0 (0.0%) |
| 65 to 74 Years | 0 (0.0%) | 0 (0.0%) |
| 75 Years and over | 0 (0.0%) | 0 (0.0%) |
Disability Class: Cognitive Difficulty
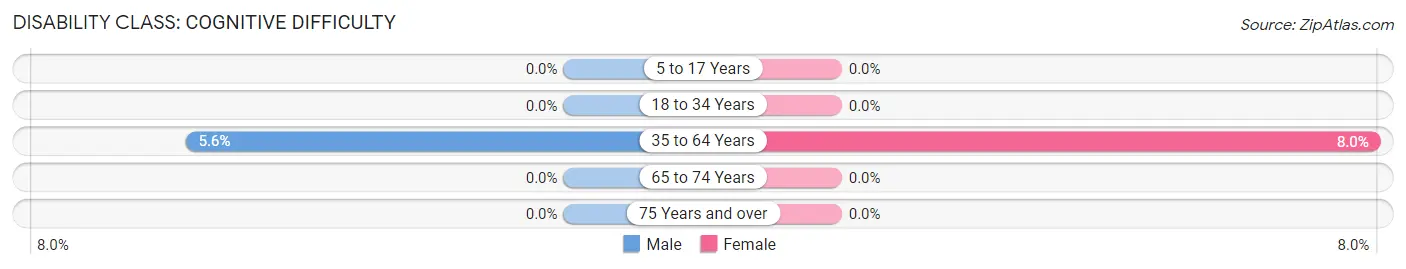
| Age Bracket | Male | Female |
| 5 to 17 Years | 0 (0.0%) | 0 (0.0%) |
| 18 to 34 Years | 0 (0.0%) | 0 (0.0%) |
| 35 to 64 Years | 12 (5.6%) | 10 (8.0%) |
| 65 to 74 Years | 0 (0.0%) | 0 (0.0%) |
| 75 Years and over | 0 (0.0%) | 0 (0.0%) |
Disability Class: Ambulatory Difficulty
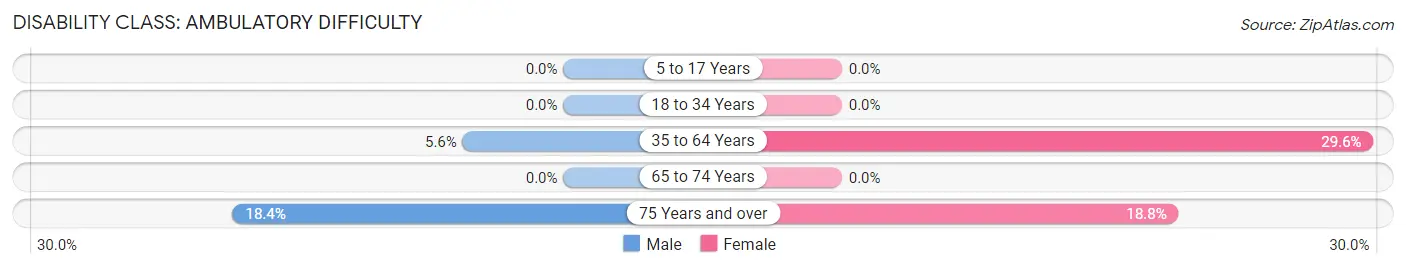
| Age Bracket | Male | Female |
| 5 to 17 Years | 0 (0.0%) | 0 (0.0%) |
| 18 to 34 Years | 0 (0.0%) | 0 (0.0%) |
| 35 to 64 Years | 12 (5.6%) | 37 (29.6%) |
| 65 to 74 Years | 0 (0.0%) | 0 (0.0%) |
| 75 Years and over | 14 (18.4%) | 9 (18.8%) |
Disability Class: Self-Care Difficulty
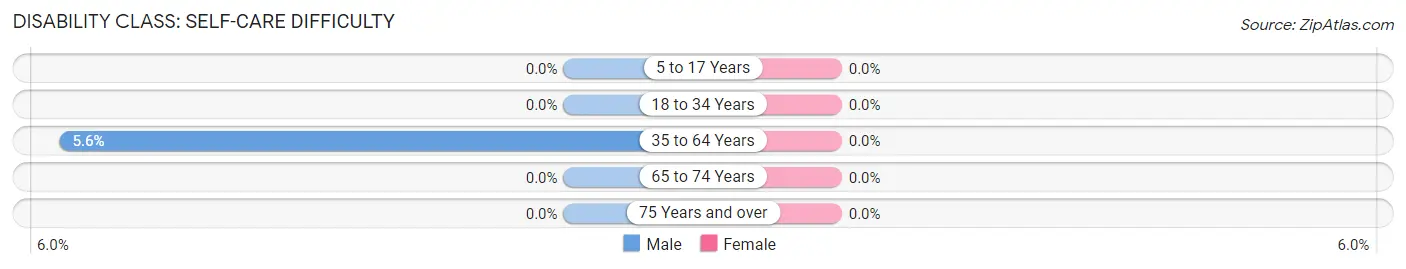
| Age Bracket | Male | Female |
| 5 to 17 Years | 0 (0.0%) | 0 (0.0%) |
| 18 to 34 Years | 0 (0.0%) | 0 (0.0%) |
| 35 to 64 Years | 12 (5.6%) | 0 (0.0%) |
| 65 to 74 Years | 0 (0.0%) | 0 (0.0%) |
| 75 Years and over | 0 (0.0%) | 0 (0.0%) |
Technology Access in Mountain Gate
Computing Device Access in Mountain Gate
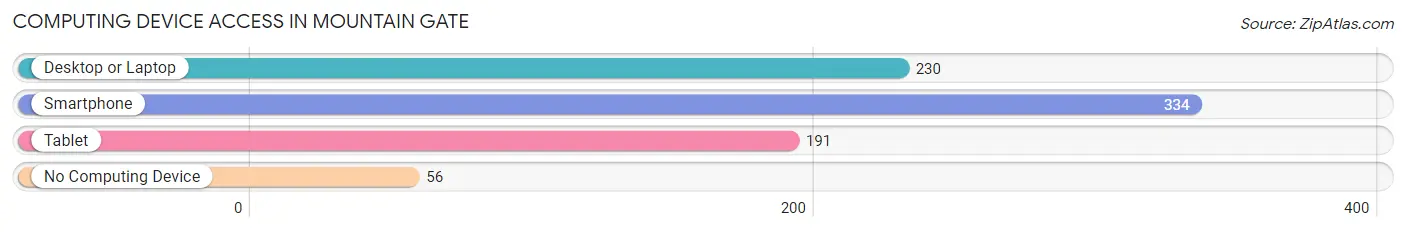
| Device Type | # Households | % Households |
| Desktop or Laptop | 230 | 54.6% |
| Smartphone | 334 | 79.3% |
| Tablet | 191 | 45.4% |
| No Computing Device | 56 | 13.3% |
| Total | 421 | 100.0% |
Internet Access in Mountain Gate
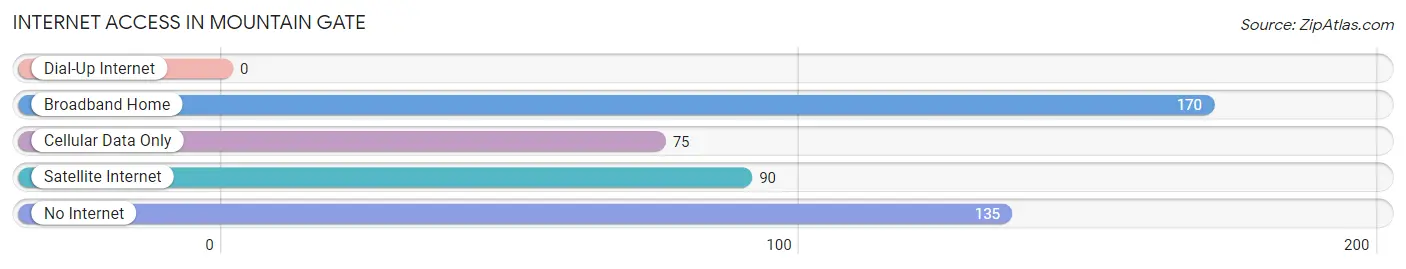
| Internet Type | # Households | % Households |
| Dial-Up Internet | 0 | 0.0% |
| Broadband Home | 170 | 40.4% |
| Cellular Data Only | 75 | 17.8% |
| Satellite Internet | 90 | 21.4% |
| No Internet | 135 | 32.1% |
| Total | 421 | 100.0% |
Mountain Gate Summary
Mountain Gate is an unincorporated community located in Shasta County, California. It is situated in the Cascade Range, approximately 8 miles east of Redding. The population of Mountain Gate was estimated to be 1,845 in 2019.
History
Mountain Gate was originally inhabited by the Wintu Native American tribe. The first settlers in the area were miners who arrived in the late 1800s. The town was officially established in 1891 and was named after the nearby mountain pass.
In the early 1900s, the town was a popular destination for tourists and outdoor enthusiasts. The area was known for its abundance of natural resources, including timber, gold, and copper.
In the 1950s, the town began to experience a population boom as people moved to the area to take advantage of the booming timber industry. The town was also home to a number of small businesses, including a sawmill, a general store, and a post office.
Geography
Mountain Gate is located in the Cascade Range, approximately 8 miles east of Redding. The town is situated at an elevation of 1,845 feet above sea level. The area is characterized by rolling hills, dense forests, and numerous creeks and streams.
The climate in Mountain Gate is mild and temperate. The average high temperature in the summer is around 85 degrees Fahrenheit, while the average low temperature in the winter is around 40 degrees Fahrenheit.
Economy
Mountain Gate’s economy is largely based on the timber industry. The town is home to several sawmills and lumber companies, as well as a number of small businesses.
The town is also home to a number of recreational activities, including camping, fishing, and hiking. The nearby Whiskeytown National Recreation Area is a popular destination for outdoor enthusiasts.
Demographics
As of 2019, the population of Mountain Gate was estimated to be 1,845. The town is predominantly white, with approximately 90% of the population identifying as Caucasian. The median household income in Mountain Gate is $50,000, and the median age is 44.
Conclusion
Mountain Gate is a small unincorporated community located in Shasta County, California. The town is situated in the Cascade Range, approximately 8 miles east of Redding. The population of Mountain Gate was estimated to be 1,845 in 2019. The town’s economy is largely based on the timber industry, and the area is also home to a number of recreational activities. The population of Mountain Gate is predominantly white, with a median household income of $50,000 and a median age of 44.
Common Questions
What is Per Capita Income in Mountain Gate?
Per Capita income in Mountain Gate is $21,692.
What is the Median Household income in Mountain Gate?
Median Household Income in Mountain Gate is $24,250.
What is Family Income Deficit in Mountain Gate?
Family Income Deficit in Mountain Gate is $5,814.
Families that are below poverty line in Mountain Gate earn $5,814 less on average than the poverty threshold level.
What is Inequality or Gini Index in Mountain Gate?
Inequality or Gini Index in Mountain Gate is 0.47.
What is the Total Population of Mountain Gate?
Total Population of Mountain Gate is 819.
What is the Total Male Population of Mountain Gate?
Total Male Population of Mountain Gate is 468.
What is the Total Female Population of Mountain Gate?
Total Female Population of Mountain Gate is 351.
What is the Ratio of Males per 100 Females in Mountain Gate?
There are 133.33 Males per 100 Females in Mountain Gate.
What is the Ratio of Females per 100 Males in Mountain Gate?
There are 75.00 Females per 100 Males in Mountain Gate.
What is the Median Population Age in Mountain Gate?
Median Population Age in Mountain Gate is 57.3 Years.
What is the Average Family Size in Mountain Gate
Average Family Size in Mountain Gate is 3.1 People.
What is the Average Household Size in Mountain Gate
Average Household Size in Mountain Gate is 1.9 People.
How Large is the Labor Force in Mountain Gate?
There are 246 People in the Labor Forcein in Mountain Gate.
What is the Percentage of People in the Labor Force in Mountain Gate?
37.0% of People are in the Labor Force in Mountain Gate.